ADVERTIMENT. Lʼaccés als continguts dʼaquesta tesi queda ... · AKNOWLEDGEMENTS En un moment...
210
ADVERTIMENT. Lʼaccés als continguts dʼaquesta tesi queda condicionat a lʼacceptació de les condicions dʼús establertes per la següent llicència Creative Commons: http://cat.creativecommons.org/?page_id=184 ADVERTENCIA. El acceso a los contenidos de esta tesis queda condicionado a la aceptación de las condiciones de uso establecidas por la siguiente licencia Creative Commons: http://es.creativecommons.org/blog/licencias/ WARNING. The access to the contents of this doctoral thesis it is limited to the acceptance of the use conditions set by the following Creative Commons license: https://creativecommons.org/licenses/?lang=en
Transcript of ADVERTIMENT. Lʼaccés als continguts dʼaquesta tesi queda ... · AKNOWLEDGEMENTS En un moment...
ADVERTIMENT. Lʼaccés als continguts dʼaquesta tesi queda condicionat a lʼacceptació de les condicions dʼúsestablertes per la següent llicència Creative Commons: http://cat.creativecommons.org/?page_id=184
ADVERTENCIA. El acceso a los contenidos de esta tesis queda condicionado a la aceptación de las condiciones de usoestablecidas por la siguiente licencia Creative Commons: http://es.creativecommons.org/blog/licencias/
WARNING. The access to the contents of this doctoral thesis it is limited to the acceptance of the use conditions setby the following Creative Commons license: https://creativecommons.org/licenses/?lang=en

Departament de Bioquímica i Biologia Molecular
Departament de Biologia Cel·lular, Fisiologia i Immunologia
NEW INSIGHTS INTO ALZHEIMER’S DISEASE:
Further characterization of the 3xTg-AD mouse model
and a pharmacological approach with scFv-h3D6
Gisela Esquerda Canals
2017

Departament de Bioquímica i Biologia Molecular
Departament de Biologia Cel·lular, Fisiologia i Immunologia
NEW INSIGHTS INTO ALZHEIMER’S DISEASE:
Further characterization of the 3xTg-AD mouse model
and a pharmacological approach with scFv-h3D6
Doctoral Thesis presented by Gisela Esquerda Canals for the of PhD Degree in
Biochemistry, Molecular Biology, and Biomedicine, supervised by Joaquim Martí, PhD and
Sandra Villegas, PhD
Gisela Esquerda Canals Joaquim Martí Clúa, PhD Sandra Villegas Hernández, PhD
November 2017


Todo hombre puede ser, si quiere,
escultor de su propio cerebro.
Ramón y Cajal


AKNOWLEDGEMENTS
En un moment complicat, tant de butxaca com de previsió de futur, vaig rebre un correu del Quim per
proposar-me una beca de doctorat: allò que volia fer. Bé, allò que volia fer, a banda d’anar a viatjar pel
món. L’endemà mateix, vaig conèixer la Sandra. Així, en primer lloc, he d’agrair als qui han estat els meus
directors de tesi, Quim i Sandra, que em donessin la oportunitat de fer el doctorat.
En segon lloc, m’agradaria èmfasi a tot un seguit de professionals i de serveis que han facilitat, d’alguna
manera, en la duta a terme d’aquesta tesi. A més, cal destacar que, en la seva majoria, ho han fet ben
amablement i contents de poder contribuir, i això té un valor afegit. Des de l’Ignacio, per la paciència en
tot, des d’explicar-nos com redactar un (o set) procediments ètics, fins a ensenyar-me a anestesiar els
animals o a fer la extracció cardíaca. El Pedro, per ser tan zanjante i, alhora, donar-me suport quan ha
estat necessari. I a la resta de membres (no murins) de l’estabulari. Sobretot, pel seu bon humor, al Lluís i
la Marta. A la Mònica del Servei de Microscòpia. A la Mar del Servei de Microtomia. Al Jaume Ferrer, de
l’Institut de Neurociències, per la bona voluntat i per endinsar-me en la conducta. A l’Oliver, del Servei
d’Estadísitica.
A la Mercè, i a tots els companys del Departament de Biologia Cel·lular, Fisiologia i Immunologia. També,
a la Sarai i a la Marina, i a la Marta Hernández i a l’Ana Sierra per resoldre’m dubtes experimentals.
A l’Helena, al Salva, a la Magda, al Santi, i a tots els companys del Departament de Bioquímica i Biologia
Molecular.
En especial, als membres passats i presents del grup: Marta, Gyo, Bernat, Laia, Jofre, Gabri i Alejandro.
Gràcies per ser i per ser-hi.
Finalment, als amics i família.


ii
TABLE OF CONTENTS
LIST OF FIGURES .............................................................................................................................................. vi
LIST OF TABLES ............................................................................................................................................... vii
ABBREVIATIONS ............................................................................................................................................ viii
ABSTRACT ...................................................................................................................................................... xii
INTRODUCTION ................................................................................................................ 1
1. SOCIAL AND HISTORICAL CONTEXT OF ALZHEIMER’S DISEASE ................................................................. 3
2. THE AMYLOID-β PEPTIDE.......................................................................................................................... 4 2.1. Aβ production .............................................................................................................................................. 4 2.2. Aβ clearance ................................................................................................................................................ 7 2.3. Cell biology of the Aβ peptide ...................................................................................................................... 9 2.3. The Aβ peptide and its toxicity .................................................................................................................. 11
3. PHYSIOPATHOLOGY OF AD ..................................................................................................................... 12 3.1. Tau pathology ............................................................................................................................................ 13 3.2. Synaptic damage ........................................................................................................................................ 14 3.3. Mitochondrial failure, oxidative stress and calcium disruption ................................................................. 14 3.4. Disturbances on the insulin-signaling pathway ......................................................................................... 14 3.5. Immune system and vascular alterations .................................................................................................. 14
4. ORIGIN OF THE PATHOLOGY .................................................................................................................. 15 4.1. Familial AD ................................................................................................................................................. 15 4.2. Sporadic AD ................................................................................................................................................ 17
5. MODELING AD........................................................................................................................................ 19 5.1. Current transgenic mice ............................................................................................................................. 20 5.2. The 3xTg-AD mouse model ........................................................................................................................ 20 6.1. Recombinant antibodies engineering ........................................................................................................ 23 6.1. ScFv-h3D6 .................................................................................................................................................. 24 6.2. In vivo testing of scFv-h3D6 ....................................................................................................................... 26
AIMS .............................................................................................................................. 29
METHODOLOGY .............................................................................................................. 33
1. ScFv-h3D6 PRODUCTION ........................................................................................................................ 35 1.1. ScFv-h3D6 expression and purification ...................................................................................................... 35 1.2. TEV expression and purification ................................................................................................................ 37 1.3. Verification of disulfide configuration ....................................................................................................... 37
2. ANIMALS ................................................................................................................................................ 38 2.1. Mice hosting .............................................................................................................................................. 38

iii
2.2. Mice sacrifice and samples collection and processing ............................................................................... 38
3. HISTOLOGICAL PROCEDURES.................................................................................................................. 39 3.1. Histological staining and detections .......................................................................................................... 39 3.2. Microscopy ................................................................................................................................................. 41 3.3. Image processing ....................................................................................................................................... 41
4. BIOCHEMICAL PROCEDURES .................................................................................................................. 45 4.1. Hepatic enzymes determination ................................................................................................................ 45 4.2. Tumor Necrosis Factor-alpha (TNFα) quantification ................................................................................. 45 4.3. Soluble Aβ42 quantification ........................................................................................................................ 45 4.4. ScFv-h3D6 quantification ........................................................................................................................... 45
5. BEHAVIORAL AND COGNITIVE TESTS ...................................................................................................... 48 5.1. Corner test ................................................................................................................................................. 48 5.2. Open-field test ........................................................................................................................................... 48 5.3. Novel object recognition test..................................................................................................................... 49 5.4. Morris water maze ..................................................................................................................................... 49
6. STATISTICS AND GRAPHICAL REPRESENTATION ..................................................................................... 50
CHAPTER 1. INTRACELLULAR AΒ/APP CORRELATES WITH NEURODEGENERATION IN THOSE
NEURONAL POPULATIONS EARLY INVOLVED IN ALZHEIMER’S DISEASE ........................... 53
AIMS .............................................................................................................................................................. 55
RESULTS ......................................................................................................................................................... 56 Aβ/APP distribution through the brain ............................................................................................................. 56 Neuronal depletion ........................................................................................................................................... 59 Severity of the intracellular Aβ/APP pathology ................................................................................................ 61 BPSD-like symptoms ......................................................................................................................................... 64 Cognition and memory disabilities ................................................................................................................... 65
DISCUSSION ................................................................................................................................................... 68 Intraneuronal Aβ in the 3xTg-AD mouse model ............................................................................................... 68 Glutamatergic neurons vulnerability in young 3xTg-AD females ..................................................................... 69 Intraneuronal Aβ/APP and cellular density correlation in AD-involved neuronal populations ........................ 69 Behavioral and cognitive implications .............................................................................................................. 70
CHAPTER 2. SCFV-H3D6 PREVENTS NEURON LOSS AND IMPROVE COGNITIVE IMPAIRMENT
IN 3XTG-AD FEMALES BY REDUCING THE AΒ ................................................................... 73
AIMS .............................................................................................................................................................. 75
RESULTS ......................................................................................................................................................... 76 ScFv-h3D6 reduces intracellular amyloid-β burden .......................................................................................... 76 ScFv-h3D6 prevents from neuron loss .............................................................................................................. 80 Treatment with scFv-h3D6 does not induce any adverse response ................................................................. 83 Effect of scFv-h3D6 on behavioral and cognitive impairments ........................................................................ 87
DISCUSSION ................................................................................................................................................... 93 Efficiency of the scFv-h3D6 ............................................................................................................................... 93

iv
First insight into the safety of scFv-h3D6 treatment ........................................................................................ 94
CHAPTER 3. PHARMACOKINETICS OF SCFV-H3D6 AND FIRST APPROACH TO THE
MECHANISM OF ACTION ................................................................................................. 97
AIMS .............................................................................................................................................................. 99
RESULTS ....................................................................................................................................................... 100 Comparative pharmacokinetics between the scFv-h3D6-WT and -EL ............................................................ 100 ScFv-h3D6 crosses the blood brain barrier ..................................................................................................... 102 ScFv-h3D6 is internalized by cells ................................................................................................................... 104 ScFv-h3D6 and Aβ peptide in the central nervous system ............................................................................. 106 ScFv-h3D6 and Aβ peptide in relation to the cellular types ........................................................................... 108 Effect of the treatment on the TNF-α levels ................................................................................................... 109
DISCUSSION ................................................................................................................................................. 111
CHAPTER 4. INTERACTION AMONG AGEING, TRAINING AND IMMUNOTHERAPY ON
BEHAVIORAL AND COGNITIVE IMPAIRMENTS IN THE 3XTG-AD MOUSE MODEL OF
ALZHEIMER’S DISEASE .................................................................................................. 115
AIMS ............................................................................................................................................................ 117
RESULTS ....................................................................................................................................................... 118 Progression of BPSD-like symptoms in 3xTg-AD females from 5 to 9 months of age .................................... 118 Evolution of the spatial learning and memory in 3xTg-AD females ................................................................ 121 Reversal learning and memory and its evolution in 3xTg-AD females from 5- to 9-mo-old .......................... 127 Effects of continued immunotherapy with scFv-h3D6-WT and scFv-h3D6-EL ............................................... 129 Neuropsychiatric-like symptoms, spatial learning and memory in 9-mo-old naïve mice ............................... 131
DISCUSSION ................................................................................................................................................. 134
GENERAL DISCUSSION .................................................................................................... 137
CONCLUSIONS ............................................................................................................... 145
REFERENCES .................................................................................................................. 151
SUPPLEMENATARY MATERIAL ....................................................................................... 171
SUPPLEMENTARY FIGURES ........................................................................................................................... 173
SUPPLEMENTARY TABLES ............................................................................................................................. 175

v

vi
LIST OF FIGURES
Figure 1. Main histological features of Alzheimer’s disease (AD). .................................................................. 4
Figure 2. Amyloid Precursor Protein (APP) processing. .................................................................................. 6
Figure 3. Schematic representation of the cell biology of the Aβ peptide. .................................................. 10
Figure 4. Three-dimensional structure of Aβ1-40 and Aβ1-42, and fibrillar elongation. ................................... 12
Figure 5. AD-related pathomechanisms. ....................................................................................................... 14
Figure 6. Typical isoforms and mutations of the main FAD or AD-associated proteins. ............................... 17
Figure 7. Schematic overview of AD-associated genes. ................................................................................ 19
Figure 8. Strategy used to develop of 3xTg-AD mouse model. ..................................................................... 21
Figure 9. Illustrative scheme of antibody domains and scFv fragments. ...................................................... 25
Figure 10. ScFv-h3D6 improvements by rational design of its fold. .............................................................. 26
Figure 11. Beneficial effects of scFv-h3D6 in vivo. ........................................................................................ 28
Figure 12. ScFv-h3D6 purification. ................................................................................................................ 36
Figure 13. Regions of the central nervous system analyzed. ........................................................................ 44
Figure 14. Detection of the specific anti-scFv-h3D6 polyclonal antibodies. ................................................. 47
Figure 15. Behavioral and cognitive tests. .................................................................................................... 50
Figure 16. 6E10 immunodetection through the olfactory bulb, neocortex, hippocampus, amygdala and
cerebellum. ............................................................................................................................................... 56
Figure 17. Double immunofluorescence detection of Aβ/APP and specific neuronal markers. ................... 57
Figure 18. Confocal visualization of Aβ/APP distribution. ............................................................................. 58
Figure 19. Neuronal densities in the olfactory bulb, cerebral cortex, hippocampus, amygdala and
cerebellum. ............................................................................................................................................... 61
Figure 20. Proportion of neurons exhibiting intracellular Aβ/APP and correlation with neuronal depletion.
................................................................................................................................................................... 63
Figure 21. Astroglia and microglia colocalization with Aβ/APP-containing neurons. ................................... 64
Figure 22. BPSD-like symptoms. .................................................................................................................... 66
Figure 23. Learning and memory impairment. ............................................................................................. 67
Figure 24. Proportion of 6E10-ir cells is reduced by a single i.p. dose of scFv-h3D6. ................................... 78
Figure 25. Intracellular 6E10-immunoreactivty decreases after scFv-h3D6 treatment. ............................... 80
Figure 26. Treatment with scFv-h3D6 reduces the proportion of neurons showing higher levels of 6E10-
fluorescent signal. ..................................................................................................................................... 81
Figure 27. ScFv-h3D6 protects from neuron depletion. ................................................................................ 84
Figure 28. ScFv-h3D6 does not produce any neuroinflammatory response. ................................................ 85
Figure 29. NORT performance of young 3xTg-AD females is barely improved 2 days after scFv-h3D6
administration. .......................................................................................................................................... 91
Figure 30. Spatial memory is ameliorated by scFv-h3D6 treatment. ............................................................ 93

vii
Figure 31. Plasma concentration of ScFv-h3D6-WT and -EL. ...................................................................... 101
Figure 32. Scfv-h3D6 influx to the brain. ..................................................................................................... 103
Figure 33. Temporal distribution of scFv-h3D6 through the extra- and intracellular brain compartments.
................................................................................................................................................................. 106
Figure 34. Colocalization of scFv-h3D6 and Aβ in the brain. ....................................................................... 108
Figure 35. ScFv-h3D6 and Aβ visualization 5 days p.i. by confocal microscopy. ......................................... 109
Figure 36. TNF-α profile over time post-injection ....................................................................................... 110
Figure 37. BPSD-like symptoms testing in the corner test at 5, 7, and 9 months of age. ........................... 119
Figure 38. BPSD-like symptoms testing in the open-field test at 5, 7, and 9 months of age. ..................... 120
Figure 39. Acquisition phase from the MWM paradigm at 5, 7, and 9 months of age. .............................. 123
Figure 40. Long-term memory assessed by the probe trial from the MWM at 5, 7, and 9 months of age.125
Figure 41. Reversal testing in the MWM in 5-, 7-, and 9-months-old 3xTg-AD and NTg mice. .................. 128
Figure 42. Effect of immunotherapy on behavioral and cognitive impairments. ....................................... 131
Figure 43. Spatial learning and memory in trained and naïve mice. ........................................................... 132
LIST OF TABLES
Table 1. Aβ degrading enzymes. ..................................................................................................................... 8
Table 2. Representative mouse models of AD. ............................................................................................. 24
Table 3. Primary and secondary antibodies used for immunofluorescence. ................................................ 40
Table 4. Neuronal depletion in young 3xTg-AD females. .............................................................................. 60
Table 5. Peripheral response of the scFv-h3D6 treatment. .......................................................................... 86
Table 6. BPSD-like symptoms in the CT and OFT 1 day after the treatment................................................. 89

viii
ABBREVIATIONS
ºC Celsius Degrees
3xTg-AD Triple-transgenic mouse model of Alzheimer’s disease
3D Three dimensional
Aβ Amyloid-beta peptide
ABAD Amyloid-beta binding alcohol dehydrogenase
ACE Angiotensin-converting enzyme
ACH Amyloid cascade hypothesis
AD Alzheimer’s disease
ADAM A disintegrin and metalloproteinase
AICD APP intracellular domain
AMPA Alpha-amino-3-hidroxil-5-metil-4-isoxazol-propiaonate
Aph-1 Anterior pharynx defective 1
ApoE Apolipoprotein E
ApoJ Apolipoprotein J
APP Amyloid precursor protein
Aβ Amyloid-β peptide (Aβ40, 40 residues and Aβ42, 42 residues)
BACE1 Beta-site APP-cleaving enzyme 1
BBB Blood-brain barrier
BSA Bovine serum albumin
CA Cornus Ammonis
CAA Cerebral amyloid angiopathy
CA1 Cornus Ammonis, region I
CA2/3 Cornus Ammonis, region II and III, combined
CDR Complementarity-determining region
CEx Cationic exchange
CGCs Granular cells (cerebellum)
CSF Cerebrospinal fluid
CT Corner test
CTFα/β Carboxy-terminal fragment, cleaved by the alpha- or beta-secretases
CypD Cyclophin D
DAPI 4’,6’-diamidino-2-phenylindole
DCN Deep cerebellar nuclei

ix
DG Dentate gyrus
DGCs Granular cells (dentate gyrus, hippocampus)
E. Coli Escherichia coli
ECE Endothelin-converting enzyme
EDTA Ethylene diamine tetra-acetic acid
EM Electron microscopy
EOAD Early-onset AD
FAIM-L Fas apoptotic inhibitory molecule - L
fAD Familial AD
Fc Crystallizable fragment
FTDP Frontotemporal dementia and parkinsonism
GCL Granular cells layer (olfactory bulb)
GFAP Glial fibrillary acidic protein
GPR3 G-protein-coupled receptor protein 3
GPI Glycosylphosphatidylinositol
GSH Reduced glutathione
GSK-3β Glycogen synthase kinase 3 beta
GSSG Oxidized glutathione
GTPase Guanosine triphosphate hydrolase
GWAS Genome-wide association study
h Hours
His Histidine
HSPG Heparin-sulfate proteoglycan
IDE Insulin-degrading enzyme
IgG/M Immunoglobulin G/M
IGL Internal granular layer (cerebellum)
IMAC Immobilized metal ion affinity chromatography
IPTG Isopropyl-β-thiogalactoside
KDa Kilodaltons
KI Knock-in
KPI Kunitz protease domain
LB Luria-Bertani medium
LOAD Late-onset AD
LPNs Large pyramidal neurons (cerebral cortex)
x
LRP1/2 Low-density lipoprotein receptor-related protein 1 or 2
LTD Long-term depression
LTP Long-term potentiation
M Molar
mAb Monoclonal antibody
MAPT Microtubule-associated protein tau
MCL Mitral cell layer (olfactory bulb)
MCs Mitral cells (olfactory bulb)
mg Milligrams
min Minutes
mL Milliliter
mM Millimolar
mm Millimeters
mm2 Square millimeters
MPP Matrix metalloproteinase
Mw Molecular weight
MWM Morris water maze
nAchR Nicotinic acetylcholine receptor
NEP Neprilysin
NFT Neurofibrillary tangles
NGS Normal goat serum
NMDA N-methyl-D-aspartate
NMR Nuclear magnetic resonance
NORT Novel-object recognition test
NTg Non-transgenic
OB Olfactory bulb
OD Optical density
OFT Open-field test
OGCs Granular cells (olfactory bulb)
PBS Phosphate buffered saline
PCL Purkinje cell layer (cerebellum)
PCs Purkinje cells (cerebellum)
PDAPP Platelet-derived APP
PDGF Platelet-derived growth factor

xi
Pen-2 Presenilin enhancer 2
PHF Paired helical filaments
PNs Pyramidal neurons (hippocampus)
PrPc Cellular prion protein
PS1/2 Presenilin 1/presenilin 2
Rab Ras-related protein in brain
RAGE Receptor for advanced glycation end-products
rmsd Root-mean-squared deviation
ROS Reactive oxygen species
s Seconds
sAD Sporadic AD
sAPPα Alpha-cleaved soluble APP
sAPPβ Beta-cleaved soluble APP
ScFv Single-chain variable fragment
ScFv-h3D6 Single-chain variable fragment derived from the humanized mAb 3D6
SDS-PAGE Sodium dodecyl sulfate polyacrylamide gel electrophoresis
SEM Standard error of the mean
SNX Sorting nexin
TEV Tobacco etch virus protease
ThS Thioflavin S
TiMP Tissue inhibitor of metalloproteinases
TNF-α Tumor necrosis factor-alpha
trx Thioredoxin
UPS Ubiquitin-protease system
VH Variable domain of the heavy chain
VL Variable domain of the light chain
vs versus
3xTg-AD Triple-transgenic model of AD
ε2800.1% Extinction coefficient of a 1 mg/mL solution at 280 nm
μg Micrograms
µl Microliters
µm Micrometers
xii
ABSTRACT
Alzheimer’s disease (AD) is the most common neurodegenerative disorder worldwide. The accumulation
of the amyloid-β peptide (Aβ) is considered a key factor in its pathomechanism. The 3xTg-AD mouse
model has become one of the most popular models of AD since it is described to progressively develop Aβ
and tau pathologies by following a regional- and temporal-pattern analogous to human.
On the one hand, this thesis consists of the further understanding of AD by characterizing some treats of
young (5-mo-old) 3xTg-AD mice by biochemical, histological, and behavioral assessing. Thus, in the central
nervous system, we observed that glutamatergic neurons are the ones affected by the intracellular Aβ
pathology at early stages of the disease. Interestingly, the extent of this pathology strongly correlated
with neuron depletion, supporting the Aβ-mediated neurodegeneration. In the peripheral system, we
detected hepatic steatosis, what could be related with alterations in the lipid metabolism, and enlarged
red pulp from the spleen, supporting the erythrocyte-mediated clearance of Aβ. As well, behavioral and
psychological-like symptoms and memory impairments were already exhibited at 5-mo-old. A longitudinal
study from 5 to 9 months of age manifested the compensatory effect of the habituation and cognitive
stimulation on the behavioral and cognitive deterioration.
On the other hand, targeting Aβ oligomers, which is the most cytotoxic species, is currently the main
strategy in AD pharmacological research, specially by immunotherapy. We tested the effect of a single
dose of the anti-Aβ single-chain variable fragment derived from bapineuzumab, scFv-h3D6, in young 3xTg-
AD mice. We found that the treatment prevented neuron depletion and improved cognitive impairment
by reducing Aβ pathology in terms of both the percentage of neurons involved and intracellular burden.
We also observed that the white pulp from the spleen significantly grown with the treatment, suggesting
the peripheral contribution of the macrophage-mediated elimination of the Aβ/scFv-h3D6 complex.
Furthermore, basic pharmacokinetic parameters of scFv-h3D6 were assessed and compared to an
elongated version of the molecule, scFv-h3D6-EL. However, the improved thermodynamic stability and
ability to rescue neuroblastoma cell-cultures from Aβ-induced toxicity displayed by scFv-h3D6-EL were not
translated to mice. As well, intraperitoneal administered scFv-h3D6 was proven to be distributed as a
compartmental model and, what is more interesting, to cross the blood-brain barrier. Once in the brain, it
was internalized by both glial and neuron cells either as the isolated scFv or by forming Aβ/scFv-h3D6
complexes depending on the phase of the process.
In conclusion, this thesis provides some new insights in AD by the further characterization of the 3xTg-AD
mouse model and by the characterization of the pharmacological approach with scFv-h3D6.

1
INTRODUCTION

2

Introduction
3
1. SOCIAL AND HISTORICAL CONTEXT OF ALZHEIMER’S DISEASE
Alzheimer’s disease (AD) is defined as an irreversible, progressive brain disorder that alters memory and
thinking skills, and eventually the ability to carry out the simplest daily tasks [1]. Regarding to the social
issue, AD is the most common neurodegenerative disorder worldwide and accounts for around 70% of all
dementia cases. In 2015, this neurological condition affected most of the 46.8 million people estimated as
living with dementia and, hopelessly, predictions increase this figure over 130 million by 2050 [2]. Because
the degenerative process may be extended for over a decade after the diagnose, the associated dementia
causes a long suffering to both, patients and caregivers. Therefore, it supposes a huge social and
economic threat for our society and is considered as a 2first century pandemic [3]. Furthermore, current
therapies are palliative rather than disease-modifiers. Therefore, many efforts and global resources are
focused on the search of a treatment to prevent, stop or even reverse this overwhelming disease [4]. This
includes basic research focused on deciphering the physiopathology underlying AD and the original causes
triggering it, as well as applied approaches intending the engineering of proper AD models, the
development of novel therapeutic strategies, and the standardization of all the processes (especially
those concerning to biomarkers for diagnosis and prognosis).
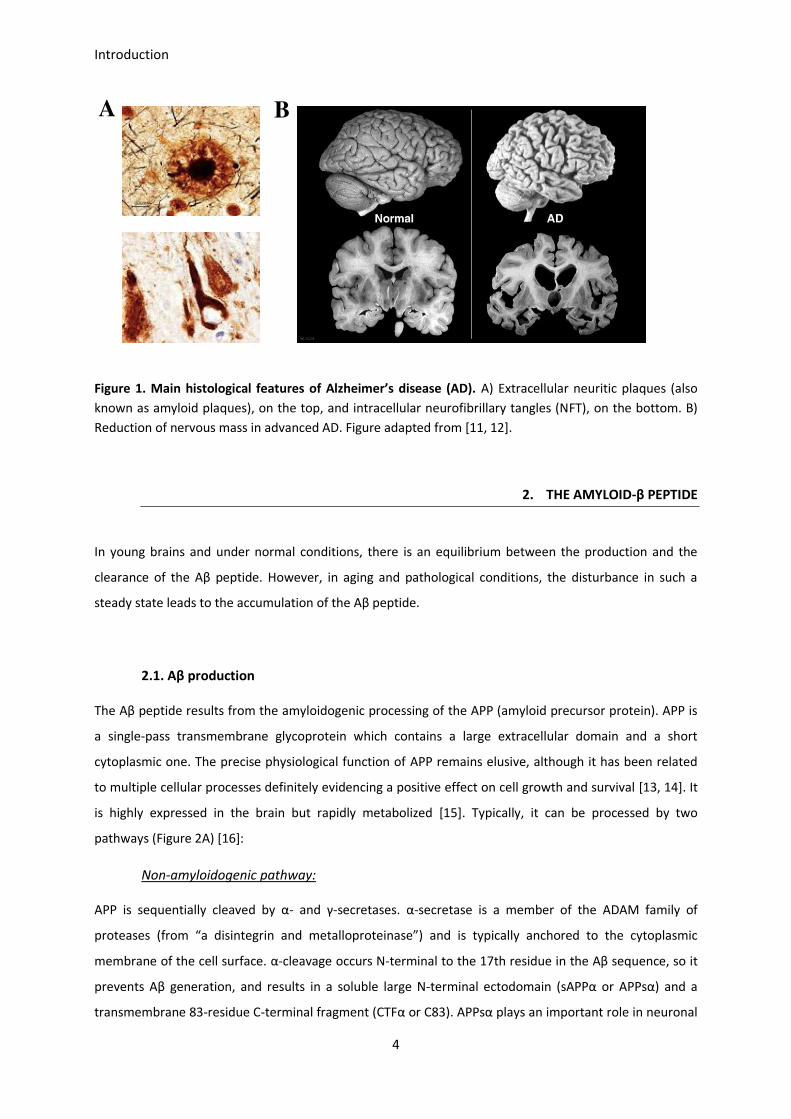
AD was first described by Alois Alzheimer in 1906, who reported the single case of a 51-years-old patient
with memory loss, disorientation, hallucinations, and dementia. Brain analyses exhibited distinctive
neuritic plaques (which were then called military foci) and intracellular aggregates, as well as a dramatic
reduction in the number of cortical cells (Figure 1) [5]. The term Alzheimer’s disease was referenced for
the first time in the 8th edition of the book Psychiatrie, published in 1910 [6]. Several decades later, in the
1980s, the main component of the neuritic plaques core was characterized as multimeric aggregates of a
polypeptide of about 40 residues, which was then named A4 (A for its amyloid character and 4 because of
its Mw), currently known as amyloid-β (Aβ) peptide [7]. The intracellular aggregates were defined as
neurofibrillary tangles (NFT) and turned out to be constituted by hyperphosphorylated and/or fragmented
forms of tau, a microtubule-associated protein [8]. In 1992, the amyloid cascade hypothesis postulated
that the deposition of the Aβ peptide was the causative agent for AD and that other features such as NFT,
synaptic disruption, cell loss, vascular damage and dementia occurred as a downstream response [9].
Nowadays, the accumulation of the Aβ peptide in the nervous tissue is considered a key factor in the
progression of this neurodegenerative disorder, but other age-related, protective, and disease-promoting
factors have been demonstrated to be involved in the disease progression [10].
Introduction
4
Figure 1. Main histological features of Alzheimer’s disease (AD). A) Extracellular neuritic plaques (also
known as amyloid plaques), on the top, and intracellular neurofibrillary tangles (NFT), on the bottom. B)
Reduction of nervous mass in advanced AD. Figure adapted from [11, 12].
2. THE AMYLOID-β PEPTIDE
In young brains and under normal conditions, there is an equilibrium between the production and the
clearance of the Aβ peptide. However, in aging and pathological conditions, the disturbance in such a
steady state leads to the accumulation of the Aβ peptide.
2.1. Aβ production
The Aβ peptide results from the amyloidogenic processing of the APP (amyloid precursor protein). APP is
a single-pass transmembrane glycoprotein which contains a large extracellular domain and a short
cytoplasmic one. The precise physiological function of APP remains elusive, although it has been related
to multiple cellular processes definitely evidencing a positive effect on cell growth and survival [13, 14]. It
is highly expressed in the brain but rapidly metabolized [15]. Typically, it can be processed by two
pathways (Figure 2A) [16]:
Non-amyloidogenic pathway:
APP is sequentially cleaved by α- and γ-secretases. α-secretase is a member of the ADAM family of
proteases (from “a disintegrin and metalloproteinase”) and is typically anchored to the cytoplasmic
membrane of the cell surface. α-cleavage occurs N-terminal to the 17th residue in the Aβ sequence, so it
prevents Aβ generation, and results in a soluble large N-terminal ectodomain (sAPPα or APPsα) and a
transmembrane 83-residue C-terminal fragment (CTFα or C83). APPsα plays an important role in neuronal
A B
Introduction
5
survival and plasticity, whereas C83 is subsequently cleaved by γ-secretase. γ-secretase is a multiprotein
complex composed of presenilin 1 or 2 (PS1 or PS2), nicastrin (a type I transmembrane glycoprotein), and
Aph-1 and Pen-2 (two transmembrane multi-pass proteins). γ-cleavage produces non-toxic P3 and AICD
(APP intracellular domain) fragments, both likely related to cholesterol metabolism in neurons.
Amyloidogenic pathway:
APP is firstly cleaved by β-secretase, which is also known as BACE1 (β-site APP-cleaving enzyme 1), at a
position located 99 residues from the C-terminus. β-cleavage produces the soluble fragment sAPPβ or
APPsβ, which shorter than APPsα and also released to the extracellular space, and the the C-terminal
fragment (CTFβ, C99), which remains anchored to the membrane. This C99 fragment is subsequently
cleaved by the γ-secretase complex to generate the Aβ peptide and the AICD fragment. It is likely that γ-
secretase cleaves the substrate at different sites leading to the generation of Aβ peptides of different
length, from Aβ1-37 to Aβ1-43, being the Aβ1-40 species the most abundant one and the Aβ1-42 the most
prone to aggregation. The site where the Aβ peptide is cleaved is not trivial, as it has implications in the
aggregation potential of the peptide and, thus, in its pathogenicity [17]. Interestingly, the 16-residue extra
sequence at the Aβ amino N-terminus, compared to the non-amyloidogenic p3 peptide, is involved in the
stabilization of the β-hairpin in which the typical trimeric Aβ1-40 structure is based.
In addition to these canonical APP-processing pathways, several other possibilities for APP proteolysis
exist (Figure 2B) [18]. For instance, ð-, ŋ- and meprin-β-pathways consist on alternative APP N-terminus
cleavages producing several other APP fragments implicated in neuronal activity. Likewise, the APP C-
terminus is also cleaved by caspases to produce C31 and Jcasp fragments, which are involved in apoptosis
and inhibition of presynaptic transmitters release.
Introduction
6
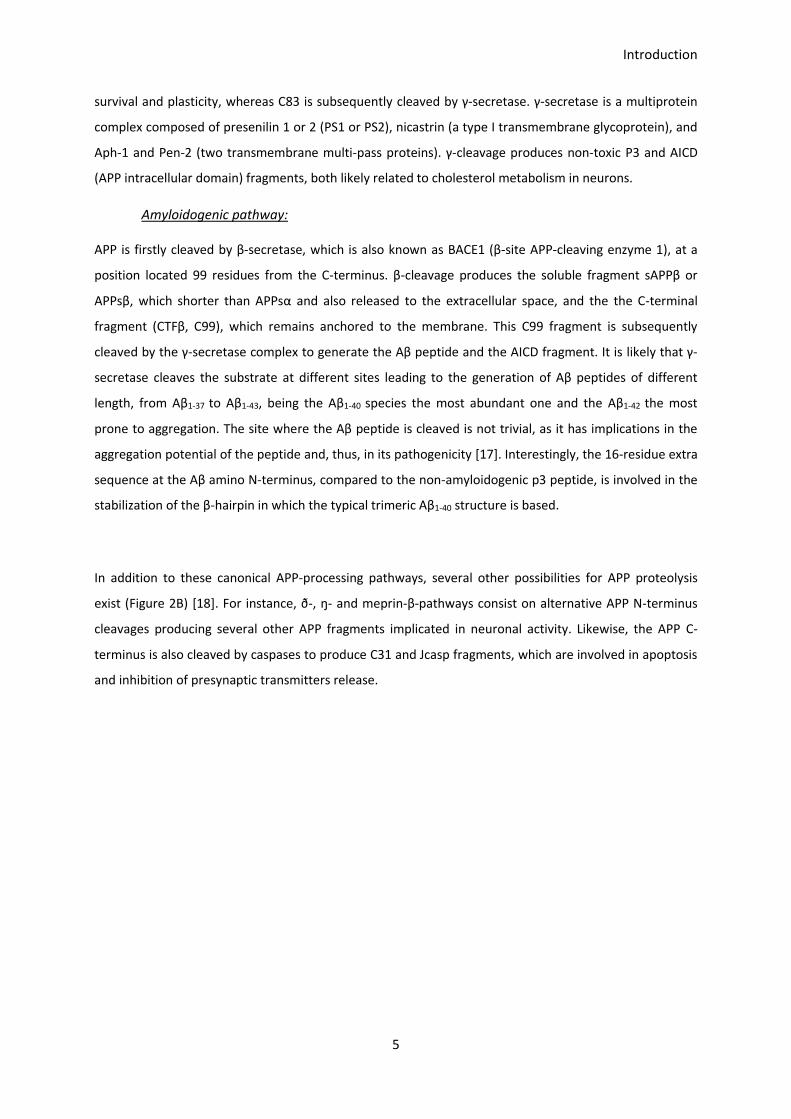
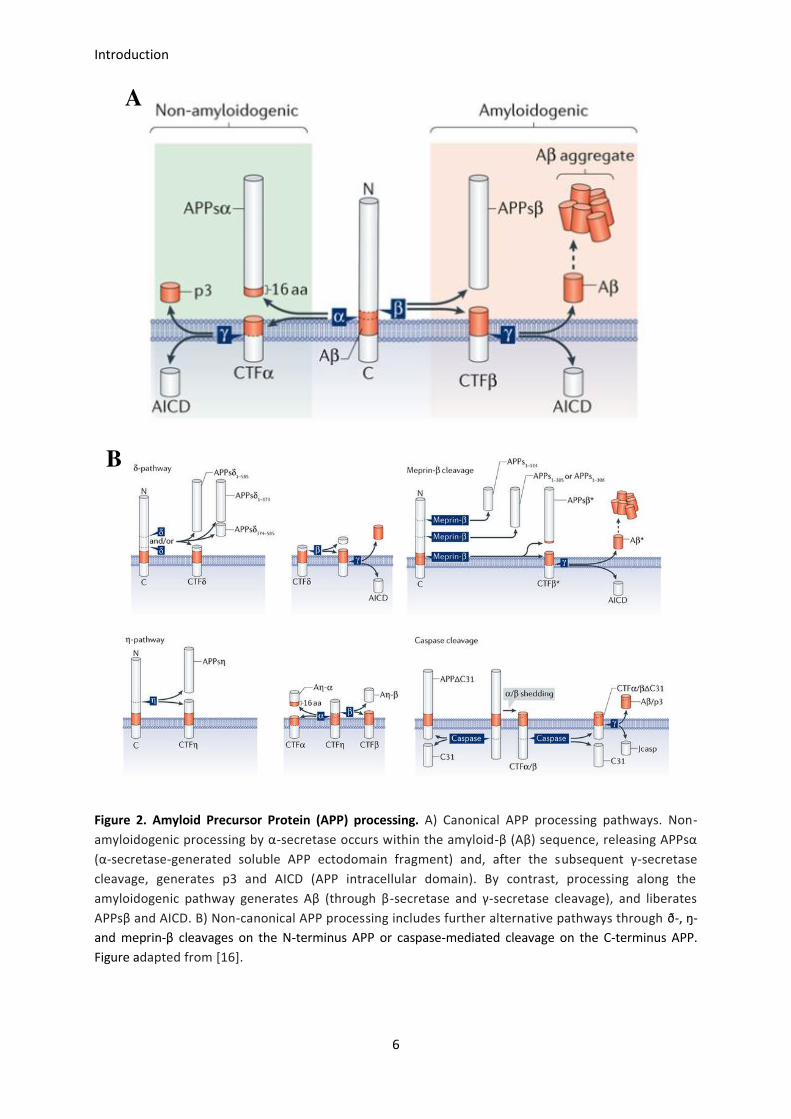
Figure 2. Amyloid Precursor Protein (APP) processing. A) Canonical APP processing pathways. Non-
amyloidogenic processing by α-secretase occurs within the amyloid-β (Aβ) sequence, releasing APPsα
(α-secretase-generated soluble APP ectodomain fragment) and, after the subsequent γ-secretase
cleavage, generates p3 and AICD (APP intracellular domain). By contrast, processing along the
amyloidogenic pathway generates Aβ (through β-secretase and γ-secretase cleavage), and liberates
APPsβ and AICD. B) Non-canonical APP processing includes further alternative pathways through ð-, ŋ-
and meprin-β cleavages on the N-terminus APP or caspase-mediated cleavage on the C-terminus APP.
Figure adapted from [16].
B
A
Introduction
7
2.2. Aβ clearance
Several components contribute to Aβ clearance, some of which participate in its enzymatic degradation
whereas some others are involved in its receptor-mediated uptake and/or efflux from the brain.
Enzymatic degradation of Aβ
The major pathways acting on Aβ degradation are mediated by IDE (insulin-degrading enzyme), NEP
(neprilysin), ECE (endothelin-converting enzyme), ACE (angiotensin-converting enzyme), plasmin, and
MMPs (matrix metalloproteinases) (Table 1) [19]. IDE is an endopeptidase involved in the cleavage of
several small peptides. Although it is predominantly located intracellularly (cytosol and peroxisomes), it
may be associated to the plasmic membrane in neurons, and even secreted to the extracellular matrix. It
has been reported to be the primary monomeric-Aβ degrading enzyme at neutral pH within the human
brain. As well, genetic variations in the IDE gene are associated with clinical symptoms of AD [20, 21].
The membrane-bound vasoendopeptidases NEP, ECE and ACE are also evidenced to be involved in Aβ
degradation. NEP has been proved to efficiently degrade Aβ and to retard the development of the
amyloid pathology. Besides, reactive astrocytes expressing high levels of NEP have been colocalized with
amyloid plaques. ECE is the best characterized Aβ degrading enzyme and its activity has been
demonstrated in cell cultures and animal models. It may be located intracellularly (Golgi-like structures or
vesicles of the constitutive secretory pathway), as well as at the cell surface. Although its optimum pH is
substrate-dependent, Aβ cleavage preferentially occurs at acid pH. ACE has been reported to be involved
in the functional maintenance of the blood-brain barrier (BBB). As well, in vitro experiments have
evidenced that ACE inhibits Aβ-induced toxicity [19].
Moreover, plasmin, closely associated with lipid rafts (a preferred site for Aβ generation), has been
demonstrated to efficiently degrade both monomeric and fibrillar Aβ, and its activity has been reported to
be reduced in AD human brain [22]. In contrast, increased brain MMP expression, accompanied by
increased CSF levels of its major inhibitor (TIMP, of tissue inhibitor of metalloproteinases), have been
reported in AD patients [23]. Besides, the cleavage of Aβ40 and Aβ42 by MMP-2 have been described in
vivo [24].
Finally, other pathways via the proteasome and lysosome are also proposed to be involved in AD, but
further studies are still needed. For instance, the proteasome ubiquitin-related system has been proved
to contribute in the development of abnormal neuritic processes and NFTs formation rather than Aβ
accumulation; however controversial results have been published for cathepsin B, a typical acid protease
from the lysosome, since some authors associate it with Aβ degradation and some others claim that it
acts as a β-site cleaving enzyme [25, 26].
Introduction
8
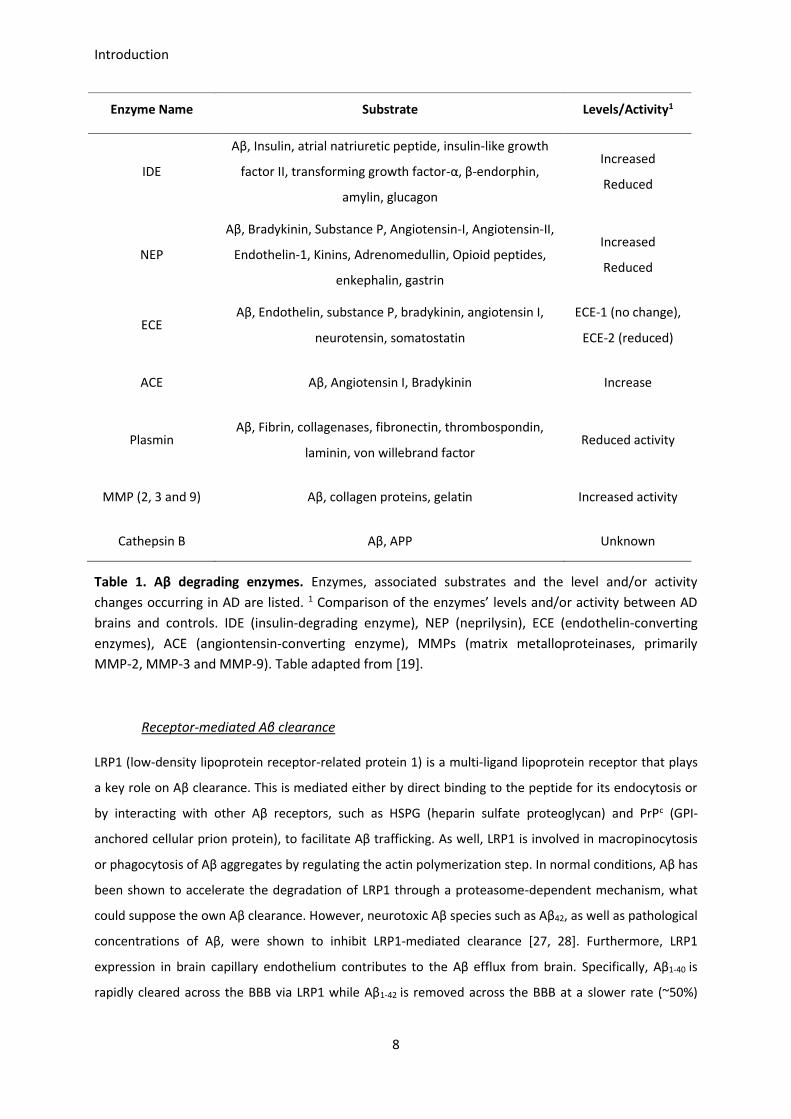
Enzyme Name Substrate Levels/Activity1
IDE
Aβ, Insulin, atrial natriuretic peptide, insulin-like growth
factor II, transforming growth factor-α, β-endorphin,
amylin, glucagon
Increased
Reduced
NEP
Aβ, Bradykinin, Substance P, Angiotensin-I, Angiotensin-II,
Endothelin-1, Kinins, Adrenomedullin, Opioid peptides,
enkephalin, gastrin
Increased
Reduced
ECE Aβ, Endothelin, substance P, bradykinin, angiotensin I,
neurotensin, somatostatin
ECE-1 (no change),
ECE-2 (reduced)
ACE Aβ, Angiotensin I, Bradykinin Increase
Plasmin Aβ, Fibrin, collagenases, fibronectin, thrombospondin,
laminin, von willebrand factor Reduced activity
MMP (2, 3 and 9) Aβ, collagen proteins, gelatin Increased activity
Cathepsin B Aβ, APP Unknown
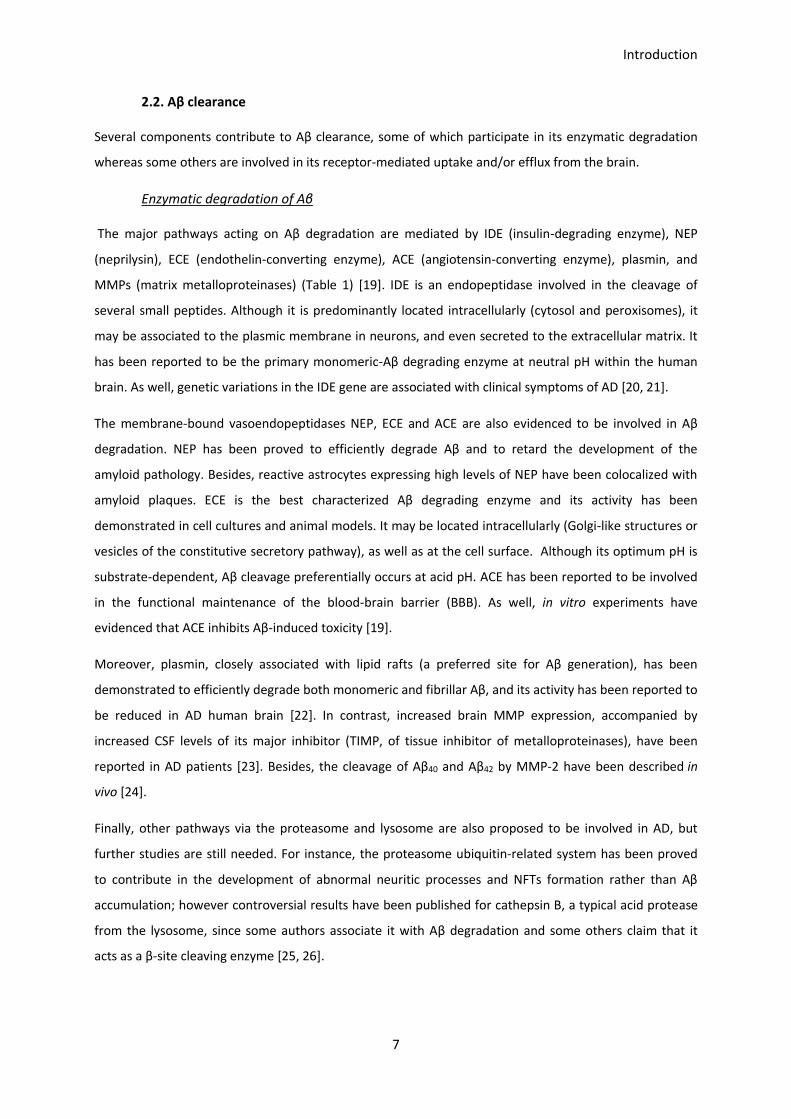
Table 1. Aβ degrading enzymes. Enzymes, associated substrates and the level and/or activity
changes occurring in AD are listed. 1 Comparison of the enzymes’ levels and/or activity between AD
brains and controls. IDE (insulin-degrading enzyme), NEP (neprilysin), ECE (endothelin-converting
enzymes), ACE (angiontensin-converting enzyme), MMPs (matrix metalloproteinases, primarily
MMP-2, MMP-3 and MMP-9). Table adapted from [19].
Receptor-mediated Aβ clearance
LRP1 (low-density lipoprotein receptor-related protein 1) is a multi-ligand lipoprotein receptor that plays
a key role on Aβ clearance. This is mediated either by direct binding to the peptide for its endocytosis or
by interacting with other Aβ receptors, such as HSPG (heparin sulfate proteoglycan) and PrPc (GPI-
anchored cellular prion protein), to facilitate Aβ trafficking. As well, LRP1 is involved in macropinocytosis
or phagocytosis of Aβ aggregates by regulating the actin polymerization step. In normal conditions, Aβ has
been shown to accelerate the degradation of LRP1 through a proteasome-dependent mechanism, what
could suppose the own Aβ clearance. However, neurotoxic Aβ species such as Aβ42, as well as pathological
concentrations of Aβ, were shown to inhibit LRP1-mediated clearance [27, 28]. Furthermore, LRP1
expression in brain capillary endothelium contributes to the Aβ efflux from brain. Specifically, Aβ1-40 is
rapidly cleared across the BBB via LRP1 while Aβ1-42 is removed across the BBB at a slower rate (~50%)

Introduction
9
than Aβ1-40. Interestingly, the soluble form of LRP1 (sLRP1) binds 70-90% of plasma Aβ, preventing its
access to the brain.
ApoE (apolipoprotein E) is the major ligand for LRP1 and an important partner of Aβ, as well as the main
cholesterol carrier in the brain. Apart of Aβ uptake by the cells, apoE also regulates the extracellular Aβ
burden by participating either in its efflux across the BBB or in its degradation by modulating IDE
expression. Whereas, apoJ (apolipoprotein J or clusterin) is a multi-functional disulfide-linked
heterodimeric glycoprotein present in all the biological fluids, including plasma and cerebrospinal fluid
(CSF). It also intervenes on the Aβ efflux across the BBB through the megalin (or LRP2) receptor and, as
well as apoJ, modifies the Aβ ability to form fibrils. Finally, P-glycoprotein has been suggested to be
involved in Aβ clearance as an efflux pump at the BBB, being its activity reduced on those more AD-
involved cerebral regions [29–31].
Concerning the peripheral clearance, the liver appears to be the main organ responsible for Aβ clearance,
followed by the kidney. Thus, Aβ is primarily degraded by IDE and NEP within the hepatocytes [32].
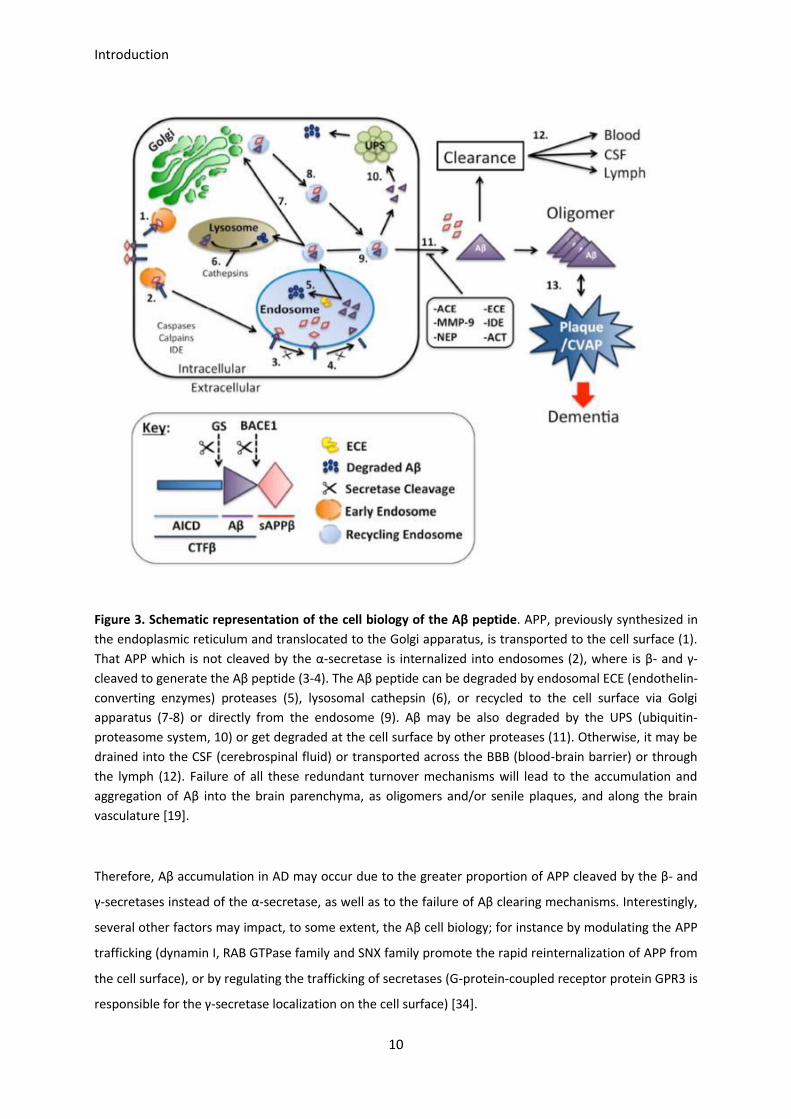
2.3. Cell biology of the Aβ peptide
Cell biology of the Aβ peptide, from the production to the clearance, is schematized in Figure 3. APP is
synthesized in the endoplasmic reticulum and is transported to the Golgi apparatus. After the APP
packaging into vesicles, it travels down the axon for delivery to the cell surface. Once inserted into the cell
surface, some APP is cleaved by α-secretase to generate the sAPPα fragment, which diffuses away, and
some is rapidly reinternalized into endosomes, where Aβ will be generated. Specifically, β-secretase
cleaves APP to generate CTFβ, which is then processed by γ-secretase to release the Aβ fragments within
the endosome. In neurons, a large fraction of the Aβ generated in this compartment is degraded by
proteases such as ECE. The Aβ that escapes this pathway may be transported to the lysosome to be
degraded or alternatively, may be included within recycling endosomes which are directed to the cell
surface either via the Golgi apparatus or directly from the endosome to the cell surface. Also, Aβ may be
released from recycling vesicles to the ubiquitin-protein system for degradation, or get degraded once
released through the cell surface by other proteases such as NEP, IDE, or MMP-9. Additional mechanisms
such as the receptor-mediated Aβ-uptake by the astro- and microglia, as well as Aβ aggregates
phagocytosis, work on the brain interstitial fluid clearance. Aβ escaping all these degradation pathways
may be drained into the cerebrospinal fluid or cleared into the lymphatic or vascular circulation [19, 33].
Introduction
10
Figure 3. Schematic representation of the cell biology of the Aβ peptide. APP, previously synthesized in
the endoplasmic reticulum and translocated to the Golgi apparatus, is transported to the cell surface (1).
That APP which is not cleaved by the α-secretase is internalized into endosomes (2), where is β- and γ-
cleaved to generate the Aβ peptide (3-4). The Aβ peptide can be degraded by endosomal ECE (endothelin-
converting enzymes) proteases (5), lysosomal cathepsin (6), or recycled to the cell surface via Golgi
apparatus (7-8) or directly from the endosome (9). Aβ may be also degraded by the UPS (ubiquitin-
proteasome system, 10) or get degraded at the cell surface by other proteases (11). Otherwise, it may be
drained into the CSF (cerebrospinal fluid) or transported across the BBB (blood-brain barrier) or through
the lymph (12). Failure of all these redundant turnover mechanisms will lead to the accumulation and
aggregation of Aβ into the brain parenchyma, as oligomers and/or senile plaques, and along the brain
vasculature [19].
Therefore, Aβ accumulation in AD may occur due to the greater proportion of APP cleaved by the β- and
γ-secretases instead of the α-secretase, as well as to the failure of Aβ clearing mechanisms. Interestingly,
several other factors may impact, to some extent, the Aβ cell biology; for instance by modulating the APP
trafficking (dynamin I, RAB GTPase family and SNX family promote the rapid reinternalization of APP from
the cell surface), or by regulating the trafficking of secretases (G-protein-coupled receptor protein GPR3 is
responsible for the γ-secretase localization on the cell surface) [34].
Introduction
11
2.3. The Aβ peptide and its toxicity
Aβ is a small protein composed of 37–43 residues with a variety of conformational states. There are
two major species of Aβ, Aβ40 and Aβ42. In normal conditions, more than 90% of Aβ is Aβ40 while less
than 5% is generated as the longer Aβ42 [35]. However, a higher percentage of Aβ42, which is more
prone to aggregation, occurs in AD patients. Indeed, the variation in the Aβ1-42/Aβ1-40 ratio is thought
to be one of the major determinants in the pathogenicity of the peptide [36]. Aβ1-40 tends to be
accumulated in the vasculature whereas Aβ1-42 constitutes the predominant form in amyloid plaques
[37].
Aβ spontaneously self-aggregates into multiple coexisting physical forms, being the multiple of three
units (trimers, hexamers, nonamers and dodecamers) the most prevalent ones. In the trimeric
structure, Aβ N-termini (DAEFR, residues 1-5) are exposed to the solvent, whereas the C-termini
(highly hydrophobic) are buried into the trimer core. Likewise, 0.48 nm-twisted hydrophobic package
of the trimers leads to the formation of amyloid fibrils, in such a way that all the residues of the N-
terminus within the fibril are solvent-exposed (Figure 4A,B). In contrast, Aβ1-42 fibrils are conformed
by dimeric structures, which are C2-symmetric with respect to the central axis of the fibril (Figure I-
4C,D) [38]. Aggregation of the Aβ peptide is known to occur in a nucleated polymerization manner:
Aβ monomers are associated into soluble oligomers that act as seeds to form insoluble oligomers,
protofibrils, and larger structures [38, 39].
Soluble oligomeric forms have been demonstrated to be the most toxic Aβ species and to better
correlate with cognitive decline, thus contradicting the earlier hypothesis claiming that amyloid
plaques were the main toxic Aβ species [40]. Moreover, intracellular deposition of the Aβ peptide
has been described in brains from AD patients and in several APP-transgenic mice, occurring earlier
than the extracellular accumulation and, likewise, better correlating with the cognitive decline [41].

Introduction
12
Figure 4. Three-dimensional structure of Aβ1-40 and Aβ1-42, and fibrillar elongation. A) Aβ1-40 trimeric
structure obtained by NMR and EM (pdb 2M4J). N-termini are exposed to the solvent (residues 1-5,
DAEFR), whereas C-termini are buried into the hydrophobic core (the β-sheet corresponds to
residues 17-21). B) Eighteen Aβ-trimeric units sequentially assembled to form an idealized fibril
structure with 0.48 nm displacements along the fibril axis. C) Aβ1-42 dimeric structure obtained by
NMR and EM. Backbones shown in yellow and orange, to indicate the symmetry of the molecule. D)
Schematic fibril consisting of two intertwined protofilaments. Figure adapted from [42–44].
3. PHYSIOPATHOLOGY OF AD
The exact mechanisms triggering AD remain elusive since multiple components have been proved to be
differently involved in the physiopathology. More than two decades ago, the amyloid cascade hypothesis
designated Aβ aggregation as the origin of the disease, resulting in tau pathology, cell death, vascular
A B
C D
Introduction
13
damage and, finally, dementia [9]. However, this concept has been modulated over the time up to the
current vision that, although remaining Aβ-centric, much more considers degenerative processes that are
not necessarily a mere consequence of Aβ accumulation, but rather an Aβ promoting or modulating factor
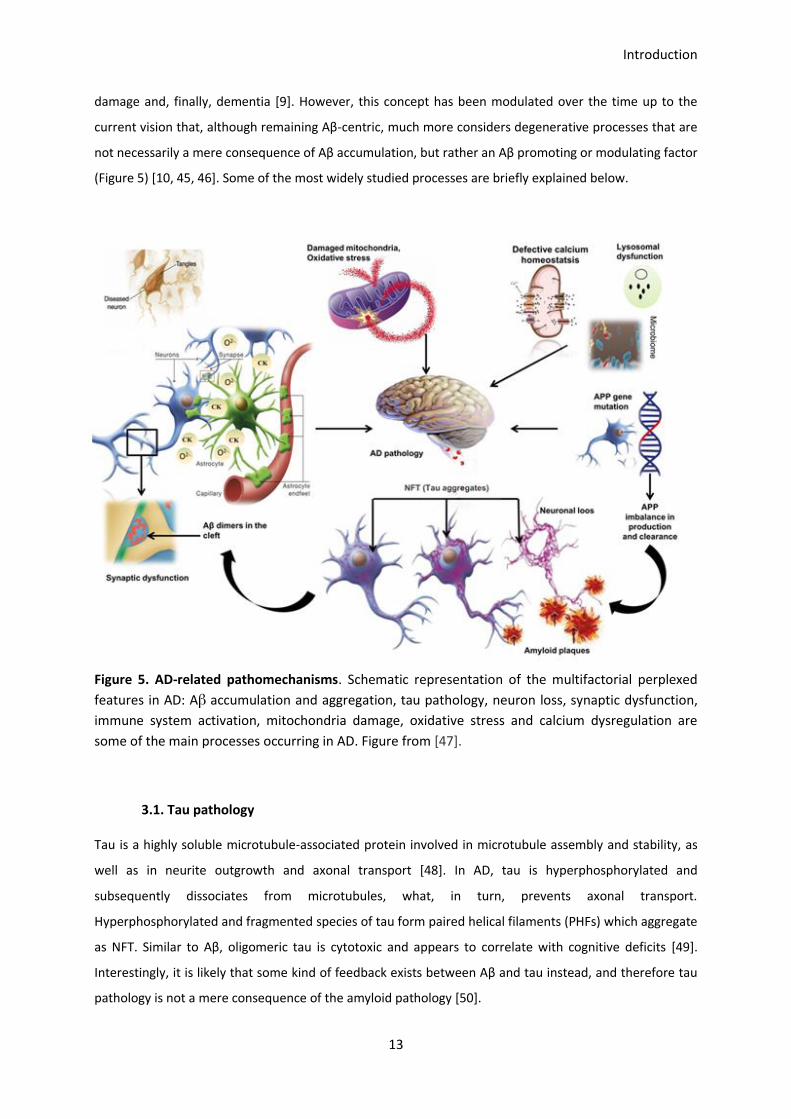
(Figure 5) [10, 45, 46]. Some of the most widely studied processes are briefly explained below.
Figure 5. AD-related pathomechanisms. Schematic representation of the multifactorial perplexed
features in AD: Aβ accumulation and aggregation, tau pathology, neuron loss, synaptic dysfunction,
immune system activation, mitochondria damage, oxidative stress and calcium dysregulation are
some of the main processes occurring in AD. Figure from [47].
3.1. Tau pathology
Tau is a highly soluble microtubule-associated protein involved in microtubule assembly and stability, as
well as in neurite outgrowth and axonal transport [48]. In AD, tau is hyperphosphorylated and
subsequently dissociates from microtubules, what, in turn, prevents axonal transport.
Hyperphosphorylated and fragmented species of tau form paired helical filaments (PHFs) which aggregate
as NFT. Similar to Aβ, oligomeric tau is cytotoxic and appears to correlate with cognitive deficits [49].
Interestingly, it is likely that some kind of feedback exists between Aβ and tau instead, and therefore tau
pathology is not a mere consequence of the amyloid pathology [50].
Introduction
14
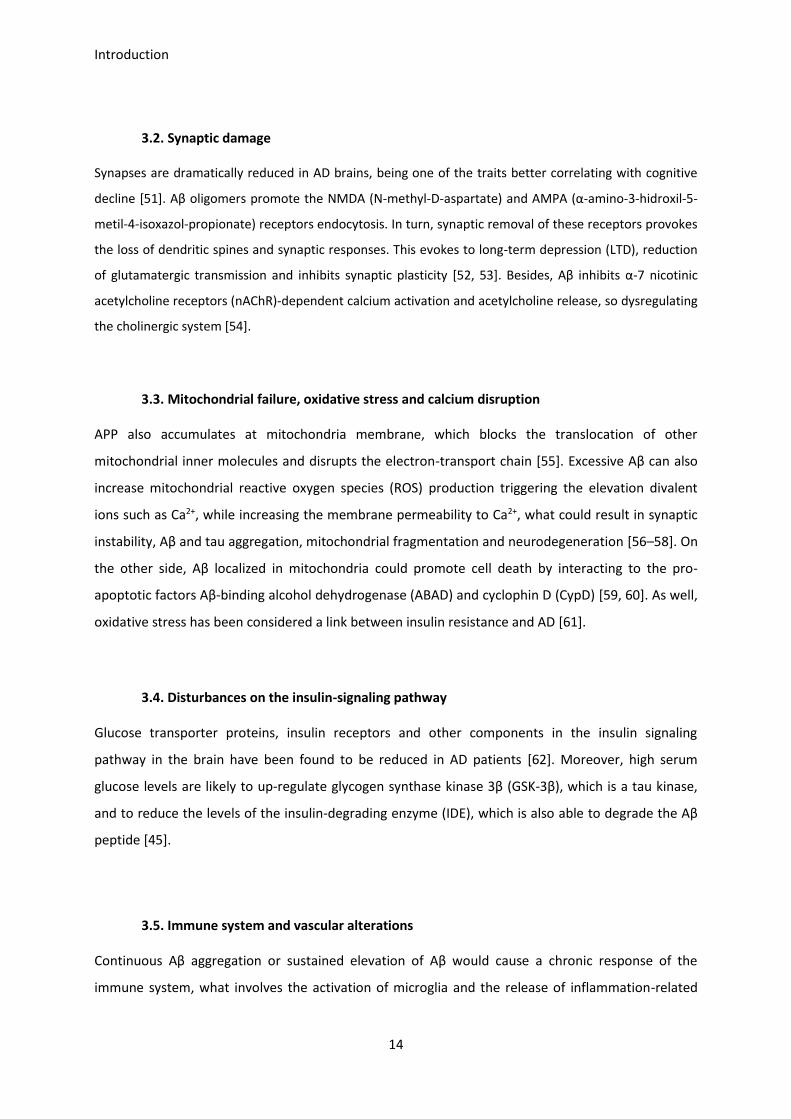
3.2. Synaptic damage
Synapses are dramatically reduced in AD brains, being one of the traits better correlating with cognitive
decline [51]. Aβ oligomers promote the NMDA (N-methyl-D-aspartate) and AMPA (α-amino-3-hidroxil-5-
metil-4-isoxazol-propionate) receptors endocytosis. In turn, synaptic removal of these receptors provokes
the loss of dendritic spines and synaptic responses. This evokes to long-term depression (LTD), reduction
of glutamatergic transmission and inhibits synaptic plasticity [52, 53]. Besides, Aβ inhibits α-7 nicotinic
acetylcholine receptors (nAChR)-dependent calcium activation and acetylcholine release, so dysregulating
the cholinergic system [54].
3.3. Mitochondrial failure, oxidative stress and calcium disruption
APP also accumulates at mitochondria membrane, which blocks the translocation of other
mitochondrial inner molecules and disrupts the electron-transport chain [55]. Excessive Aβ can also
increase mitochondrial reactive oxygen species (ROS) production triggering the elevation divalent
ions such as Ca2+, while increasing the membrane permeability to Ca2+, what could result in synaptic
instability, Aβ and tau aggregation, mitochondrial fragmentation and neurodegeneration [56–58]. On
the other side, Aβ localized in mitochondria could promote cell death by interacting to the pro-
apoptotic factors Aβ-binding alcohol dehydrogenase (ABAD) and cyclophin D (CypD) [59, 60]. As well,
oxidative stress has been considered a link between insulin resistance and AD [61].
3.4. Disturbances on the insulin-signaling pathway
Glucose transporter proteins, insulin receptors and other components in the insulin signaling
pathway in the brain have been found to be reduced in AD patients [62]. Moreover, high serum
glucose levels are likely to up-regulate glycogen synthase kinase 3β (GSK-3β), which is a tau kinase,
and to reduce the levels of the insulin-degrading enzyme (IDE), which is also able to degrade the Aβ
peptide [45].
3.5. Immune system and vascular alterations
Continuous Aβ aggregation or sustained elevation of Aβ would cause a chronic response of the
immune system, what involves the activation of microglia and the release of inflammation-related
Introduction
15
mediators. In turn, these events impair microglial clearance of Aβ and increase microglia-mediated
neuronal death and loss of neuronal synapses [28, 63].
Otherwise, capillary abnormalities, BBB disruption, and cerebral amyloid angiopathy (CAA) have been
described in AD patients [64]. It is likely that the Aβ transport across the BBB (mostly Aβ40, as is the one
forming vascular deposits) is impaired because the imbalance between Aβ-influx (by receptors for
advanced glycation end products, RAGE) and Aβ efflux (by LRP1) [65].
4. ORIGIN OF THE PATHOLOGY
AD is nearly associated to aging and most of the patients are diagnosed on the elderly. These cases
constitute the late-onset AD (LOAD), being the threshold around 60-65 years old, and comprise about
99% of the patients. In contrast, the early-onset AD (EOAD) represents only about 1% of the patients and
are usually diagnosed at around 30-40 years old. Furthermore, only a part of EOAD is designated as
familial AD (FAD) since specific autosomal dominant mutations are inherited. In contrast, the rest of EOAD
and all the LOAD cases are considered as the sporadic form of AD (SAD), which is not related to any of the
identified mutations [66].
4.1. Familial AD
Patients presenting mutations in either the APP gene or in the genes encoding for the γ-secretase
components presenilin 1 or 2 (PSEN1 or PSEN2) are considered familial cases of AD [67]. At least, fifty-one
pathogenic mutations in the APP gene have been described so far, as well as 219 in the PSEN1 gene and
16 in the PSEN2 gene [68]. These mutations may lead either to the elevation of total Aβ, modification of
the Aβ42:Aβ40 ratio, or Aβ aggregation [69].
Mutations in the APP gene
APP is located on the human chromosome 21, and accounts for a dose-effect leading to EOAD in Down
syndrome individuals. The most common isoforms in humans are APP695, APP751 and APP770 resulting from
the alternative splicing of exons 7 and 8, which encode for the KPI (Kunitz protease domain) and the OX2
(OX2 domain), respectively (Figure 6A). Those isoforms containing the KPI are predominantly expressed
in neurons, are more severely involved in AD development, and their frequency naturally increases with
aging [70]. Mutations in APP can be divided into three categories depending on its proximity to the
cleavage site: (I) at the β-secretase site, (II) close to the α-secretase site (so, within the Aβ region), and (III)
at the γ-secretase site. Therefore, they have different effects on APP processing and, consequently, on AD
Introduction
16
development [36]. These mutations are named accordingly to the geographic origin of the first identified
carrier family, and the mutated residue position numbered on the longest APP isoform (APP770) (Figure
6B).
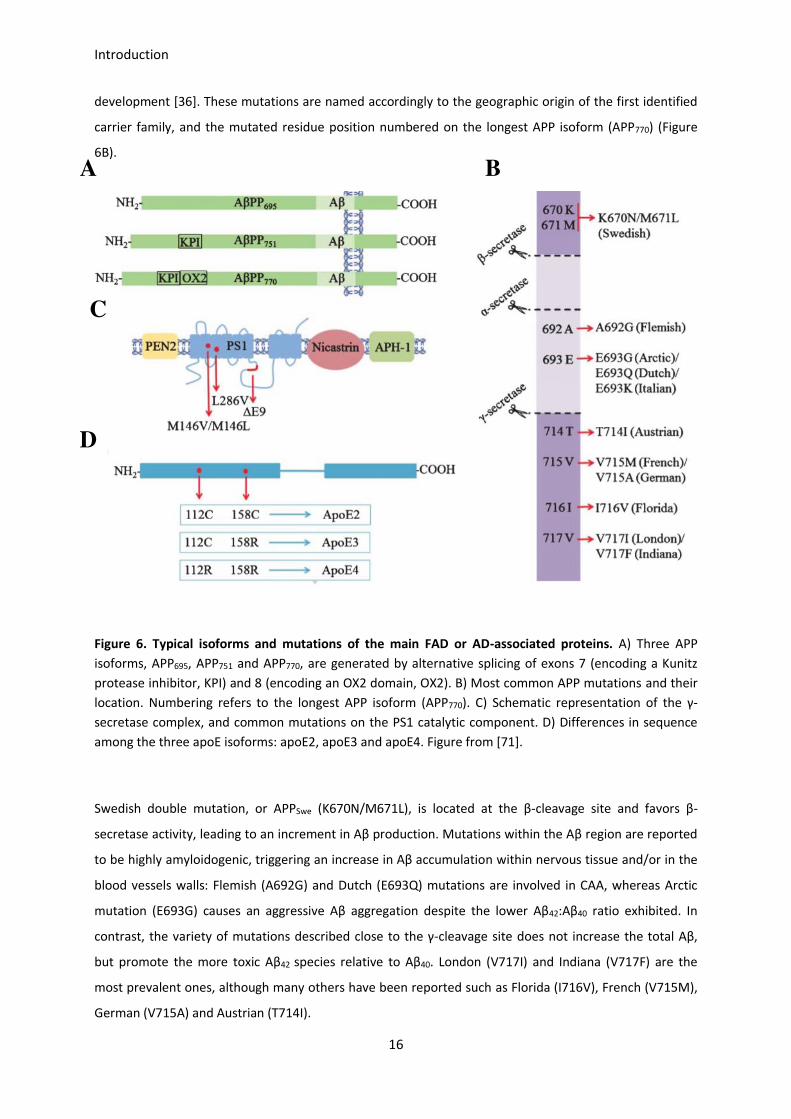
Figure 6. Typical isoforms and mutations of the main FAD or AD-associated proteins. A) Three APP
isoforms, APP695, APP751 and APP770, are generated by alternative splicing of exons 7 (encoding a Kunitz
protease inhibitor, KPI) and 8 (encoding an OX2 domain, OX2). B) Most common APP mutations and their
location. Numbering refers to the longest APP isoform (APP770). C) Schematic representation of the γ-
secretase complex, and common mutations on the PS1 catalytic component. D) Differences in sequence
among the three apoE isoforms: apoE2, apoE3 and apoE4. Figure from [71].
Swedish double mutation, or APPSwe (K670N/M671L), is located at the β-cleavage site and favors β-
secretase activity, leading to an increment in Aβ production. Mutations within the Aβ region are reported
to be highly amyloidogenic, triggering an increase in Aβ accumulation within nervous tissue and/or in the
blood vessels walls: Flemish (A692G) and Dutch (E693Q) mutations are involved in CAA, whereas Arctic
mutation (E693G) causes an aggressive Aβ aggregation despite the lower Aβ42:Aβ40 ratio exhibited. In
contrast, the variety of mutations described close to the γ-cleavage site does not increase the total Aβ,
but promote the more toxic Aβ42 species relative to Aβ40. London (V717I) and Indiana (V717F) are the
most prevalent ones, although many others have been reported such as Florida (I716V), French (V715M),
German (V715A) and Austrian (T714I).
B A
C
D

Introduction
17
Mutations in the PSEN1/PSEN2 genes
PSEN1 and PSEN2 are located on the chromosome 14 and 1, respectively. Since both presenilins may
conform the catalytic core of the γ-secretase complex, γ-secretase activity is directly altered by mutations
in any of them. Mutations in PSEN1 are the most common cause of FAD. Some of the typical mutations,
such as M146V, M146L, L286V, and ΔE9 promote the higher Aβ42 generation relative to the other Aβ
species. Interestingly, the loss of other essential functions of PS1, instead of its role in APP processing,
may better explain neurodegeneration and dementia in some particular cases of AD (Figure 6C) [72].
4.2. Sporadic AD
Parallel to the evolution of the AD physiopathology conception from the ACH to the multifactorial
complexity, more other genes implicated in AD-associated pathways have been identified as potential risk
factors (Figure 7) [73].
APOE
APOE gene, which encodes the lipid/cholesterol carrier apoE, is the only well-established locus that
affects the risk of developing LOAD [74]. ApoE exists in three isoforms (E2, E3 and E4) encoded by three
alleles (ε2, ε3 and ε4), which have a worldwide frequency of 8.4%, 77.9% and 13.7%, respectively.
However, the frequency of the ε4 allele is dramatically increased to ~40% in AD patients [75]. ApoE
structure consists of two separate N-terminal and C-terminal domains joined by a flexible hinge region.
The N-terminal domain constitutes the receptor-binding region whereas the C-terminal domain the lipid-
binding region. Isoforms derived from the three alleles differ only at positions 112 and/or 158: the
prevalent apoE3 contains cysteine at position 112 and arginine at 158, while apoE2 contains cysteine at
both positions and apoE4 contains arginine at both sites (Figure 6D) [76]. Variations among isoforms alter
its structural folding and its ability to bind lipids, what in turn modifies the affinity for both Aβ and
receptors [77]. It is well established that apoE4 is the isoform that predisposes to suffer AD, although the
exact contribution is still under research: its influence on the apoE/LRP1-mediated Aβ clearance is widely
accepted [78], but there is evidence that it also plays a pivotal role in other AD-related processes, such as
oxidative stress response [79], synaptic loss [80], and Aβ oligomerization [81].
Interestingly, high-throughput genotyping analyses have evidenced the involvement of some other genes
in AD. For instance, APOJ (also known as CLU), CR1, PICALM, BIN1, ABCA7 and CD33 are recognized as
new genetic determinants, and different genome-wide association studies (GWAS) are working on them
[82, 83]. The proteins encoded by these newly identified genes are involved in lipid metabolism, immune
response, and vesicle formation and trafficking among others [84].
Introduction
18
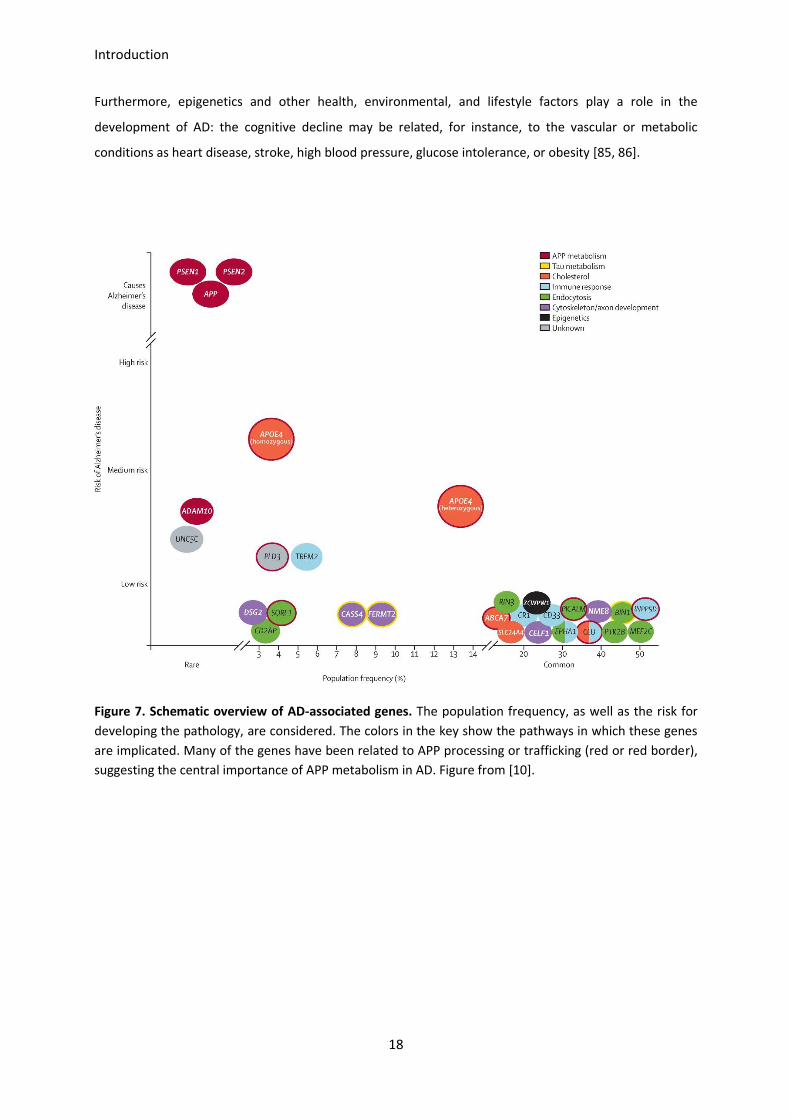
Furthermore, epigenetics and other health, environmental, and lifestyle factors play a role in the
development of AD: the cognitive decline may be related, for instance, to the vascular or metabolic
conditions as heart disease, stroke, high blood pressure, glucose intolerance, or obesity [85, 86].
Figure 7. Schematic overview of AD-associated genes. The population frequency, as well as the risk for
developing the pathology, are considered. The colors in the key show the pathways in which these genes
are implicated. Many of the genes have been related to APP processing or trafficking (red or red border),
suggesting the central importance of APP metabolism in AD. Figure from [10].
Introduction
19
5. MODELING AD
Animal models have become an essential tool for understanding the mechanistic of AD and, therefore, for
the testing of therapeutic strategies in a manner that could not be done in humans. The major
requirement of an animal model is to reproduce, as accurately as possible, human pathophysiology.
Hence, according to the way in which the pathophysiology is caused, three types of models exist [87]: (I)
the spontaneous models, since non-human primates may spontaneously develop amyloid-β accumulation
and tau hyperphosphorylation [88], (II) the interventional ones, consisting in the administration of
chemical substances into the brain or the induction of lesions in specific regions, and (III) the genetically
modified models.
The fast advances in genetic engineering, in addition to the disadvantageous factors of the spontaneous
and interventional models (such as the low reproductive output or the relatively long lifespan, and the
improper evolution of the pathology, respectively) drove up to the generation of transgenic animals [89].
Mice are the major species for transgenic modeling because their short lifespan, the relatively low costs,
and the well-established procedures for genetic modification [88]. Transgenic technology is also
developed in rats, whose physiological and genetic features are closer to humans than mice. Besides, rats
present a more accurate motor coordination and a richer behavior than mice, and are experimentally
easier to be manipulated because of their larger body and brain dimensions. However, technical barriers
have been continuously slowing down transgenesis development in rats, making tools for genome
manipulation less available than for mice [90].
Modeling the human AD in animals is being a very challenging process. Rodents do not develop AD. The
normal in vivo concentration of Aβ in the rodent brain has been estimated to be in the picomolar range,
whereas it may reach nanomolar concentrations in AD’s human brain [91]. Rodent Aβ differs from human
Aβ only in three substitutions (R5G, Y10F, H13R), but these are likely to be enough to prevent amyloid
aggregation. Therefore, the introduction of FAD human genes is mandatory to model the pathology in
mouse. Pronuclear injection and gene-targeted replacement are the two main strategies are widely used
in the generation of transgenic organisms [92–94].
Otherwise, the pathophysiology reproduced by transgenic mice does not exclusively result from the
specific isoforms and/or pathogenic mutations incorporated, but additional determinants regulate its
onset and development, such as the promoters accompanying the introduced gene, which modulate
levels and distribution pattern of protein expression, or the genetic background, because of the host’s
genome influence on the manifestation of the transgenes. For example, background-specific features in
Introduction
20
vision or hearing may alter the activity or anxiety measurements in behavioral testing. Also, biological
responses to excitotoxicity, inflammation and neurodegeneration, as well as the learning and memory
abilities, are strain-dependent.
5.1. Current transgenic mice
A wide variety of transgenic mice lines are currently in use, the major part of which contain mutations in
FAD-related genes and express phenotypes based on the amyloid pathology. Nonetheless, the tau
pathology has also been emulated by including tauP301L mutation from frontotemporal dementia with
Parkinsonism (FTDP) [95], since no tau mutation has been found in the AD. As well, the human
pathogenic-prone allele APOE Ɛ4 [96], and other AD-related transgenes such as those displaying insulin
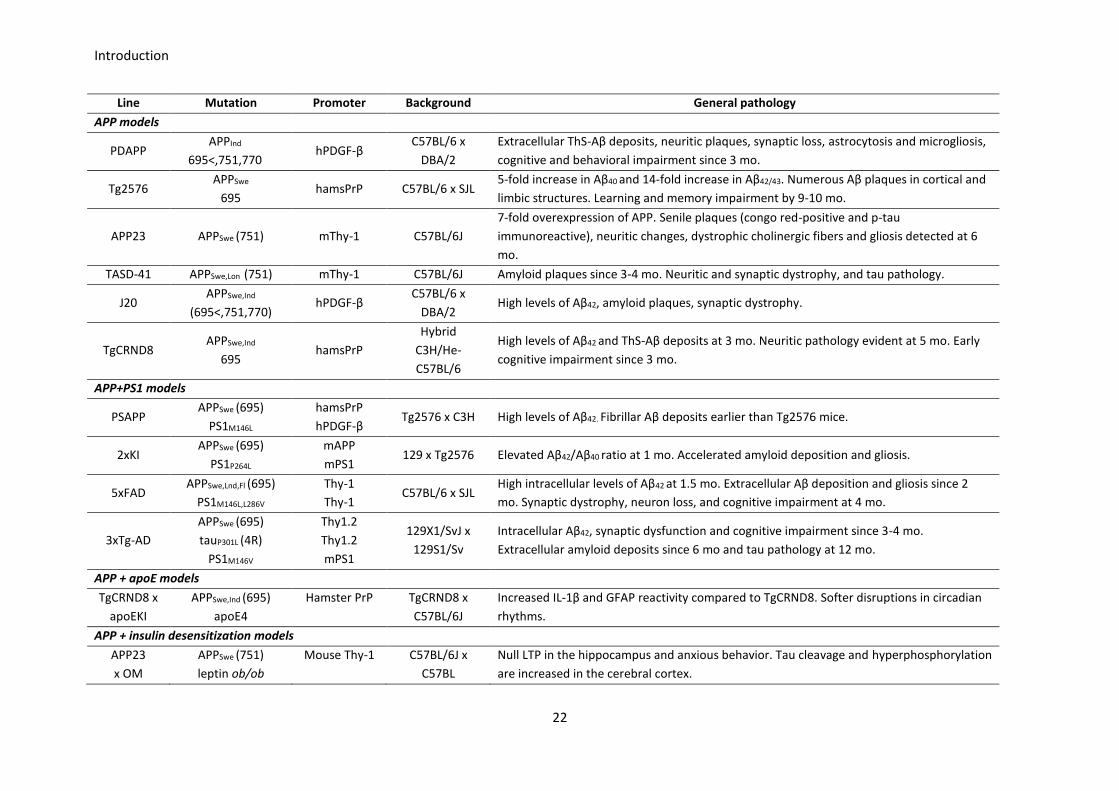
desensitization, have been used in the most novel AD modeling. Table 2 summarizes the key features of
the most significant transgenic mice used in AD research, from the first transgenic AD mouse model,
containing the APPInd mutation (PDAPP, from Platelet-Derived APP, since the PDGF promoter is driven the
expression of APPInd) [97], to the generation of bi- and trigenic mice to enhance the pathology, either by
combining mutations as APP+PSEN1 [96] and APP+PSEN1+MAPT [98], or by combining FAD mutations and
SAD genetic risk factors [99, 100]. An extensive and updated overview of all kind of mouse models used in
AD research is presented in the Alzforum webpage [101].
5.2. The 3xTg-AD mouse model
Triple-transgenic mouse model of Alzheimer’s disease (3xTg-AD) was initially engineered at the University
of California, Irvine, by introducing APPSwe and MAPTP301L transgenes into a PS1M146V homozygous knock-in
single-cell embryo (Figure 8) [98, 102]. APPSwe and PS1M146V are mutations found in familial AD, and
MAPTP301L mutation is associated with a familial form of frontotemporal dementia rather than AD.
Specifically, the strategy used in the engineering of the 3×Tg-AD mouse consisted on the co-
microinjection of two independent transgene constructs encoding human APPSwe and tauP301L (4R/0N),
both under the control of the mouse Thy1.2 promoter, into single-cell embryos harvested from mutant
homozygous PS1M146V knocking mice. The injected embryos were implanted into foster mothers and 3xTg-
AD mice were identified and selected from the resulting offspring.

Introduction
21
Figure 8. Strategy used in the engineering of the 3xTg-AD mouse model. Pronuclear co-injection of
APPSwe and MAPTP301L transgenes into a PS1M146V homozygous knock-in single-cell embryo. Figure
published in [98].
Introduction
22
Line Mutation Promoter Background General pathology
APP models
PDAPP APPInd
695<,751,770 hPDGF-β
C57BL/6 x
DBA/2
Extracellular ThS-Aβ deposits, neuritic plaques, synaptic loss, astrocytosis and microgliosis,
cognitive and behavioral impairment since 3 mo.
Tg2576 APPSwe
695 hamsPrP C57BL/6 x SJL
5-fold increase in Aβ40 and 14-fold increase in Aβ42/43. Numerous Aβ plaques in cortical and
limbic structures. Learning and memory impairment by 9-10 mo.
APP23 APPSwe (751) mThy-1 C57BL/6J
7-fold overexpression of APP. Senile plaques (congo red-positive and p-tau
immunoreactive), neuritic changes, dystrophic cholinergic fibers and gliosis detected at 6
mo.
TASD-41 APPSwe,Lon (751) mThy-1 C57BL/6J Amyloid plaques since 3-4 mo. Neuritic and synaptic dystrophy, and tau pathology.
J20 APPSwe,Ind
(695<,751,770) hPDGF-β
C57BL/6 x
DBA/2 High levels of Aβ42, amyloid plaques, synaptic dystrophy.
TgCRND8 APPSwe,Ind
695 hamsPrP
Hybrid
C3H/He-
C57BL/6
High levels of Aβ42 and ThS-Aβ deposits at 3 mo. Neuritic pathology evident at 5 mo. Early
cognitive impairment since 3 mo.
APP+PS1 models
PSAPP APPSwe (695)
PS1M146L
hamsPrP
hPDGF-β Tg2576 x C3H High levels of Aβ42. Fibrillar Aβ deposits earlier than Tg2576 mice.
2xKI APPSwe (695)
PS1P264L
mAPP
mPS1 129 x Tg2576 Elevated Aβ42/Aβ40 ratio at 1 mo. Accelerated amyloid deposition and gliosis.
5xFAD APPSwe,Lnd,Fl (695)
PS1M146L,L286V
Thy-1
Thy-1 C57BL/6 x SJL
High intracellular levels of Aβ42 at 1.5 mo. Extracellular Aβ deposition and gliosis since 2
mo. Synaptic dystrophy, neuron loss, and cognitive impairment at 4 mo.
3xTg-AD
APPSwe (695)
tauP301L (4R)
PS1M146V
Thy1.2
Thy1.2
mPS1
129X1/SvJ x
129S1/Sv
Intracellular Aβ42, synaptic dysfunction and cognitive impairment since 3-4 mo.
Extracellular amyloid deposits since 6 mo and tau pathology at 12 mo.
APP + apoE models
TgCRND8 x
apoEKI
APPSwe,Ind (695)
apoE4
Hamster PrP
TgCRND8 x
C57BL/6J
Increased IL-1β and GFAP reactivity compared to TgCRND8. Softer disruptions in circadian
rhythms.
APP + insulin desensitization models
APP23
x OM
APPSwe (751)
leptin ob/ob
Mouse Thy-1
C57BL/6J x
C57BL
Null LTP in the hippocampus and anxious behavior. Tau cleavage and hyperphosphorylation
are increased in the cerebral cortex.
Introduction
23
Table 2. Representative mouse models of AD. Specific mutations, isoforms and promoters driving their
expression, as well as the genetic background and the overall pathogenic features described. Table
adapted from [71].
This model reproduces the amyloid and tau pathologies through similar regional- and temporal-
patterns [98, 102], with Aβ appearing first in the cerebral cortex and then spreading out to the
hippocampus. A detailed description of the amyloid pathology progression through the primary
motor cortex, amygdala, CA1 region from the hippocampus (Cornus Ammonis), and entorhinal
cortex from 3xTg-AD males showed that intracellular Aβ accumulation is already evident at very
early stages (~3 mo), whereas extracellular Aβ accumulation appears at the late stages of the
disease (~18 mo) [103]. In females, intracellular Aβ was already detected at 3 weeks of age in the
CA1 [104].
Intracellular amyloid pathology in 3xTg-AD is also directly related to the onset of cognitive and
behavioral impairments [105], which have been widely assessed in this model [106]. Cognitive
impairment starts at a young age: associative learning deficits are first detected at 3-5 months old,
impairments in spatial working memory are observed in the Morris water maze (MWM) paradigm
at 6 months of age, deficits in recognition memory are described at 9-11 months old, and reference
memory impairment in the Barnes maze task is seen at 12 months of age [107]. As well,
emotional/behavioral alterations in the 3xTg-AD mice occur at early ages: alterations in the
exploratory activity are first detected in the open-field test (OFT) at 2.5 months old (at older ages in
the corner test, CT), lower habituation to the novelty and uninhibited behavior are described at 6
months old, neophobia was observed at 12 months old, and increased emotionality is observed in
most of the tests at adulthood and elderly [108].
6.1. Recombinant antibodies engineering
Recombinant antibody fragments have emerged as reliable alternatives to the full-length
antibodies (Figure 9) [109, 110]. These fragments retain the antigen-binding specificity of full-
length mAbs and contribute with other interesting properties such as the potential linkage to
therapeutic payloads (enzymes or liposomes among others). For instance, the singe-chain variable
fragment (scFv) consists of the VH and VL domains linked by a flexible polypeptide chain. ScFvs
tend to have shorter half-lives than the corresponding full-length mAb, but exhibit better tissue
distribution, penetration, and clearance properties [111]. The use of scFv instead of the full-length
mAb is considered safer because the lack of the crystallizable fraction (Fc), which is known to
activate microglia, with the subsequent secretion of an array of pro-inflammatory cytokines and
mediators [112, 113]. Likewise, because of the absence of the constant region, scFv molecules do
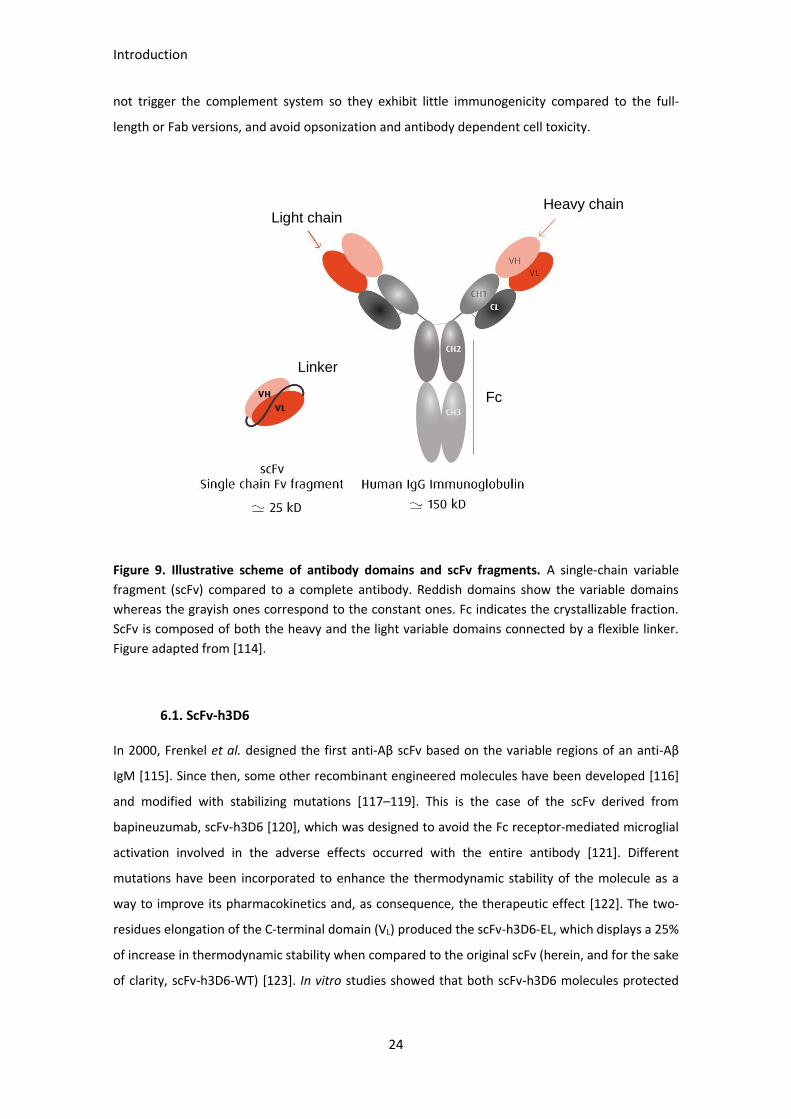
Introduction
24
not trigger the complement system so they exhibit little immunogenicity compared to the full-
length or Fab versions, and avoid opsonization and antibody dependent cell toxicity.
Figure 9. Illustrative scheme of antibody domains and scFv fragments. A single-chain variable
fragment (scFv) compared to a complete antibody. Reddish domains show the variable domains
whereas the grayish ones correspond to the constant ones. Fc indicates the crystallizable fraction.
ScFv is composed of both the heavy and the light variable domains connected by a flexible linker.
Figure adapted from [114].
6.1. ScFv-h3D6
In 2000, Frenkel et al. designed the first anti-Aβ scFv based on the variable regions of an anti-Aβ
IgM [115]. Since then, some other recombinant engineered molecules have been developed [116]
and modified with stabilizing mutations [117–119]. This is the case of the scFv derived from
bapineuzumab, scFv-h3D6 [120], which was designed to avoid the Fc receptor-mediated microglial
activation involved in the adverse effects occurred with the entire antibody [121]. Different
mutations have been incorporated to enhance the thermodynamic stability of the molecule as a
way to improve its pharmacokinetics and, as consequence, the therapeutic effect [122]. The two-
residues elongation of the C-terminal domain (VL) produced the scFv-h3D6-EL, which displays a 25%
of increase in thermodynamic stability when compared to the original scFv (herein, and for the sake
of clarity, scFv-h3D6-WT) [123]. In vitro studies showed that both scFv-h3D6 molecules protected
Fc
Heavy chain Light chain
Linker
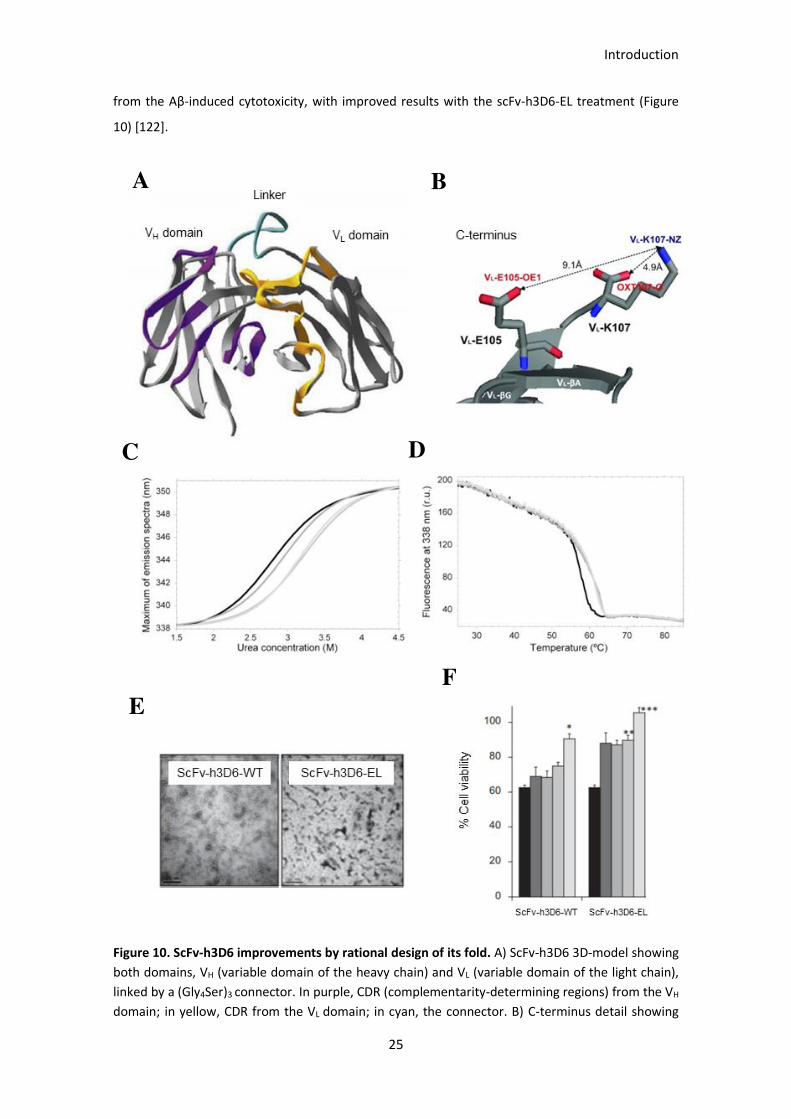
Introduction
25
from the Aβ-induced cytotoxicity, with improved results with the scFv-h3D6-EL treatment (Figure
10) [122].
Figure 10. ScFv-h3D6 improvements by rational design of its fold. A) ScFv-h3D6 3D-model showing
both domains, VH (variable domain of the heavy chain) and VL (variable domain of the light chain),
linked by a (Gly4Ser)3 connector. In purple, CDR (complementarity-determining regions) from the VH
domain; in yellow, CDR from the VL domain; in cyan, the connector. B) C-terminus detail showing
C
B
D
E F
A
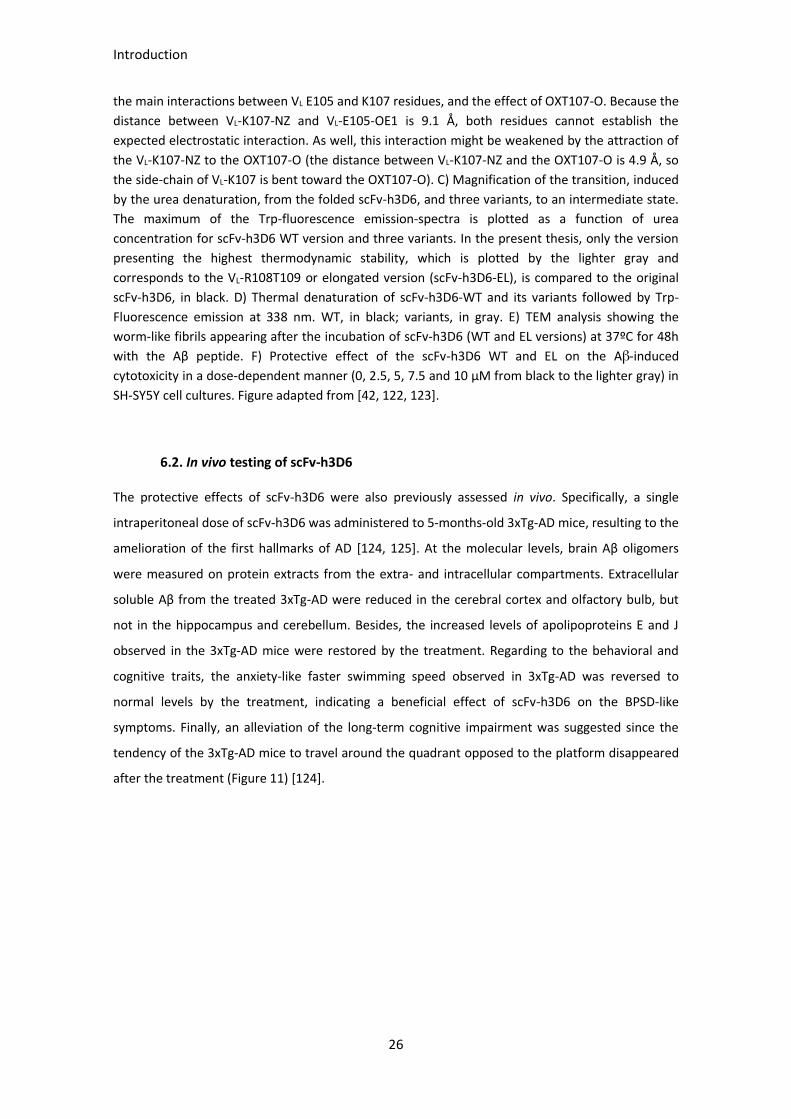
Introduction
26
the main interactions between VL E105 and K107 residues, and the effect of OXT107-O. Because the
distance between VL-K107-NZ and VL-E105-OE1 is 9.1 Å, both residues cannot establish the
expected electrostatic interaction. As well, this interaction might be weakened by the attraction of
the VL-K107-NZ to the OXT107-O (the distance between VL-K107-NZ and the OXT107-O is 4.9 Å, so
the side-chain of VL-K107 is bent toward the OXT107-O). C) Magnification of the transition, induced
by the urea denaturation, from the folded scFv-h3D6, and three variants, to an intermediate state.
The maximum of the Trp-fluorescence emission-spectra is plotted as a function of urea
concentration for scFv-h3D6 WT version and three variants. In the present thesis, only the version
presenting the highest thermodynamic stability, which is plotted by the lighter gray and
corresponds to the VL-R108T109 or elongated version (scFv-h3D6-EL), is compared to the original
scFv-h3D6, in black. D) Thermal denaturation of scFv-h3D6-WT and its variants followed by Trp-
Fluorescence emission at 338 nm. WT, in black; variants, in gray. E) TEM analysis showing the
worm-like fibrils appearing after the incubation of scFv-h3D6 (WT and EL versions) at 37ºC for 48h
with the Aβ peptide. F) Protective effect of the scFv-h3D6 WT and EL on the Aβ-induced
cytotoxicity in a dose-dependent manner (0, 2.5, 5, 7.5 and 10 µM from black to the lighter gray) in
SH-SY5Y cell cultures. Figure adapted from [42, 122, 123].
6.2. In vivo testing of scFv-h3D6
The protective effects of scFv-h3D6 were also previously assessed in vivo. Specifically, a single
intraperitoneal dose of scFv-h3D6 was administered to 5-months-old 3xTg-AD mice, resulting to the
amelioration of the first hallmarks of AD [124, 125]. At the molecular levels, brain Aβ oligomers
were measured on protein extracts from the extra- and intracellular compartments. Extracellular
soluble Aβ from the treated 3xTg-AD were reduced in the cerebral cortex and olfactory bulb, but
not in the hippocampus and cerebellum. Besides, the increased levels of apolipoproteins E and J
observed in the 3xTg-AD mice were restored by the treatment. Regarding to the behavioral and
cognitive traits, the anxiety-like faster swimming speed observed in 3xTg-AD was reversed to
normal levels by the treatment, indicating a beneficial effect of scFv-h3D6 on the BPSD-like
symptoms. Finally, an alleviation of the long-term cognitive impairment was suggested since the
tendency of the 3xTg-AD mice to travel around the quadrant opposed to the platform disappeared
after the treatment (Figure 11) [124].
Introduction
27
Figure 11. Beneficial effects of scFv-h3D6 in vivo. A) Immunoblotting profiles for 3xTg-AD mice of
extracellular soluble Aβ oligomers in the cerebral cortex showed a clear decrease of the
dodecameric, nonameric, hexameric and trimeric Aβ-species upon treatment (squared). B)
Significant increase in the hippocampal and cortical apoE levels, and in the cortical apoJ levels, from
3xTg-AD mice, and the scFv-h3D6-mediated recovery. Determinations from protein extracts
performed by ELISA. C) Fast swimming speed in the 3xTg-AD mice, and the recovery by the
treatment. D) 3xTg-AD mice significantly preferred the opposed quadrant (to the platform), but the
treatment reduced its significance. Figure adapted from [126].
A
C
D
B

28

29
AIMS

30

Aims
31
Because the emotional, social and economic impact of Alzheimer’s disease (AD) in our society,
global resources are focused on the searching of a treatment to fight this devastating disease. The
understanding of how this pathology works has become an essential to go ahead with the finding
of a cure. In this scenario, the present thesis consists on the further understanding of AD
physiopathology by characterizing some treats of the 3xTg-AD mouse model, as well as on the
pharmacological testing of the anti-Aβ single-chain variable fragment scFv-h3D6. The specific aims
were the following:
1- To describe the 3xTg-AD mouse model in terms of intracellular Aβ pathology and its
relationship with the demise of specific neuron populations.
2- To analyze the behavioral and cognitive alterations in young 3xTg-AD females.
3- To investigate the effect of a single intraperitoneal dose of scFv-h3D6 on those parameters
mentioned in aims 1-2, in combination with a preliminary study on the inflammatory response
in both the central and peripheral nervous systems.
4- To describe the pharmacokinetic profile of scFv-h3D6, and its best thermodynamically
stabilized variant, to gain light on the mechanism underlying the protective effect of scFv-h3D6
with the final aim of contributing to a suitable treatment design.
5- To longitudinally study the behavioral and cognitive abilities of young 3xTg-AD females from 5
to 9 months of age in comparison to gender- and age-matched non-transgenic animals.
6- To test the combined effect of the chronic administrations of scFv-h3D6 and aging on the
functional response, considering the extent of habituation and cognitive stimulation performed
during the study.

32

33
METHODOLOGY

34
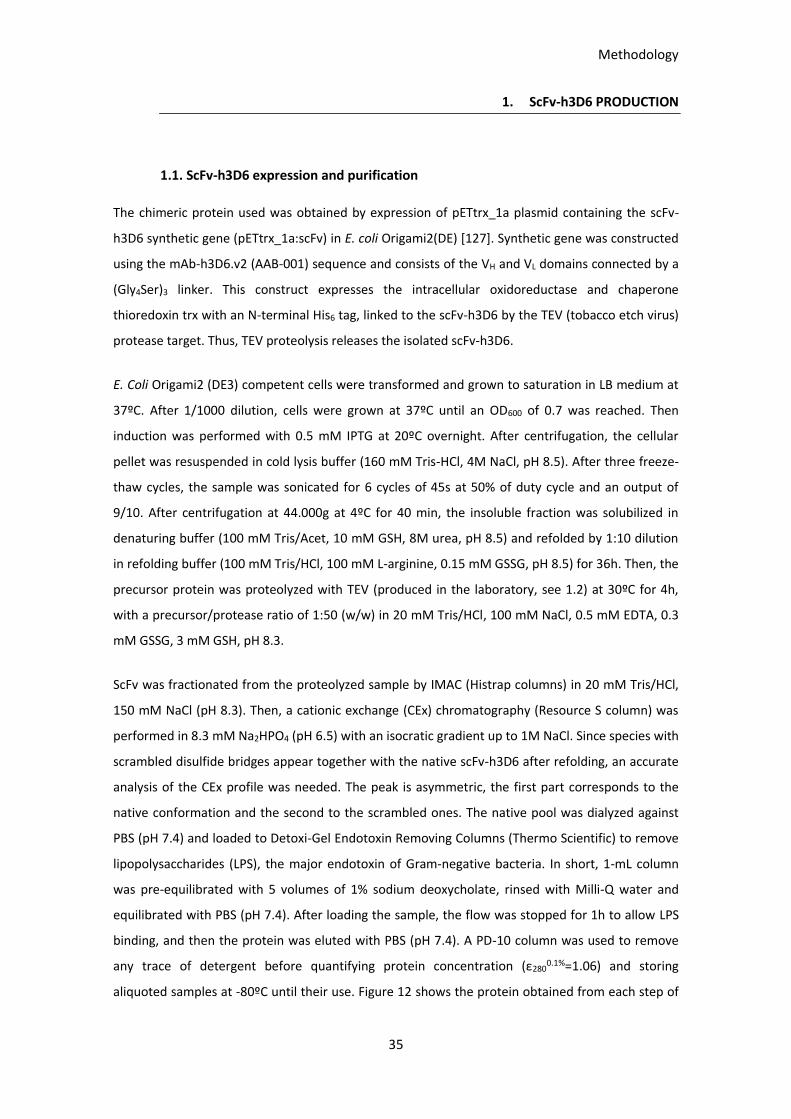
Methodology
35
1. ScFv-h3D6 PRODUCTION
1.1. ScFv-h3D6 expression and purification
The chimeric protein used was obtained by expression of pETtrx_1a plasmid containing the scFv-
h3D6 synthetic gene (pETtrx_1a:scFv) in E. coli Origami2(DE) [127]. Synthetic gene was constructed
using the mAb-h3D6.v2 (AAB-001) sequence and consists of the VH and VL domains connected by a
(Gly4Ser)3 linker. This construct expresses the intracellular oxidoreductase and chaperone
thioredoxin trx with an N-terminal His6 tag, linked to the scFv-h3D6 by the TEV (tobacco etch virus)
protease target. Thus, TEV proteolysis releases the isolated scFv-h3D6.
E. Coli Origami2 (DE3) competent cells were transformed and grown to saturation in LB medium at
37ºC. After 1/1000 dilution, cells were grown at 37ºC until an OD600 of 0.7 was reached. Then
induction was performed with 0.5 mM IPTG at 20ºC overnight. After centrifugation, the cellular
pellet was resuspended in cold lysis buffer (160 mM Tris-HCl, 4M NaCl, pH 8.5). After three freeze-
thaw cycles, the sample was sonicated for 6 cycles of 45s at 50% of duty cycle and an output of
9/10. After centrifugation at 44.000g at 4ºC for 40 min, the insoluble fraction was solubilized in
denaturing buffer (100 mM Tris/Acet, 10 mM GSH, 8M urea, pH 8.5) and refolded by 1:10 dilution
in refolding buffer (100 mM Tris/HCl, 100 mM L-arginine, 0.15 mM GSSG, pH 8.5) for 36h. Then, the
precursor protein was proteolyzed with TEV (produced in the laboratory, see 1.2) at 30ºC for 4h,
with a precursor/protease ratio of 1:50 (w/w) in 20 mM Tris/HCl, 100 mM NaCl, 0.5 mM EDTA, 0.3
mM GSSG, 3 mM GSH, pH 8.3.
ScFv was fractionated from the proteolyzed sample by IMAC (Histrap columns) in 20 mM Tris/HCl,
150 mM NaCl (pH 8.3). Then, a cationic exchange (CEx) chromatography (Resource S column) was
performed in 8.3 mM Na2HPO4 (pH 6.5) with an isocratic gradient up to 1M NaCl. Since species with
scrambled disulfide bridges appear together with the native scFv-h3D6 after refolding, an accurate
analysis of the CEx profile was needed. The peak is asymmetric, the first part corresponds to the
native conformation and the second to the scrambled ones. The native pool was dialyzed against
PBS (pH 7.4) and loaded to Detoxi-Gel Endotoxin Removing Columns (Thermo Scientific) to remove
lipopolysaccharides (LPS), the major endotoxin of Gram-negative bacteria. In short, 1-mL column
was pre-equilibrated with 5 volumes of 1% sodium deoxycholate, rinsed with Milli-Q water and
equilibrated with PBS (pH 7.4). After loading the sample, the flow was stopped for 1h to allow LPS
binding, and then the protein was eluted with PBS (pH 7.4). A PD-10 column was used to remove
any trace of detergent before quantifying protein concentration (ε2800.1%=1.06) and storing
aliquoted samples at -80ºC until their use. Figure 12 shows the protein obtained from each step of
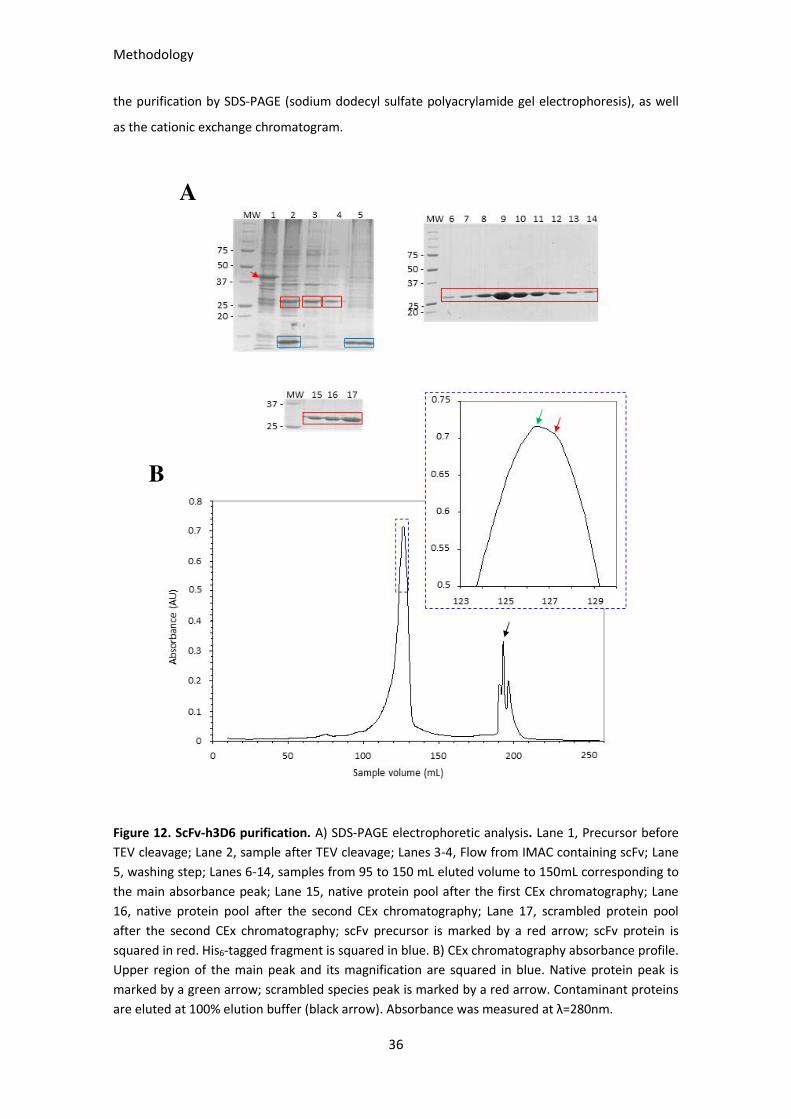
Methodology
36
the purification by SDS-PAGE (sodium dodecyl sulfate polyacrylamide gel electrophoresis), as well
as the cationic exchange chromatogram.
Figure 12. ScFv-h3D6 purification. A) SDS-PAGE electrophoretic analysis. Lane 1, Precursor before
TEV cleavage; Lane 2, sample after TEV cleavage; Lanes 3-4, Flow from IMAC containing scFv; Lane
5, washing step; Lanes 6-14, samples from 95 to 150 mL eluted volume to 150mL corresponding to
the main absorbance peak; Lane 15, native protein pool after the first CEx chromatography; Lane
16, native protein pool after the second CEx chromatography; Lane 17, scrambled protein pool
after the second CEx chromatography; scFv precursor is marked by a red arrow; scFv protein is
squared in red. His6-tagged fragment is squared in blue. B) CEx chromatography absorbance profile.
Upper region of the main peak and its magnification are squared in blue. Native protein peak is
marked by a green arrow; scrambled species peak is marked by a red arrow. Contaminant proteins
are eluted at 100% elution buffer (black arrow). Absorbance was measured at λ=280nm.
A
B
Methodology
37
1.2. TEV expression and purification
E. coli C41 competent cells were transformed with the pMHTΔ238:TEV construct and grown to
saturation in LB medium at 37ºC. After 1/1000 dilution, cells were grown at 37ºC until an OD600 of
0.7 was reached. Then induction was performed with 0.5 mM IPTG at 20ºC for 4h. Isolation of the
soluble fraction was performed as mentioned for scFv-h3D6 production (Section 3.2) and TEV
protease was bound to an IMAC (Histrap columns) in 20 mM Na2HPO4, 500 mM NaCl, pH 7.5).
Sample was eluted at 100% of elution buffer (20 mM Na2HPO4, 350 mM NaCl, 500 mM Imidazol, pH
7.5). Fractions of 2.5 mL were collected and analyzed by SDS-PAGE electrophoresis (12 %) to pool
those corresponding to the fractions with the protein and measure its concentration (ε2800.1%=1.38).
The buffer was changed through a PD-10 column to digestion buffer (20 mM Tris-HCl, 150 mM
NaCl, pH 7.3) plus 10% Glycerol before storing.
1.3. Verification of disulfide configuration
To ensure the native conformation of the obtained protein, the configuration of its disulfide
bridges was checked by limited proteolysis and MALDI-TOF-MS in the SePBioEs, the Proteomics
facility from Universitat Autònoma de Barcelona (UAB). In brief, 30 µL of protein were partially
denatured with 4M urea (30 µL of sample +15 µL 4M urea), 2h at 30˚C. Then, the sample was
digested with 800 ng of trypsin in 25 µL of ammonium bicarbonate 0.1M for 4h at 30˚C, and MALDI-
TOF analysis was performed. Then, sample was reduced with DTT (2 µL of sample + 1 µL de DTT
0.5M + 7 µL H2O) for 1h at RT and MALDI-TOF analysis was performed again.
Besides, the protein mass was also verified by using mass spectrometry. Samples were dialyzed by
drop dialysis: 2 µL of sample were dialyzed against 20 mL of 50 mM for 30 min at RT using a 0.025
µm pore membrane (Millipore). Then, samples were diluted 1/5 with milliQ H2O. For MALDI-TOF
analysis, samples were mixed 1:1 sample:matrix (2,6-dihidroxiacetophenone acid (DHAP)) and 1 µL
of sample was deposited onto a ground steel plate. Samples were analyzed using a lineal method
and an accelerating voltage of 25kv. All the analyses were calibrated using external references
(Bruker Daltonics).
Methodology
38
2. ANIMALS
2.1. Mice hosting
The Protein Folding & Stability group stablished a 3xTg-AD mice colony at the Servei d’Estabulari
from the UAB, in parallel to the one corresponding to non-transgenic mice (NTg), with the same
genetic background B6129SF2. Founder animals were provided by The Jackson Laboratory (Bar
Harbor, ME, USA). Because females exhibit greater Aβ burden and larger behavioral deficits than
age-matched males, the whole research project was performed by using females [128]. Most of the
experiments were performed in 5-mo-old mice, except for the longitudinal study (Chapter 4), which
also started with 5-mo-old mice and was carried out up to their 9 months of age.
Animals were maintained under standard laboratory conditions: temperature of 22 ± 2ºC and
relative humidity of 55 ± 5%, 12h light:dark cycle starting at 08:00 a.m., wood chips for bedding and
food and water ad libitum. All the experiments were approved by the UAB Animal Research
Committee and the Government of Catalonia, and conducted in accordance with the legislation for
the protection of animals used for scientific purposes (directive 2010/63/EU).
2.2. Mice sacrifice and samples collection and processing
In those cohorts used for histological analyses (Chapters 1 and 2), animals were anesthetized by an
intraperitoneal injection of ketamine-xylazine mixture (87.5-12.5 mg/kg body weight, respectively,
in saline solution) to be, subsequently, transcardially perfused with 4% paraformaldehyde (Sigma-
Aldrich, Saint Louis, MO, USA). After that, mice were guillotined and brains were removed from
skulls, and rinsed in cold PBS to subsequently be immersed in the same fixative.
Alternatively, in those cohorts used for biochemical analyses in addition to the histological ones
(Chapters 2 and 3), animals were anesthetized by inhaling isoflurane 1%. Firstly, blood was
collected by cardiac puncture and supplemented with a complete proteases inhibitor cocktail
(Roche, Basel, Switzerland) and 1 mM EDTA to prevent degradation of proteins and coagulation.
Samples were centrifuged at 20230g for 10 min at 4ºC, the supernatant was carefully recovered to
avoid contamination from the interphase (white blood cells and platelets) and centrifuged again.
Finally, the supernatant was recovered and stored at -80ºC as blood plasma until its use.
Afterwards, mice were guillotined and dissected. Brains were removed from skulls, and spleen,
liver and kidneys were also collected, rinsed in cold PBS, weighted, and dissected in two halves:
Methodology
39
both hemispheres, two spleen-halves, two liver-halves, and both kidneys were separately
processed for histology and biochemical analyses.
Processing for biochemical analyses: Protein extracts
Cerebral hemispheres were mechanically disgregated in cold tissue homogenization buffer (TBS pH
7.6 supplemented with the proteases inhibitor cocktail and EDTA 1mM) by using a tissue
homogenizer (Sigma). After a brief sonication (1 cycle of 35s, at 35% duty cycle and output 4 in a
Dynatech Sonic Dismembrator ARTEK 300), samples were centrifuged at 100000g for 1h at 4ºC and
supernatant was stored as extracellular fraction at -80ºC until use. Pellet was suspended in lysis
buffer (1% Triton X-100 in homogenization buffer), equally sonicated and centrifuged, and
supernatant was stored as intracellular fraction at -80ºC until use.
Processing for histological analyses: Paraffin sections
Tissues were immersed in 4% paraformaldehyde for 36h at 4ºC. After that, samples were rinsed in
PBS, dehydrated by immersion in a battery of increasing concentrations of ethanol solutions (50%,
70%, 96%, 100%) and, as final steps, in xylene, 1:1 xylene:paraffin, and paraffin-embedded
following the regular procedures from our laboratory, being extremely careful with the orientation
of the encephalic structures to get the best anatomically matched sections. Brains were serially
sectioned at 10-µm-thick (cerebrum was serially sectioned in the coronal plane whereas the
cerebellum was cut in the sagittal plane), mounted on SuperfrostTM Plus Microscope Slides
(ThermoFisher Scientific) and stored at R.T. (room temperature) until use.
3. HISTOLOGICAL PROCEDURES
3.1. Histological staining and detections
Histochemistry
Hematoxylin-eosin [129] and cresyl violet staining [130] were carried out to evaluate tissue
cytoarchitecture and cellular quantification in some specific populations from the brain. Masson
trichrome staining [131] was used to discard fibrosis in the spleen, liver and kidneys. Lipid droplets
were observed by Sudan III staining [132] on cryo-preserved samples. PAS (periodic-acid Schiff)
reaction [133] was used to stain the renal tissue.

Methodology
40
Colorimetric histological immunodetection
Sections were deparaffined in xylene, hydrated in decreasing concentrations of ethanol solutions
and extensively washed in distilled water. Endogen peroxidase activity was blocked by placing the
slides in 3% H2O2 in methanol for 10 min. Antigen retrieval was performed by formic acid
immersion (70% in distilled water for 10 min) or by heating at 90ºC in sodium citrate buffer (10 mM
sodium citrate, 0.05% Tween-20, pH 6.0, also for 20 minutes) in a water-bath. Non-binding sites
were blocked using 5% bovine serum albumin in PBS containing 0.05% Tween-20 and 5% normal
goat serum at room temperature for 1h. Then, slides were incubated overnight at 4ºC with the
corresponding primary antibody (see Table 3) and revealed by the corresponding ExtrAvidin
Peroxidase Staining Kit antibody produced in goat and DAB (3-3’ Diaminobenzidine) (both products
provided by Sigma-Aldrich, Saint Louis, MO, USA). Finally, sections were immersed in hematoxylin
for 10s, extensively washed, dehydrated, immersed in xylene, and cover-slipped in DPX mounting
medium.
Dilution Source Cat.
Primary antibodies
Mouse anti-amyloid-β (1-16) (6E10) 1:100 Covance Signet SIG-39320
Rabbit polyclonal anti-NeuN 1:200 Merck Millipore ABN78
Rabbit polyclonal anti-neurofilament H 1:100 Merck Millipore ABN76
Rabbit polyclonal anti-calretinin 1:500 Merck Millipore AB5054
Rabbit polyclonal anti-GFAP 1:200 DAKO Z033401-2
Rabbit polyclonal anti-Iba1 1:100 Abcam AB108539
Goat polyclonal anti-Cathepsin D 1:100 Santa Cruz Biotech sc-6487
Rabbit polyclonal anti-scFv-h3D6-WT 1:100 Self-produced (SCAC) --
Secondary antibodies
Goat anti-rabbit IgG, FITC1,2 conjugated 1:1001 Chemicon, Millipore AP132F
Goat anti-mouse IgG, Cy3 conjugated 1:100 Chemicon, Millipore AP124C
Donkey anti-goat IgG, FITC conjugated 1:100 Jackson Immunores. 705-095-147
Anti-mouse DAB
Anti-rabbit DAB
Table 3. Primary and secondary antibodies used for immunofluorescence. List of primary and
secondary antibodies used for IF, working dilution, commercial source, and product reference.
Methodology
41
FITC, fluorescein isothiocyanate; Cy3, cyanine 3. 1 FITC-conjugated anti-rabbit secondary antibody
was used at 1:200 when anti-NeuN and anti-GFAP antibodies were immunodetected. 2 Part of the
studies presented in this thesis used the Alexa488 fluorophore instead of FITC.
Fluorescent histological immunodetection
Deparaffined sections were pre-treated by formic acid immersion for 10 min or heating at 90ºC in
sodium citrate buffer during 20 min for antigen retrieval, blocked and incubated overnight at 4ºC
with the specific primary antibody (as detailed in Table 3), except for the anti-neurofilament H and
the anti-cathepsin D mAbs that were incubated for 48h. Then, the corresponding fluorophore-
conjugated secondary antibody was incubated at room temperature for 1h. Finally, sections were
cover-slipped for microscopy observation using DAPI (4’,6-diamino-2-fenilindol)-containing
Vectashield (Vector Laboratories, Burlingame, CA, USA) solution, for fluorescent nuclei staining.
When double immunodetections were performed, both primary antibodies, as well as both
secondary ones, were incubated at a time.
3.2. Microscopy
Bright-field and epifluorescence microscopy
Photographic material was digitally captured by the ProgRes C10Plus color video camera coupled to
a Zeiss Axiosphot microscope (objective lens Plan-Neofluar from 2.5x to 63x) and performed with
ProgRes Capture Pro program (Jenoptik, Germany). Light source was the halogen lamp or the
fluorescence one, depending on the required visualization.
Confocal microscopy
Confocal imaging was performed by the spectral Fluoview-1000 (Olympus, Tokyo, Japan) at the
Servei de Microscòpia from UAB by capturing 5-10 optical sections, separated by 1 µm, with the
objective lens UPLSAO0 from 40x to 60x.
3.3. Image processing
Immunoreactivity signal measures
Fluorescence intensity was quantified on 8-bits images by using Image J software (v. 1.43 u, NIH,
Bethesda, MD, USA). In brief, 6E10 immunoreactivity was considered individually by manually
delimitating somas in each layer/region. When cells were arranged as dense rows or strips

Methodology
42
(granular cells from the olfactory bulb, hippocampus, and cerebellum), fluorescence intensity was
measured by delimitating in the complete cellular layer. In each photograph, background value was
subtracted from the intensity value measured.
Area immunoassayed by anti-GFAP or anti-Iba1 and DAB staining was quantified by turning the
images to a binary format once the background was subtracted, and normalized by its total area
(about 6-8 captures per animal).
Cell quantifications
All the analyzed populations are indicated in the Figure 13. Neuron counting in the main olfactory
bulb was focused in the olfactory granular cells (OGC) from the granular cell layer (GCL) as well as in
the mitral cells (MC). Additionally, the number of glomeruli was also quantified. Criteria for scoring
OGC included both morphological and staining properties. Small, darkly stained and densely packed
cells were considered as OGC. On the other hand, MC are arranged forming a monolayer, the mitral
cell layer (MCL), between the external plexiform layer and GCL, so they are easily recognized
because of their larger size and weak nuclei staining.
In the cerebral cortex, large neurons from the deep layers (V and VI) were detected by the anti-
heavy neurofilament (NFH) polypeptide antibody, which is a type of intermediate filament typically
restricted to neurons with a complex cytoskeletal structure such as the large pyramidal neurons
[134]. On the other hand, the anti-calretinin antibody was used as a marker of cortical
interneurons. Concretely, bipolar cells and double bouquet cells large basket cells are described as
calretinin-expressing cells, whereas Martinotti cells and bitufted cells only occasionally expresses
calretinin [135]).
Cell counting in the hippocampus was performed in the Cornus Ammonis (CA) and the dentate
gyrus (DG) separately. Specifically, the populations analyzed were the pyramidal neurons (PN) from
the stratum pyramidal of the hippocampal region I Cornus Ammonis (CA1), PNs of the hippocampal
region II and III Cornus Ammonis (CA2-3, combined) and the granular cells (GC) located in the
granular cell layer from the dentate gyrus. The limit between CA1 and CA2-3 was easily identified
because of two aspects: (I) CA1 pyramidal stratum is thinner than CA2-3, and (II) neurons size is
mildly smaller and is arranged in a more compacted manner.
Amygdalar cell quantification was restricted on the basolateral amygdalar (BLA) nucleus (which was
previously detected to be affected by the amyloid pathology) by considering only those large
NeuN-immunoreactive neurons.

Methodology
43
Three neuronal populations of the cerebellum were studied: granule cells (CGC) located in the
internal granular layer (IGL), and Purkinje cells (PC) settled in the Purkinje cell layer (PCL). Both
populations were assayed in two compartments of the cerebellar cortex, vermis and paravermis.
Criteria for counting cerebellar GC were the same of the olfactory bulb’ GCs. Besides, cells with a
large and clear nucleus, pear-shaped cell body and distinctive nucleolus were considered PCs.
Finally, the third cell population taken to account was deep cerebellar nuclei (DCN) macroneurons.
Their amount was separately determined at the level of the fastigial, the interpositus and the
dentate nuclei. Because DCN neurons can be categorized into small-diameter inhibitory neurons
(less than 12 µm) and large-diameter excitatory neurons (more than 12 µm) [136], only neurons
with a cell body bigger that 20 µm in diameter were recorded.
Finally, the total number of cells of each specific neuronal population was counted per section
(except for the granular cells from the olfactory bulb, dentate gyrus from the hippocampus and the
cerebellar cortex, which were counted in 5-8 representative fields per section). Areas occupied by
these populations (except for the cerebral cortex, in which the entire region area was considered)
were measured using AutoCAD program (Autodesk, U.S.) or Image J. In the case of MCL and PCL,
length was analyzed instead of the area. Then, quantifications were normalized by dividing the
number of cells by the corresponding area or length and results were expressed as cellular density
(cells/mm2 or neurons/mm). On the other hand, proportion of Aβ-containing cells were calculated
by counting 6E10-immunoreactive cells in relation to the total number of cells (expressed in
percentages).
All the measures and quantifications were replicated in 2-4 sections per animal (sections 40 µm
apart). Analyzed sections from the olfactory bulb corresponded to the coordinates of Figure 3
(interaural 7.36 mm and Bregma 3.55 mm) from Franklin and Paxinos [137]. The neocortex,
hippocampus and amygdala were examined in the range of coordinates between Figure 43
(interaural 2.34 mm and Bregma -1.46 mm) and Figure 48 (interaural 1.74 mm and Bregma -2.06
mm). In the case of the cerebellum, the sagittal sections analyzed corresponded to the coordinates
of Figure 107 (lateral 0.72 mm). Images were processed and assembled with Adobe Photoshop (v.
7.0, Adobe Inc., San Jose, CA, USA) or Imaris software (v. 7.2.1, Bitplane, Belfast, UK).

Methodology
44
Figure 13. Regions of the central nervous system analyzed. A) Sagittal panoramic section of a
mouse brain. The line at the left indicates the level in which the main olfactory bulb was analyzed
by coronal sections. The line at the right indicates the level in which the cerebral cortex,
hippocampus, and amygdala were analyzed. B) Coronal section of olfactory bulb: glomerular layer
(1), mitral cells layer (2), and granular cells layer (3). C) Cerebral coronal section: Cerebral cortex
(1), pyramidal cells layer on the region I (2) and II-III (3) from the Cornus Ammonis, and granular
cells layer from the dentate gyrus (4), in the hippocampus, and basolateral amygdalar nuclei (4). D)
Zoom in to the cerebellar region from the panoramic image at the level of the paravermis. Purkinje
neurons monolayer (1), adjacent to the granular cells layer (2), and deep cerebellar nuclei (3). Nissl
staining. Scale bars, 1 mm. Figure adapted from [138].
A
B C
D
Methodology
45
4. BIOCHEMICAL PROCEDURES
4.1. Hepatic enzymes determination
Concentration of aspartate and alanine transaminases (AST and ALT) in plasma were determined by
a commercial enzyme-coupled colorimetric assay kit (Roche Diagnostics). Absorbance was
measured in a Cobas c501/6000 analyzer. Values were normalized by the total amount of protein,
measured by the Pierce BCA Protein Assay Kit (ThermoFisher Scientific) in a Multilabel reader
Victor3 (Perkin Elmer, Turku, Finland) at 562 nm.
4.2. Tumor Necrosis Factor-alpha (TNFα) quantification
The levels of TNF-α (tumor necrosis factor-alpha) in the hippocampal lysate were determined by
commercial enzyme-linked immunosorbent assay (ELISA) DuoSet kit (R&D Systems, Minneapolis,
MN, USA, ref. DY410-05, lot. P116663). Absorbance was measured in a Multilabel reader Victor3
(Perkin Elmer, Turku, Finland). Because of wavelength correction was not available, readings at 540
nm were subtracted from readings at 450 nm.
4.3. Soluble Aβ42 quantification
Levels of Aβ42 were quantified by the commercial Amyloid beta 42 ELISA kit for Mouse (Invitrogen).
Procedure was performed according to the manufacturer’s protocol. Absorbance was measured at
450 nm in a Multilabel reader Victor3 (Perkin Elmer, Turku, Finland). Data obtained was normalized
by the total amount of protein in each extract, as measured by BCA assay (Pierce).
4.4. ScFv-h3D6 quantification
Anti-scFv-h3D6 antibody production
Anti-scFv-h3D6 polyclonal antibodies were produced by the Servei de Cultius Cel·lulars, Producció
d’Anticossos i Citometria (SCAC) from the UAB. Two rabbits (New Zealand) were intradermically
immunized with 400 μg of scFv-h3D6 protein conjugated with Freund’s complete adjuvant. After
the first immunization, rabbits were administered by three booster injections (21 days between
immunizations) with 300 μg of scFv-h3D6 protein but using Freund’s incomplete adjuvant instead,
and a sample of blood was taken to monitor serum specific antibodies levels by ELISA. Total rabbit
Methodology
46
sera were collected after the fifth immunization and anti-scFv-h3D6 antibodies were titrated by
standard immunoassay procedures from the SCAC.
Detection of specific antibodies
An immunoassay ELISA was standardized to detect specific antibodies for scFv-h3D6 protein (Figure
14). Briefly, all sera were analyzed using 96 well polystyrene plates (Ref 442404 Maxisorp, NUNC,
Labclinics, Spain) coated with scFv-h3D6 diluted in 0.1M carbonate buffer pH 9.6. ELISA plates were
incubated with several sera dilutions for 90 minutes, and after washes, an anti-rabbit IgG
conjugated to peroxidase (Ref 170-6515, BioRad, Spain) were added to detect the antigen-antibody
complexes. ELISA were revealed using OPD substrate (Ref P9187, Sigma Aldrich, Spain) and
absorbance were read in a Multilabel reader Victor3 (Perkin Elmer, Turku, Finland) at 450 nm.
Indirect competitive ELISA
96-well polystyrene plates were coated with scFv-h3D6 (10 ng per well of a 100 ng/ml dilution in
PBS pH 7.4) by an overnight incubation at 4ºC. After several washes with 0.1% Tween-20 in PBS,
plates were blocked with 1% BSA in PBS for 30 min at 37ºC and washed again for the subsequent
samples addition. Blood plasma and protein extracts from the extra- and intracellular brain
fractions had been previously incubated with the primary antibody anti-scFv-h3D6 (produced in the
SCAC from UAB, 1:75000, 1h at 37ºC). After 1h of incubation at 37ºC and several washes, bound
primary antibody was detected by incubating with an anti-rabbit IgG peroxidase-conjugated
(BioRad, Spain, 1:2000) for 1h at 37ºC and revealed with the OPD (o-phenylenediamine
dihydrochloride)-Fast substrate (Sigma-Aldrich). Absorbance was read in a Multilabel reader
Victor3 (Perkin Elmer, Turku, Finland) at 450 nm.
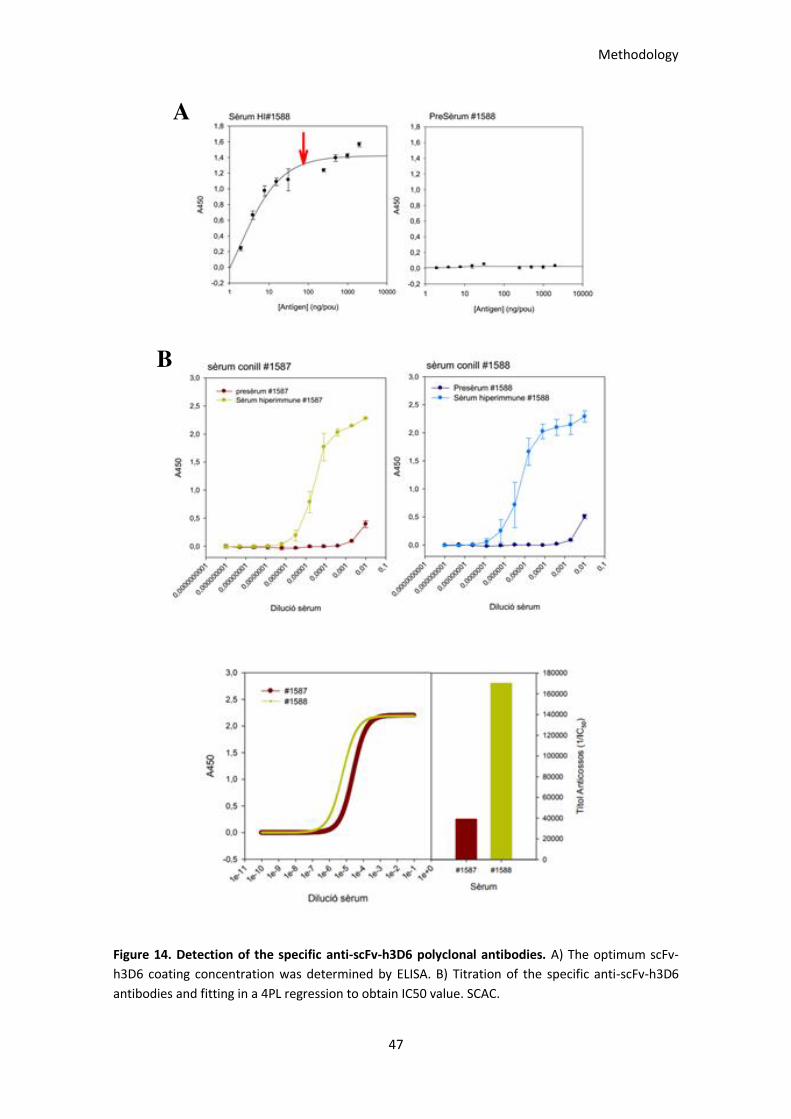
Methodology
47
Figure 14. Detection of the specific anti-scFv-h3D6 polyclonal antibodies. A) The optimum scFv-
h3D6 coating concentration was determined by ELISA. B) Titration of the specific anti-scFv-h3D6
antibodies and fitting in a 4PL regression to obtain IC50 value. SCAC.
A
B
Methodology
48
5. BEHAVIORAL AND COGNITIVE TESTS
BPSD-like symptoms were appraised in the corner test (CT) and open-field test (OFT) by measuring
the exploratory activity (e.g. corner visits, rearings, distance traveled) and other behaviors (such as
self-groomings or differences in the central/peripheral occupancy rates). Recognition memory was
evaluated by the specificity of the exploratory activity in the novel object recognition test (NORT)
and spatial long-term memory was evaluated by the final probe stage, after 5 days of training, in
the Morris Water Maze (MWM) paradigm. Tests were temporally sequenced on the basis of the
degree of stress in each test, with the most stressful ones at the end, starting with the CT and OFT,
following by the NORT and, finally, the MWM (Figure 15) [126].
All the tests were recorded by a digital USB camera (The Imaging Source, Germany) and video-
tracking was processed by ANY-maze software (v. 5.14, Stoelting Europe, Ireland). Rearings, self-
groomings and defecations from the CT and OFT were quantified, as well as the number of visits
and time visiting the objects in the NORT. All the material involved in the behavioral tests was
cleaned thoroughly with CR-36 (José Collado S.A.) between trials to ensure the absence of olfactory
cues.
5.1. Corner test
The CT was performed by placing the mice in a standard home-cage (makrolon, 22 x 22 x 14.5 cm)
for 30 seconds. Neophobia to the new home-cage was mainly evaluated by corner-related
parameters such as the number of corner visits, latency to the first corner visit. As well, the
exploratory activity (as distance traveled, and number of rearings and its latency) was also
considered.
5.2. Open-field test
The OFT consisted of an arena (white polyethylene, 42 x 42 x 50 cm) where the animals were
placed for 15 min [139]. Anxiety was measured by locomotor activity (total distance traveled across
time), as well as other behavioral patterns such as crossings through a central area virtually
delimited (number of entries, distance traveled in the center versus distance traveled in the
periphery, time in the center and time in the periphery), rearings (number of rearings and latency
at the first one), self-groomings (number of self-groomings and latency to the first one) and
number of defecations.

Methodology
49
5.3. Novel object recognition test
The NORT was performed in the same arena as the OFT, so no habituation was required. Animals
were familiarized to a couple of identic objects (A and A’) for 5 min, which was the familiarization
phase. Then, the recognition phase was assessed by exposing the animals to one of the familiar
objects (A) and to a novel one (B), also for 5 min. To properly evaluate short-term recognition
memory, the interval between familiarization and the recognition test was 15 min [140].
Exploratory behavior was considered as total explorations number, time exploring and distance
traveled. Recognition memory was evaluated as the preference of the animal to explore a familiar
or a novel object. Differences in the accumulated time exploring both objects were expressed by
the discrimination index (DI), calculated as (B-A)/(B+A). DI can vary between +1 and -1, with
positive values when the novel object is the preference, negative values when the familiar object is
the preference, and 0 when the preference in null [141, 142].
5.4. Morris water maze
The MWM paradigm assesses the hippocampal-dependent learning and memory by testing the
ability of mice to find a hidden platform in a pool full of opaque water (Ø 120 cm for the pool, Ø 11
cm for the platform, water stained with non-toxic white tempera) at 22-24ºC [143, 144]. The
paradigm comprises 3 phases: 1) Visible platform. The first day consisted in the visible platform
stage, in which the platform was highlighted by a colored flag for contrasting to the white water
and walls. Animals performed 4 trials to ensure that NTg mice realize of the platform existence
(inter-trial period of 10 min). 2) Acquisition phase. During the acquisition phase, the platform was
hidden ~5 mm under the water surface, and cues were added to make the spatial orientation
possible. This phase consisted in 4 trials per day, during 5 consecutive days, in which the animals
should reach the platform being oriented by the cues. Mice were manually guided to the platform
if they were unable to find it in 60s. Starting points were pseudo-randomly ordered to ensure
different sequences among stages/days. 3) Probe. The platform was removed for the final probe.
This phase consisted of 60s of navigation in absence of the platform, and was performed 24h after
the last acquisition stage to properly evaluate the long-term memory. Animals started from the
more distant point to the usual platform location.
The reversal test (included in the Chapter 4) consisted of acquisition and probe phases but
replacing the platform at different location. Once removed from the water, animals were located
under a heating lamp (red-light, 100W) to prevent hypothermia. Mean swimming speed and
distance traveled were measured across trials during the acquisition stages. Latency to the
platform, platform crossings and path efficiency, as well as time and distance traveled within a
Methodology
50
virtual zone centered on former platform location (normalized by areas), were measured in the
final probe.
Figure 15. Behavioral and cognitive tests. A) Corner test. The yellow square indicates one of the
four corners considered in the test. B) Open-field test. Painted area refers to the central area to the
field, which is separately considered from the peripheral area for specific measurements. C) Novel-
object recognition test. On the left, the familiarization phase (two identical objects). On the right,
the novel object recognition (one of the familial objects and a novel one). D) Morris water maze.
Visible platform stage consisted of four trials with different starting points for each (N, S, E, W,
randomly ordered). The yellow circle indicates the platform position. A colored flag on the platform
stood out against the white water and walls. During the acquisition phase, platform was hidden ~5
mm under the water surface, and cues were added to make the spatial orientation possible. This
phase consisted of four trials per stage/day during five consecutive stages/days. Starting points
were pseudo-randomly ordered to ensure different sequences among stages/days. Platform was
removed for the final probe, and it consisted in an only trial started from the opposite site of the
platform (so, SW, indicated with the yellow narrow). Reversal part of the test consisted of
acquisition and probe phases but replacing the platform at another location.
6. STATISTICS AND GRAPHICAL REPRESENTATION
Statistical differences among experimental groups were evaluated with the non-parametric Mann-
Whitney U-test (U-test) by using Graphpad Prism 6 (GraphPad Software, Inc., La Jolla, CA, USA). A
p-value lower than 0.05 was considered statistically significant. Generally, values are expressed by
medians with interquartile ranges, except for those parameters consisting in percentages or
proportions (manly in the Chapter 1 and 2) and those others considered over time (manly in the
Chapter 3 and 4), which are calculated and represented by means and SEM. Graphical
representation consisted of scatter plots (indicating the mean and standard error of the mean) in
those comparisons expressed over time, and box plots (showing all the data points, and indicating
the medians and the interquartile ranges) in those non-temporal comparisons. As well, a simple
linear regression analysis between the Aβ signal and the logarithm of neuron depletion was
performed.

Methodology
51
A B
C
D

52
53
CHAPTER 1
Intracellular Aβ/APP correlates with neurodegeneration
in those neuronal populations early involved in
Alzheimer’s disease

54
Chapter 1
55
AIMS
Intracellular accumulation of the Aβ peptide has been observed in brains from AD patients as well
as from several transgenic mice [145], some of which also display some extent of neuronal loss
[146, 147]. In the 3xTg-AD mouse model, intracellular amyloid pathology has been related to the
onset of cognitive and behavioral impairments [105, 106]. However, despite the extensive research
performed in this model, intracellular amyloid pathology has not been completely studied in terms
of the specific neuronal populations affected at the early stages of the disease. Hence, the goal of
this first Chapter is to provide an accurate picture of which neuron populations display intracellular
Aβ/APP accumulation in 5-month-old 3xTg-AD females, as well as to demonstrate its correlation
with neuronal loss. Functional assessing of behavioral and psychological symptoms of dementia
(BPSD)-like symptoms, learning, recognition and spatial memory testing, complement these results.
For this propose, fourteen 3xTg-AD females were distributed randomly in two groups, for
histological analyses (n=4) and behavioral studies (n=10), and were compared to the same number
of gender- and age-matched NTg mice. Animals destined to histological analyses were anesthetized
by an intraperitoneal injection of ketamine-xylazine mixture and transcardially perfused with
paraformaldehyde. Samples were processed as explained in the Methodology Section. The mAb
6E10 was used to immunodetect the Aβ peptide. Some other antibodies were used to identify
specific neuronal populations to prove whether the Aβ peptide was localized within, as well as to
quantify cell density. On the other hand, behavioral tests were performed based on the degree of
stress in each test, with the most stressful ones at the end. First, emotional/behavioral phenotypes
were tested by the corner test (CT) and open-field test (OFT), carried out on the day 1. Novel object
recognition test (NORT) test was assessed on the day 2 to evaluate the recognition memory.
Learning abilities and spatial memory were evaluated by the Morris water maze (MWM) on the
days 3 to 9.
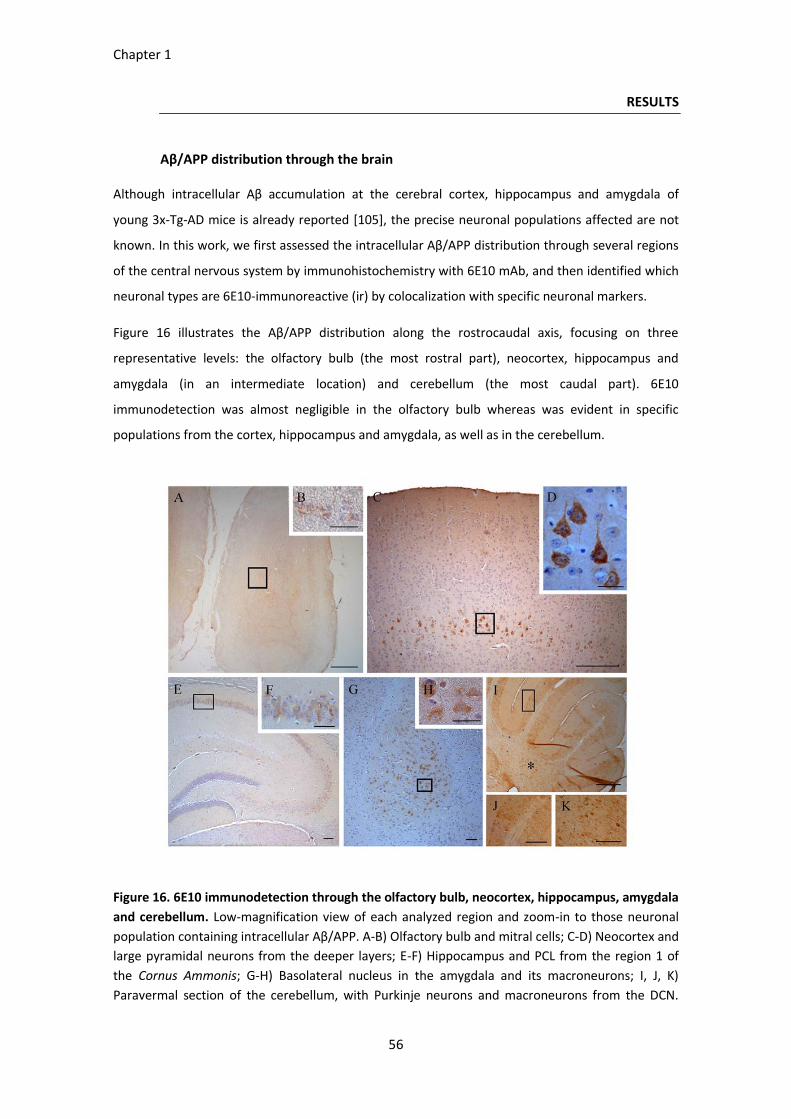
Chapter 1
56
RESULTS
Aβ/APP distribution through the brain
Although intracellular Aβ accumulation at the cerebral cortex, hippocampus and amygdala of
young 3x-Tg-AD mice is already reported [105], the precise neuronal populations affected are not
known. In this work, we first assessed the intracellular Aβ/APP distribution through several regions
of the central nervous system by immunohistochemistry with 6E10 mAb, and then identified which
neuronal types are 6E10-immunoreactive (ir) by colocalization with specific neuronal markers.
Figure 16 illustrates the Aβ/APP distribution along the rostrocaudal axis, focusing on three
representative levels: the olfactory bulb (the most rostral part), neocortex, hippocampus and
amygdala (in an intermediate location) and cerebellum (the most caudal part). 6E10
immunodetection was almost negligible in the olfactory bulb whereas was evident in specific
populations from the cortex, hippocampus and amygdala, as well as in the cerebellum.
Figure 16. 6E10 immunodetection through the olfactory bulb, neocortex, hippocampus, amygdala
and cerebellum. Low-magnification view of each analyzed region and zoom-in to those neuronal
population containing intracellular Aβ/APP. A-B) Olfactory bulb and mitral cells; C-D) Neocortex and
large pyramidal neurons from the deeper layers; E-F) Hippocampus and PCL from the region 1 of
the Cornus Ammonis; G-H) Basolateral nucleus in the amygdala and its macroneurons; I, J, K)
Paravermal section of the cerebellum, with Purkinje neurons and macroneurons from the DCN.
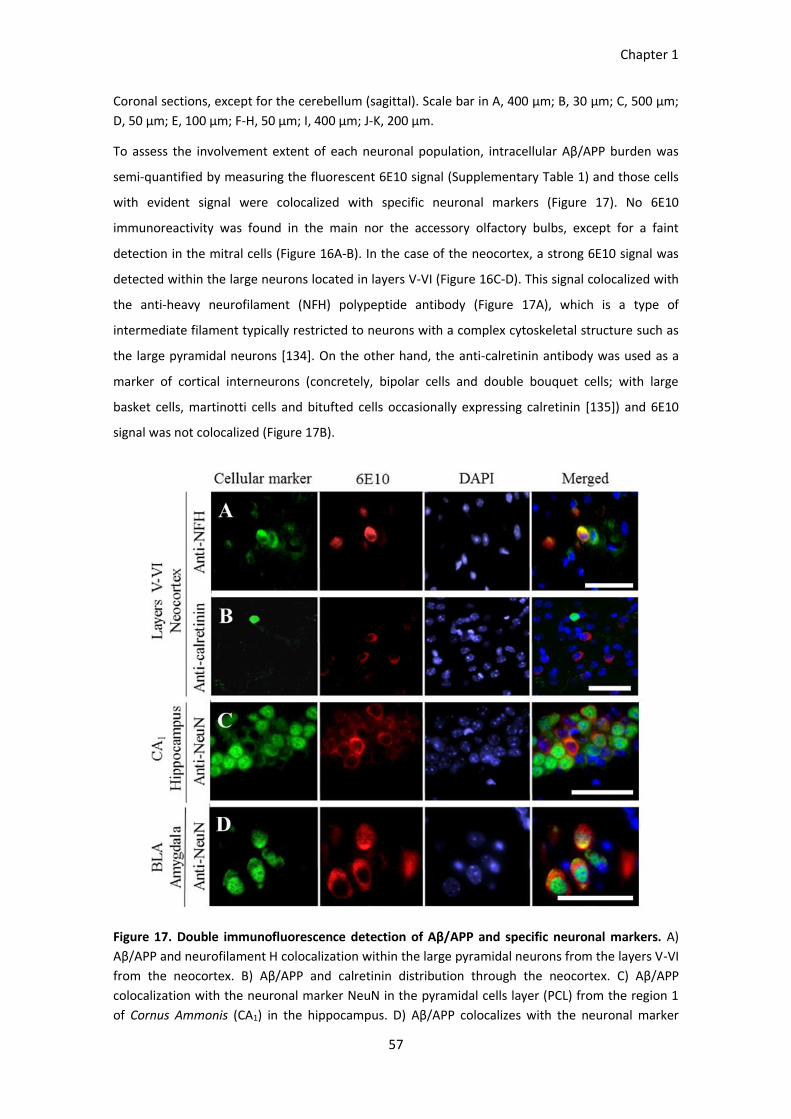
Chapter 1
57
Coronal sections, except for the cerebellum (sagittal). Scale bar in A, 400 µm; B, 30 µm; C, 500 µm;
D, 50 µm; E, 100 µm; F-H, 50 µm; I, 400 µm; J-K, 200 µm.
To assess the involvement extent of each neuronal population, intracellular Aβ/APP burden was
semi-quantified by measuring the fluorescent 6E10 signal (Supplementary Table 1) and those cells
with evident signal were colocalized with specific neuronal markers (Figure 17). No 6E10
immunoreactivity was found in the main nor the accessory olfactory bulbs, except for a faint
detection in the mitral cells (Figure 16A-B). In the case of the neocortex, a strong 6E10 signal was
detected within the large neurons located in layers V-VI (Figure 16C-D). This signal colocalized with
the anti-heavy neurofilament (NFH) polypeptide antibody (Figure 17A), which is a type of
intermediate filament typically restricted to neurons with a complex cytoskeletal structure such as
the large pyramidal neurons [134]. On the other hand, the anti-calretinin antibody was used as a
marker of cortical interneurons (concretely, bipolar cells and double bouquet cells; with large
basket cells, martinotti cells and bitufted cells occasionally expressing calretinin [135]) and 6E10
signal was not colocalized (Figure 17B).
Figure 17. Double immunofluorescence detection of Aβ/APP and specific neuronal markers. A)
Aβ/APP and neurofilament H colocalization within the large pyramidal neurons from the layers V-VI
from the neocortex. B) Aβ/APP and calretinin distribution through the neocortex. C) Aβ/APP
colocalization with the neuronal marker NeuN in the pyramidal cells layer (PCL) from the region 1
of Cornus Ammonis (CA1) in the hippocampus. D) Aβ/APP colocalizes with the neuronal marker
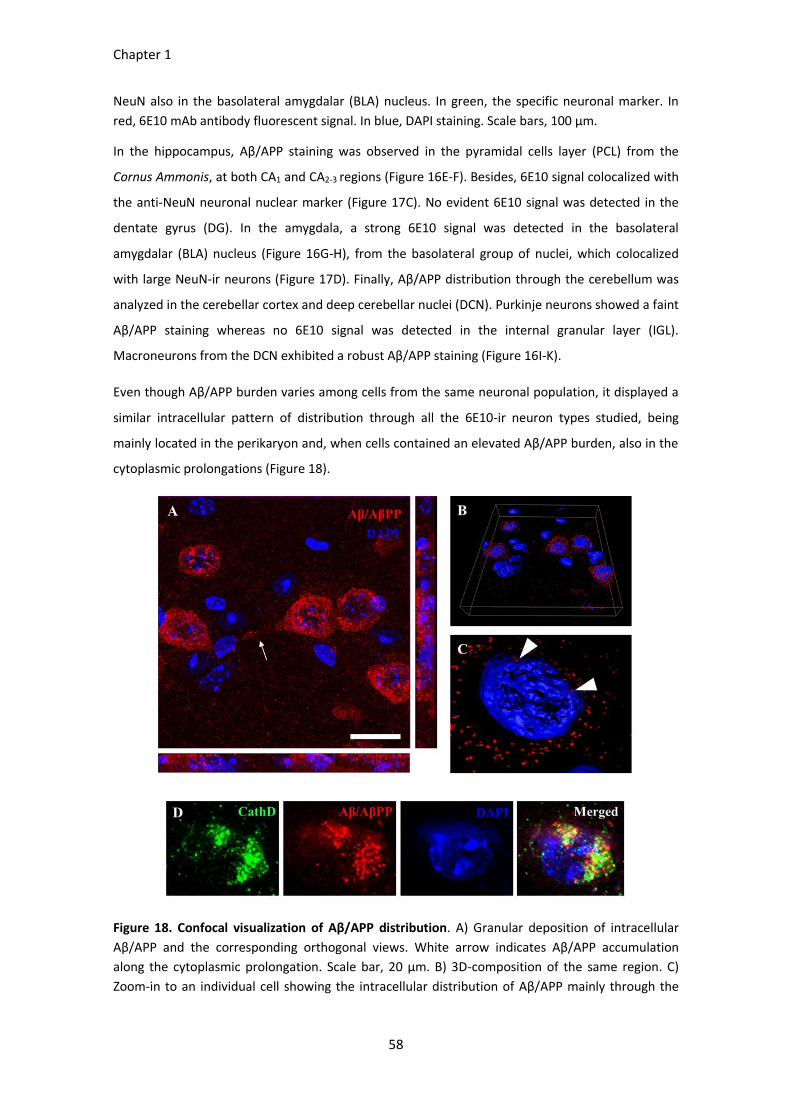
Chapter 1
58
NeuN also in the basolateral amygdalar (BLA) nucleus. In green, the specific neuronal marker. In
red, 6E10 mAb antibody fluorescent signal. In blue, DAPI staining. Scale bars, 100 µm.
In the hippocampus, Aβ/APP staining was observed in the pyramidal cells layer (PCL) from the
Cornus Ammonis, at both CA1 and CA2-3 regions (Figure 16E-F). Besides, 6E10 signal colocalized with
the anti-NeuN neuronal nuclear marker (Figure 17C). No evident 6E10 signal was detected in the
dentate gyrus (DG). In the amygdala, a strong 6E10 signal was detected in the basolateral
amygdalar (BLA) nucleus (Figure 16G-H), from the basolateral group of nuclei, which colocalized
with large NeuN-ir neurons (Figure 17D). Finally, Aβ/APP distribution through the cerebellum was
analyzed in the cerebellar cortex and deep cerebellar nuclei (DCN). Purkinje neurons showed a faint
Aβ/APP staining whereas no 6E10 signal was detected in the internal granular layer (IGL).
Macroneurons from the DCN exhibited a robust Aβ/APP staining (Figure 16I-K).
Even though Aβ/APP burden varies among cells from the same neuronal population, it displayed a
similar intracellular pattern of distribution through all the 6E10-ir neuron types studied, being
mainly located in the perikaryon and, when cells contained an elevated Aβ/APP burden, also in the
cytoplasmic prolongations (Figure 18).
Figure 18. Confocal visualization of Aβ/APP distribution. A) Granular deposition of intracellular
Aβ/APP and the corresponding orthogonal views. White arrow indicates Aβ/APP accumulation
along the cytoplasmic prolongation. Scale bar, 20 µm. B) 3D-composition of the same region. C)
Zoom-in to an individual cell showing the intracellular distribution of Aβ/APP mainly through the
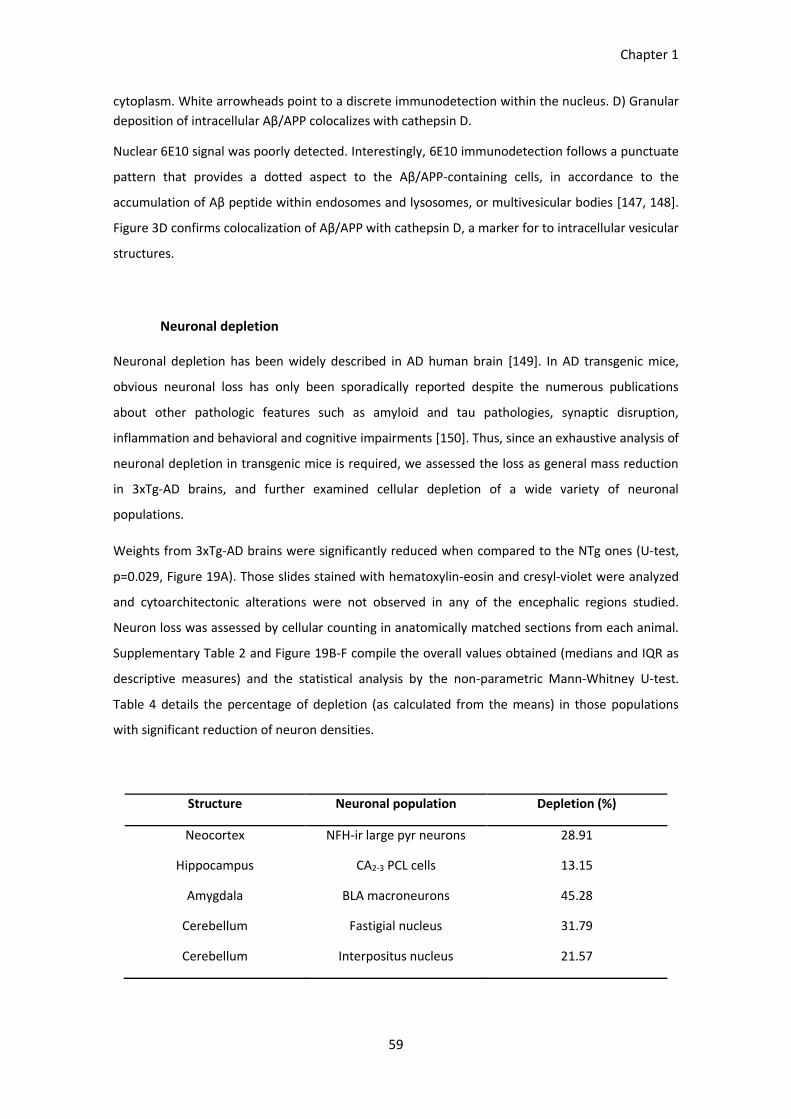
Chapter 1
59
cytoplasm. White arrowheads point to a discrete immunodetection within the nucleus. D) Granular
deposition of intracellular Aβ/APP colocalizes with cathepsin D.
Nuclear 6E10 signal was poorly detected. Interestingly, 6E10 immunodetection follows a punctuate
pattern that provides a dotted aspect to the Aβ/APP-containing cells, in accordance to the
accumulation of Aβ peptide within endosomes and lysosomes, or multivesicular bodies [147, 148].
Figure 3D confirms colocalization of Aβ/APP with cathepsin D, a marker for to intracellular vesicular
structures.
Neuronal depletion
Neuronal depletion has been widely described in AD human brain [149]. In AD transgenic mice,
obvious neuronal loss has only been sporadically reported despite the numerous publications
about other pathologic features such as amyloid and tau pathologies, synaptic disruption,
inflammation and behavioral and cognitive impairments [150]. Thus, since an exhaustive analysis of
neuronal depletion in transgenic mice is required, we assessed the loss as general mass reduction
in 3xTg-AD brains, and further examined cellular depletion of a wide variety of neuronal
populations.
Weights from 3xTg-AD brains were significantly reduced when compared to the NTg ones (U-test,
p=0.029, Figure 19A). Those slides stained with hematoxylin-eosin and cresyl-violet were analyzed
and cytoarchitectonic alterations were not observed in any of the encephalic regions studied.
Neuron loss was assessed by cellular counting in anatomically matched sections from each animal.
Supplementary Table 2 and Figure 19B-F compile the overall values obtained (medians and IQR as
descriptive measures) and the statistical analysis by the non-parametric Mann-Whitney U-test.
Table 4 details the percentage of depletion (as calculated from the means) in those populations
with significant reduction of neuron densities.
Structure Neuronal population Depletion (%)
Neocortex NFH-ir large pyr neurons 28.91
Hippocampus CA2-3 PCL cells 13.15
Amygdala BLA macroneurons 45.28
Cerebellum Fastigial nucleus 31.79
Cerebellum Interpositus nucleus 21.57
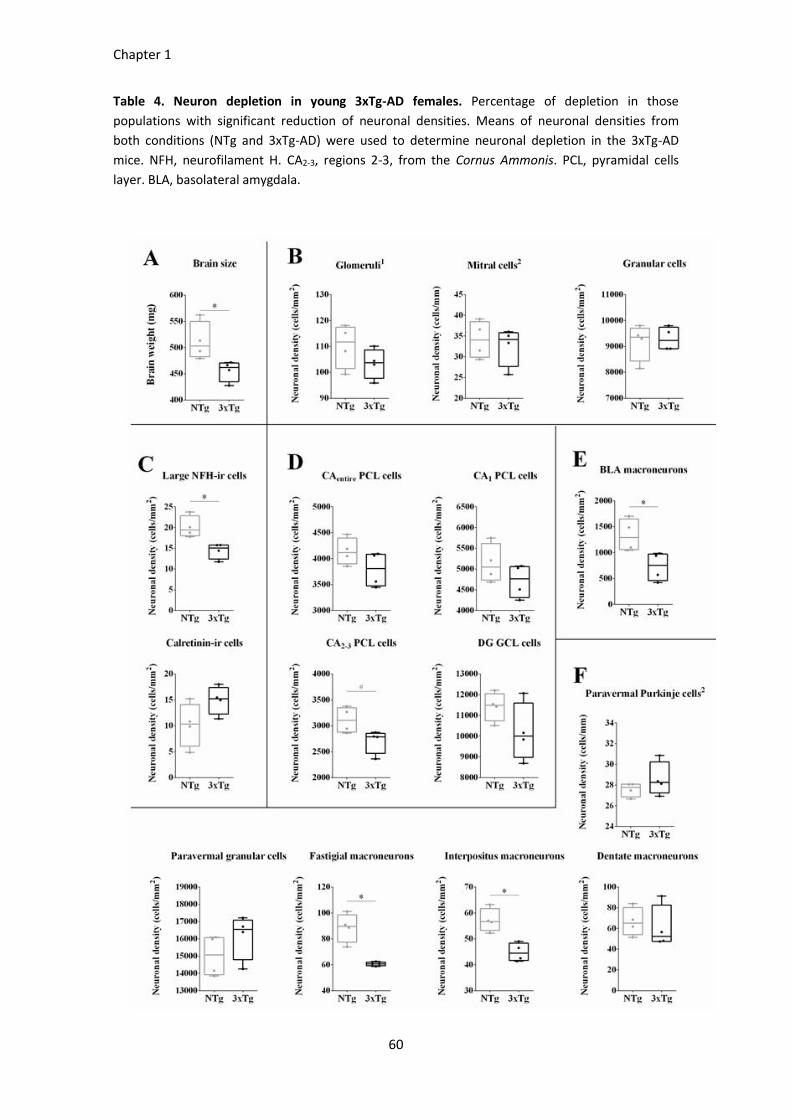
Chapter 1
60
Table 4. Neuron depletion in young 3xTg-AD females. Percentage of depletion in those
populations with significant reduction of neuronal densities. Means of neuronal densities from
both conditions (NTg and 3xTg-AD) were used to determine neuronal depletion in the 3xTg-AD
mice. NFH, neurofilament H. CA2-3, regions 2-3, from the Cornus Ammonis. PCL, pyramidal cells
layer. BLA, basolateral amygdala.

Chapter 1
61
Figure 19. Neuronal densities in the olfactory bulb, cerebral cortex, hippocampus, amygdala and
cerebellum. A) Brain weight expressed in mg, is compared between the NTg and 3xTg-AD mice. B)
Glomeruli, mitral cells and granular cells from the olfactory bulb. C) Neurofilament H-
immunoreactive (NFH-ir) and calretinin-ir cells from the neocortex. D) Cells in the Pyramidal Cell
Layer (PCL) from the entire Cornus Ammonis (CAentire), and regions 1 (CA1) and 2-3 (CA2-3)
separately. E) Macroneurons from the basolateral amygdalar (BLA) nucleus. F) Paravermal Purkinje
and granular cells, and macroneurons from the fastigial, interpositus and dentate deep cerebellar
nuclei from the cerebellum. Densities (cells/mm2) are expressed as box plots, and whiskers
represent minimum and maximum values. # indicates the marginally significant differences
between the 3xTg-AD and NTg mice with p≤0.1, * significant differences with p≤0.05, ** p≤0.01. 1
indicates glomeruli as an exception of the neuronal categorization, since it is an interneuronal
connection structure. 2 indicates those neuronal populations arranged as a monolayer of cells
(density expressed as cells/mm of length).
Glomeruli, mitral cells and granular cells were examined in the olfactory bulb, but no significant
depletion was found (Figure 19B). In the cerebral cortex, cellular density of those NFH-ir cells was
reduced 29% in the 3xTg-AD mice as compared to the NTg ones (U-test, p=0.029), whereas no
significant reduction was observed in calretinin-ir neuronal populations (Figure 19C). In the
hippocampus, the cellular density in the PCL at the CA was not significantly different when the
whole region was considered, but the 3xTg-AD mice achieved a marginally significant reduction of
13% when CA2-3 was individually considered (U-test, p=0.057) (Figure 19D). Cellular density was also
evaluated in the granular cells layer (GCL) from the DG, but no significant differences were found.
In the amygdala, cellular density was reduced 45% in the BLA nucleus (U-test, p=0.029) (Figure
19E). Reduction of cellular densities in the cerebellum was already considered in a previous work of
the group [151]. Interestingly, macroneurons density from the 3xTg-AD mice was reduced about
32% and 22% compared to the NTg ones in the fastigial and interpositus DCN, respectively (U-test,
p=0.029 and p=0.029) (Figure 19F).
Conclusively, these results evidence that neuron depletion at first stages of the disease mainly
occurs on glutamatergic neuronal populations. Moreover, the higher neuron loss was found in the
amygdala, followed by the cerebral cortex and, finally, by the hippocampus. At the same time,
neuron loss in the cerebellum follows the already reported mediolateral gradient in the DCN
macroneurons [151].
Severity of the intracellular Aβ/APP pathology
The number of 6E10-ir cells was determined in those neuronal populations in which evident
intracellular signal was detected. This data, when related to the cellular counting, revealed the
proportion of neurons containing Aβ/APP (Figure 20A). In the layer V-VI of the neocortex from

Chapter 1
62
3xTg-AD mice, 79% of large pyramidal neurons presented intracellular Aβ/APP. In the CA from the
hippocampus, the signal was detected in 25% of cells in the PCL, whereas proportions were around
31% and 14% when considering both regions CA1 and CA2-3 individually. In the amygdala, 87% of
large neurons from the BLA nucleus presented an evident signal. Finally, in the DCN from the
cerebellum, 81%, 48% and 79% of the macroneurons from the fastigial, interpositus and dentate
nuclei presented intracellular Aβ/APP. Hence, these results suggest that the plurality of neuronal
populations involved in the pathology presents different levels of severity.

Chapter 1
63
Figure 20. Proportion of neurons exhibiting intracellular Aβ/APP and correlation with neuronal
depletion. A) Proportion of 6E10-ir cells in each neuronal population where evident signal was
detected in 3xTg-AD mice. Proportions are expressed by percentages of the means (6E10-ir
cells/total cells number) and error bars represent SEM. CA, Cornus Ammonis; CA1 or CA2-3, Cornus
Ammonis regions 1 or 2-3, respectively. PCL, pyramidal cells layer. BLA nucleus, basolateral
amygdalar nucleus. DCN, deep cerebellar nucleus. B) Linear regression analysis between the
proportion of 6E10-ir cells and the logarithm of neuronal depletion (calculated in Table 4).
Since the proportion of Aβ/APP-containing neurons followed the same regional vulnerability
pattern than neuronal depletion, we tried to find a correlation and found a linear association
between the 6E10 signal and the logarithm of neuronal depletion (Figure 20B). This means that a
small change in the proportion of cells containing intracellular amyloid induces a huge change in
their density.
Figure 21. Astroglia and microglia colocalization with Aβ/APP-containing neurons. A) Astroglia
immunodetection by anti-GFAP antibody (green) and fluorescence intensity (RFU) quantification in
the hippocampus. Scale bars, 100 µm. B) Double immunofluorescence detection of cortical
astrocytes (anti-GFAP and 6E10 mAbs, in the left), or cortical and hippocampal microglia (Iba1 and
6E10, in the middle and the right), in 3xTg-AD mice. Scale bars, 10 µm.
Finally, we detected the presence of astroglia once intracellular Aβ/APP accumulation and neuronal
depletion are occurring. Glial fibrillary acidic protein (GFAP, a typical astrocytic marker) was
A
B
Chapter 1
64
immunodetected and fluorescent signal measured in the hippocampus. GFAP fluorescence
intensity values were higher in 3xTg-AD mice in comparison to the NTg ones, although differences
did not reach statistical significance (Figure 21A). Interestingly, astrocytes and microglia appeared
wrapping the soma of some Aβ/APP-containing neurons (Figure 21B), even though both types of
glia were also observed in contact with non-reactive 6E10 neurons.
BPSD-like symptoms
3xTg-AD females already manifested evident BPSD-like symptoms in the CT and OFT at 5 mo
(Supplementary Table 3). When the horizontal activity was considered in the CT, no differences
were found in the total number of corner visits between 3xTg-AD and NTg mice, but latencies to
the corner were reduced in the 3xTg-AD mice when compared to the NTg ones (0.65s and 3.10s, U-
test, p=0.048), evidencing an anxious-like behavior probably induced by neophobia to the cage
(Figure 22A). However, no differences were found in the vertical activity.
Anxious-like behavior was also observed in the OFT since the 3xTg-AD mice exhibited reduced
exploratory activity (Figure 22B), as shown in the distance traveled (a total of 18.6m by the 3xTg-AD
mice and 46.1m by the NTg ones, U-test, p<0.001), the number of rearings (12 rearings by the 3xTg-
AD mice and 71.5 by the NTg ones, U-test, p<0.001) and the latency to the first one (58s and 17s in
the 3xTg-AD mice and NTg ones, respectively, U-test, p=0.010). Other emotional traits were
analyzed, as the number of self-groomings, the latency to the first one and the number of
defecations. Significant differences between 3xTg and NTg mice were reached in the number of
self-groomings (3 and 4.5, respectively, U-test, p=0.034) and in the latency to the first one (276s
and 111s, respectively, U-test, p=0.017).

Chapter 1
65
Figure 22. BPSD-like symptoms. A) Corner visits (n), latency to the corner (s), number of rearings
(n), and first rearing latency (s) in the CT. B) Total distance traveled (m), number of rearings and
latency to the first one, self-groomings (n) and the respective latency (s), and number of
defecations (boli) in the OFT. Values are expressed by box plots, and whiskers represent minimum
and maximum value. * indicates significant differences between the 3xTg-AD and the NTg mice
with p≤0.05, ** p≤0.01, *** p≤0.001.
Cognition and memory disabilities
Results obtained from the NORT are detailed in the Figure 23A and Supplementary Table 4. In
summary, DI evidenced that recognition memory was impaired in the 3xTg-AD mice whereas the
NTg ones manifested preference to the novel object (0.03 and 0.72 respectively, U-test, p=0.0.004).
Interestingly, the accumulated time exploring the objects presented higher differences than the
Chapter 1
66
number of explorations, so that the quality of explorations was the most suitable parameter to
assess recognition memory in the NORT [106]. Also, and in consonance with the CT and OFT results,
3xTg-AD mice exhibited anxious-like behavior since exploration during the test was reduced in
comparison to the NTg ones, with a total distance traveled of 1.62m and 9.04m respectively (U-
test, p<0.001), 4 and 18.5 approximations to the objects (U-test, p=0.005), and 1.35s and 42.1s of
accumulated time exploring the objects (U-test, p=0.002).
Regarding to the MWM, Figure 23B illustrates the results obtained in the 5 consecutive acquisition
stages. At the first acquisition stage, distance traveled to reach the platform was significantly
higher in the 3xTg-AD mice when compared to the NTg ones (9.6m and 5.4m respectively, U-test,
p=0.003). However, 3xTg-AD mice experienced a learning process since the path to the platform
was gradually decreasing as acquisition trainings were performed, to finally get similar values to
the NTg ones. By contrast, the NTg mice did not change their path to the platform, probably
because the animals were conscious of its location from the beginning (values did not decrease, but
were still lower than those for the 3xTg-AD mice). Mean swimming speed by the 3xTg-AD mice was
higher than that by the NTg ones in all the acquisition stages, corroborating the anxious-like
behavior mentioned above.
Figure 23C compiles the results obtained in the first segment of the final probe (0-30s), which
better represent the test, since mice behaved different once they became aware of the platform
absence. The number of platform crossings was reduced in the 3xTg-AD mice, as well as the latency
to the platform occurring later, but differences did not reach significance. Path efficiency
performed by 3xTg-AD mice was significantly inferior than that of the NTg ones (0.06 and 0.16
respectively, U-test, p=0.017). Moreover, to evaluate the precision of the animals in searching the
platform, concentric zones around the platform were considered. Interestingly, evaluation of time
spent and distance traveled in these zones showed gradually decreasing values in the NTg group (as
more distant the zone, the lower the level) suggesting that these mice learned where the platform
was placed, while 3xTg-AD mice presented a random pattern.

Chapter 1
67
Figure 23. Learning and memory impairment. A) Distance traveled (s), total explorations (n), total
time exploring (s) and its discrimination index (DI) in the NOR test. B) Mean swimming speed (m/s)
and distance traveled (m) across the acquisition stages of the Morris water maze (MWM) test. D)
Platform crossings (n), latency to the platform (s), and path efficiency, as well as normalized time
(s) and distance (m) through virtual concentric areas around the platform (first segment of the test,
0-30s). Values are expressed by box plots, and whiskers represent minimum and maximum values,
except for acquisition stages (graphs express medians and IQR). 1 Time and distance are normalized
by the area of each zone. # refers to the marginally significant differences between the 3xTg-AD and
the NTg mice with p≤0.1, * significant differences with p≤0.05, ** p≤0.01, *** p≤0.001.

Chapter 1
68
DISCUSSION
Intraneuronal Aβ in the 3xTg-AD mouse model
The intraneuronal accumulation of Aβ is a key topic in the pathomechanism of AD, but specificity of
the 6E10 mAb widely used to detect the peptide still remain controversial [152]. Albeit 6E10 mAb is
directed against the N-terminus of the Aβ peptide (epitope within 3–10), it also detects full-length
APP and the 1st product of amyloidogenic APP processing, β-secretase-cleaved βCTF, which has the
same N-terminus as the peptide [153] . In 2011, it was claimed that intraneuronal APP, not free Aβ
peptides, were present in 3xTg-AD mice, but the article was retracted by the Editors in 2015
because evidence of data misrepresentation [154] . The most recent agreement is that
intraneuronal accumulation of the Aβ peptide in the 3xTg-AD mouse model, as detected with the
6E10 mAb and first described by LaFerla [98, 105, 155], is actual [156–159]. The 6E10 signal is the
same than that with the specific-Aβ-mAb MOAB-2 and colocalizes with cathepsin-D, a marker for
acidic organelles, which further evidences the presence of intraneuronal Aβ, distinct from Aβ
associated with the cell membrane, in this mouse model. In addition, preliminary data from our
laboratory show that 6E10 detection in this work should mostly correspond to the Aβ peptide since
the signal is very much reduced when the 3xTg-AD mouse is treated with scFv-h3D6. ScFv-h3D6 is a
single chain variable fragment designed at our laboratory [120, 124, 160], and derived from
humanized mAb-3D6 (bapineuzumab). Bapineuzumab is known to recognize the 1-5 N-terminus of
the Aβ peptide, and so also βCTF, but not the full-length APP [145, 161, 162]. Therefore, detection
with 6E10 mAb in this work should mostly correspond to intracellular Aβ, although additional work
would be needed to unequivocally prove it.
The 3xTg-AD mouse develops molecular, histological and behavioral alterations reproducing human
AD progression [102, 103, 106]. Brain accumulation of Aβ peptide in AD patients has been
evidenced since the first description of the pathology [5, 163]. Even the initial idea that amyloid
plaques were causing the synaptic disruptions and neuronal death evoking to the clinical symptoms
of AD, evidences resulting from the last two decades of research converged in that Aβ toxicity is
caused by intracellular accumulation rather than extracellular [164]. As in the case of the 3xTg-AD
mouse, intraneuronal accumulation of toxic Aβ may be associated with ER stress in the brains of AD
patients at an early stage [155, 165]. On the other hand, Down syndrome (DS) patients develop AD
at a middle age as a consequence of the trisomy of chromosome 21, where the APP gene is located,
and provide a unique situation in which to study the early and sequential development of these
changes [166]. These studies demonstrate that intracellular accumulation of Aβ in neurons and
astrocytes precedes extracellular deposition. Similarly, intraneuronal Aβ in DS appears to trigger a
Chapter 1
69
pathological cascade leading to oxidative stress and a neurodegeneration typical of AD [167]. For
an overall view on the recent progress in AD pathology see review [168].
Glutamatergic neurons vulnerability in young 3xTg-AD females
In the 3xTg-AD mice, intraneuronal Aβ has previously been noticed in the neocortex, subiculum, CA
in the hippocampus or amygdala [98, 103, 105] in both genders and at different ages. In this work,
we detected Aβ/AβAPP in the neocortex (large pyramidal neurons from deep layers), hippocampus
(CA1 and CA2-3), amygdala (macroneurons from the BLA nucleus), and cerebellum (DCN) of 5-mo-
old females. Also, a faint signal was detected in mitral cells from the olfactory bulb and Purkinje
neurons from the cerebellar cortex.
Neuronal loss has also been one of the most extensively described hallmarks in AD patients,
especially in the hippocampus [169–171] and entorhinal cortex [172]. However, proper
reproduction of neuronal loss in AD models has been the main hurdle for modeling. This feature is
almost negligible in most of the APP-transgenic mice although it has been observed in some
APP/PS1-transgenic models [173–176]. For instance, neuronal depletion has been described in 9-
mo 5xFAD mice, which contains five additive mutations causing Aβ overproduction and
accumulation already at 1.5 mo [147]. The extent to which neuronal loss occurs in the 3xTg-AD
mice is not yet detailed in depth, but some authors qualitatively describe neuronal atrophy and
depletion through the cerebral cortex and hippocampus, in association with behavioral and
cognitive alterations [177, 178]. In the present work, a reduction in the neuronal density was found
within specific Aβ/APP-containing populations: NFH-ir large pyramidal neurons from layers V-VI in
the neocortex, cells from the PCL on the CA2-3 region in the hippocampus and large pyramidal
neurons from the BLA nucleus in the amygdala. Different grades of depletion occurred through the
affected regions, being the higher neuronal loss found in the amygdala, followed by the neocortex
and, finally, by the hippocampus. As previously reported, macroneurons from the DCN in the
cerebellum were depleted following a mediolateral gradient [151]. Taken together, these results
suggest that glutamatergic neurons, rather than the GABAergic ones, are affected by intracellular
Aβ/APP pathology and neuronal depletion at early stages of the disease in 3xTg-AD females.
Intraneuronal Aβ/APP and cellular density correlation in AD-involved neuronal
populations
As mentioned above, intraneuronal Aβ accumulation is considered one of the key features of
AD and it is proved to correlate with behavioral and cognitive decline [105, 157–159]. The
pathogenic role of intraneuronal Aβ has been explained by several mediators such as oxidative

Chapter 1
70
stress, calcium dysregulation, intracellular signaling mechanisms and tau
hyperphosphorylation, which contribute to neuronal dysfunction and neurodegeneration [108,
155, 165, 174, 179, 180]. Also, synaptic loss has been proposed to be mediated by the failure
of live neurons to maintain functional axons and dendrites or by neuron death [50]. According
to the evident pathological role that intraneuronal Aβ plays on the early neurodegeneration
and neuronal loss in AD, we found that a small change in the proportion of cells containing
intracellular Aβ/APP promotes a huge change in their density.
Interestingly, when astroglia was considered, we found higher levels of GFAP intensity in the 3xTg-
AD mice in comparison with the NTg ones, although statistical significance was not achieved. This
reflects the role of these glial cells in assisting neurons to prevent neuronal death and to recover
the issue after death has occurred. Lysosomal degradation in brain parenchyma cells is one of the
mechanisms by which Aβ is cleared from the brain [181], with astrocytes being reported to readily
ingest smaller sized Aβ species [182]. This reflects the relevance of astroglia at the first stages of
the disease, although as the disease progresses these cells, initially resistant to Aβ cytotoxicity,
become severely affected by high loads of Aβ and their functions impair [183]. In this work,
astrocytes and microglia were co-immunodetected with 6E10-ir cells and we visualized both glia
types wrapping the soma of some Aβ-containing neurons [184, 185]. The presence of microglia is
also in consonance with its protective role before death, apart from its further role in clearing dead
cells [186].
Behavioral and cognitive implications
Several behavioral and cognitive alterations in the 3xTg-AD mouse model have been described
[108], and their correlation with the intraneuronal amyloid pathology across time was
demonstrated [105]. Here, we further proved the relationship between neuron vulnerability, in
terms of Aβ/APP pathology and cell depletion of specific neuronal populations, and the
manifestation of behavioral and cognitive alterations.
On the one hand, anxious-like behavior was evidenced by the neophobia (in terms of reduced
exploratory activity and freezing behavior) exhibited once the animals were placed on the cage (CT)
or the white and illuminated open arena (OFT). BPSD-like symptoms were supported by the
reduced exploratory activity also found in the NORT. Any locomotor alteration was discarded since
the 3xTg-AD mice exhibited even a fast locomotion (mean swimming speed) than the NTg ones in
the MWM test. Precisely, this hyperactive swimming pattern is also considered a common BPSD-
like symptom, supporting the elevate level of anxiety in this mouse model [108, 124, 187, 188].

Chapter 1
71
On the other hand, in agreement with previous reports [106, 188, 189], cognitive disturbances in
young 3xTg-AD females were exhibited in both NORT and MWM paradigm. In the first test,
recognition memory impairment was manifested since the inability to discriminate between
objects. Results from the MWM evidenced that 3xTg-AD mice learn, although slower than the NTg
ones, where the platform was, but the long-term spatial memory was impaired, in both difficulties
to reach the area and lack of precision to locate it.

Chapter 1
72
73
CHAPTER 2
ScFv-h3D6 prevents neuron loss and improves cognitive
impairment in young 3xTg-AD females by reducing
intracellular Aβ

74

Chapter 2
75
AIMS
Targeting Aβ-oligomeric species has become the main strategy in AD pharmacological research,
specially by immunotherapy, since they have been demonstrated to be the most toxic ones. The
use of single-chain variable fragments (scFv) is considered safer than the full-length antibodies
because the lack of the Fc portion of the mAb, which was supposed to mediate the severe effects in
the halted clinical trials of bapineuzumab [190]. In this sense, the anti-Aβ-oligomers single-chain
antibody fragment scFv-h3D6, derived from bapineuzumab, was designed as a potential tool for
the treatment of AD. The aim of this Chapter is to examine the efficiency of scFv-h3D6 in reducing
intracellular Aβ burden in 5-mo-old 3xTg-AD females, and its subsequent effect on the survival of
the already affected neuron populations [191]. As well, a first insight into the safety of scFv-h3D6
treatment, in terms of neuroinflammation and histology of some peripheral organs, was assessed.
Finally, the effect of the treatment on the behavioral and psychological symptoms of dementia
(BPSD)-like symptoms, as well as on the cognitive impairment, were tested.
Five-months-old 3xTg-AD females, and the corresponding age- and gender-matched NTg mice,
were intraperitoneally administered with a single-dose of 100 µg of scFv-h3D6. Four experimental
groups were used for the histological and biochemical analyses (n=4-5): untreated non-transgenic
mice (NTg/-), treated non-transgenic mice (NTg/+), untreated transgenic mice (3xTg/-) and treated
transgenic mice (3xTg/+). Whereas behavioral testing was performed with a group of non-
transgenic mice and treated and untreated 3xTg-AD mice groups (n=10) (we first proved that the
NTg/+ group was equal to the NTg/- group by histological and molecular analyses, so no behavioral
testing was performed with the NTg/+ group).
Intracellular amyloid pathology and neuron depletion were immunohistologically determined by
using a cohort of animals which, five days after the administration, were anesthetized and
transcardially perfused. Brains were collected and processed as explained in the Methodology
Section. The 6E10 mAb was used to detect the Aβ peptide whereas anti-neurofilament H and anti-
NeuN were used for neuronal quantification. A different cohort was used to assess by biochemical
determinations the immune response to the treatment. As well, animals were anesthetized five
days after administration by using, in this case, inhaling isoflurane 1%. Blood was collected by
cardiac puncture, and brains and tissues were dissected and processed for biochemical or
histological analyses following the procedures explained in the Methodology Section. Finally,
emotional/behavioral phenotypes were tested by the corner test (CT) and open-field test (OFT) one
day after the administration (day 1), recognition memory was assessed by the novel object
recognition test (NORT) on day 2, and learning abilities and spatial memory were evaluated by the
Morris water maze (MWM) on days 3 to 9. Protocols an are explained in the Methodology Section.

Chapter 2
76
RESULTS
ScFv-h3D6 reduces intracellular amyloid-β burden
Intracellular Aβ accumulation has already been proved to occur earlier than extracellular
aggregates [41]. The cerebral cortex, hippocampus and amygdala are described as the main regions
involved in the amyloid pathology [105]. A recent publication by our group detailed which neuron
populations are affected by the pathology in young 3xTg-AD females, as well as the extent of
intraneuronal Aβ/APP accumulation [191]. Interestingly, a strong correlation between the extent of
intracellular Aβ/APP burden and the reduction in cellular density was found in all the involved
populations. However, in this previous work we referred to Aβ/APP accumulation because the 6E10
mAb used detects APP, as well as Aβ. Here, we analyzed the effects of scFv-h3D6, which is specific
for Aβ peptide, and therefore, albeit 6E10 was also used, we can claim that the observed effects
are due to Aβ, but not APP, clearance.
The proportion of 6E10-immunoreactive (-ir) cells was determined in the deep cortical layers V and
VI (L5-6), the pyramidal cells layer (PCL) from the region III of the Cornus Ammonis (CA3) in the
hippocampus, and the basolateral amygdalar (BLA) nucleus. For this purpose, the number of ir-cells
was determined for each neuron population and referred to the total number of cells constituting
the corresponding population.
Figure 24 shows the overall values obtained (expressed by medians within box plots) and the
statistical analysis by the non-parametric Mann-Whitney U-test, as well as the reduction in 6E10-ir
cells by the treatment (calculated from the means and expressed as percentages) in each
population. In the deep cortical layers from the 3xTg-AD mice, the median value for the percentage
of 6E10-ir cells was 78% for the untreated animals and 14% for the scFv-h3D6-treated ones (Figure
24A). This represents a reduction in 6E10-ir cells of 70% by the treatment (Figure 24D). Statistical
comparison between untreated and treated 3xTg-AD mice reached significant values (U-test,
P=0.029), whereas differences between the treated 3xTg-AD mice and the NTg ones were not
significant, supporting the effect of scFv-h3D6 on the recovery of the non-pathological values in the
deep cortical layers. In the pyramidal cell layer (PCL) from the hippocampal region III (CA3) of the
untreated 3xTg-AD mice, the proportion of 6E10-ir cells was 12% (Figure 24B). Although this value
is small and significant differences were not reached, the treatment decreased it to 4%, that is, 65%
of the cells in this area of the hippocampus were protected by the treatment (Figure 24D). In the
basolateral amygdalar (BLA) nucleus from the 3xTg-AD mice, 100% of the neurons were 6E10-ir and
the treatment significantly reduced this value to 47% (U-test, P=0.029) (Figure 24C), what implies

Chapter 2
77
the protection of 56% of the population (Figure 24D). Treated 3xTg-AD mice did not statistically
differ from the NTg ones, what supports the strong effect of scFv-h3D6 on the recovery of
intracellular amyloid pathology also in the BLA nucleus.
Region Neuron population % of protected cells
Neocortex Neocortical L5-6 70 %
Hippocampus CA3 PCL cells 65 %
Amygdala BLA macroneurons 56 %
Figure 24. Proportion of 6E10-ir cells is reduced by a single i.p. dose of scFv-h3D6. The percentage
of 6E10-ir cells at the cortical deep layers V and VI (L5-6) (A), pyramidal cell layer (PCL) from the
region III of the Cornus Ammonis (CA3) in the hippocampus (B), and basolateral amygdalar (BLA)
nucleus (C) from untreated non-transgenic mice (NTg/-), treated non-transgenic ones (NTg/+),
untreated 3xTg-AD mice (3xTg/-) and treated 3xTg-AD ones (3xTg/+). Values for non-treated
animals are already published and are shown for comparative purposes [15]. Proportions are
expressed by medians in box plots, and whiskers represent minimum and maximum values (n=4).
Statistical differences were assessed with the non-parametric U-test. * Significant differences with
P≤0.05. The reduction in the % of 6E10-ir cells by the treatment is expressed as a percentage (D),
and was quantified by considering values from the 3xTg/- as the maximum (or pathologic ones) and
the NTg/- mice as the minimum (or non-pathologic ones). The significantly increased percentage of
6E10-ir cells in the 3xTg/- is reduced by scFv-h3D6 treatment, reaching significant recovery of the
values for the most affected neuron populations, the cortical and amygdalar ones.
C B A
D
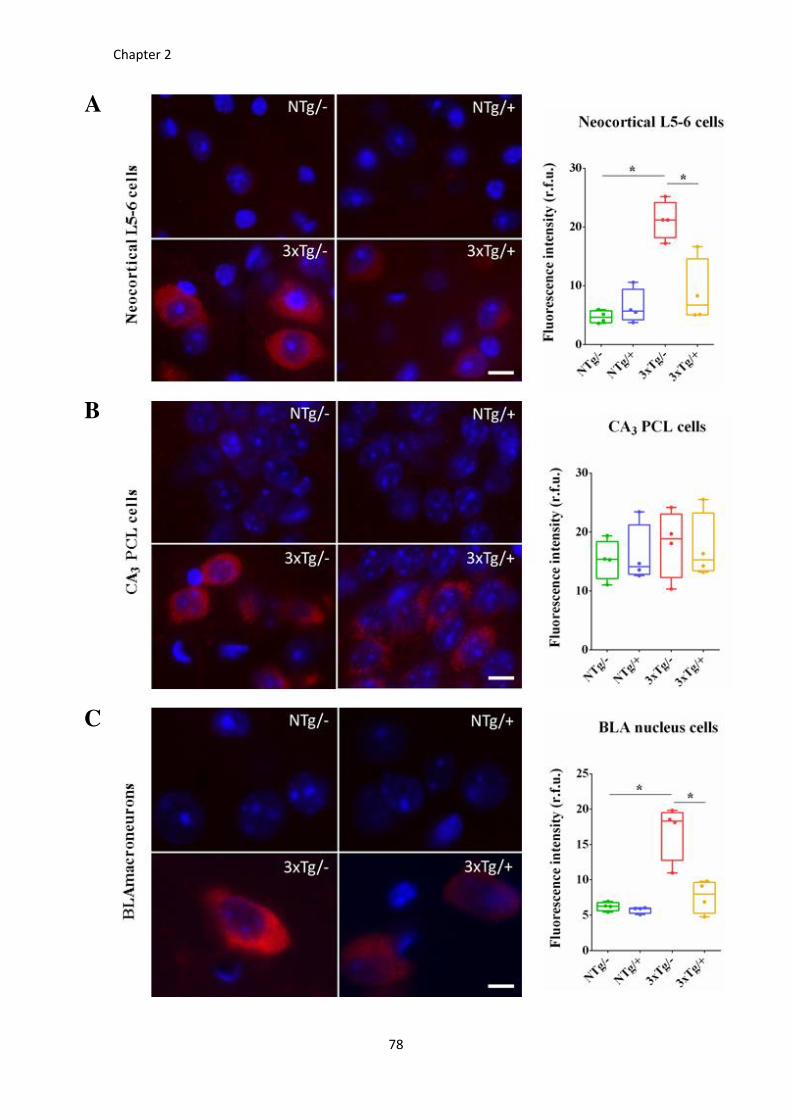
Chapter 2
78
C
B
A
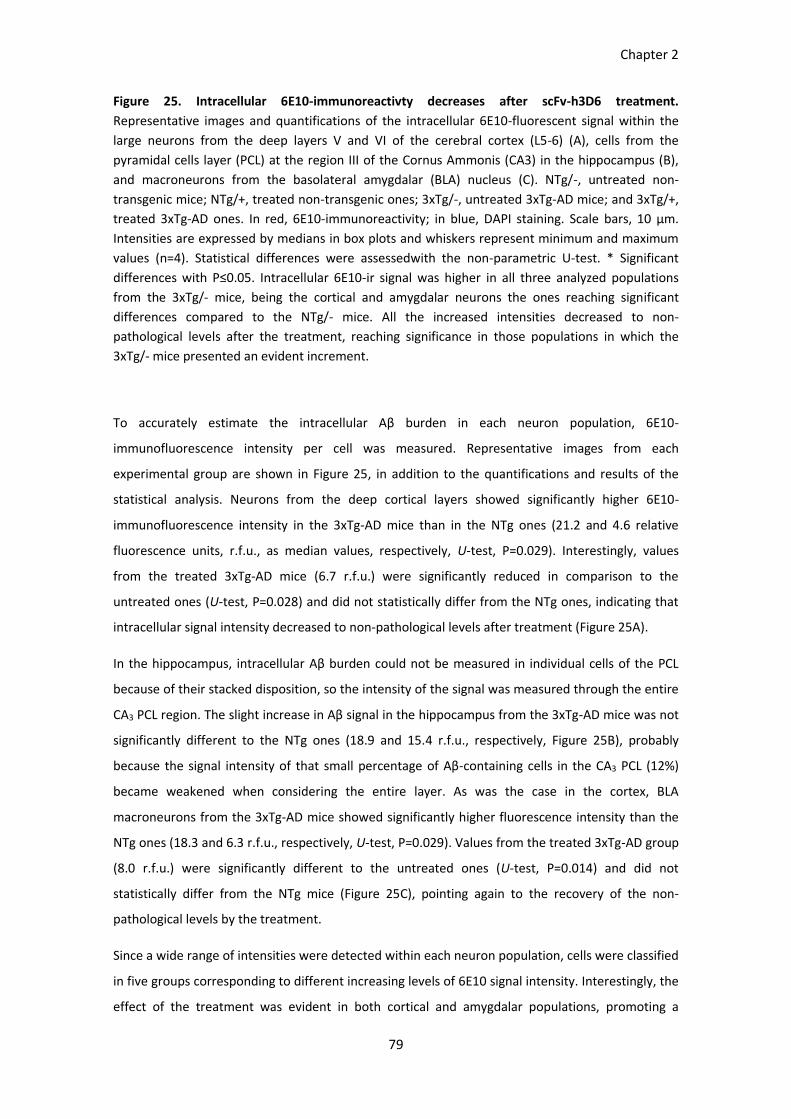
Chapter 2
79
Figure 25. Intracellular 6E10-immunoreactivty decreases after scFv-h3D6 treatment.
Representative images and quantifications of the intracellular 6E10-fluorescent signal within the
large neurons from the deep layers V and VI of the cerebral cortex (L5-6) (A), cells from the
pyramidal cells layer (PCL) at the region III of the Cornus Ammonis (CA3) in the hippocampus (B),
and macroneurons from the basolateral amygdalar (BLA) nucleus (C). NTg/-, untreated non-
transgenic mice; NTg/+, treated non-transgenic ones; 3xTg/-, untreated 3xTg-AD mice; and 3xTg/+,
treated 3xTg-AD ones. In red, 6E10-immunoreactivity; in blue, DAPI staining. Scale bars, 10 µm.
Intensities are expressed by medians in box plots and whiskers represent minimum and maximum
values (n=4). Statistical differences were assessedwith the non-parametric U-test. * Significant
differences with P≤0.05. Intracellular 6E10-ir signal was higher in all three analyzed populations
from the 3xTg/- mice, being the cortical and amygdalar neurons the ones reaching significant
differences compared to the NTg/- mice. All the increased intensities decreased to non-
pathological levels after the treatment, reaching significance in those populations in which the
3xTg/- mice presented an evident increment.
To accurately estimate the intracellular Aβ burden in each neuron population, 6E10-
immunofluorescence intensity per cell was measured. Representative images from each
experimental group are shown in Figure 25, in addition to the quantifications and results of the
statistical analysis. Neurons from the deep cortical layers showed significantly higher 6E10-
immunofluorescence intensity in the 3xTg-AD mice than in the NTg ones (21.2 and 4.6 relative
fluorescence units, r.f.u., as median values, respectively, U-test, P=0.029). Interestingly, values
from the treated 3xTg-AD mice (6.7 r.f.u.) were significantly reduced in comparison to the
untreated ones (U-test, P=0.028) and did not statistically differ from the NTg ones, indicating that
intracellular signal intensity decreased to non-pathological levels after treatment (Figure 25A).
In the hippocampus, intracellular Aβ burden could not be measured in individual cells of the PCL
because of their stacked disposition, so the intensity of the signal was measured through the entire
CA3 PCL region. The slight increase in Aβ signal in the hippocampus from the 3xTg-AD mice was not
significantly different to the NTg ones (18.9 and 15.4 r.f.u., respectively, Figure 25B), probably
because the signal intensity of that small percentage of Aβ-containing cells in the CA3 PCL (12%)
became weakened when considering the entire layer. As was the case in the cortex, BLA
macroneurons from the 3xTg-AD mice showed significantly higher fluorescence intensity than the
NTg ones (18.3 and 6.3 r.f.u., respectively, U-test, P=0.029). Values from the treated 3xTg-AD group
(8.0 r.f.u.) were significantly different to the untreated ones (U-test, P=0.014) and did not
statistically differ from the NTg mice (Figure 25C), pointing again to the recovery of the non-
pathological levels by the treatment.
Since a wide range of intensities were detected within each neuron population, cells were classified
in five groups corresponding to different increasing levels of 6E10 signal intensity. Interestingly, the
effect of the treatment was evident in both cortical and amygdalar populations, promoting a
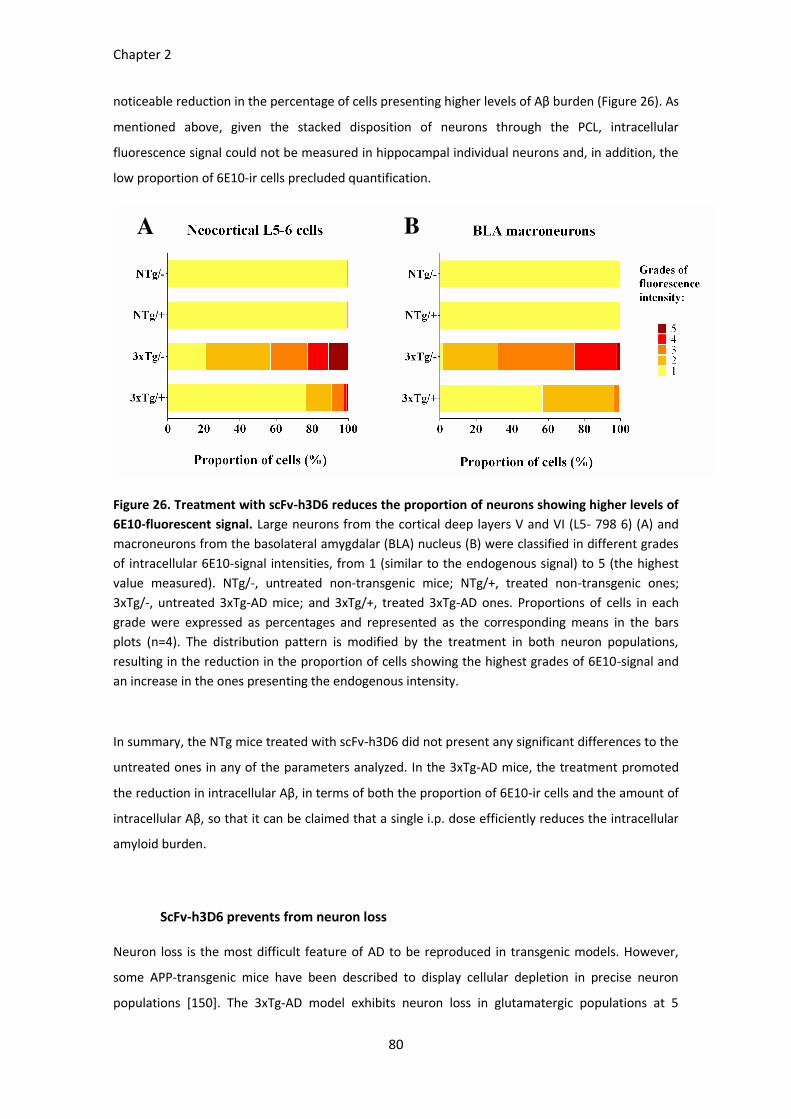
Chapter 2
80
noticeable reduction in the percentage of cells presenting higher levels of Aβ burden (Figure 26). As
mentioned above, given the stacked disposition of neurons through the PCL, intracellular
fluorescence signal could not be measured in hippocampal individual neurons and, in addition, the
low proportion of 6E10-ir cells precluded quantification.
Figure 26. Treatment with scFv-h3D6 reduces the proportion of neurons showing higher levels of
6E10-fluorescent signal. Large neurons from the cortical deep layers V and VI (L5- 798 6) (A) and
macroneurons from the basolateral amygdalar (BLA) nucleus (B) were classified in different grades
of intracellular 6E10-signal intensities, from 1 (similar to the endogenous signal) to 5 (the highest
value measured). NTg/-, untreated non-transgenic mice; NTg/+, treated non-transgenic ones;
3xTg/-, untreated 3xTg-AD mice; and 3xTg/+, treated 3xTg-AD ones. Proportions of cells in each
grade were expressed as percentages and represented as the corresponding means in the bars
plots (n=4). The distribution pattern is modified by the treatment in both neuron populations,
resulting in the reduction in the proportion of cells showing the highest grades of 6E10-signal and
an increase in the ones presenting the endogenous intensity.
In summary, the NTg mice treated with scFv-h3D6 did not present any significant differences to the
untreated ones in any of the parameters analyzed. In the 3xTg-AD mice, the treatment promoted
the reduction in intracellular Aβ, in terms of both the proportion of 6E10-ir cells and the amount of
intracellular Aβ, so that it can be claimed that a single i.p. dose efficiently reduces the intracellular
amyloid burden.
ScFv-h3D6 prevents from neuron loss
Neuron loss is the most difficult feature of AD to be reproduced in transgenic models. However,
some APP-transgenic mice have been described to display cellular depletion in precise neuron
populations [150]. The 3xTg-AD model exhibits neuron loss in glutamatergic populations at 5
A
B

Chapter 2
81
months old; concretely, in the large neurofilament H (NFH)-ir cells from the deep cortical layers,
hippocampal cells from the PCL CA3, and macroneurons from the BLA and from the fastigial and
interpositus deep cerebellar nuclei [191]. Interestingly, we previously demonstrated that the
treatment with scFv-h3D6 is efficient in preventing the loss of deep cerebellar neurons [151]. Here,
we aimed to determine the protective effect of scFv-h3D6 on the most vulnerable cerebral
populations from young 3xTg-AD females.
The number of cells per each neuron population was counted in anatomically matched sections and
relativized to the corresponding area, to be expressed as cell density (cells/mm2). Figure 27 and
Supplementary Table 5 show the determined densities and the corresponding statistical analysis, as
well as the extent of the preservation of densities with the treatment (calculated from means and
expressed as percentages). In the cerebral cortex, the density of the NFH-ir cells from the deep
layers presented similar values in both untreated and treated 3xTg-AD mice, with a median of 14.8
cells/mm2 in both cases (Figure 27A), and therefore the treatment was not effective in preserving
cell density from the cortex of the mouse model (Figure 27D).
By contrast, scFv-h3D6 completely prevented neuronal depletion in the CA3 PCL region of the
hippocampus, with an averaged preservation of 108%. The median value of 3153 cells/mm2 from
the treated 3xTg-AD mice reflects the protective effect when compared to the 2790 cells/mm2
from the untreated 3xTg-AD, and the 3107 cells/mm2 from the NTg ones. Statistically, treated 3xTg-
AD mice significantly differed from the untreated ones (U-test, P=0.029) and were far from
achieving differences to the NTg ones, supporting the recovery of the non-pathological values by
the treatment in the hippocampus (Figure 27B-D).
The protective effect of scFv-h3D6 was also evident in the BLA nucleus, in which cell densities were
757 cells/mm2 in the untreated 3xTg-AD mice and 1192 cells/mm2 in the treated ones, a value close
to the 1294 cells/mm2 quantified in the untreated NTg (Figure 27C). Thus, the treatment resulted in
79% of cell density preservation (Figure 27D). Again, untreated and treated 3xTg-AD mice
presented statistically differences (U-test, P=0.029) (Figure 27C) but no significance was reached
when comparing treated 3xTg-AD mice to the NTg ones, indicating once more the recovery of the
non-pathological values.
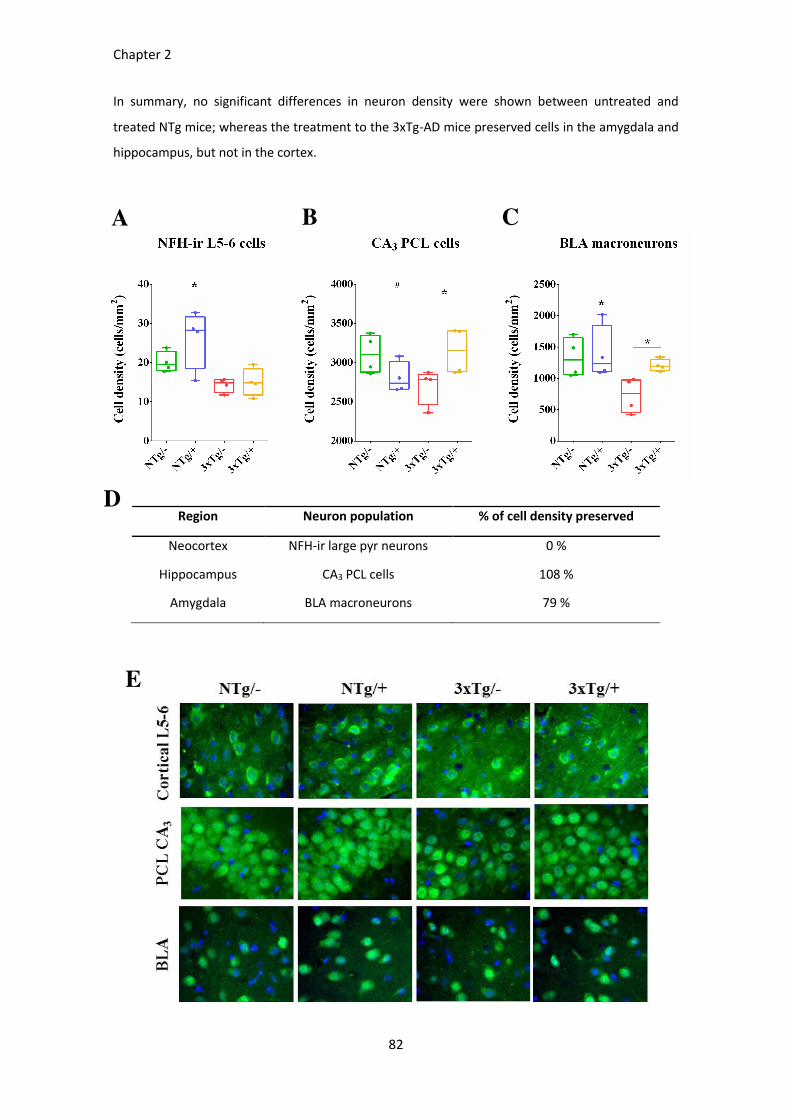
Chapter 2
82
In summary, no significant differences in neuron density were shown between untreated and
treated NTg mice; whereas the treatment to the 3xTg-AD mice preserved cells in the amygdala and
hippocampus, but not in the cortex.
Region Neuron population % of cell density preserved
Neocortex NFH-ir large pyr neurons 0 %
Hippocampus CA3 PCL cells 108 %
Amygdala BLA macroneurons 79 %
D
E
A B C
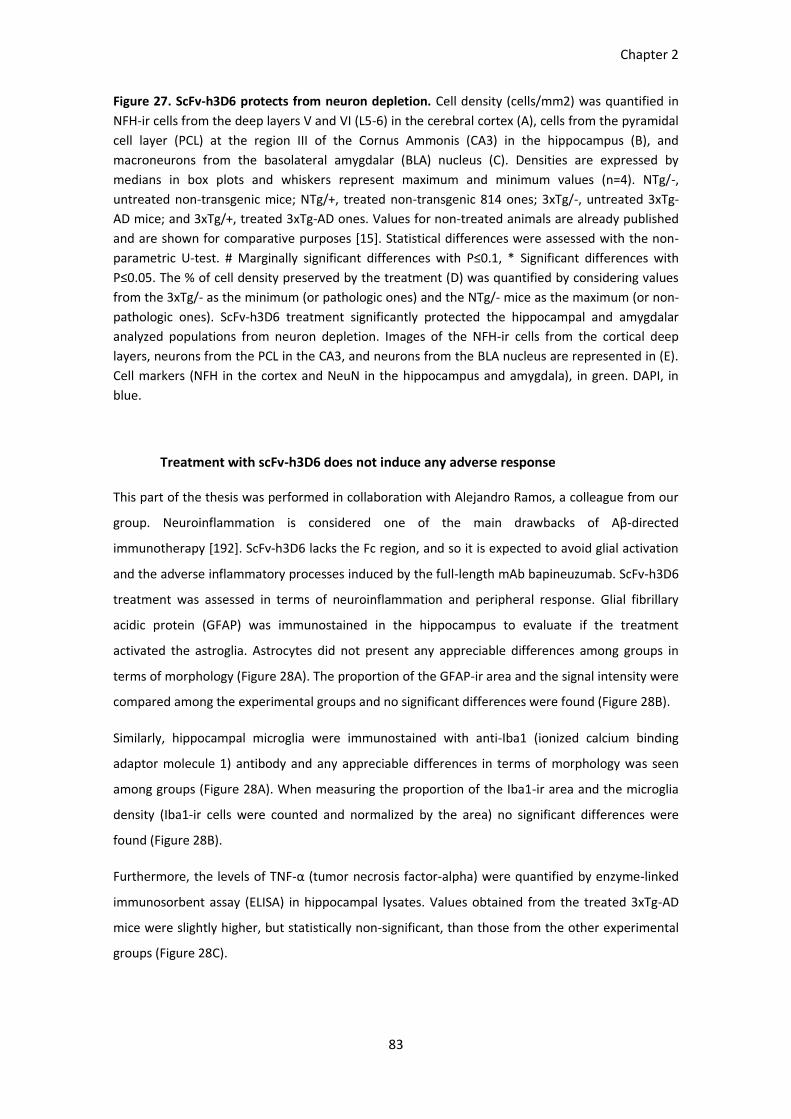
Chapter 2
83
Figure 27. ScFv-h3D6 protects from neuron depletion. Cell density (cells/mm2) was quantified in
NFH-ir cells from the deep layers V and VI (L5-6) in the cerebral cortex (A), cells from the pyramidal
cell layer (PCL) at the region III of the Cornus Ammonis (CA3) in the hippocampus (B), and
macroneurons from the basolateral amygdalar (BLA) nucleus (C). Densities are expressed by
medians in box plots and whiskers represent maximum and minimum values (n=4). NTg/-,
untreated non-transgenic mice; NTg/+, treated non-transgenic 814 ones; 3xTg/-, untreated 3xTg-
AD mice; and 3xTg/+, treated 3xTg-AD ones. Values for non-treated animals are already published
and are shown for comparative purposes [15]. Statistical differences were assessed with the non-
parametric U-test. # Marginally significant differences with P≤0.1, * Significant differences with
P≤0.05. The % of cell density preserved by the treatment (D) was quantified by considering values
from the 3xTg/- as the minimum (or pathologic ones) and the NTg/- mice as the maximum (or non-
pathologic ones). ScFv-h3D6 treatment significantly protected the hippocampal and amygdalar
analyzed populations from neuron depletion. Images of the NFH-ir cells from the cortical deep
layers, neurons from the PCL in the CA3, and neurons from the BLA nucleus are represented in (E).
Cell markers (NFH in the cortex and NeuN in the hippocampus and amygdala), in green. DAPI, in
blue.
Treatment with scFv-h3D6 does not induce any adverse response
This part of the thesis was performed in collaboration with Alejandro Ramos, a colleague from our
group. Neuroinflammation is considered one of the main drawbacks of Aβ-directed
immunotherapy [192]. ScFv-h3D6 lacks the Fc region, and so it is expected to avoid glial activation
and the adverse inflammatory processes induced by the full-length mAb bapineuzumab. ScFv-h3D6
treatment was assessed in terms of neuroinflammation and peripheral response. Glial fibrillary
acidic protein (GFAP) was immunostained in the hippocampus to evaluate if the treatment
activated the astroglia. Astrocytes did not present any appreciable differences among groups in
terms of morphology (Figure 28A). The proportion of the GFAP-ir area and the signal intensity were
compared among the experimental groups and no significant differences were found (Figure 28B).
Similarly, hippocampal microglia were immunostained with anti-Iba1 (ionized calcium binding
adaptor molecule 1) antibody and any appreciable differences in terms of morphology was seen
among groups (Figure 28A). When measuring the proportion of the Iba1-ir area and the microglia
density (Iba1-ir cells were counted and normalized by the area) no significant differences were
found (Figure 28B).
Furthermore, the levels of TNF-α (tumor necrosis factor-alpha) were quantified by enzyme-linked
immunosorbent assay (ELISA) in hippocampal lysates. Values obtained from the treated 3xTg-AD
mice were slightly higher, but statistically non-significant, than those from the other experimental
groups (Figure 28C).

Chapter 2
84
Figure 28. ScFv-h3D6 does not produce any neuroinflammatory response. GFAP (glial acidic
fibrillar protein, as astroglia marker) and Iba1 (ionized calcium binding adaptor molecule 1, as
microglia marker) immunodetection in the hippocampus (A). Squared cells from the images are
higher-magnified to properly appreciate cellular morphology. Scales bar, 50 µm (10 µm in higher-
A
B
C
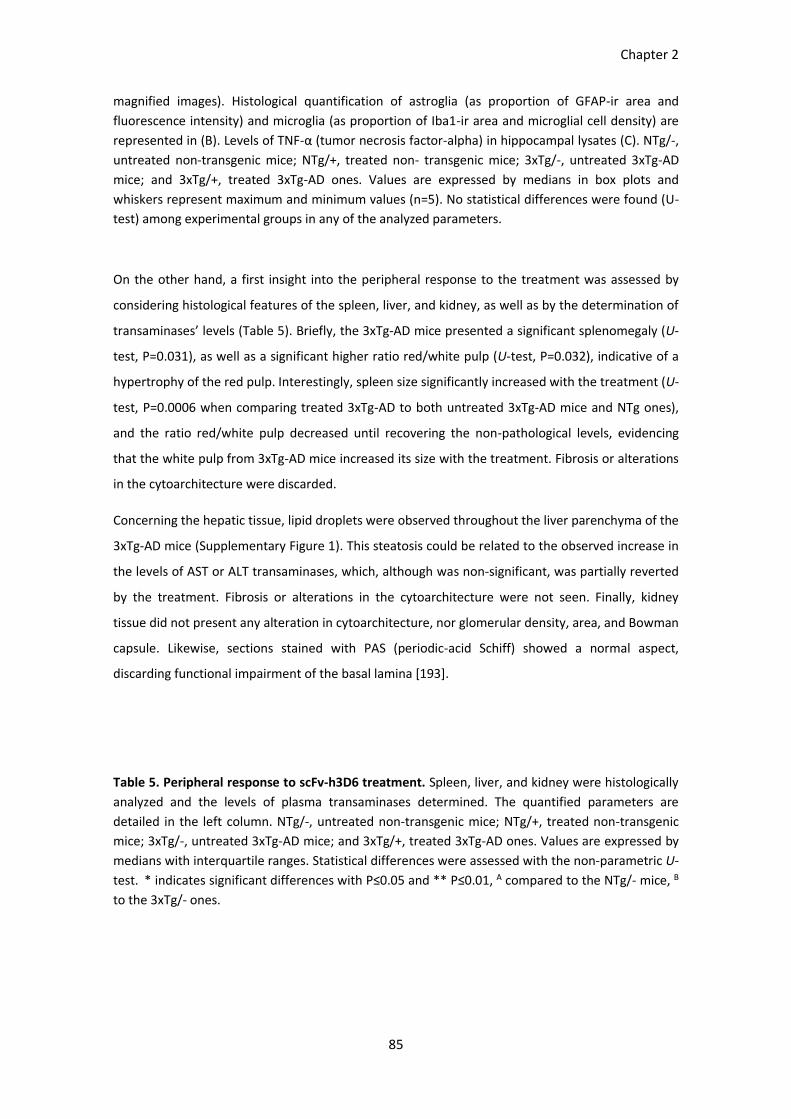
Chapter 2
85
magnified images). Histological quantification of astroglia (as proportion of GFAP-ir area and
fluorescence intensity) and microglia (as proportion of Iba1-ir area and microglial cell density) are
represented in (B). Levels of TNF-α (tumor necrosis factor-alpha) in hippocampal lysates (C). NTg/-,
untreated non-transgenic mice; NTg/+, treated non- transgenic mice; 3xTg/-, untreated 3xTg-AD
mice; and 3xTg/+, treated 3xTg-AD ones. Values are expressed by medians in box plots and
whiskers represent maximum and minimum values (n=5). No statistical differences were found (U-
test) among experimental groups in any of the analyzed parameters.
On the other hand, a first insight into the peripheral response to the treatment was assessed by
considering histological features of the spleen, liver, and kidney, as well as by the determination of
transaminases’ levels (Table 5). Briefly, the 3xTg-AD mice presented a significant splenomegaly (U-
test, P=0.031), as well as a significant higher ratio red/white pulp (U-test, P=0.032), indicative of a
hypertrophy of the red pulp. Interestingly, spleen size significantly increased with the treatment (U-
test, P=0.0006 when comparing treated 3xTg-AD to both untreated 3xTg-AD mice and NTg ones),
and the ratio red/white pulp decreased until recovering the non-pathological levels, evidencing
that the white pulp from 3xTg-AD mice increased its size with the treatment. Fibrosis or alterations
in the cytoarchitecture were discarded.
Concerning the hepatic tissue, lipid droplets were observed throughout the liver parenchyma of the
3xTg-AD mice (Supplementary Figure 1). This steatosis could be related to the observed increase in
the levels of AST or ALT transaminases, which, although was non-significant, was partially reverted
by the treatment. Fibrosis or alterations in the cytoarchitecture were not seen. Finally, kidney
tissue did not present any alteration in cytoarchitecture, nor glomerular density, area, and Bowman
capsule. Likewise, sections stained with PAS (periodic-acid Schiff) showed a normal aspect,
discarding functional impairment of the basal lamina [193].
Table 5. Peripheral response to scFv-h3D6 treatment. Spleen, liver, and kidney were histologically
analyzed and the levels of plasma transaminases determined. The quantified parameters are
detailed in the left column. NTg/-, untreated non-transgenic mice; NTg/+, treated non-transgenic
mice; 3xTg/-, untreated 3xTg-AD mice; and 3xTg/+, treated 3xTg-AD ones. Values are expressed by
medians with interquartile ranges. Statistical differences were assessed with the non-parametric U-
test. * indicates significant differences with P≤0.05 and ** P≤0.01, A compared to the NTg/- mice, B
to the 3xTg/- ones.
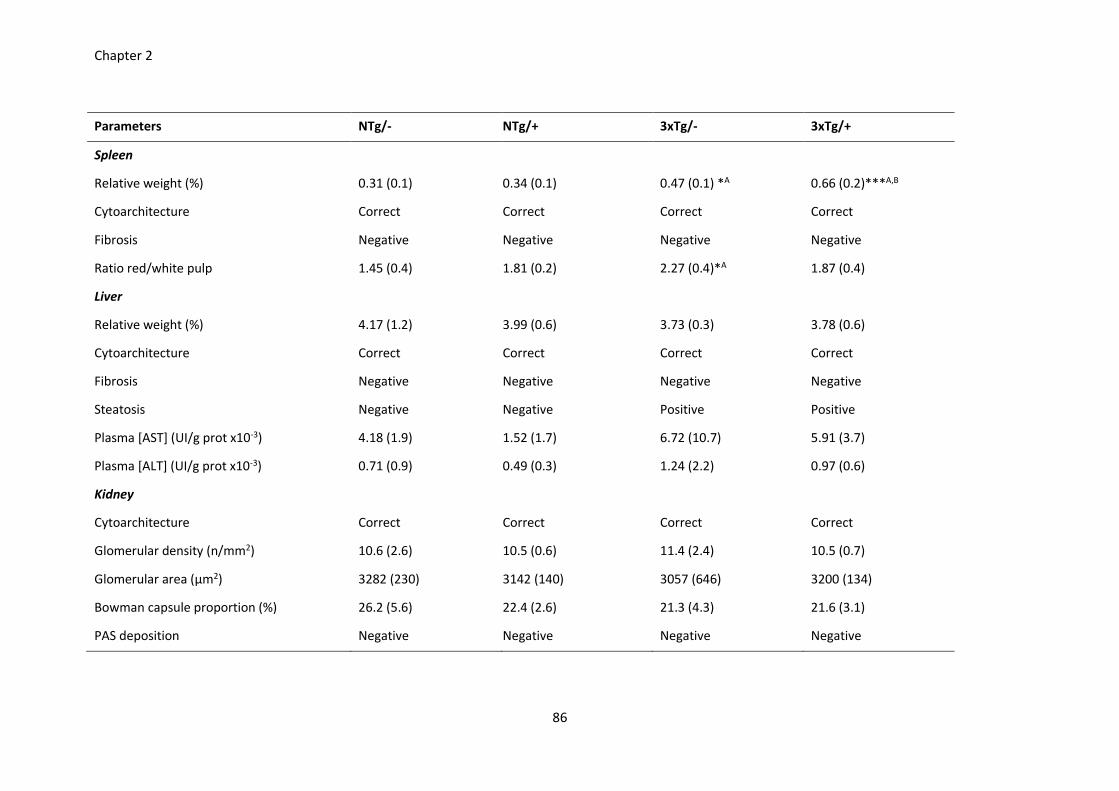
Chapter 2
86
Parameters NTg/- NTg/+ 3xTg/- 3xTg/+
Spleen
Relative weight (%) 0.31 (0.1) 0.34 (0.1) 0.47 (0.1) *A 0.66 (0.2)***A,B
Cytoarchitecture Correct Correct Correct Correct
Fibrosis Negative Negative Negative Negative
Ratio red/white pulp 1.45 (0.4) 1.81 (0.2) 2.27 (0.4)*A 1.87 (0.4)
Liver
Relative weight (%) 4.17 (1.2) 3.99 (0.6) 3.73 (0.3) 3.78 (0.6)
Cytoarchitecture Correct Correct Correct Correct
Fibrosis Negative Negative Negative Negative
Steatosis Negative Negative Positive Positive
Plasma [AST] (UI/g prot x10-3) 4.18 (1.9) 1.52 (1.7) 6.72 (10.7) 5.91 (3.7)
Plasma [ALT] (UI/g prot x10-3) 0.71 (0.9) 0.49 (0.3) 1.24 (2.2) 0.97 (0.6)
Kidney
Cytoarchitecture Correct Correct Correct Correct
Glomerular density (n/mm2) 10.6 (2.6) 10.5 (0.6) 11.4 (2.4) 10.5 (0.7)
Glomerular area (µm2) 3282 (230) 3142 (140) 3057 (646) 3200 (134)
Bowman capsule proportion (%) 26.2 (5.6) 22.4 (2.6) 21.3 (4.3) 21.6 (3.1)
PAS deposition Negative Negative Negative Negative
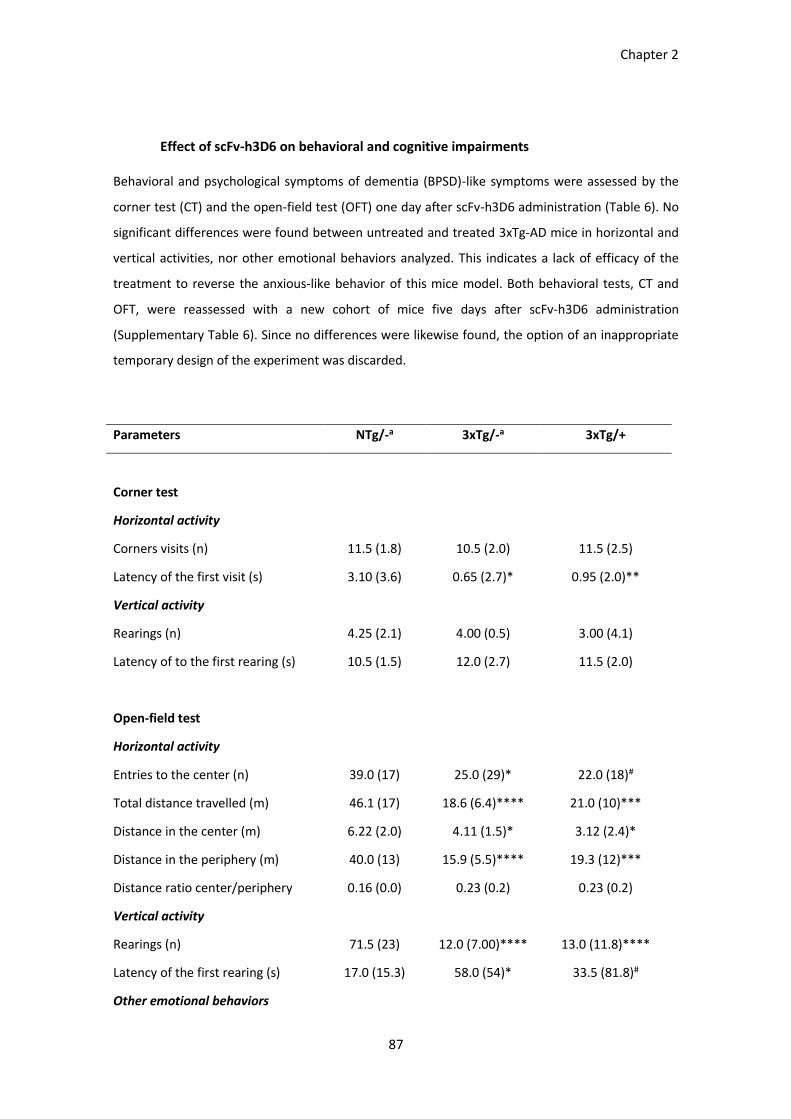
Chapter 2
87
Effect of scFv-h3D6 on behavioral and cognitive impairments
Behavioral and psychological symptoms of dementia (BPSD)-like symptoms were assessed by the
corner test (CT) and the open-field test (OFT) one day after scFv-h3D6 administration (Table 6). No
significant differences were found between untreated and treated 3xTg-AD mice in horizontal and
vertical activities, nor other emotional behaviors analyzed. This indicates a lack of efficacy of the
treatment to reverse the anxious-like behavior of this mice model. Both behavioral tests, CT and
OFT, were reassessed with a new cohort of mice five days after scFv-h3D6 administration
(Supplementary Table 6). Since no differences were likewise found, the option of an inappropriate
temporary design of the experiment was discarded.
Parameters NTg/-a 3xTg/-a 3xTg/+
Corner test
Horizontal activity
Corners visits (n) 11.5 (1.8) 10.5 (2.0) 11.5 (2.5)
Latency of the first visit (s) 3.10 (3.6) 0.65 (2.7)* 0.95 (2.0)**
Vertical activity
Rearings (n) 4.25 (2.1) 4.00 (0.5) 3.00 (4.1)
Latency of to the first rearing (s) 10.5 (1.5) 12.0 (2.7) 11.5 (2.0)
Open-field test
Horizontal activity
Entries to the center (n) 39.0 (17) 25.0 (29)* 22.0 (18)#
Total distance travelled (m) 46.1 (17) 18.6 (6.4)**** 21.0 (10)***
Distance in the center (m) 6.22 (2.0) 4.11 (1.5)* 3.12 (2.4)*
Distance in the periphery (m) 40.0 (13) 15.9 (5.5)**** 19.3 (12)***
Distance ratio center/periphery 0.16 (0.0) 0.23 (0.2) 0.23 (0.2)
Vertical activity
Rearings (n) 71.5 (23) 12.0 (7.00)**** 13.0 (11.8)****
Latency of the first rearing (s) 17.0 (15.3) 58.0 (54)* 33.5 (81.8)#
Other emotional behaviors

Chapter 2
88
Self-groomings (n) 4.50 (1.8) 3.00 (1.0)* 2.00 (1.8)*
1st self-grooming latency (s) 111 (111) 276 (200)* 208 (222)#
Defecations (n) 2.50 (3.3) 3.00 (3.3) 2.00 (1.8)
Table 6. BPSD-like symptoms in the CT and OFT 1 day after the treatment. ScFv-h3D6 was
assessed in terms of neophobia, exploration and other emotional behaviors by the corner test (CT)
and the open-field test (OFT). The analyzed parameters are detailed in the left column. NTg/-,
untreated non-transgenic mice; 3xTg/-, untreated 3xTg-AD mice; and 3xTg/+, treated 3xTg-AD
ones. Values are expressed by medians with interquartile ranges. Statistical differences were
assessed with the non-parametric U-test. # Marginally significant differences with P≤0.1, *
Significant differences with P≤0.05, ** P≤0.01, and *** P≤0.001 compared to the NTg/- mice; no
differences to the 3xTg/- ones were found. a These data are considered in the Chapter 1 and are
shown here for comparative purposes.
Results from the novel-object recognition test (NORT), performed the second day after the
treatment, are detailed in Supplementary Table 7 and summarized in Figure 29. The exploratory
activity was evaluated by the total distance traveled in the arena, as well as the total time spent
exploring the objects and the total number of visits (Figure 29A). The treatment was unable to
recover the reduced exploratory activity of the 3xTg-AD mice, supporting the results obtained in
the CT and OFT. Concerning the recognition memory, the treated 3xTg-AD mice stayed cautiously
near the novel object for a while, as observed in the representative heat map, but any of the
discrimination indexes (calculated from the total time spent exploring each object and number of
visits to each one) presented significant differences between both 3xTg-AD groups (Figure 29B).

Chapter 2
89
A
B
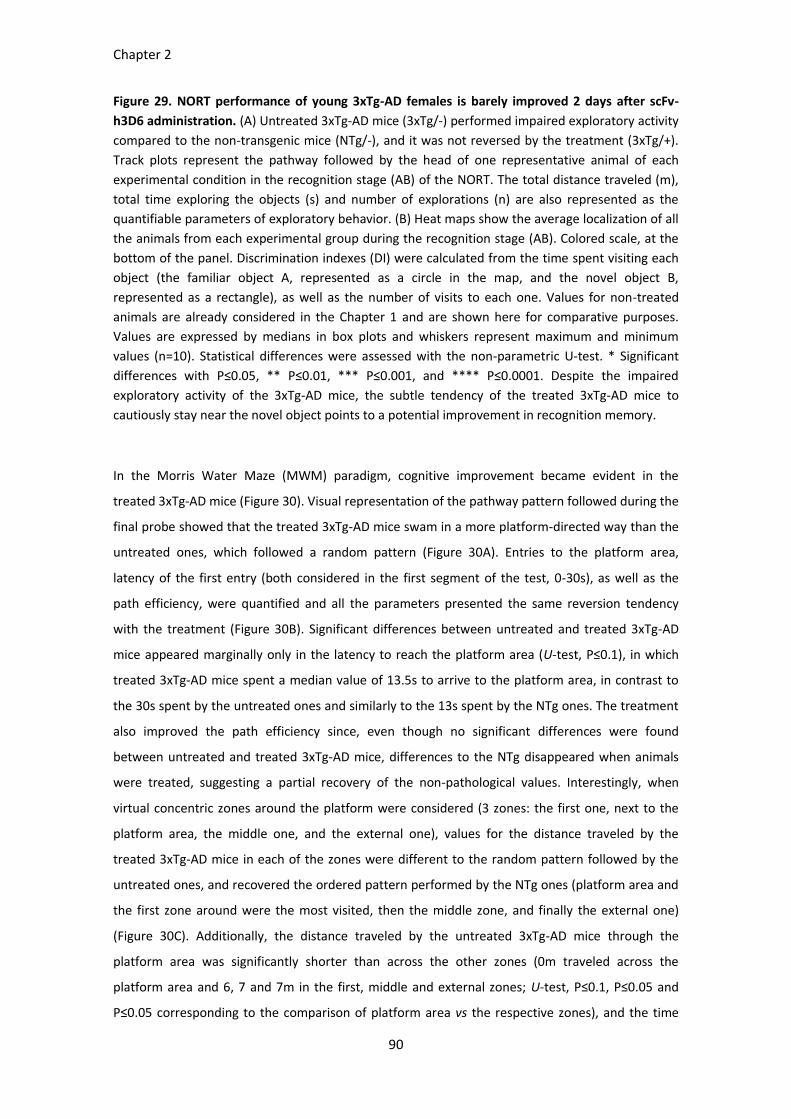
Chapter 2
90
Figure 29. NORT performance of young 3xTg-AD females is barely improved 2 days after scFv-
h3D6 administration. (A) Untreated 3xTg-AD mice (3xTg/-) performed impaired exploratory activity
compared to the non-transgenic mice (NTg/-), and it was not reversed by the treatment (3xTg/+).
Track plots represent the pathway followed by the head of one representative animal of each
experimental condition in the recognition stage (AB) of the NORT. The total distance traveled (m),
total time exploring the objects (s) and number of explorations (n) are also represented as the
quantifiable parameters of exploratory behavior. (B) Heat maps show the average localization of all
the animals from each experimental group during the recognition stage (AB). Colored scale, at the
bottom of the panel. Discrimination indexes (DI) were calculated from the time spent visiting each
object (the familiar object A, represented as a circle in the map, and the novel object B,
represented as a rectangle), as well as the number of visits to each one. Values for non-treated
animals are already considered in the Chapter 1 and are shown here for comparative purposes.
Values are expressed by medians in box plots and whiskers represent maximum and minimum
values (n=10). Statistical differences were assessed with the non-parametric U-test. * Significant
differences with P≤0.05, ** P≤0.01, *** P≤0.001, and **** P≤0.0001. Despite the impaired
exploratory activity of the 3xTg-AD mice, the subtle tendency of the treated 3xTg-AD mice to
cautiously stay near the novel object points to a potential improvement in recognition memory.
In the Morris Water Maze (MWM) paradigm, cognitive improvement became evident in the
treated 3xTg-AD mice (Figure 30). Visual representation of the pathway pattern followed during the
final probe showed that the treated 3xTg-AD mice swam in a more platform-directed way than the
untreated ones, which followed a random pattern (Figure 30A). Entries to the platform area,
latency of the first entry (both considered in the first segment of the test, 0-30s), as well as the
path efficiency, were quantified and all the parameters presented the same reversion tendency
with the treatment (Figure 30B). Significant differences between untreated and treated 3xTg-AD
mice appeared marginally only in the latency to reach the platform area (U-test, P≤0.1), in which
treated 3xTg-AD mice spent a median value of 13.5s to arrive to the platform area, in contrast to
the 30s spent by the untreated ones and similarly to the 13s spent by the NTg ones. The treatment
also improved the path efficiency since, even though no significant differences were found
between untreated and treated 3xTg-AD mice, differences to the NTg disappeared when animals
were treated, suggesting a partial recovery of the non-pathological values. Interestingly, when
virtual concentric zones around the platform were considered (3 zones: the first one, next to the
platform area, the middle one, and the external one), values for the distance traveled by the
treated 3xTg-AD mice in each of the zones were different to the random pattern followed by the
untreated ones, and recovered the ordered pattern performed by the NTg ones (platform area and
the first zone around were the most visited, then the middle zone, and finally the external one)
(Figure 30C). Additionally, the distance traveled by the untreated 3xTg-AD mice through the
platform area was significantly shorter than across the other zones (0m traveled across the
platform area and 6, 7 and 7m in the first, middle and external zones; U-test, P≤0.1, P≤0.05 and
P≤0.05 corresponding to the comparison of platform area vs the respective zones), and the time
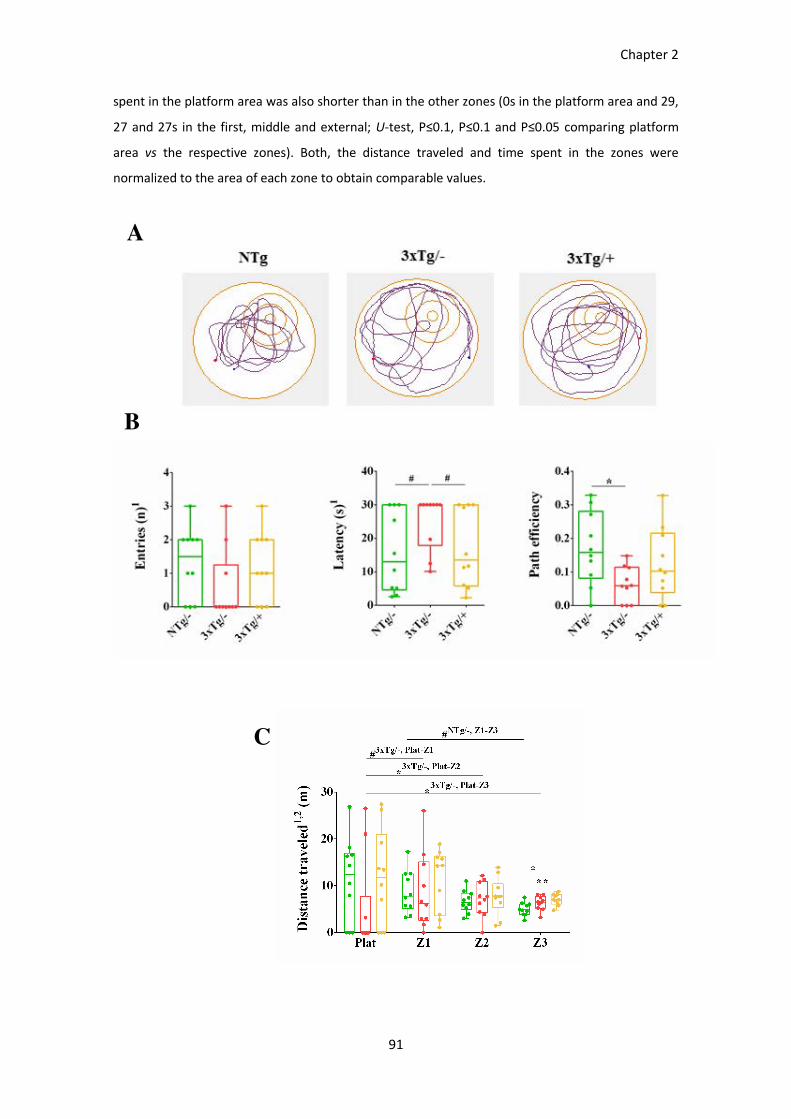
Chapter 2
91
spent in the platform area was also shorter than in the other zones (0s in the platform area and 29,
27 and 27s in the first, middle and external; U-test, P≤0.1, P≤0.1 and P≤0.05 comparing platform
area vs the respective zones). Both, the distance traveled and time spent in the zones were
normalized to the area of each zone to obtain comparable values.
A
B
C
Chapter 2
92
Figure 30. Spatial memory is ameliorated by scFv-h3D6 treatment. (A) Track plots show the
pathway followed to the platform with the example of one animal from each experimental group in
the final probe of the MWM paradigm. (B) Entries to the platform zone (n), latency of the first one
(s), and path efficiency to the platform are expressed by medians in box plots and whiskers
represent maximum and minimum values (n=10). (C) Comparison of the distance traveled (m)
across virtual zones concentric to the platform, also acquired in the final probe of the MWM.
Values for non-treated animals are already considered in the Chapter 1 and are shown here for
comparative purposes. 1 parameters considered on the first segment of the test, 0-30s. 2
correspond to the distance per zone and are normalized to the areas occupied by each zone. Values
are expressed by medians in box plots and whiskers represent maximum and minimum values
(n=10). Statistical differences were assessed with the non-parametric U-test. # Marginally
significant differences with P≤0.1, * Significant differences with P≤0.05, ** P≤0.01, *** P≤0.001,
and **** P≤0.0001. NTg/-, untreated non-transgenic mice; 3xTg/-, untreated 3xTg- AD mice; and
3xTg/+, treated 3xTg-AD ones. All the parameters analyzed tend to recover the non-pathological
values after the treatment, some of which even reached statistical significance.
Therefore, the treatment was not able to recover the BPSD-like symptoms already described in the
3xTg-AD 5-mo-old females, as shown by the CT and OFT performances. However, a slight cognitive
improvement in the recognition memory, as assessed by the NORT, as well as an evident
improvement in the spatial memory, as shown by the MWM, showed the capability of the
treatment to recover the non-pathological values.
Chapter 2
93
DISCUSSION
Therapies used nowadays to treat AD patients are focused on ameliorating impairments in the
cholinergic system (by using acetyl cholinesterase inhibitors such as donepezil, galantamine and
rivastigmine) or in the glutamatergic one (by memantine, an antagonist of the glutamate receptor)
[42]. Therefore, these drugs are only palliative, instead of modifying the disease progression. Given
the central role of the Aβ peptide in neurodegeneration, Aβ-immunotherapy has emerged as a
promising strategy to cure AD [194, 195]. Several full length mAbs, such as bapineuzumab,
solanezumab, gantenerumab and aducanumab, have reached Phase III of clinical trials [196].
Bapineuzumab was the first one to show efficiency, but serious drawbacks, such as vasogenic
edema and microhemorrhage, forced the discontinuation of clinical trials [121]. Because these
severe effects are supposed to be related to the Fc fraction via FcγR-dependent activation of the
microglia, the use of scFv fragments should constitute a safer therapy [190]. Several antibody
fragments have been shown efficient in treating animal models of AD [113, 195, 197]. For instance,
anti-Aβ scFvs such as scFv9 and scFv42.2 exhibited neuroprotective effects in D. Melanogaster,
such as reducing neuron death and protecting structural integrity of dendritic terminals, and
reduced insoluble Aβ42 peptide in the TgCRND8 mouse model [198]. Antonios et al. demonstrated
that intraventricular injection of both the complete antibody NT4X and its Fab fragment (specific
for Aβ4-X and pyroglutamate Aβ3-X) alleviated neuron loss and improved memory deficits in the Tg4-
42 mice [199]. The 3xTg-AD mice have been widely tested with immunotherapy, from complete Aβ-
or tau-directed antibodies [200, 201] to an scFv, which reduced the insoluble Aβ peptide and
ameliorated cognitive functions [202]. However, this scFv was intrahippocampally infused as an
rAAV vector whereas the intraperitoneal route used in this work can directly be translated to
humans.
Efficiency of the scFv-h3D6
As mentioned in the introduction, we already showed that scFv-h3D6 avoids Aβ-induced
cytotoxicity in SHSY-5Y neuroblastoma cell cultures [120], and that it decreases Aβ oligomers in the
cortex of 5-mo-old 3xTg-AD females, apart from other beneficial effects [124, 151]. On the other
hand, and in the 3xTg-AD mouse model as well, we recently evidenced a correlation between
intracellular amyloid pathology and neurodegeneration in those populations early involved in AD
[191]. Here, we have focused on assessing the efficiency of scFv-h3D6 treatment on these
populations in terms of both amyloid pathology and neuron depletion.

Chapter 2
94
The proportion of 6E10-ir neurons in the cerebral cortex, hippocampus and amygdala of the
treated 3xTg-AD was lower than in the untreated ones. A reduction in the intracellular Aβ burden
was also evident after treatment in the cortical and amygdalar populations, which recovered the
non-pathological levels, but no significant differences were seen in the hippocampus probably
because at this age the amyloid levels are rather low in this area. Furthermore, treated 3xTg-AD
mice presented higher cellular densities than the untreated ones, achieving non-pathological
values in the hippocampus and amygdala. This was not the case in the deep cortical layers, likely
because the disease is described to begin at this area [98, 102] and at 5-mo of age the extent of cell
death is considerable. We cannot rule out, however, the possibility of the suitability of the antibody
used, detecting neurons with a complex cytoskeletal structure [134], not being the most specific to
detect pyramidal neurons from the deep cortical layers. In any case, the benefit of a single i.p. dose
of scFv-h3D6 was dramatic, both in terms of the reduction in amyloid burden and neuron
preservation. Concurring with the previous publication, there is a correlation between intracellular
amyloid pathology and neurodegeneration in the 3xTg-AD mouse model [191].
In turn, cognitive improvement evidenced the functional effects of the treatment. Concretely, a
slight tendency to recovering the recognition memory and a clear recovery of the spatial memory,
as tested by the NORT and MWM respectively, were shown. However, the anxious-like behavior
observed in the 3xTg-AD mice was not precluded by the treatment. This was probably so because
the intracellular amyloid pathology was not completely recovered in the amygdala, which was the
most affected region in terms of intracellular amyloid burden and where the proportion of Aβ-
containing cells was recovered the less after the treatment. These data are consistent with similar
works in which immunotherapy achieved amelioration of hippocampal-dependent tasks but not
amygdalar-dependent ones, since the amyloid pathology was not recovered in the amygdala [105].
First insight into the safety of scFv-h3D6 treatment
One of the main drawbacks of immunotherapy is neuroinflammation [192]. An objection to the
translation from preclinical trials to humans is the different neuroinflammatory response, with
other potentially harmful effects such as the vasogenic edema occurred in the phase III clinical
trials with bapineuzumab [121]. A significant inflammatory response (by increased levels of pro-
inflammatory cytokines IL-1β and TNF-α) and microglial activation (by the increased microglial
expression of CD11B and CD68) occurred when 3D6, the murine version of bapineuzumab, was
tested in 18-mo-old Tg2576 mice, an APP-transgenic model, by injecting a single-dose of 2 µg into
the hippocampus [192]. Interestingly scFv-h3D6 did not induce the activation of the astroglia or
microglia, neither significantly increased the levels of the pro-inflammatory TNF-α.
Chapter 2
95
The 3xTg-AD mice showed splenomegaly, as previously reported [203], being concretely the red
pulp the enlarged portion. Interestingly, this concurs with a recent publication by Brubaker et al.,
which supports the complement-dependent erythrocyte-mediated clearance of circulating immune
complexes (known as immune adherence [204, 205]), applying it to the peripheral Aβ clearance
[206]. The authors emphasize the role of erythrocytes in the capture of complement-opsonized Aβ
peptide and the subsequent hepatic degradation via Kupffer cells in healthy organisms, and the
impairment of this pathway in AD. Immune adherence has been considered to occur by the
complement receptor 1 (CR1), which is uniquely present in primates, and to be significantly limited
in sub-primates, whose erythrocytes express other complement receptors such as Crry [207].
However, our findings suggest a potential overload on the red pulp of the 3xTg-AD mice, to further
produce erythrocytes to deal with the overproduction of the Aβ peptide. This is concomitant with
the increase in the size of the white pulp in the treated 3xTg-AD animals, what points to the
relationship between the peripheral complement interactions with the Aβ peptide and Aβ-
immunotherapy, enhancing not only the erythrocyte capture of Aβ forming immune complexes
(Aβ:scFv-h3D6 in this case), but also macrophages activation [208].
On the other hand, steatosis was detected in the liver of 3xTg-AD females, and this could be related
with the increase in the values of AST or ALT transaminases also observed in this work, which,
although were non-significantly different, were partially reverted by the treatment. These effects
have been reported in the literature for rats on high fat diet-induced steatosis [209]. To our
knowledge, this is the first description of the fatty liver pathology in this model, what paves the
way to future studies. As a general conclusion, we have proven that a single i.p. dose of 100 µg of
scFv-h3D6 dramatically reduces intracellular amyloid pathology, with the subsequent preservation
of cell density and amelioration of cognitive disabilities. The treatment resulted safe in terms of
neuroinflammation and kidneys and liver function, while the spleen is likely to be involved in the
clearance mechanism of the Aβ:scFv-h3D6 complex.

96
97
CHAPTER 3
Pharmacokinetics of scFv-h3D6 and first approach to its
mechanism of action

98
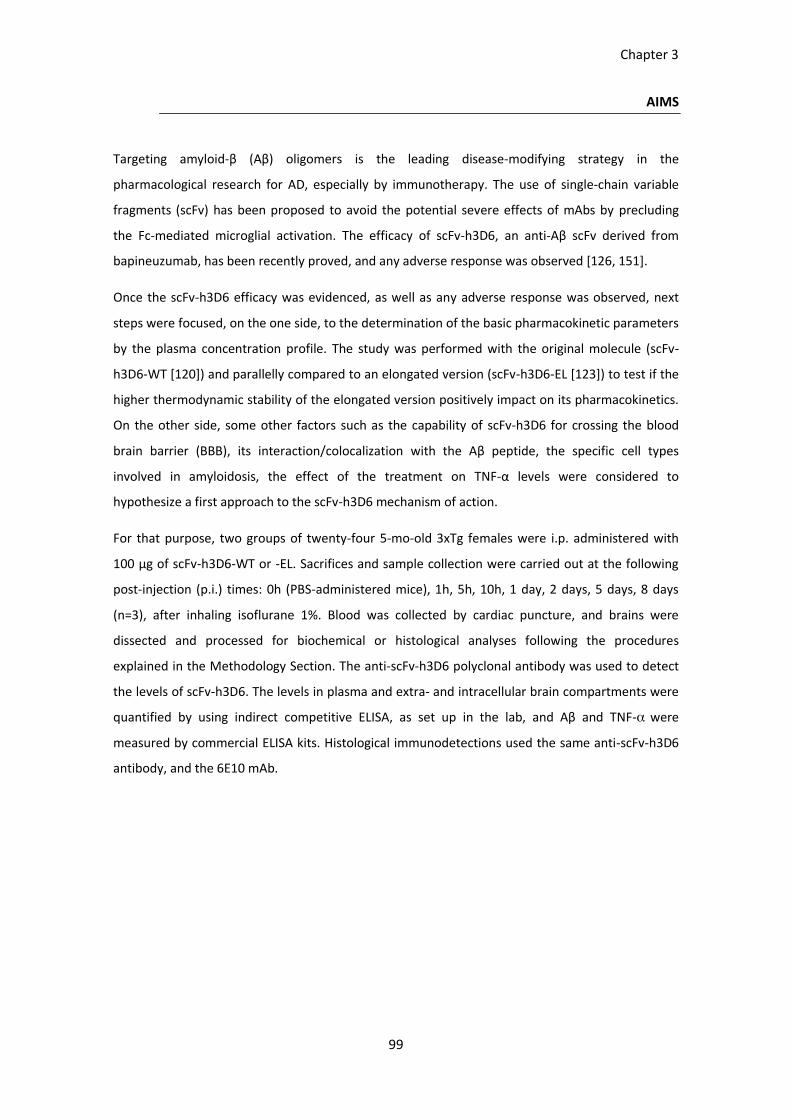
Chapter 3
99
AIMS
Targeting amyloid-β (Aβ) oligomers is the leading disease-modifying strategy in the
pharmacological research for AD, especially by immunotherapy. The use of single-chain variable
fragments (scFv) has been proposed to avoid the potential severe effects of mAbs by precluding
the Fc-mediated microglial activation. The efficacy of scFv-h3D6, an anti-Aβ scFv derived from
bapineuzumab, has been recently proved, and any adverse response was observed [126, 151].
Once the scFv-h3D6 efficacy was evidenced, as well as any adverse response was observed, next
steps were focused, on the one side, to the determination of the basic pharmacokinetic parameters
by the plasma concentration profile. The study was performed with the original molecule (scFv-
h3D6-WT [120]) and parallelly compared to an elongated version (scFv-h3D6-EL [123]) to test if the
higher thermodynamic stability of the elongated version positively impact on its pharmacokinetics.
On the other side, some other factors such as the capability of scFv-h3D6 for crossing the blood
brain barrier (BBB), its interaction/colocalization with the Aβ peptide, the specific cell types
involved in amyloidosis, the effect of the treatment on TNF-α levels were considered to
hypothesize a first approach to the scFv-h3D6 mechanism of action.
For that purpose, two groups of twenty-four 5-mo-old 3xTg females were i.p. administered with
100 µg of scFv-h3D6-WT or -EL. Sacrifices and sample collection were carried out at the following
post-injection (p.i.) times: 0h (PBS-administered mice), 1h, 5h, 10h, 1 day, 2 days, 5 days, 8 days
(n=3), after inhaling isoflurane 1%. Blood was collected by cardiac puncture, and brains were
dissected and processed for biochemical or histological analyses following the procedures
explained in the Methodology Section. The anti-scFv-h3D6 polyclonal antibody was used to detect
the levels of scFv-h3D6. The levels in plasma and extra- and intracellular brain compartments were
quantified by using indirect competitive ELISA, as set up in the lab, and Aβ and TNF-α were
measured by commercial ELISA kits. Histological immunodetections used the same anti-scFv-h3D6
antibody, and the 6E10 mAb.

Chapter 3
100
RESULTS
Comparative pharmacokinetics between the scFv-h3D6-WT and -EL
The beneficial effects of scFv-h3D6, after a single intraperitoneal injection of 100 µg, have already
been demonstrated in young 3xTg-AD females [126, 151]. To properly define the most important
determinants for designing future longitudinal pharmacodynamic testing of any molecule, it is
essential to define its pharmacokinetics. In this sense, pharmacokinetic features of scFv-h3D6 have
been analyzed by studying the variation on the plasma concentration of the original form of the
molecule, scFv-h3D6-WT, and of the thermodynamically more stable elongated version, scFv-h3D6-
EL. Plasma concentration of the corresponding molecule was quantified at all the analyzed post-
injection (p.i.) points (0h or vehicle-injected, 1h, 5h, 10h, 1 day, 2 days, 5 days and 8 days) by
competitive ELISA. Values were represented by plotting the concentration-time curve (Figure 31A),
from which the main pharmacokinetic parameters were calculated (Figure 31B).
Absorption from the intraperitoneal cavity to the blood most likely occurred before 1h p.i. in both
cases (Figure 31A) and followed a similar profile. However, the higher peak initially observed in the
scFv-h3D6-WT profile, compared to the -EL one, evidenced an enhanced absorption of the original
molecule. Following the pronounced initial peak, a second peak appeared at ~24h), what could
suggest either a two-phased absorption or a compartmental distribution of the molecule. The
higher absorption of the scFv-h3D6-WT compared to the scFv-h3D6-EL molecule affected the rest
of the pharmacokinetic profile, obtaining values of AUC (area under the curve, measured by the
trapezoidal rule for the n-1 subintervals from 0 to the last time point) five-fold higher for the scFv-
h3D6-WT than for the -EL version (Figure 31B). However, scFv-h3D6-EL exhibited a longer half-life
than the -WT (values for the elongated version almost doubled the ones for the original version),
what concurs with the improved stability observed in biophysical analyses [122, 126].

Chapter 3
101
scFv-h3D6-WT scFv-h3D6-EL
Cmax (µg/mL) 2.04 0.76
Tmax (h) ≤ 1 ≤ 1
AUC 47.7 8.6
t1/2 (h) 3.2 6.0
Figure 31. Plasma concentration of scFv-h3D6-WT and -EL. A) Concentrations were measured by
competitive ELISA at 0h (vehicle-injected), and 1h, 5h, 10h, 1 day, 2 days, 5 days, and 8 days post-
injection (p.i.). In red, scFv-h3D6-WT profile; in blue, the scFv-h3D6-EL one. Concentrations are
expressed as µg of scFv-h3D6/mL of plasma. Values are represented by means and SEM. B)
Comparative pharmacokinetic parameters of scFv-h3D6-WT and -EL quantified from the
concentration/time curve: Cmax (maximum plasma concentration, µg/mL), Tmax (time to reach
Cmax, h), AUC (area under the curve), t1/2 (half-life, h).
A
B
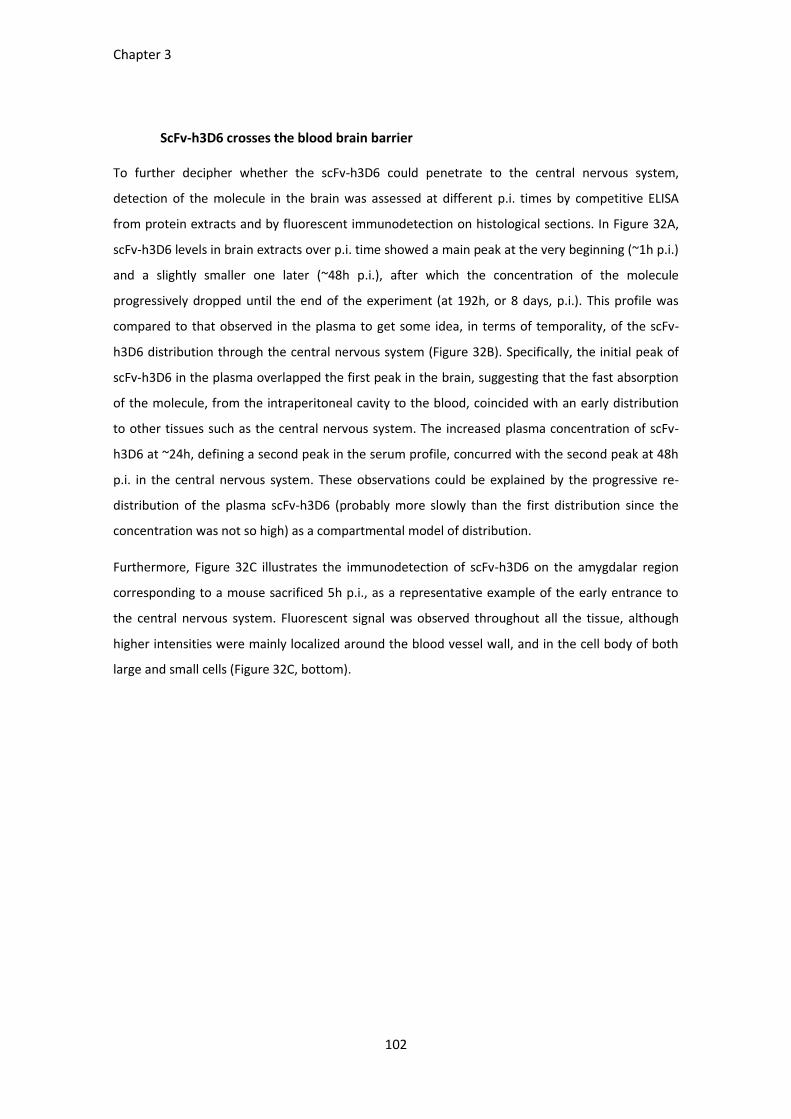
Chapter 3
102
ScFv-h3D6 crosses the blood brain barrier
To further decipher whether the scFv-h3D6 could penetrate to the central nervous system,
detection of the molecule in the brain was assessed at different p.i. times by competitive ELISA
from protein extracts and by fluorescent immunodetection on histological sections. In Figure 32A,
scFv-h3D6 levels in brain extracts over p.i. time showed a main peak at the very beginning (~1h p.i.)
and a slightly smaller one later (~48h p.i.), after which the concentration of the molecule
progressively dropped until the end of the experiment (at 192h, or 8 days, p.i.). This profile was
compared to that observed in the plasma to get some idea, in terms of temporality, of the scFv-
h3D6 distribution through the central nervous system (Figure 32B). Specifically, the initial peak of
scFv-h3D6 in the plasma overlapped the first peak in the brain, suggesting that the fast absorption
of the molecule, from the intraperitoneal cavity to the blood, coincided with an early distribution
to other tissues such as the central nervous system. The increased plasma concentration of scFv-
h3D6 at ~24h, defining a second peak in the serum profile, concurred with the second peak at 48h
p.i. in the central nervous system. These observations could be explained by the progressive re-
distribution of the plasma scFv-h3D6 (probably more slowly than the first distribution since the
concentration was not so high) as a compartmental model of distribution.
Furthermore, Figure 32C illustrates the immunodetection of scFv-h3D6 on the amygdalar region
corresponding to a mouse sacrificed 5h p.i., as a representative example of the early entrance to
the central nervous system. Fluorescent signal was observed throughout all the tissue, although
higher intensities were mainly localized around the blood vessel wall, and in the cell body of both
large and small cells (Figure 32C, bottom).
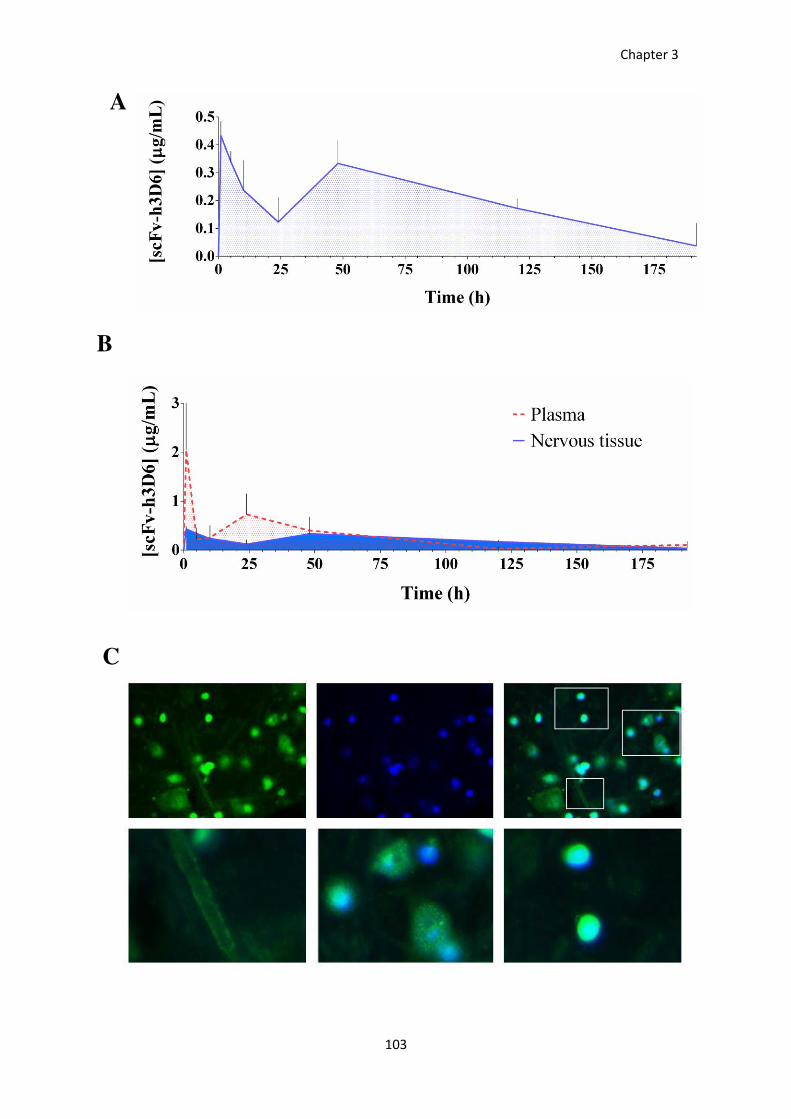
Chapter 3
103
A
C
B
Chapter 3
104
Figure 32. ScFv-h3D6 influx to the brain. ScFv-h3D6 was detected and quantified by ELISA. A) ScFv-
h3D6 concentration in nervous tissue protein extracts over time post-injection (p.i.): 0h (vehicle-
injected), 1h, 5h, 10h, 1 day, 2 days, 5 days, and 8 days. B) Comparative profiles of scFv-h3D6 in
plasma (red dashed line) and nervous tissue (blue). Concentrations are expressed as µg of scFv-
h3D6/mL of plasma or brain protein extract. Values are represented by means and SEM. C)
Representative illustration, corresponding to the amygdalar region, of the scFv-h3D6
immunodetection on a 10 µm-thick brain section (5h p.i.). On the top, from the left to the right:
scFv-h3D6 (in green), DAPI (in blue), and the merged image. Squares in the merged image are
shown in the bottom, and correspond to zooms into a blood vessel, large neurons, and small-size
cells.
ScFv-h3D6 is internalized by cells
The levels of scFv-h3D6 from the extracellular and intracellular brain compartments were
quantified to further evidence the internalization process. Protein extracts from the same p.i. time
points were assessed by competitive ELISA. In Figure 33A, the profiles of scFv-h3D6 concentration
in the extra- and intracellular compartments are represented over time. The first peak in the
extracellular compartment reached almost the double concentration than the first peak in the
intracellular one, whereas differences between both compartments were not so abrupted through
the rest of the profile. This suggests that the great early scFv-h3D6 inflow to the central nervous
system promoted an initial accumulation in the extracellular compartment which was subsequently
distributed between both compartments.
Interestingly, the comparative superposition of both extra- and intracellular profiles of scFv-h3D6
facilitated the interpretation of the results (Figure 33B). The first peak in the extracellular
compartment (~1h p.i.) evidenced the penetrance into the central nervous system. The first peak in
the intracellular compartment appears later (~5h p.i.) and coincides with the reduction in the
extracellular levels, suggesting the cellular internalization of the molecule. In both compartments, a
second and soft peak appeared later (~48h p.i.), which could be interpreted as the influx of the
scFv-h3D6 accumulated in the plasma at 24h p.i., as suggested in the previous subsection (see
Figure 31A and Figure 32B). Afterward, scFv-h3D6 concentration progressively decreased in both
compartments, evidencing a clearance process. The fact that the intracellular levels kept higher
than the extracellular ones through late phases points to a cell-mediated mechanism of clearance
in the brain.
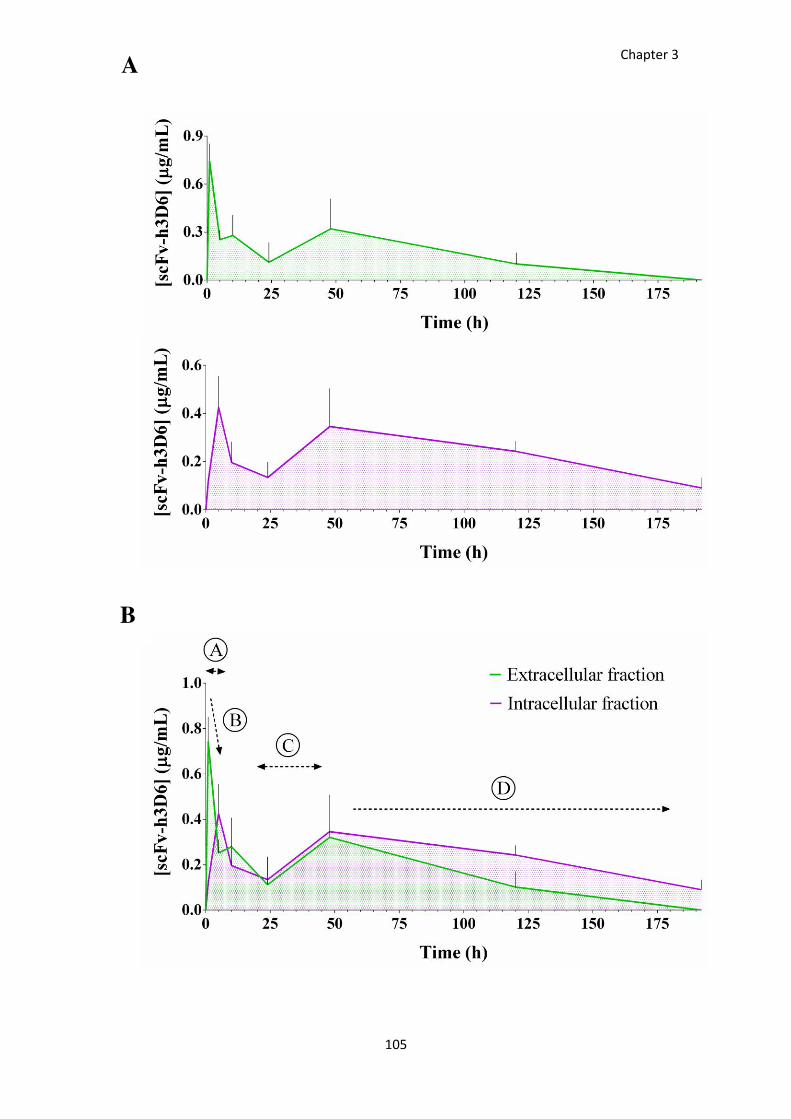
Chapter 3
105
A
B

Chapter 3
106
Figure 33. Temporal distribution of scFv-h3D6 through the extra- and intracellular brain
compartments. A) Extracellular levels of scFv-h3D6 (in green) and intracellular ones (in purple) are
represented over time post-injection (p.i.): 0h (vehicle-injected), 1h, 5h, 10h, 1 day, 2 days, 5 days,
and 8 days. Concentrations are expressed as µg of scFv-h3D6/mL of brain protein extract. B)
Comparative superposition of both extra- and intracellular profiles of scFv-h3D6. The first peak in
the extracellular compartment, 1h p.i., evidence the penetrance into the nervous tissue (1). The
first peak in the intracellular compartment appears later, 5h p.i., and coincides with the reduction
in the extracellular levels, what suggests the cellular internalization of the molecule (2). In both
compartments, a second peak appears later, 48h p.i., probably due to the influx of the scFv-h3D6
accumulated in plasma at 24h p.i. (3). The clearance process was evidenced by the progressive drop
in concentration from 48h to the end of the experiment (4).
ScFv-h3D6 and Aβ peptide in the central nervous system
Because the therapeutic effect of scFv-h3D6 is supposed to be mediated by a reduction in the Aβ
burden [210], the interaction between these both molecules was further analyzed in terms of
compartmental distribution (extra- and intracellular compartments) and temporary evolution (by
comparing the quantification profiles over time). In this sense, scFv-h3D6 and Aβ peptide were
immunodetected in a histological section from a mouse sacrificed 5h p.i., coinciding with the
intracellular main peak of scFv-h3D6 (Figure 34A). A strong signal for both molecules was
intracellularly colocalized, but not all the cells showing scFv-h3D6 signal contained Aβ as well.
Coinciding with the distribution described in the previous Section, scFv-h3D6 was immunodetected
within large and small cells, whereas Aβ signal was generally restricted to the large ones.
Besides, Aβ burden was quantified in both the extra- and the intracellular compartments, by using
a commercial ELISA kit. In Figure 34B-C, Aβ levels are represented over p.i. time, and compared to
the scFv-h3D6 concentration profiles. Additionally, the first response to the treatment is better
detailed in a magnification of the 0-12h p.i. interval (see insets). Concentration of the Aβ peptide
was higher in the intracellular fraction than in the extracellular one in all the analyzed p.i. points.
The extracellular Aβ profile exhibited a pronounced decline tendency during the p.i. initial period
(0-12h) and a very soft second decrease later (2-5 days p.i.), what concurs with a main first peak of
scFv-h3D6 and a faint second one (Figure 34C). Regarding to the intracellular compartment, Aβ
levels were pronouncedly reduced as the first peak of scFv-h3D6 occurred (0-5h p.i.). Interestingly,
values were increased at 10h and 5 days p.i., what coincided with the decreases on the
extracellular compartment, suggesting the engulfment of extracellular Aβ.
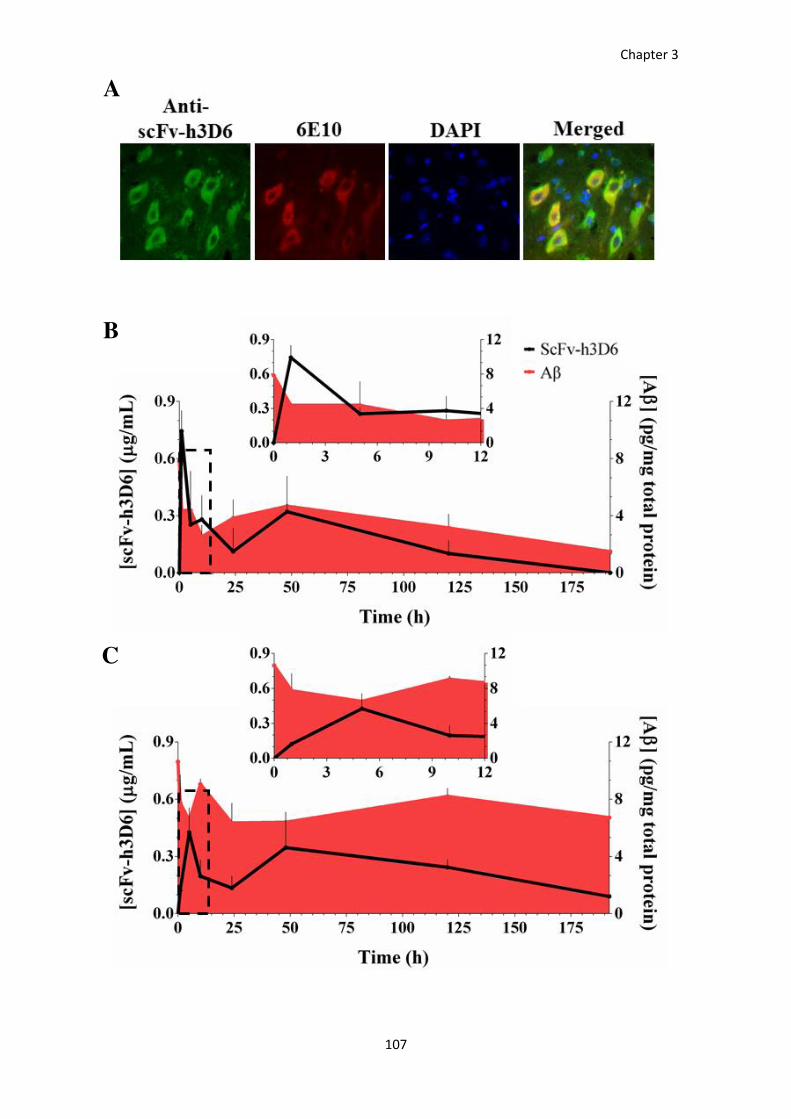
Chapter 3
107
A
B
C

Chapter 3
108
Figure 34. Colocalization of scFv-h3D6 and Aβ in the brain. A) Colocalization of scFv-h3D6 and Aβ
peptide on a 10 µm-thick brain section (5h p.i.). B) Extracellular and C) intracellular levels of Aβ
(area, in red) and scFv-h3D6 (line, in black) over time post-injection: 0h (vehicle-injected), 1h, 5h,
10h, 1 day, 2 days, 5 days, and 8 days. The insets correspond to the amplification of the initial
profiles, up to 12h post-injection. Concentrations of scFv-h3D6 are expressed as µg of scFv-
h3D6/mL of brain protein extract, whereas concentration of Aβ peptide is expressed as pg/mg of
total protein in the extract.
ScFv-h3D6 and Aβ peptide in relation to the cellular types
ScFv-h3D6 and Aβ peptide have been proved to partially colocalize at the early phase after the
administration (as shown in the previous Sections by the examples at 5h p.i. from Figures 32 and
35), being the scFv-h3D6 localized within large and small cells whereas the Aβ signal was only
visualized within the large ones. Besides, Figure 35A illustrates a representative panoramic capture
corresponding to the confocal microscopy of an animal sacrificed 5 days p.i., with the aim to see
how the interaction between both molecules and the cellular types evolved at a more advanced p.i.
phase. Figure 35B-D contain examples of the cellular casuistry observed in the panoramic: cells
staying alone (B), couple of cells (C), and cells located through the blood vessels (D). Figure 5B
exhibits a large cell containing both scFv-h3D6 and Aβ peptide. Figure 35C shows a couple of cells,
located intimately close, conformed by a large cell with a very low signal in both scFv-h3D6 and Aβ,
and a small cell with strong signal in both immunodetections. Figure 35D illustrates a couple of cells
located through the blood vessels showing higher signal of scFv-h3D6 than Aβ.
Cellular types were approximated by using a recently reported algorithm, based on the cytological
features [211]. In this sense, large cells were considered large neurons because of the large-sized
and lightly stained nucleus, with an “empty” appearance, whereas small cells were considered glial
cells because the smaller and darkly stained nucleus. Likewise, endothelial cells were clearly
distinguished because of the shape of their nuclei wrapping around blood vessels.
Therefore, the overall data suggests that, at the early p.i. phase, scFv-h3D6 is engulfed by glial cells,
as a clearance mechanism, and internalized into large neurons containing Aβ. Interestingly, at the
late p.i. phase, the fact that scFv-h3D6 and Aβ were strongly immunodetected within those large
neurons staying alone, whereas, in those intimately close cells, large neurons presented an almost
negligible signal, but a strong signal of both molecules, scFv-h3D6 and Aβ, appeared into the
accompanying glial cell, presumably suggests that the intraneuronal complex Aβ/scFv-h3D6 is
extruded to the extraneuronal compartment and, then, engulfed by phagocytic glial cells. On the
other hand, Figure 35D illustrates a couple of endothelial cells located through the blood vessels
containing both scFv-h3D6 and Aβ. This result evidences the involvement of the endothelial cells in
the flux of scFv-h3D6, as well as of the Aβ/scFv-h3D6 complex, across the BBB.
B

Chapter 3
109
.
Figure 35. ScFv-h3D6 and Aβ visualization 5 days post-injection by confocal microscopy.
Colocalization of scFv-h3D6 and Aβ peptide on a 10 µm-thick brain section (5 days p.i.). A)
Panoramic visualization. Continued-line square in the merged figure, an example of a large neuron
containing both scFv-h3D6 and Aβ signal, magnified in (B). Dashed-line square, an example of a
couple of cells closely related, magnified in (C). White arrow, area next to the blood vessel,
magnified in (D). Scale bars, 50 µm in A and 10 µm in B, C, and D.
Effect of the treatment on the TNF-α levels

Chapter 3
110
To understand whether the treatment contributed to a local inflammatory response, levels of TNF-
α were measured in both the extracellular and intracellular compartments (Figure 36). Results
show an increase on the TNF-α levels in the intracellular compartment as a very early punctual
response (only at ~1h p.i.). However, TNF-α levels tended to increase during the last phase of the
experiment, what concurs with the clearance process occurring at that phase.
Figure 36. TNF-α profile over time post-injection. Extracellular (A) and intracellular (B)
concentrations (pg/mg of total protein) of TNF-α are represented over time p.i.: 0h (vehicle-
injected), 1h, 5h, 10h, 1 day, 2 days, 5 days, and 8 days. The upper graph corresponds to the
amplification of the initial profile, up to 24h post-injection.
A
B
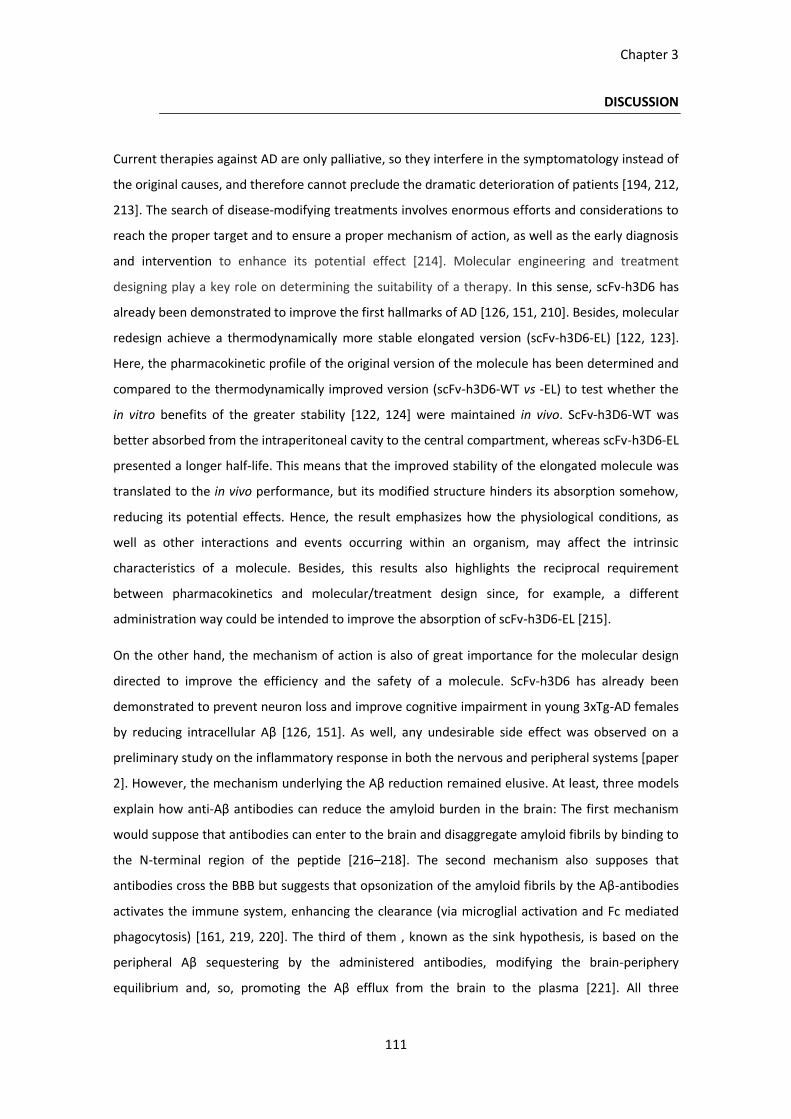
Chapter 3
111
DISCUSSION
Current therapies against AD are only palliative, so they interfere in the symptomatology instead of
the original causes, and therefore cannot preclude the dramatic deterioration of patients [194, 212,
213]. The search of disease-modifying treatments involves enormous efforts and considerations to
reach the proper target and to ensure a proper mechanism of action, as well as the early diagnosis
and intervention to enhance its potential effect [214]. Molecular engineering and treatment
designing play a key role on determining the suitability of a therapy. In this sense, scFv-h3D6 has
already been demonstrated to improve the first hallmarks of AD [126, 151, 210]. Besides, molecular
redesign achieve a thermodynamically more stable elongated version (scFv-h3D6-EL) [122, 123].
Here, the pharmacokinetic profile of the original version of the molecule has been determined and
compared to the thermodynamically improved version (scFv-h3D6-WT vs -EL) to test whether the
in vitro benefits of the greater stability [122, 124] were maintained in vivo. ScFv-h3D6-WT was
better absorbed from the intraperitoneal cavity to the central compartment, whereas scFv-h3D6-EL
presented a longer half-life. This means that the improved stability of the elongated molecule was
translated to the in vivo performance, but its modified structure hinders its absorption somehow,
reducing its potential effects. Hence, the result emphasizes how the physiological conditions, as
well as other interactions and events occurring within an organism, may affect the intrinsic
characteristics of a molecule. Besides, this results also highlights the reciprocal requirement
between pharmacokinetics and molecular/treatment design since, for example, a different
administration way could be intended to improve the absorption of scFv-h3D6-EL [215].
On the other hand, the mechanism of action is also of great importance for the molecular design
directed to improve the efficiency and the safety of a molecule. ScFv-h3D6 has already been
demonstrated to prevent neuron loss and improve cognitive impairment in young 3xTg-AD females
by reducing intracellular Aβ [126, 151]. As well, any undesirable side effect was observed on a
preliminary study on the inflammatory response in both the nervous and peripheral systems [paper
2]. However, the mechanism underlying the Aβ reduction remained elusive. At least, three models
explain how anti-Aβ antibodies can reduce the amyloid burden in the brain: The first mechanism
would suppose that antibodies can enter to the brain and disaggregate amyloid fibrils by binding to
the N-terminal region of the peptide [216–218]. The second mechanism also supposes that
antibodies cross the BBB but suggests that opsonization of the amyloid fibrils by the Aβ-antibodies
activates the immune system, enhancing the clearance (via microglial activation and Fc mediated
phagocytosis) [161, 219, 220]. The third of them , known as the sink hypothesis, is based on the
peripheral Aβ sequestering by the administered antibodies, modifying the brain-periphery
equilibrium and, so, promoting the Aβ efflux from the brain to the plasma [221]. All three
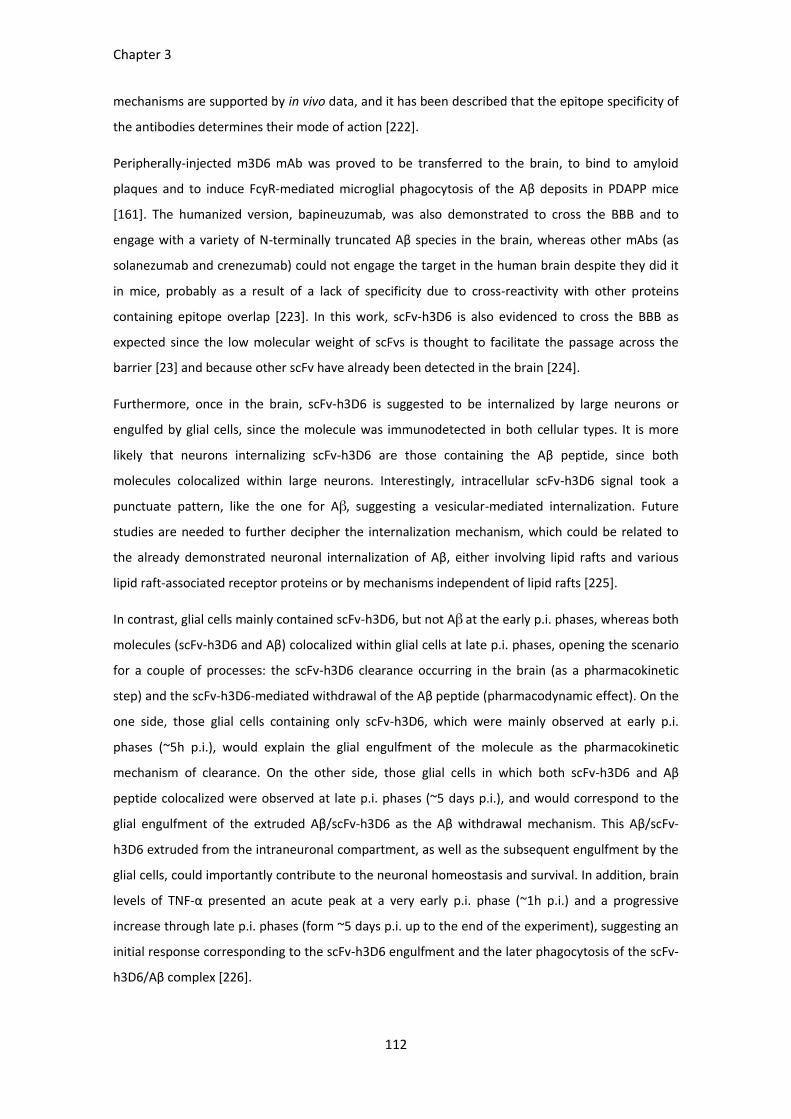
Chapter 3
112
mechanisms are supported by in vivo data, and it has been described that the epitope specificity of
the antibodies determines their mode of action [222].
Peripherally-injected m3D6 mAb was proved to be transferred to the brain, to bind to amyloid
plaques and to induce FcγR-mediated microglial phagocytosis of the Aβ deposits in PDAPP mice
[161]. The humanized version, bapineuzumab, was also demonstrated to cross the BBB and to
engage with a variety of N-terminally truncated Aβ species in the brain, whereas other mAbs (as
solanezumab and crenezumab) could not engage the target in the human brain despite they did it
in mice, probably as a result of a lack of specificity due to cross-reactivity with other proteins
containing epitope overlap [223]. In this work, scFv-h3D6 is also evidenced to cross the BBB as
expected since the low molecular weight of scFvs is thought to facilitate the passage across the
barrier [23] and because other scFv have already been detected in the brain [224].
Furthermore, once in the brain, scFv-h3D6 is suggested to be internalized by large neurons or
engulfed by glial cells, since the molecule was immunodetected in both cellular types. It is more
likely that neurons internalizing scFv-h3D6 are those containing the Aβ peptide, since both
molecules colocalized within large neurons. Interestingly, intracellular scFv-h3D6 signal took a
punctuate pattern, like the one for Aβ, suggesting a vesicular-mediated internalization. Future
studies are needed to further decipher the internalization mechanism, which could be related to
the already demonstrated neuronal internalization of Aβ, either involving lipid rafts and various
lipid raft-associated receptor proteins or by mechanisms independent of lipid rafts [225].
In contrast, glial cells mainly contained scFv-h3D6, but not Aβ at the early p.i. phases, whereas both
molecules (scFv-h3D6 and Aβ) colocalized within glial cells at late p.i. phases, opening the scenario
for a couple of processes: the scFv-h3D6 clearance occurring in the brain (as a pharmacokinetic
step) and the scFv-h3D6-mediated withdrawal of the Aβ peptide (pharmacodynamic effect). On the
one side, those glial cells containing only scFv-h3D6, which were mainly observed at early p.i.
phases (~5h p.i.), would explain the glial engulfment of the molecule as the pharmacokinetic
mechanism of clearance. On the other side, those glial cells in which both scFv-h3D6 and Aβ
peptide colocalized were observed at late p.i. phases (~5 days p.i.), and would correspond to the
glial engulfment of the extruded Aβ/scFv-h3D6 as the Aβ withdrawal mechanism. This Aβ/scFv-
h3D6 extruded from the intraneuronal compartment, as well as the subsequent engulfment by the
glial cells, could importantly contribute to the neuronal homeostasis and survival. In addition, brain
levels of TNF-α presented an acute peak at a very early p.i. phase (~1h p.i.) and a progressive
increase through late p.i. phases (form ~5 days p.i. up to the end of the experiment), suggesting an
initial response corresponding to the scFv-h3D6 engulfment and the later phagocytosis of the scFv-
h3D6/Aβ complex [226].

Chapter 3
113
In summary, pharmacokinetic determination allowed to recognize unexpected differences between
scFv-h3D6-WT and -EL when injected to a complex organism. Besides, both the pharmacokinetic
profile and the subsequent brain analyses of scFv-h3D6, showed that scFv-h3D6 cross the BBB,
enter neurons, and is engulfed by glial cells.

Chapter 3
114
115
CHAPTER 4
Interaction among ageing, training, and immunotherapy
on behavioral and cognitive impairments in the 3xTg-AD
mouse model of Alzheimer’s disease

116
Chapter 4
117
AIMS
Clinical symptoms of AD include behavioral/emotional alterations and cognitive impairment. These
functional phenotypes early occur in the 3xTg-AD mice, being the emotional/behavioral alterations
first detected at ~2.5 months old [108], whereas the cognitive impairment is first observed
between 3-5 months of age [107].
The relevance of longitudinal studies has been evidenced when dealing with defining how the
disease progresses, in both animal models and humans [227]. In this Chapter, behavioral and
cognitive abilities were longitudinally assessed in young 3xTg-AD females, and compared to the
corresponding age- and gender-matched non-transgenic mice, up to the adulthood (from 5 to 9
months of age). Besides, immunotherapy against the Aβ peptide was also tested by evaluating the
functional response of mice to chronic treatments with single-chain variable fragments derived
from the monoclonal antibody bapineuzumab (scFv-h3D6): the original version of the molecule,
scFv-h3D6-WT [120], and the elongated variant, scFv-h3D6-EL [123, 195]. As well, the trained
component was evaluated in a different cohort by performing only the last test, at 9 months of age.
Fifty-eight 5-mo-old 3xTg-AD females, and eighteen gender- and age-matched NTg mice, were used
in this study. About half of the animals were assigned to the longitudinal study (tested at 5, 7, and 9
months of age) and the other half were only evaluated at the final point (9 months-old). In both
cases, animals were randomly distributed in four experimental groups: Control NTg, untreated
3xTg-AD mice, and scFv-h3D6-WT- and scFv-h3D6-EL-treated 3xTg-AD mice (n=8-10). All the
animals were intraperitoneally administered with the treatment (100 µg of the corresponding scFv-
h3D6) or the vehicle (PBS, in both groups untreated-NTg and 3xTg-AD mice) once a month, from 5
to 9 months of age.

Chapter 4
118
RESULTS
Progression of BPSD-like symptoms in 3xTg-AD females from 5 to 9 months of age
BPSD-like symptoms were evaluated by the corner test and the open-field test. In the CT, the initial
response to the novelty was considered by placing the animals in a new cage for only 30s. Both NTg
and 3xTg-AD mice exhibited similar performances at 5 months of age in most of the analyzed
parameters, except for the distance traveled, the average speed, and the corner latency (Figure 37,
Supplementary Table 8). The distance traveled by the 3xTg-AD mice was longer than by the NTg
ones (marginally significant differences, U-test, p=0.089). Exploratory activity was not increased,
since the other exploratory traits, such as the number of rearings, were similar in both groups.
However, this was rather a consequence of a different mean speed, with the 3xTg-AD mice
presenting a marginally significant higher speed (U-test, p=0.078), what suggested a slightly
agitated behavior at 5-mo of age. Besides, although the visits to the corner and the total time spent
in the corner was similar between both groups, the corner latency was significantly shorter for the
3xTg-AD mice than for the NTg ones (U-test, p=0.048), suggesting an initial neophobia to the new
cage. Therefore, both responses, agitated behavior and initial neophobia, evidenced an enhanced
anxiety-like behavior in the 3xTg-AD females already at 5 months of age.
In both groups, the distance traveled shortened over time (from 5 to 9 months), what coincided
with a decrease in the number of rearings and an increase in the rearing latencies, evidencing a
reduction in the exploratory activity by age. Therefore, the neophobia observed in 5-mo-old 3xTg-
AD mice could not be properly followed-up over time by the corner-related parameters (corner
latency, corner visits, and time spent in the corner) since it was masked by the drastic reduction in
the exploratory activity. However, 3xTg mice exhibited a more pronounced
stunned/immobile/inactive response than the NTg mice (manifested by the absence of self-
groomings, the slower speed on movement, and the much more increasing immobility time by age,
in addition to the concurring more drastic reduction in the exploratory activity) what indicated
their higher vulnerability to the novelty, and supported the occurrence of anxiety or fear in
response to aversive situations.
The larger duration of the OFT in front of the CT (15 min vs 30s) makes the first the more sensitive
and reliable to the exploratory activity, since the initial reaction of the animal to the new arena
represented a very small fraction of time. Probably because of that, in the OFT, the exploratory
activity in the 3xTg-AD mice was already found quite reduced at 5 months of age,
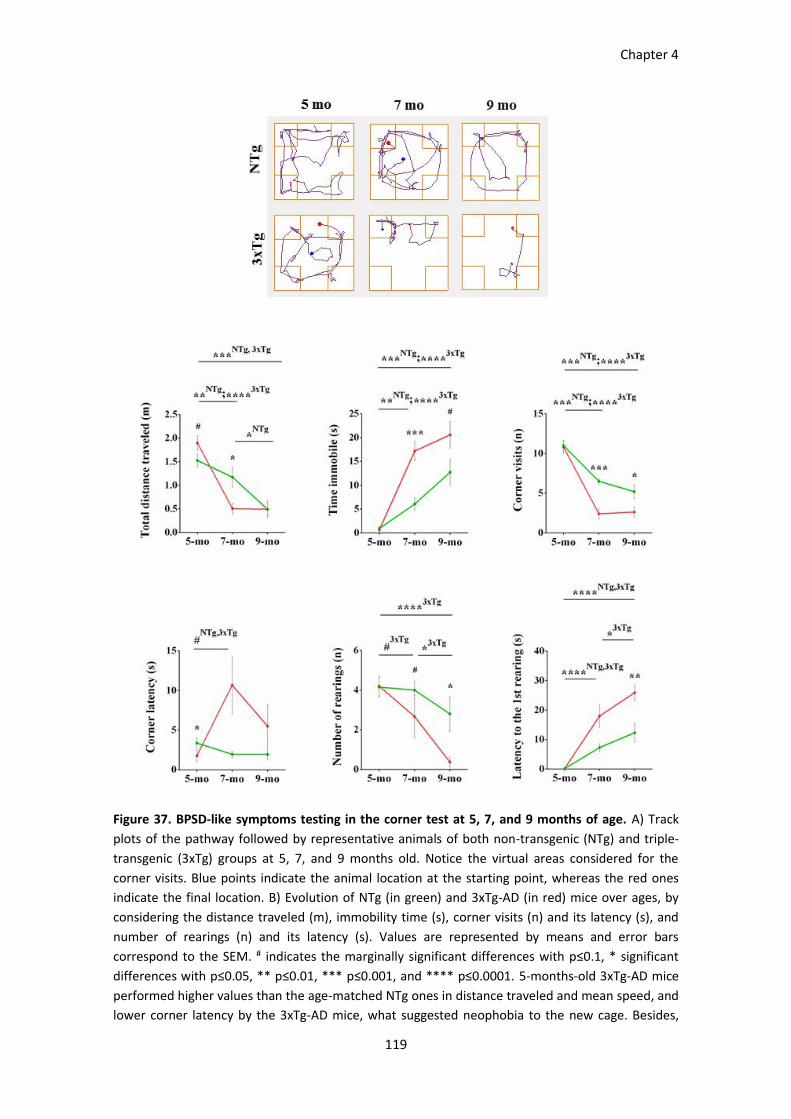
Chapter 4
119
Figure 37. BPSD-like symptoms testing in the corner test at 5, 7, and 9 months of age. A) Track
plots of the pathway followed by representative animals of both non-transgenic (NTg) and triple-
transgenic (3xTg) groups at 5, 7, and 9 months old. Notice the virtual areas considered for the
corner visits. Blue points indicate the animal location at the starting point, whereas the red ones
indicate the final location. B) Evolution of NTg (in green) and 3xTg-AD (in red) mice over ages, by
considering the distance traveled (m), immobility time (s), corner visits (n) and its latency (s), and
number of rearings (n) and its latency (s). Values are represented by means and error bars
correspond to the SEM. # indicates the marginally significant differences with p≤0.1, * significant
differences with p≤0.05, ** p≤0.01, *** p≤0.001, and **** p≤0.0001. 5-months-old 3xTg-AD mice
performed higher values than the age-matched NTg ones in distance traveled and mean speed, and
lower corner latency by the 3xTg-AD mice, what suggested neophobia to the new cage. Besides,
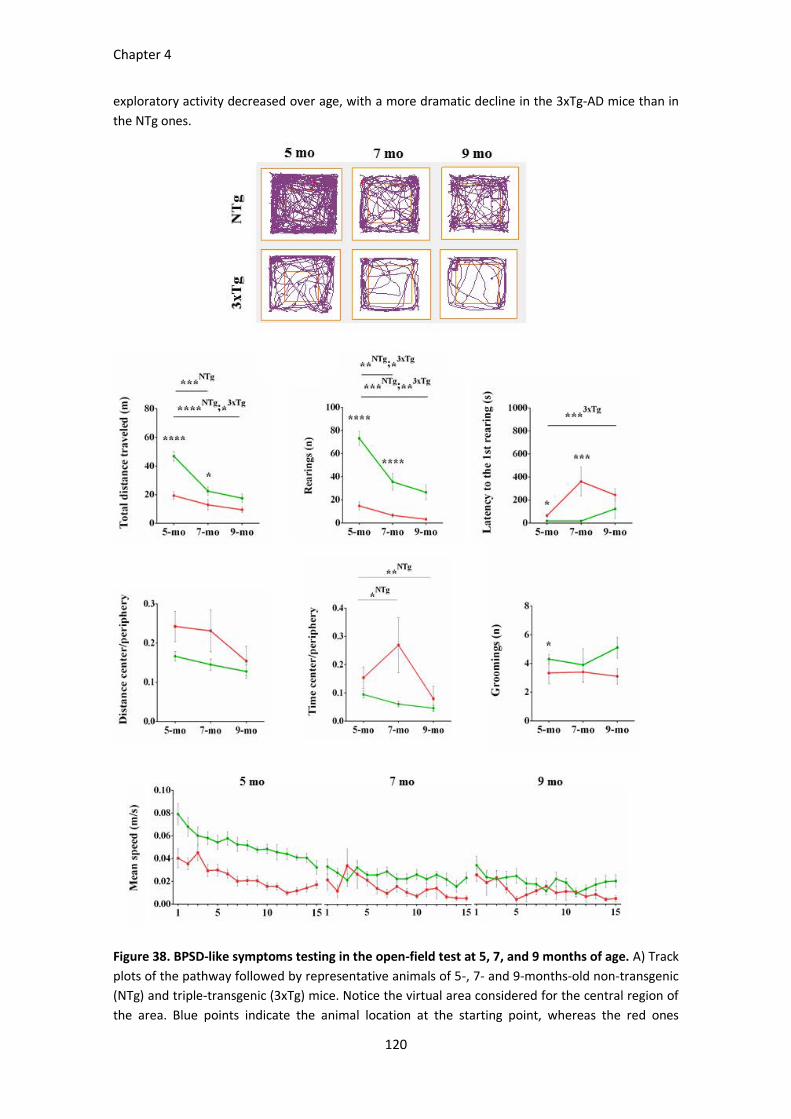
Chapter 4
120
exploratory activity decreased over age, with a more dramatic decline in the 3xTg-AD mice than in
the NTg ones.
Figure 38. BPSD-like symptoms testing in the open-field test at 5, 7, and 9 months of age. A) Track
plots of the pathway followed by representative animals of 5-, 7- and 9-months-old non-transgenic
(NTg) and triple-transgenic (3xTg) mice. Notice the virtual area considered for the central region of
the area. Blue points indicate the animal location at the starting point, whereas the red ones
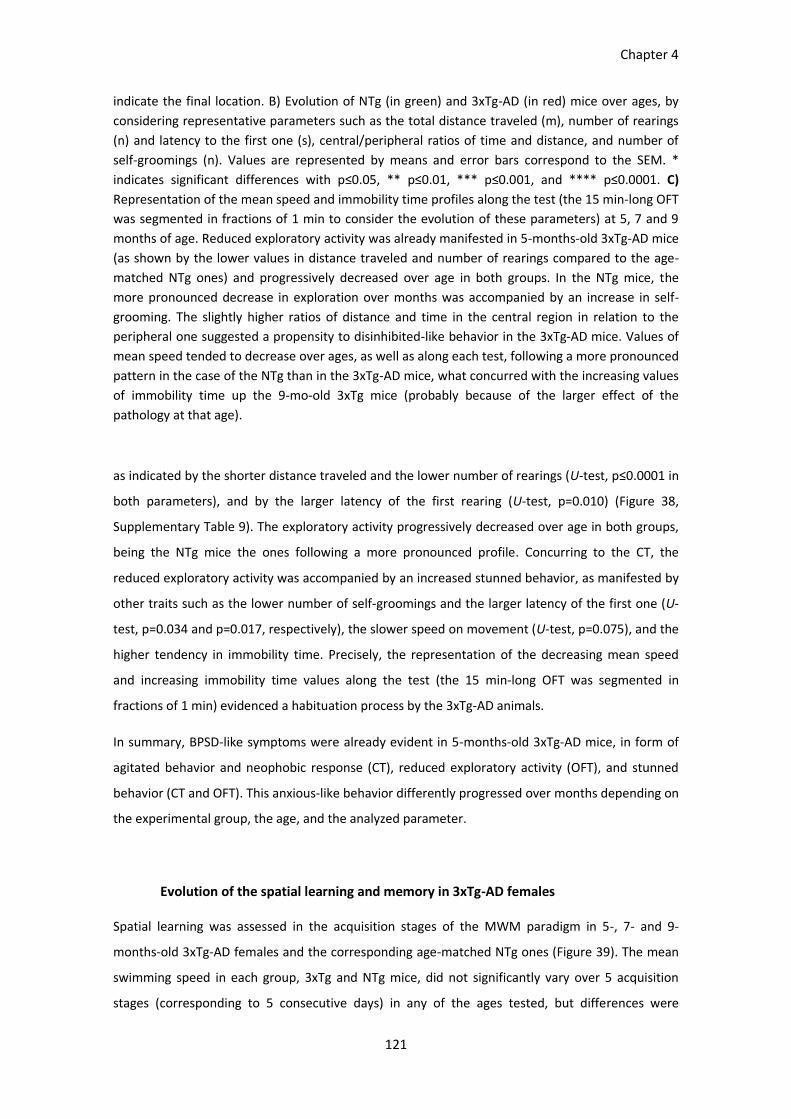
Chapter 4
121
indicate the final location. B) Evolution of NTg (in green) and 3xTg-AD (in red) mice over ages, by
considering representative parameters such as the total distance traveled (m), number of rearings
(n) and latency to the first one (s), central/peripheral ratios of time and distance, and number of
self-groomings (n). Values are represented by means and error bars correspond to the SEM. *
indicates significant differences with p≤0.05, ** p≤0.01, *** p≤0.001, and **** p≤0.0001. C)
Representation of the mean speed and immobility time profiles along the test (the 15 min-long OFT
was segmented in fractions of 1 min to consider the evolution of these parameters) at 5, 7 and 9
months of age. Reduced exploratory activity was already manifested in 5-months-old 3xTg-AD mice
(as shown by the lower values in distance traveled and number of rearings compared to the age-
matched NTg ones) and progressively decreased over age in both groups. In the NTg mice, the
more pronounced decrease in exploration over months was accompanied by an increase in self-
grooming. The slightly higher ratios of distance and time in the central region in relation to the
peripheral one suggested a propensity to disinhibited-like behavior in the 3xTg-AD mice. Values of
mean speed tended to decrease over ages, as well as along each test, following a more pronounced
pattern in the case of the NTg than in the 3xTg-AD mice, what concurred with the increasing values
of immobility time up the 9-mo-old 3xTg mice (probably because of the larger effect of the
pathology at that age).
as indicated by the shorter distance traveled and the lower number of rearings (U-test, p≤0.0001 in
both parameters), and by the larger latency of the first rearing (U-test, p=0.010) (Figure 38,
Supplementary Table 9). The exploratory activity progressively decreased over age in both groups,
being the NTg mice the ones following a more pronounced profile. Concurring to the CT, the
reduced exploratory activity was accompanied by an increased stunned behavior, as manifested by
other traits such as the lower number of self-groomings and the larger latency of the first one (U-
test, p=0.034 and p=0.017, respectively), the slower speed on movement (U-test, p=0.075), and the
higher tendency in immobility time. Precisely, the representation of the decreasing mean speed
and increasing immobility time values along the test (the 15 min-long OFT was segmented in
fractions of 1 min) evidenced a habituation process by the 3xTg-AD animals.
In summary, BPSD-like symptoms were already evident in 5-months-old 3xTg-AD mice, in form of
agitated behavior and neophobic response (CT), reduced exploratory activity (OFT), and stunned
behavior (CT and OFT). This anxious-like behavior differently progressed over months depending on
the experimental group, the age, and the analyzed parameter.
Evolution of the spatial learning and memory in 3xTg-AD females
Spatial learning was assessed in the acquisition stages of the MWM paradigm in 5-, 7- and 9-
months-old 3xTg-AD females and the corresponding age-matched NTg ones (Figure 39). The mean
swimming speed in each group, 3xTg and NTg mice, did not significantly vary over 5 acquisition
stages (corresponding to 5 consecutive days) in any of the ages tested, but differences were
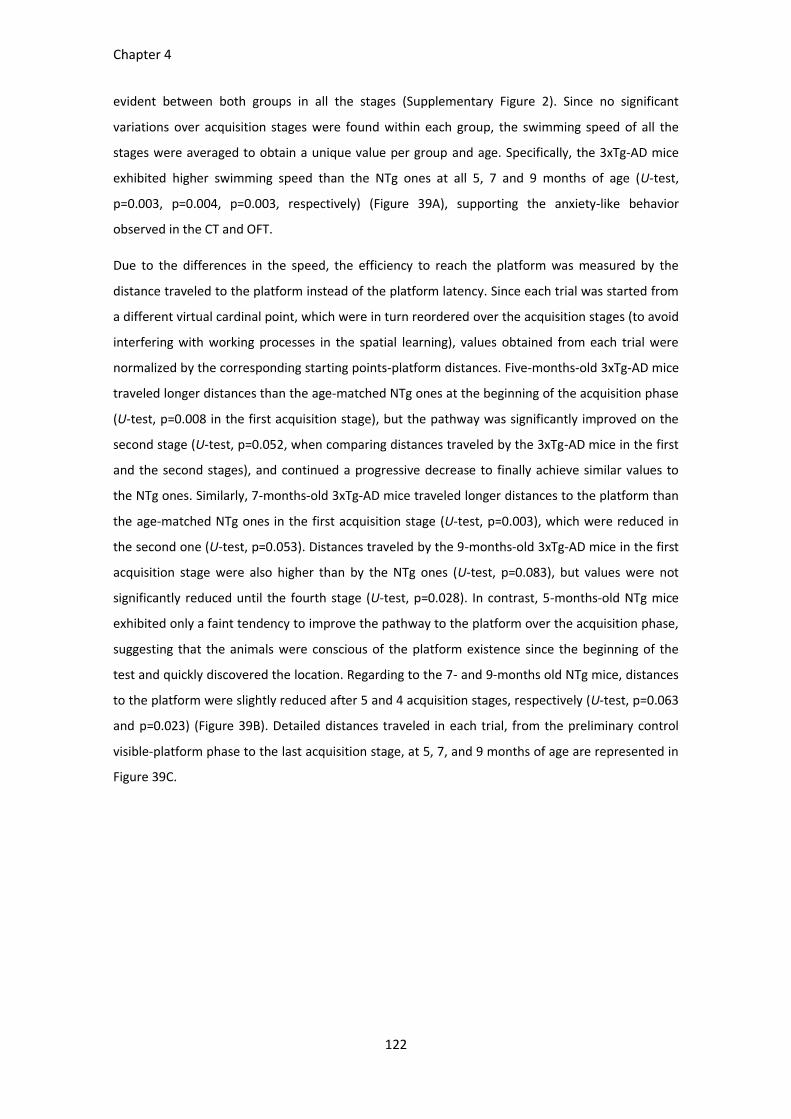
Chapter 4
122
evident between both groups in all the stages (Supplementary Figure 2). Since no significant
variations over acquisition stages were found within each group, the swimming speed of all the
stages were averaged to obtain a unique value per group and age. Specifically, the 3xTg-AD mice
exhibited higher swimming speed than the NTg ones at all 5, 7 and 9 months of age (U-test,
p=0.003, p=0.004, p=0.003, respectively) (Figure 39A), supporting the anxiety-like behavior
observed in the CT and OFT.
Due to the differences in the speed, the efficiency to reach the platform was measured by the
distance traveled to the platform instead of the platform latency. Since each trial was started from
a different virtual cardinal point, which were in turn reordered over the acquisition stages (to avoid
interfering with working processes in the spatial learning), values obtained from each trial were
normalized by the corresponding starting points-platform distances. Five-months-old 3xTg-AD mice
traveled longer distances than the age-matched NTg ones at the beginning of the acquisition phase
(U-test, p=0.008 in the first acquisition stage), but the pathway was significantly improved on the
second stage (U-test, p=0.052, when comparing distances traveled by the 3xTg-AD mice in the first
and the second stages), and continued a progressive decrease to finally achieve similar values to
the NTg ones. Similarly, 7-months-old 3xTg-AD mice traveled longer distances to the platform than
the age-matched NTg ones in the first acquisition stage (U-test, p=0.003), which were reduced in
the second one (U-test, p=0.053). Distances traveled by the 9-months-old 3xTg-AD mice in the first
acquisition stage were also higher than by the NTg ones (U-test, p=0.083), but values were not
significantly reduced until the fourth stage (U-test, p=0.028). In contrast, 5-months-old NTg mice
exhibited only a faint tendency to improve the pathway to the platform over the acquisition phase,
suggesting that the animals were conscious of the platform existence since the beginning of the
test and quickly discovered the location. Regarding to the 7- and 9-months old NTg mice, distances
to the platform were slightly reduced after 5 and 4 acquisition stages, respectively (U-test, p=0.063
and p=0.023) (Figure 39B). Detailed distances traveled in each trial, from the preliminary control
visible-platform phase to the last acquisition stage, at 5, 7, and 9 months of age are represented in
Figure 39C.

Chapter 4
123
Figure 39. Acquisition phase in the MWM paradigm at 5, 7, and 9 months of age. A) Averaged
swimming speed in 5-, 7- and 9-months-old non-transgenic (NTg, in green) and triple-transgenic
B
C
A
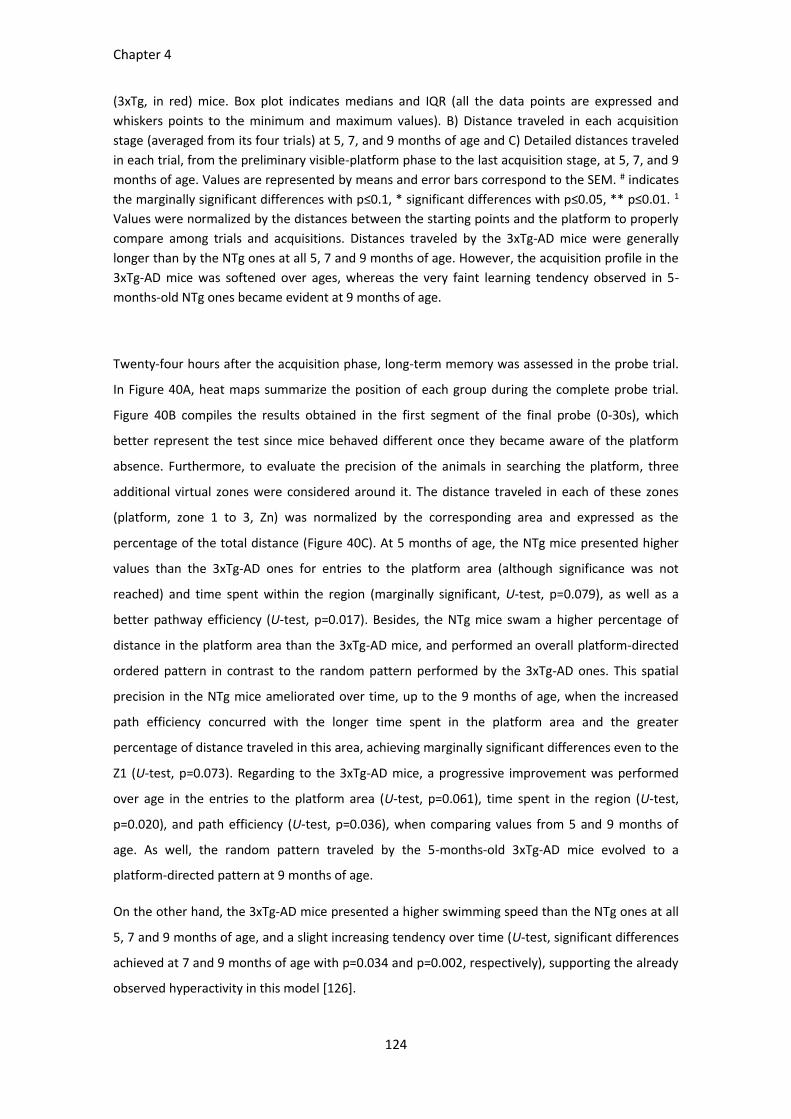
Chapter 4
124
(3xTg, in red) mice. Box plot indicates medians and IQR (all the data points are expressed and
whiskers points to the minimum and maximum values). B) Distance traveled in each acquisition
stage (averaged from its four trials) at 5, 7, and 9 months of age and C) Detailed distances traveled
in each trial, from the preliminary visible-platform phase to the last acquisition stage, at 5, 7, and 9
months of age. Values are represented by means and error bars correspond to the SEM. # indicates
the marginally significant differences with p≤0.1, * significant differences with p≤0.05, ** p≤0.01. 1
Values were normalized by the distances between the starting points and the platform to properly
compare among trials and acquisitions. Distances traveled by the 3xTg-AD mice were generally
longer than by the NTg ones at all 5, 7 and 9 months of age. However, the acquisition profile in the
3xTg-AD mice was softened over ages, whereas the very faint learning tendency observed in 5-
months-old NTg ones became evident at 9 months of age.
Twenty-four hours after the acquisition phase, long-term memory was assessed in the probe trial.
In Figure 40A, heat maps summarize the position of each group during the complete probe trial.
Figure 40B compiles the results obtained in the first segment of the final probe (0-30s), which
better represent the test since mice behaved different once they became aware of the platform
absence. Furthermore, to evaluate the precision of the animals in searching the platform, three
additional virtual zones were considered around it. The distance traveled in each of these zones
(platform, zone 1 to 3, Zn) was normalized by the corresponding area and expressed as the
percentage of the total distance (Figure 40C). At 5 months of age, the NTg mice presented higher
values than the 3xTg-AD ones for entries to the platform area (although significance was not
reached) and time spent within the region (marginally significant, U-test, p=0.079), as well as a
better pathway efficiency (U-test, p=0.017). Besides, the NTg mice swam a higher percentage of
distance in the platform area than the 3xTg-AD mice, and performed an overall platform-directed
ordered pattern in contrast to the random pattern performed by the 3xTg-AD ones. This spatial
precision in the NTg mice ameliorated over time, up to the 9 months of age, when the increased
path efficiency concurred with the longer time spent in the platform area and the greater
percentage of distance traveled in this area, achieving marginally significant differences even to the
Z1 (U-test, p=0.073). Regarding to the 3xTg-AD mice, a progressive improvement was performed
over age in the entries to the platform area (U-test, p=0.061), time spent in the region (U-test,
p=0.020), and path efficiency (U-test, p=0.036), when comparing values from 5 and 9 months of
age. As well, the random pattern traveled by the 5-months-old 3xTg-AD mice evolved to a
platform-directed pattern at 9 months of age.
On the other hand, the 3xTg-AD mice presented a higher swimming speed than the NTg ones at all
5, 7 and 9 months of age, and a slight increasing tendency over time (U-test, significant differences
achieved at 7 and 9 months of age with p=0.034 and p=0.002, respectively), supporting the already
observed hyperactivity in this model [126].

Chapter 4
125
Therefore, differences in the acquisition patterns of both groups at 5, 7 and 9 months of age
evidenced the progressive learning impairment in 3xTg-AD model in comparison to normal aging.
On the other hand, long-term memory was better in the NTg mice than in the 3xTg ones at all the
ages tested, as resulted from the final probe. However, the 3xTg-AD mice exhibited greater
improvements than the NTg ones as more tests were performed, what emphasize the role of
cognitive stimulation in front of other components such as normal aging or pathological
degeneration.
Figure 40. Long-term memory assessed by the probe trial in the MWM at 5, 7, and 9 months of
age. A) Mean heat maps of the 5-, 7- and 9-months-old 3xTg-AD and NTg mice locations. Scaled
from blue (unoccupied regions) to red (the most occupied ones). B) Evolution of NTg (in green) and
3xTg-AD (in red) mice over ages, by considering the number of entries (n), the time spent (s), and
the path efficiency to the platform zone, as well as the mean speed (m/s). Values are represented
by means and error bars correspond to the SEM. C) Comparative percentage of distance traveled in
each region (platform area, first concentric region around as Z1, an intermediate region as Z2, and
the external region as Z3) between NTg and 3xTg-AD mice. Box plot indicates medians and IQR (all
the data points are expressed and whiskers points to the minimum and maximum values). #
indicates the marginally significant differences with p≤0.1, and * significant differences with
p≤0.05. 1 Correspond to the first segment of the final test (0-30s). 3xTg-AD mice performed a
greater improvement over time than the NTg ones, what emphasize the role of cognitive
stimulation in front of other components such as the normal aging or the pathological
degeneration.
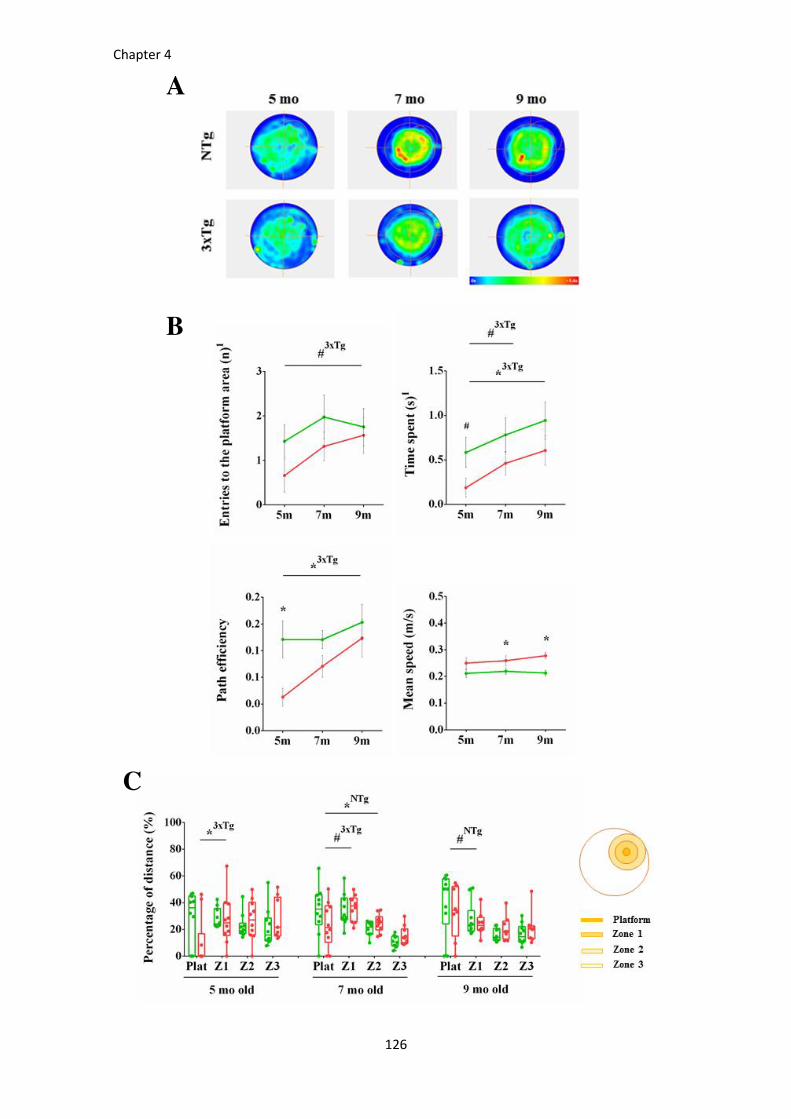
Chapter 4
126
C
B
A
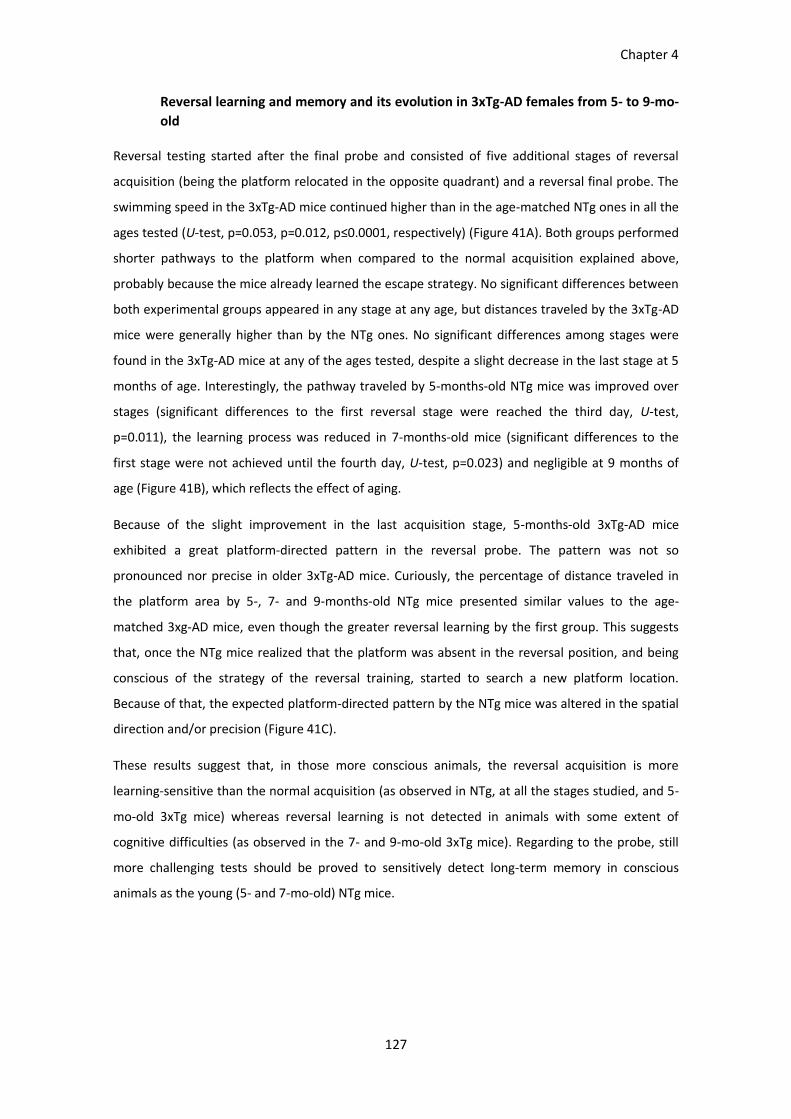
Chapter 4
127
Reversal learning and memory and its evolution in 3xTg-AD females from 5- to 9-mo-
old
Reversal testing started after the final probe and consisted of five additional stages of reversal
acquisition (being the platform relocated in the opposite quadrant) and a reversal final probe. The
swimming speed in the 3xTg-AD mice continued higher than in the age-matched NTg ones in all the
ages tested (U-test, p=0.053, p=0.012, p≤0.0001, respectively) (Figure 41A). Both groups performed
shorter pathways to the platform when compared to the normal acquisition explained above,
probably because the mice already learned the escape strategy. No significant differences between
both experimental groups appeared in any stage at any age, but distances traveled by the 3xTg-AD
mice were generally higher than by the NTg ones. No significant differences among stages were
found in the 3xTg-AD mice at any of the ages tested, despite a slight decrease in the last stage at 5
months of age. Interestingly, the pathway traveled by 5-months-old NTg mice was improved over
stages (significant differences to the first reversal stage were reached the third day, U-test,
p=0.011), the learning process was reduced in 7-months-old mice (significant differences to the
first stage were not achieved until the fourth day, U-test, p=0.023) and negligible at 9 months of
age (Figure 41B), which reflects the effect of aging.
Because of the slight improvement in the last acquisition stage, 5-months-old 3xTg-AD mice
exhibited a great platform-directed pattern in the reversal probe. The pattern was not so
pronounced nor precise in older 3xTg-AD mice. Curiously, the percentage of distance traveled in
the platform area by 5-, 7- and 9-months-old NTg mice presented similar values to the age-
matched 3xg-AD mice, even though the greater reversal learning by the first group. This suggests
that, once the NTg mice realized that the platform was absent in the reversal position, and being
conscious of the strategy of the reversal training, started to search a new platform location.
Because of that, the expected platform-directed pattern by the NTg mice was altered in the spatial
direction and/or precision (Figure 41C).
These results suggest that, in those more conscious animals, the reversal acquisition is more
learning-sensitive than the normal acquisition (as observed in NTg, at all the stages studied, and 5-
mo-old 3xTg mice) whereas reversal learning is not detected in animals with some extent of
cognitive difficulties (as observed in the 7- and 9-mo-old 3xTg mice). Regarding to the probe, still
more challenging tests should be proved to sensitively detect long-term memory in conscious
animals as the young (5- and 7-mo-old) NTg mice.

Chapter 4
128
Figure 41. Reversal testing in the MWM of 5-, 7-, and 9-months-old 3xTg-AD and NTg mice. A)
Averaged swimming speed in 5-, 7- and 9-months-old non-transgenic (NTg, in green) and triple-
transgenic (3xTg, in red) mice. Box plot indicates medians and IQR (all the data points are
expressed and whiskers points to the minimum and maximum values). B) Distance traveled in each
reversal acquisition stage (averaged from its four trials) at 5, 7, and 9 months of age. Values are
represented by means and error bars correspond to the SEM. C) Comparative percentage of
distance traveled in each region (platform area, first concentric region around as Z1, an
intermediate region as Z2, and the external region as Z3) between NTg and 3xTg-AD mice. Box plot
indicates medians and IQR (all the data points are expressed and whiskers points to the minimum
and maximum values). # indicates the marginally significant differences with p≤0.1, * significant
differences with p≤0.05, ** p≤0.01, and **** p≤0.0001. 1 Values were normalized by the
corresponding distances between the starting points and the platform to properly compare among
trials and acquisitions. Swimming speed in the 3xTg-AD mice was higher than in the age-matched
NTg ones in all the ages tested. Distances traveled by the 3xTg-AD mice were generally longer than
by the NTg ones at all 5, 7 and 9 months of age, and performances were shorter than the
corresponding normal acquisition. The faint decreasing tendency over stages in 5-months-old 3xTg-
AD mice was still softened by aging. In contrast to the normal acquisition, distance traveled by NTg
mice evidently decreased over stages at 5 and 7 months of age. The percentage of distance
traveled in each zone exhibited a platform-directed pattern in 5-months-old mice, but direction
and/or precision were altered at older ages.
A B
C

Chapter 4
129
Effects of continued immunotherapy with scFv-h3D6-WT and scFv-h3D6-EL
The functional response to a single dose administration of scFv-h3D6-WT in 5-months old females
has been recently reported. In brief, the treatment was not able to interfere on the BPSD-like
symptoms already manifested in the 3xTg-AD mice, but cognitive impairment was almost
completely reversed [PAPER2]. Here, the effects of the continued treatment with scFv-h3D6-WT
(monthly administrations starting at 5 months of age), as well as with the elongated version of the
molecule, scFv-h3D6-EL (EL), were assessed at 5, 7 and 9 months of age. The addition of the
treatment factor to the already complex combination of genotype, age and habituation, makes the
interpretation of BPSD-like symptoms still more difficult. However, those parameters involved the
most in the pathology, such as the exploratory activity (total distance traveled), the fear-like
behavior (time immobile), and the disinhibited response (ratio of central/periphery distance
traveled) were faintly modified by both treatments (Supplementary table 7 and 8, Figure 42A). The
reduced distance traveled by the 3xTg-AD mice in the OFT was already reverted in 5-months-old EL-
treated 3xTg-AD mice (U-test, p=0.053 when compared to the untreated 3xTg-AD mice), concurring
with the reduced speed (U-test, p=0.052), what pointed to a reversion of the anxiety-like behavior
(effects on exploration were discarded since other exploratory activities, such as rearings, were not
modified by the treatment). Regarding to the progression of those more emotionality-associated
parameters, the WT-treated 3xTg-AD mice exhibited non-pathologic profiles, but starting from
higher levels than the NTg control mice.
Learning abilities from the treated 3xTg-AD mice progressively improved, as observed from the
more pronounced decreasing values of distance traveled in the acquisition phase over time.
Interestingly, scFv-h3D6-WT-treated mice were the ones performing the closer profile to the NTg
group at the end of the study. Regarding to the final probe, scFv-h3D6-WT-treated mice recovered
the non-pathological values already at 5 months of age, and further improved the precision over
time. Five-months-old scFv-h3D6-EL-treated mice performed the final probe similarly to the
untreated 3xTg-AD ones, but progressively ameliorated over time (Figure 42B).
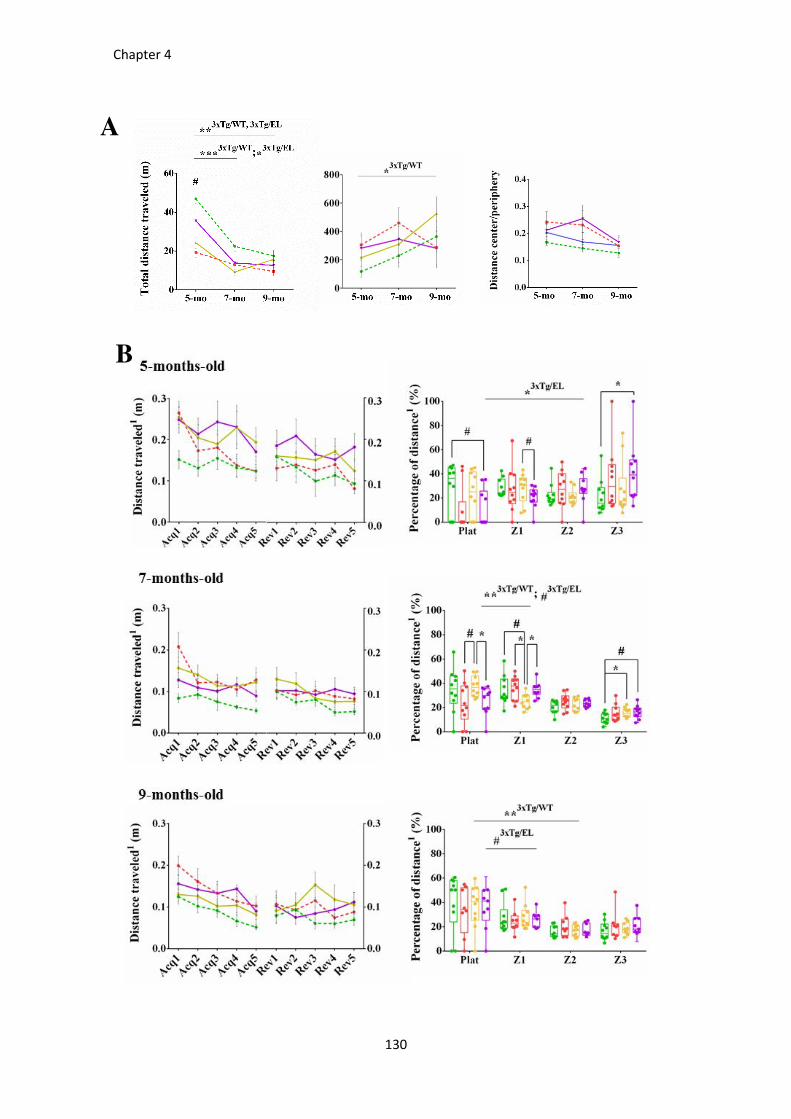
Chapter 4
130
A
B
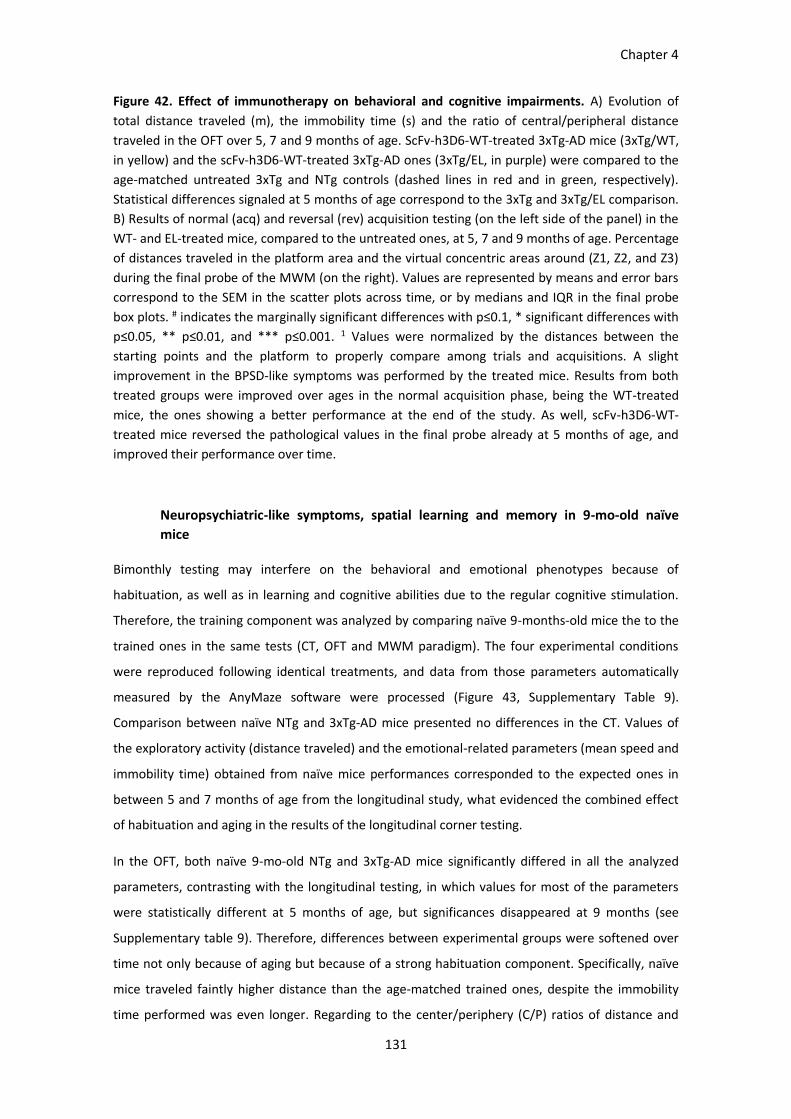
Chapter 4
131
Figure 42. Effect of immunotherapy on behavioral and cognitive impairments. A) Evolution of
total distance traveled (m), the immobility time (s) and the ratio of central/peripheral distance
traveled in the OFT over 5, 7 and 9 months of age. ScFv-h3D6-WT-treated 3xTg-AD mice (3xTg/WT,
in yellow) and the scFv-h3D6-WT-treated 3xTg-AD ones (3xTg/EL, in purple) were compared to the
age-matched untreated 3xTg and NTg controls (dashed lines in red and in green, respectively).
Statistical differences signaled at 5 months of age correspond to the 3xTg and 3xTg/EL comparison.
B) Results of normal (acq) and reversal (rev) acquisition testing (on the left side of the panel) in the
WT- and EL-treated mice, compared to the untreated ones, at 5, 7 and 9 months of age. Percentage
of distances traveled in the platform area and the virtual concentric areas around (Z1, Z2, and Z3)
during the final probe of the MWM (on the right). Values are represented by means and error bars
correspond to the SEM in the scatter plots across time, or by medians and IQR in the final probe
box plots. # indicates the marginally significant differences with p≤0.1, * significant differences with
p≤0.05, ** p≤0.01, and *** p≤0.001. 1 Values were normalized by the distances between the
starting points and the platform to properly compare among trials and acquisitions. A slight
improvement in the BPSD-like symptoms was performed by the treated mice. Results from both
treated groups were improved over ages in the normal acquisition phase, being the WT-treated
mice, the ones showing a better performance at the end of the study. As well, scFv-h3D6-WT-
treated mice reversed the pathological values in the final probe already at 5 months of age, and
improved their performance over time.
Neuropsychiatric-like symptoms, spatial learning and memory in 9-mo-old naïve
mice
Bimonthly testing may interfere on the behavioral and emotional phenotypes because of
habituation, as well as in learning and cognitive abilities due to the regular cognitive stimulation.
Therefore, the training component was analyzed by comparing naïve 9-months-old mice the to the
trained ones in the same tests (CT, OFT and MWM paradigm). The four experimental conditions
were reproduced following identical treatments, and data from those parameters automatically
measured by the AnyMaze software were processed (Figure 43, Supplementary Table 9).
Comparison between naïve NTg and 3xTg-AD mice presented no differences in the CT. Values of
the exploratory activity (distance traveled) and the emotional-related parameters (mean speed and
immobility time) obtained from naïve mice performances corresponded to the expected ones in
between 5 and 7 months of age from the longitudinal study, what evidenced the combined effect
of habituation and aging in the results of the longitudinal corner testing.
In the OFT, both naïve 9-mo-old NTg and 3xTg-AD mice significantly differed in all the analyzed
parameters, contrasting with the longitudinal testing, in which values for most of the parameters
were statistically different at 5 months of age, but significances disappeared at 9 months (see
Supplementary table 9). Therefore, differences between experimental groups were softened over
time not only because of aging but because of a strong habituation component. Specifically, naïve
mice traveled faintly higher distance than the age-matched trained ones, despite the immobility
time performed was even longer. Regarding to the center/periphery (C/P) ratios of distance and

Chapter 4
132
time, the comparison varied depending on the experimental group: untrained 9-mo-old NTg mice
presented values similar to the 5-mo-old mice, indicating that the faint decreasing tendency
exhibited by this group over time was consequence of the habituation, whereas untrained 9-mo-
old 3xTg-AD mice presented even lower values than the 9-mo-old trained mice, what supports that
the disinhibition observed in 5-mo-old 3xTg-AD was due to the neurodegenerative stage more than
because of the novelty-caused anxious-like behavior.
Regarding to the MWM paradigm, naïve mice traveled longer distances to reach the platform than
the age-matched trained ones in the acquisition phase, evidencing the beneficial effect of the
cognitive stimulation in both normal aging and degenerative progression. In this sense, naïve NTg
mice exhibited a significant reduction in the distance traveled at the second acquisition stage when
compared to the first one (U-test, p=0.001), whereas this reduction was not achieved until the
fourth stage in the trained NTg mice. As well, untreated and treated naïve 3xTg-AD mice
significantly reduced the distance to the platform earlier than the corresponding trained ones
(Figure 43A). In the final probe, all the naïve groups tended to swim following a platform-directed
pattern, as observed by the percentage of distance traveled in each virtual zone (Figure 43B).
Figure 43. Spatial learning and memory in trained and naïve mice. A) Acquisition performances of
the trained 9-months-old mice compared to age-matched naïve ones. Results of the four
experimental groups are represented: NTg mice, in green; untreated 3xTg-AD (3xTg) group, in red;
scFv-h3D6-WT-treated 3xTg-AD mice (3xTg/WT), in yellow; and scFv-h3D6-EL-treated 3xTg-AD mice
(3xTg/EL), in purple. Values are represented by means and error bars correspond to the SEM.
Statistical differences to the first stage are indicated in the treated 3xTg-AD mice for the trained
mice and in all the groups for the naïve ones. B) Percentage of distance traveled by the naïve mice
among the virtually delimited zones in the final probe. Medians and IQR are indicated in the box
plots (all the data points are expressed and whiskers points to the minimum and maximum values).
# indicates the marginally significant differences with p≤0.1, * significant differences with p≤0.05,
** p≤0.01, and **** p≤0.0001. 1 Values were normalized by the distances between the starting
points and the platform to properly compare among trials and acquisitions. Trained mice traveled
shorter distances to the platform than the naïve ones in the acquisition phase. All the groups
presented tendency to a platform-directed swimming pattern, but no differences were found
between groups.
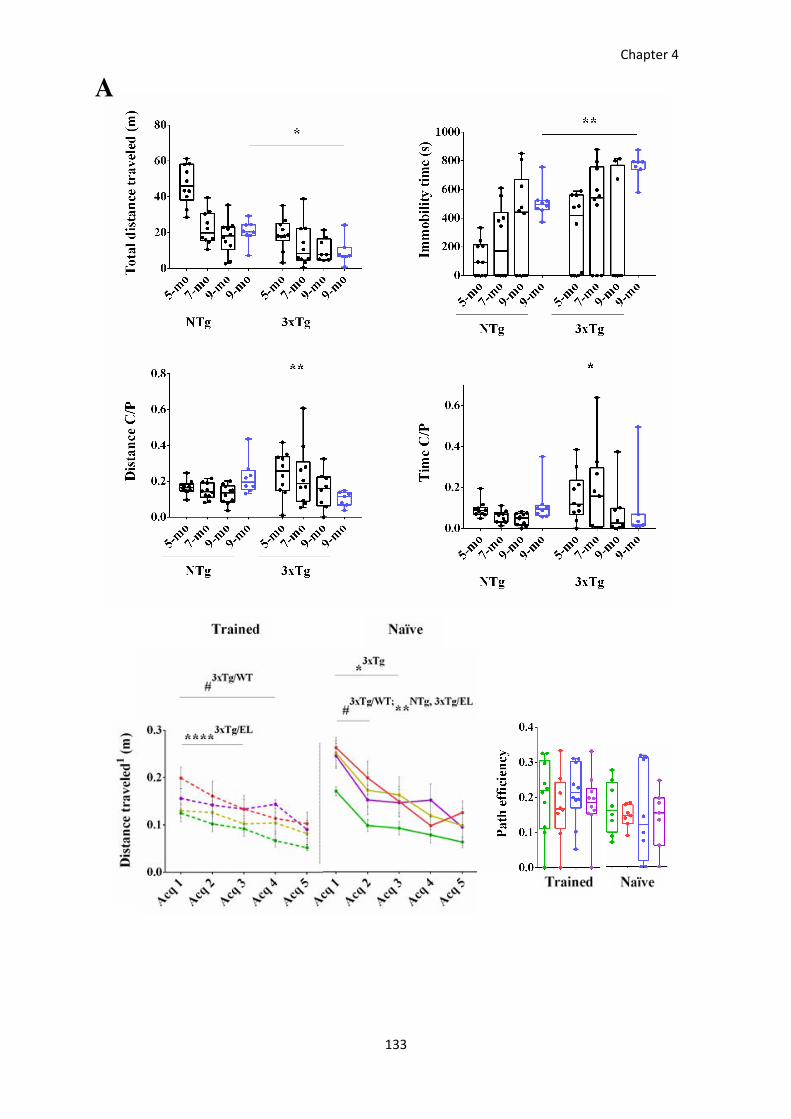
Chapter 4
133
A

Chapter 4
134
DISCUSSION
The multifactorial character of AD makes the understanding of this pathology extremely difficult.
Animal models have become a useful tool in which further assay therapeutic approaches, even
though AD modeling is a handicap by itself [71]. Several neuropathological hallmarks have been
reproduced in mice. However, mimicking the behavioral/emotional and cognitive phenotypes
represents a very difficult goal, not only due to the heterogeneity of clinical symptoms [228] and
the complexity of its evaluation [229–231], but also to the difficulties for precisely identifying some
of these symptoms in mice.
The 3xTg-AD mouse is quite concurrently mentioned in the literature and has probably become the
most used model nowadays. This is the first one encoding for both the amyloid and tau pathologies
and, interestingly, is one of the few models also reproducing the associated neuron loss [191],
apart from the synaptic disruption and the correlating functional response [105]. The early
behavioral and emotional changes of the human AD, as well as the progression of the cognitive
impairments, are also reproduced in the 3xTg-AD mice [232, 233]. Nevertheless, despite the large
amount of reports describing the 3xTg-AD behavior, emotionality and cognition, contradictory
results are still under conflict. For instance, considering the exploratory behavior, the 3xTg-AD
model has been described to exhibit hyperactivity [108, 234], hypoactivity [235–238] or no
differences [239] to NTg controls in the OFT; as well as hyperactivity [236], hypoactivity [238] or no
differences [234], in the elevated plus-maze (EPM); and hypoactivity [240] in the spontaneous
alternation test. Altered emotionality (by disinhibition) has been described by the OFT and EPM at
6 months of age [241], whereas in other studies this is not observed up to the elderly [108].
Likewise, the earliest cognitive impairments are manifested by retention, not learning, deficits in
some studies [105, 242], whereas associative learning is reported as the first cognitive alteration
by others [107].
In this work, the neuropsychiatric-like symptoms and the cognitive impairment of the 3xTg-AD
model were followed-up from 5 to 9 months of age. In brief, neuropsychiatric-like symptoms
performed by the 3xTg-AD mice supported the neophobia and the startle response already
reported, evidencing anxiety- and fear-like behavior [124, 243]. Additionally, disinhibition was also
observed in young 3xTg-AD mice, and diminished as the anxiety- and fear-like behavior became
more pronounced. All these parameters differently progressed over age depending on both the
experimental group and the age considered: those more related to motor activity decreased in a
more pronounced pattern in the NTg than in the 3xTg-AD mice (since aging and habituation may
influence in the same direction in the NTg mice, whereas the pathology component influences in

Chapter 4
135
the opposite direction), whereas those more related to emotional parameters were more altered in
the 3xTg-AD ones.
Regarding to the cognitive abilities, the 3xTg-AD mice exhibited an evident learning ability since the
5 months of age, which was reduced over ages, whereas learning was not so evident in the
youngest NTg mice (because of its consciousness) but the acquisition profile was modified over
ages by the combined effect of the accumulated training and the normal aging. In the same way,
long-term memory in the 3xTg-AD mice was improved over testing whereas it was already obvious
in the 5-mo-old NTg mice. Memory was enhanced by the cognitive stimulation in both cases.
Furthermore, most of the BPSD-like symptoms and cognitive impairments were partially reverted
(some even totally rescued) by the treatment. Comparison between both WT and EL-therapies
suggested that WT presented a stronger effect on the pathology, from the beginning of the study,
although further studies are needed to specify the suitable doses and frequency of the continued
treatment. Interestingly, the beneficial effect of scFv-h3D6 was more evident in those
longitudinally trained mice, what emphasize the potential therapeutic role of immunotherapy in
combination with some mental stimulation.
Therefore, the observed phenotypes resulted from the combination of diverse components: the
experimental group (genotype and treatments), the age (from 5 to 9 months of age), and the
habituation or cognitive stimulation (trained or naïve mice). Interestingly, the interaction between
two of these components was differently manifested depending on the third one.
In conclusion, several issues must be considered for the proper data interpretation and
extrapolation of behavioral testing. The diversity of experimental tests and protocols, and the
variety of parameters measured, the differences in the data processing and/or the statistical tests
used in the behavioral and cognitive studies evoked to a set of mismatched results which hinder
the proper interpretation.

136

137
GENERAL DISCUSSION

138
General Discussion
139
Alzheimer’s disease is the most common neurodegenerative disorder worldwide [2]. The main
histological hallmarks are the accumulation of the Aβ peptide in amyloid plaques and that of
hyperphosphorylated tau in Neurofibrillary tangles (NTFs), together with neuron depletion.
The disease is clinically characterized by a cognitive decline in learning and memory, as well as
by emotional alterations such as anxiety or phobia [244]. Many efforts synergistically work to
not only decipher the exact mechanism triggering the pathology but also to design efficient
and safe disease-modifying therapies. In this context, engineered murine models for AD, such
as the 3xTg-AD provide an excellent paradigm for testing new drugs.
The overall results from this thesis may be distinguished in two blocks. (I) Those referring to
the further description of the 3xTg-AD mouse model, some of which provide new insights into
the pathogenesis of AD; and (II) Those presenting a pharmacological approach with scFv-h3D6
in terms of both the effects of this AD-modifying molecule and its potential mechanism of
action.
1. THE 3xTg-AD MOUSE MODEL AND ALZHEIMER’S DISEASE
Regarding to the descriptive part, it is important to first become aware about the limitations of
modeling a disease whose origin and mechanism are not well-understood [245]. Although
mimicking human AD in animals is a challenging goal, several neuropathological hallmarks can
be reproduced by introducing those mutations found in the familial form of the disease [71,
246]. Mouse models containing APP and APP+PSEN1 mutations widely exhibit the amyloid
pathology. Some subsequently generated models also incorporate tau mutations from
frontotemporal dementia with Parkinsonism (FTDP) [95, 247]. The 3xTg-AD mouse model
exhibits the amyloid and tau pathologies by expressing APPSwe and PS1M146V FAD-mutations,
and tauP301L mutation from FTDP. Despite the equivalent overexpression of the APP- and tau-
encoding transgenes in the model, accumulation of Aβ appears prior to that of tau [103],
concurring with the order of events in the human form of the disease.
Hence, we have further studied what specific cellular populations from the 3xTg-AD mice are
affected by the intracellular amyloid pathology, as well as the extent of their involvement, at
early stages of the disease. Intracellular Aβ has already been reported in the primary motor
cortex, entorhinal cortex, amygdala, and hippocampal CA1 in young 3xTg-AD mice [103]. We
expanded the analysis to finally include the olfactory bulb, cerebral cortex, hippocampus,

General Discussion
140
amygdala, and cerebellum. The highest involvement (as considered by the percentage of 6E10-
ir cells) was found in the large neurons from the basolateral amygdala, followed by the
macroneurons from the fastigial deep cerebellar nuclei (DCN), large neurons from the deep
cerebral layers, macroneurons from the interpositus DCN, and finally by cells from the
pyramidal cells layer in the hippocampal CA3.. A faint signal was also immunodetected within
mitral cells from the olfactory bulb and Purkinje neurons from the cerebellar cortex. All the
analyzed neuron populations were re-examined to quantify cell depletion. Interestingly, results
evidenced that the percentage of neuron depletion correlated with the extent of amyloid-
pathology in those populations evidently affected. Specifically, the best fitting was obtained
with an exponential function. This suggests that cellular depletion is limited when the amyloid
pathology is weak, whereas, when it reaches a certain intensity, depletion soars. This fact
emphasizes the relevance of the extracellular environment on neuron loss, since the
involvement of the surrounding cells seems to outstandingly contribute, in addition to the own
intracellular Aβ burden, to the degenerative process.
Besides, the cellular depletion observed in the 3xTg-AD mice should be highlighted because,
apart from the interesting correlation found with the amyloid pathology, it dramatically
contributes to the complexity of AD modeling. Neuron loss is one of the most extensively
described hallmarks in AD patients [169–171], but its modeling in animals is still a critical point.
For example, it has not been reported in nearly any APP-transgenic mice, though it was
observed in some APP/PS1-transgenic models [173–176].
Furthermore, all of the involved neuron populations in the 3xTg-AD are glutamatergic, as is the
case in humans. Concretely, a severe affectation of glutamatergic neurons located in the
hippocampus, in the frontal, temporal and parietal cortex, and in the amygdala has been
described in AD patients [248].
It is noteworthy that the Aβ toxicity on the glutamatergic system in the 3xTg-AD model is not
reproduced in all other animal models. For instance, in the APPInd- and APPSwe,Ind -transgenic
mice, Aβ/APP appears within GABAergic neurons from the BLA nuclei instead of the
glutamatergic ones. In the same study, Aβ/APP is also detected within glutamatergic neurons
in the 3xTg-AD model [249]. Another interesting example is the 5xFAD mice, which exhibits not
only the amyloid pathology but also neuron loss in large neurons from the deep cortical layers,
so, inglutamatergic ones [147]. Therefore, the expression of the inserted transgenes may be
differently distributed, likely depending on the promoter, isoform, or other unknown factors.
General Discussion
141
Amyloid pathology is widely considered to trigger neuron death by exacerbating the
inflammatory response. Several immune system-related molecules have been associated to
this degenerative process and, in fact, many wide-scale studies are working in that sense [250].
For instance, the proinflammatory cytokine TNF-α may either protect cells against Aβ toxicity
or activate neuron apoptosis. It is described that FAIM-L (Fas apoptotic inhibitory molecule-L)
is reduced in those regions presenting amyloid pathology before the onset of
neurodegeneration. This reduction in the expression of FAIM-L is associated with the
subsequent neurodegeneration by modifying the inflammatory response mediated by TNF-α in
neurons, switching cell protection to apoptosis induction [251, 252]. Besides, it has been
reported that chronic neuronal TNF-α expression promotes inflammation and, ultimately, cell
death [253]. In this sense, we wondered if any of the brain phagocytic cells, such as microglia
or astroglia, were overexpression g inflammatory factors, that is activated, in 5-month old
3xTg-AD mice, as other publications reported at 6-months of age, but this was not the case
[254].
The increasing tendency to consider AD as an immunologic disease more than as a neurologic
one puts an additional spotlight on the peripheral system. Some authors have claimed that a
peripheral immune response precedes AD pathology since, apart from the severe alterations
observed in aged 3xTg-AD mice (such as hepatomegaly, elevated serum levels of anti-
nuclear/anti- dsDNA antibodies, low hematocrit, increased number of double-negative T
splenocytes, and thymic atrophy), splenomegaly is detected as earlier as 2 months of age
In a preliminary assessing of some peripheral organs potentially involved in Aβ clearance, we
have also observed a quite significant splenomegaly in the 3xTg-AD mice at 5-months of age,
concurring with an enlargement of the red pulp. This interestingly fits with the erythrocyte-
mediated Aβ clearance via immune adherence, recently proposed [205, 206], since Aβ
overproduction in the 3xTg-AD mice could be faced, in turn, by an enhanced clearance of
erythrocytes in the red pulp.
Finally, the widely published behavioral and cognitive alterations, in both AD patients and
transgenic models, are generally associated to Aβ accumulation [255, 256], synaptic disruption
[257–259], and/or neuron atrophy and depletion [177, 178, 248] through the cerebral cortex,
hippocampus, and amygdala. Indeed, it is described that Aβ accumulates at certain synapses in
micromolar concentrations, and has the ability to bind to NMDA receptors, thus inducing the
internalization and deregulation of the NMDA signaling pathway [260, 261].
General Discussion
142
Intracellular amyloid pathology in 3xTg-AD was also directly related to the onset of behavioral
and cognitive impairments [105], which are widely assessed in this model [106]. Despite the
first conception about the late-onset of BPSD, these symptoms are currently demonstrated to
already appear in the prodromal phases of human AD [262]. Curiously, anxiety-related
behavior is reported to be exhibited by 3xTg-AD as earlier as at 2-3 months of age, preceding
the typical pathology once more and coinciding with the initial alterations in the peripheral
immune system [203]. This concurs with our results, which showed an important behavioral
disturbance, in the form of neophobia, reduced exploratory activity, and anxiety-like behavior
at 5 months of age, and increased over time. Regarding to the cognition, spatial learning and
long-term memory impairments were observed in the MWM already at 5 months of age,
supporting the previously described impairments in this model at 3-5 months of age [107], and
increased as the disease progressed.
2. ScFv-h3D6 AS A POTENTIAL THERAPY FOR AD
Many efforts are focused on the searching of a disease-modifying therapy for AD. Targeting Aβ
oligomers is one of the leading strategies in pharmacological research, especially by
immunotherapy. Several monoclonal antibodies (mAbs) have been developed for such a
purpose [212]. Bapineuzumab was the first mAb to reach phase III clinical trials, but it was
discontinued in 2012 because adverse effects appeared [121]. The use of single-chain variable
fragments (scFv) has been proposed to avoid those severe effects, which are supposed to be
induced by the Fc portion of the mAbs via FcγR-dependent activation of microglia [190]. The
anti-Aβ-oligomers single-chain antibody fragment scFv-h3D6, derived from bapineuzumab, has
been shown as a potential tool for the treatment of AD. Firstly, it was demonstrated to avoid
Aβ-induced cytotoxicity in SH-SY5Y neuroblastoma cell-cultures by withdrawing Aβ oligomers
from the amyloid pathway to a non-toxic, worm-like pathway [120]. In addition, a single
intraperitoneal dose of scFv-h3D6 to the 3xTg-AD mice ameliorated the first hallmarks of AD.
Concretely, this single dose decreased Aβ oligomers, restored the concentrations of
apolipoproteins E and J, protected from death deep cerebellar nuclei, and ameliorated some
cognitive traits [124, 151].
Here, the effect of a punctual administration of scFv-h3D6 to the 3xTg-AD mice has been
assesed. We focused on the early stages of the pathology (5-mo-old females) to facilitate the
General Discussion
143
detection of the disease-modifying action of scFv-h3D6. Intracellular amyloid pathology was
evaluated in those involved cellular populations from the cerebrum, so large neurons from the
deep cerebral cortex, cells from the pyramidal cells layer from the hippocampal CA3, and
macroneurons from the basolateral amygdalar nucleus. We observed a strong reduction in the
amyloid pathology in terms of both the percentage of cells involved and their Aβ burden.
These results concur with the scFv-h3D6-mediated reduction in soluble Aβ oligomers from the
extracellular fraction, already observed in previous in vivo studies from our group, and extend
the effect to the intracellular compartment [126]. Besides, cell densities of the hippocampal
and amygdalar populations increased with the treatment, suggesting that scFv-h3D6
prevented neuron loss by reducing intracellular Aβ. However, further studies are needed to
conclusively decipher if the cell depletion observed in 3xTg-AD mice corresponds to a neuronal
death-related process [147, 253, 263] or an impaired neurogenesis [264, 265], since both
processes have been described in some transgenic models of AD, such as the 3xTg-AD mice.
However, the scFv-h3D6-mediated preservation has been interpreted in terms of cell loss
because it is evident that it precludes the Aβ peptide-induced neuron death in cell cultures
[120, 122].
Besides, a first insight into the safety of scFv-h3D6 treatment was also performed, in terms of
neuroinflammation and histology of some peripheral organs. No side effects were detected, as
assessed by astro- or microglial activation. Brain TNF-α levels were slightly increased in the
treated 3xTg-AD mice, but not in the treated-NTg controls, suggesting its involvement in the
protective mechanism rather than constituting an adverse effect [252]. Regarding to the
peripheral organs, the only significant difference found was an even more evident
splenomegaly in the treated 3xTg-AD, coinciding, in this case, with the enlargement of the
white pulp. This evidence concurs with the reported proposal about the erythrocyte-mediated
Aβ clearance [206], above mentioned, which is also related to Aβ-immunotherapy [208]. The
authors evidenced that the deficient complement-mediated Aβ clearance in AD is enhanced by
immunotherapy, since Aβ antibodies dramatically potentiate complement activation and
opsonization of Aβ by either erythrocytes and/or macrophages. Hence, the white pulp
enlargement could correspond to the overproduction of macrophages (Has trobat un augment
de macròfags?. crec que NO. to mediate the clearance of the Aβ/antibody complex from the
peripheral circulation.

General Discussion
144
Furthermore, the therapeutic potential of scFv-h3D6 on behavioral and cognitive impairments
was assessed after a single-dose of scFv-h3D6, in 5-mo-old 3xTg-AD mice and, also, on a
chronic monthly treatment from 5 to 9 months of age. The original version of the scFv-h3D6
(WT) was compared to its best thermodynamically stabilized variant (EL). Any of both
molecules was able to reverse the BPSD-like symptoms of this model, probably because the
amygdala (the most involved brain region in anxiety- and fear-like symptoms [266]) was the
strongest affected region and, so, it was not recovered enough by the treatment. However,
concerning to the cognitive impairment, an amelioration of the spatial learning and long-term
memory was found in the MWM paradigm. The beneficial effect of the treatment was already
evident in 5-mo-old mice, and was maintained up to 9 months of age. Interestingly, the results
obtained after a single dose of scFv-h3D6-WT were greater than with the EL version, though
the effects of both molecules were similar after 5 administrations, probably because an
accumulative effect. This concurs with the results from a parallel analysis performed by a
colleague from our group, in which cortical levels of Aβ42 were determined by ELISA
quantification in young 3xTg-AD mice (5 months of age), after a single administration of scFv-
h3D6-WT or -EL, and in old mice (12 months of age), after a 7-mo-long chronic treatment
[267]).(
Finally, we performed a preliminary approach to the scFv-h3D6 pharmacokinetics to further
understand the mechanism underlying the protective effect of the scFv-h3D6. Results suggest
that scFv-h3D6 is absorbed from the peritoneal cavity to the central system and distributed by
following a compartmental model. Blood concentrations of scFv-h3D6-WT and -EL molecules
were compared over time, evidencing a shorter half-life but a rather higher absorption for the
WT version. Interestingly, scFv-h3D6 crosses the BBB and, once in the brain it may be engulfed
by glial cells or internalized in neurons. Aβ/scFv-h3D6 complex observed within neurons would
be extruded to the extracellular compartment and subsequently engulfed by glial cells.
Noteworthy, both scFv-h3D6 alone and the Aβ/scFv-h3D6 complex were observed in the
endothelial cells of the blood vessels at the early and late post-injection phases, respectively.
This suggests the scFv-h3D6 influx to, as well as some Aβ/scFv-h3D6 efflux from, the central
nervous system.

145
CONCLUSIONS

146

Conclusions
147
The general conclusions from this thesis are:
- The 3xTg-AD mouse model reproduces intracellular amyloid pathology and neuron
depletion, as well as the altered functional phenotype in terms of BPSD-like symptoms and
cognitive impairment. Besides, non-alcoholic steatosis was detected in the liver
parenchyma and, interestingly, this model presents red pulp-associated splenomegaly.
- ScFv-h3D6 reduces the intracellular amyloid pathology and preserves cells from depletion
in 3xTg-AD mice. In consonance, the cognitive impairment is ameliorated as well. The
treatment with the original version (WT) appears to be more efficient than that with a
stabilized version (EL) after a single dose, but the effects are similar after a chronic
treatment for 5 months. This is, probably so because the lower absorption, albeit longer
half-life, of the EL version. ScFv-h3D6 crosses the BBB and promotes Aβ clearance,
probably by the glial-mediated clearance by the Aβ/scFv-h3D6 complex.
The specific conclusions obtained from each Chapter of this thesis are detailed as follows:
Chapter 1: Intracellular Aβ/APP correlates with neurodegeneration in those neuronal
populations early involved in Alzheimer’s disease.
1. The neuron populations affected by the intracellular amyloid pathology in 5-months-old
3xTg-AD females are glutamatergic. These are the large pyramidal neurons from the deep
layers of the cerebral cortex, the pyramidal neurons from the region I and II-III from the
Cornus Ammonis, the large neurons from the basolateral amygdalar nucleus, and the
macroneurons from the deep cerebellar nuclei.
2. The intracellular distribution of the Aβ peptide consists on discrete accumulations, mostly
corresponding to endosomes or vesicular bodies.
3. Neuron loss in 5-months-old 3xTg-AD females significantly occur on those neuronal
populations more affected by the amyloid pathology (detailed in conclusion 1).
4. The intracellular amyloid load strongly correlates with the percentage of neuron depletion
in those evidently affected neuron populations.
Conclusions
148
5. Both astro- and microglia intimately contribute, somehow, to the amyloid pathology by
wrapping Aβ-containing cells.
6. Five-months-old 3xTg-AD females exhibited a pronounced anxious-like behavior and
cognitive impairment when compared to the NTg mice.
Chapter 2: ScFv-h3D6 prevents neuron loss and improves cognitive impairment in young
3xTg-AD females by reducing intracellular Aβ
1. A single intraperitoneal dose of 100 µg of scFv-h3D6 promoted the intracellular Aβ
clearance, by reducing both the percentage of immunoreactive cells and the intracellular
Aβ burden.
2. The treatment resulted in a significant prevention of neuron depletion that correlated with
intracellular Aβ clearance.
3. No adverse inflammatory effects were detected in the nervous tissue from treated NTg
and 3xTg-AD mice, as assessed by astro- and microglia evaluation, and TNF-α levels.
4. Non-alcoholic steatosis was observed in the liver of 3xTg-AD mice, which was not reversed
by the treatment.
5. The 3xTg-AD mice showed splenomegaly, with an enlarged red pulp. No other alterations
were found in kidneys or spleen.
6. The size of the white pulp from 3xTg-AD mice, but not from the NTg ones, was quite
increased by the treatment, pointing to a putative peripheral mechanism for the clearance
of the Aβ/scFv-h3D6 complex.
7. The treatment was ineffective in preventing the anxious-like behavior exhibited by the
3xTg-AD mice, but succeed in ameliorating the cognitive abilities.
Chapter 3: Pharmacokinetics of scFv-h3D6 and first approach to its action mechanism

Conclusions
149
1. Both scFv-h3D6-WT and -EL presented a double positive peak on the time-concentration
profile in plasma, suggesting a compartmental model of distribution.
2. ScFv-h3D6-WT presented an enhanced absorption from the intraperitoneal cavity to blood
compared to the -EL version.
3. Albeit its absorption was not efficient, scFv-h3D6-EL exhibited a longer half-life than scFv-
h3D6-WT.
4. ScFv-h3D6 crosses the blood-brain barrier. The maximum concentration in the nervous
tissue occurred ~1h p.i. and was concomitant with the presence of scFv-h3D6 in the blood
vessels wall.
5. ScFv-h3D6 may be internalized by cells. The first notable internalization process occurred
in between 1-5h p.i. and the second one at ~48h p.i.
6. ScFv-h3D6 and Aβ co-localize in the perikarion. During the early p.i. phase, scFv-h3D6 was
engulfed by glial cells and internalized into Aβ-containing neurons. However, at the late
p.i. phase this was mainly the case for small-body cells.
7. TNF-α presented a pronounced peak at ~1h p.i., concomitant with the first maximum in
concentration of scFv-h3D6 in plasma and nervous tissue, and with the first decline in Aβ
levels, which could be indicative of an initial immune response to the treatment.
Chapter 4: Interaction among ageing, training, and immunotherapy on behavioral and
cognitive impairments in the 3xTg-AD mouse model of Alzheimer’s disease
1. BPSD-like symptoms were already evident in 5-mo-old 3xTg-AD mice, in the form of
neophobic response (CT) and reduced exploratory activity (OFT).
2. The exploratory activity of both NTg and 3xTg-AD mice decreased over the longitudinal
study probably because of habituation.
3. The swimming speed (MWM) by the 3xTg-AD mice was faster than by the NTg ones along
the study, supporting the anxious-like behavior in the model.
Conclusions
150
4. The 3xTg-AD mice exhibited similar learning profiles in the MWM from 5 to 9 months of
age.
5. The learning profile of the NTg mice was almost negligible at 5 months of age, but
improved over time.
6. The long-term spatial memory in the 3xTg-AD mice was impaired compared to the NTg
ones, but both showed an improvement of memory over ages.
7. The learning abilities of the NTg mice were emphasized in the reversal MWM, but were
weakened over age. In the case of the 3xTg-AD mice, learning was only observed at 5
months of age.
8. The effects of scFv-h3D6 treatment were almost negligible on the BPSD-like symptoms of
3xTg-AD, but amelioration of the cognitive impairment was evident.

151
REFERENCES

152
153
1. National Institute of Health (NIH) - National Institute on Aging (NIA). Alzheimer’s Disease Fact Sheet. U.S. Department of Health & Human Services. https://www.nia.nih.gov/health/alzheimers-disease-fact-sheet. Accessed 9 Sep 2017.
2. Prince M, Wimo A, Guerchet M, Ali G-C, Wu Y-T MP. World Alzheimer Report 2015. The Global Impact of Dementia. An analysis of prevalence, incidence, costs and trends. 2015. http://www.alz.co.http//www.alz.co.uk/research/world-report-2015. Accessed 21 Mar 2016.
3. WHO | Dementia: a public health priority. WHO. 2016.
4. Carrillo MC. Leveraging global resources to end the Alzheimer’s pandemic. Alzheimer’s Dement. 2013;9:363–5.
5. Alzheimer A. Über einen eigenartigen schweren Erkrankungsprozeβ der Hirnrincle. Neurol Cent. 1906;25.
6. Kraepelin E. Ein Lehrbuch fur Studierende und Aertze. Band II Klin Psychiatr. 1910;8th editio.
7. Masters CL, Simms G, Weinman NA, Multhaup G, McDonald BL, Beyreuther K. Amyloid plaque core protein in Alzheimer disease and Down syndrome. Proc Natl Acad Sci U S A. 1985;82:4245–9.
8. Bancher C, Brunner C, Lassmann H, Budka H, Jellinger K, Wiche G, et al. Accumulation of abnormally phosphorylated tau precedes the formation of neurofibrillary tangles in Alzheimer’s disease. Brain Res. 1989;477:90–9.
9. Hardy JA, Higgins GA. Alzheimer’s disease: the amyloid cascade hypothesis. Science. 1992;256:184–5.
10. Scheltens P, Blennow K, Breteler MMB, de Strooper B, Frisoni GB, Salloway S, et al. Alzheimer’s disease. Lancet. 2016;388:505–17.
11. Alzheimer’s disease. Causes, symptoms, treatment Alzheimer’s disease. http://dxline.info/dictionary/alzheimers-disease. Accessed 11 Sep 2017.
12. #NeuroNewsNight – Connecting students with scientists, physicians, and educators to discuss neuroscience in the news. https://neuronewsnight.com/. Accessed 25 Oct 2017.
13. Cappai R, Needham BE, Ciccotosto GD. Abeta peptide and Alzheimer’s disease : celebrating a century of research. Springer; 2007.
14. van der Kant R, Goldstein LSB. Cellular Functions of the Amyloid Precursor Protein from Development to Dementia. Dev Cell. 2015;32:502–15.
15. Lee J, Retamal C, Cuitiño L, Caruano-Yzermans A, Shin J-E, van Kerkhof P, et al. Adaptor protein sorting nexin 17 regulates amyloid precursor protein trafficking and processing in the early endosomes. J Biol Chem. 2008;283:11501–8.
16. Müller UC, Deller T, Korte M. Not just amyloid: physiological functions of the amyloid precursor protein family. Nat Rev Neurosci. 2017;18:281–98.
17. Jarrett JT, Berger EP, Lansbury PT. The carboxy terminus of the beta amyloid protein is critical for the seeding of amyloid formation: implications for the pathogenesis of Alzheimer’s disease. Biochemistry. 1993;32:4693–7.
18. Andrew RJ, Kellett KAB, Thinakaran G, Hooper NM. A Greek Tragedy: The Growing Complexity of Alzheimer Amyloid Precursor Protein Proteolysis. J Biol Chem. 2016;291:19235–44.
154
19. Baranello RJ, Bharani KL, Padmaraju V, Chopra N, Lahiri DK, Greig NH, et al. Amyloid-beta protein clearance and degradation (ABCD) pathways and their role in Alzheimer’s disease. Curr Alzheimer Res. 2015;12:32–46.
20. Farris W, Mansourian S, Chang Y, Lindsley L, Eckman EA, Frosch MP, et al. Insulin-degrading enzyme regulates the levels of insulin, amyloid beta-protein, and the beta-amyloid precursor protein intracellular domain in vivo. Proc Natl Acad Sci U S A. 2003;100:4162–7.
21. Miller BC, Eckman EA, Sambamurti K, Dobbs N, Chow KM, Eckman CB, et al. Amyloid- peptide levels in brain are inversely correlated with insulysin activity levels in vivo. Proc Natl Acad Sci. 2003;100:6221–6.
22. Barker R, Love S, Kehoe PG. Plasminogen and plasmin in Alzheimer’s disease. Brain Res. 2010;1355:7–15.
23. Lorenzl S, Albers DS, LeWitt PA, Chirichigno JW, Hilgenberg SL, Cudkowicz ME, et al. Tissue inhibitors of matrix metalloproteinases are elevated in cerebrospinal fluid of neurodegenerative diseases. J Neurol Sci. 2003;207:71–6.
24. Roher AE, Kasunic TC, Woods AS, Cotter RJ, Ball MJ, Fridman R. Proteolysis of Aβ Peptide from Alzheimer Disease Brain by Gelatinase A. Biochem Biophys Res Commun. 1994;205:1755–61.
25. Hook V, Funkelstein L, Wegrzyn J, Bark S, Kindy M, Hook G. Cysteine Cathepsins in the secretory vesicle produce active peptides: Cathepsin L generates peptide neurotransmitters and cathepsin B produces beta-amyloid of Alzheimer’s disease. Biochim Biophys Acta - Proteins Proteomics. 2012;1824:89–104.
26. Mueller-Steiner S, Zhou Y, Arai H, Roberson ED, Sun B, Chen J, et al. Antiamyloidogenic and neuroprotective functions of cathepsin B: implications for Alzheimer’s disease. Neuron. 2006;51:703–14.
27. Deane R, Wu Z, Sagare A, Davis J, Du Yan S, Hamm K, et al. LRP/Amyloid β-Peptide Interaction Mediates Differential Brain Efflux of Aβ Isoforms. Neuron. 2004;43:333–44.
28. Sun X, Chen W-D, Wang Y-D. β-Amyloid: the key peptide in the pathogenesis of Alzheimer’s disease. Front Pharmacol. 2015;6:221.
29. Yoon S-S, Jo SA. Mechanisms of Amyloid-β Peptide Clearance: Potential Therapeutic Targets for Alzheimer’s Disease. Biomol Ther (Seoul). 2012;20:245–55.
30. Ries M, Sastre M. Mechanisms of Aβ Clearance and Degradation by Glial Cells. Front Aging Neurosci. 2016;8:160.
31. Bates KA, Verdile G, Li Q-X, Ames D, Hudson P, Masters CL, et al. Clearance mechanisms of Alzheimer’s amyloid-β peptide: implications for therapeutic design and diagnostic tests. Mol Psychiatry. 2009;14:469–86.
32. Deane R, Bell RD, Sagare A, Zlokovic B V. Clearance of amyloid-beta peptide across the blood-brain barrier: implication for therapies in Alzheimer’s disease. CNS Neurol Disord Drug Targets. 2009;8:16–30.
33. Pappolla M, Sambamurti K, Vidal R, Pacheco-Quinto J, Poeggeler B, Matsubara E. Evidence for lymphatic Aβ clearance in Alzheimer’s transgenic mice. Neurobiol Dis. 2014;71:215–9.
34. O’Brien RJ, Wong PC. Amyloid precursor protein processing and Alzheimer’s disease. Annu Rev Neurosci. 2011;34:185–204.
155
35. LaFerla FM, Green KN, Oddo S. Intracellular amyloid-beta in Alzheimer’s disease. Nat Rev Neurosci. 2007;8:499–509.
36. Karran E, Mercken M, De Strooper B. The amyloid cascade hypothesis for Alzheimer’s disease: an appraisal for the development of therapeutics. Nat Rev Drug Discov. 2011;10:698–712.
37. Lu J-X, Qiang W, Yau W-M, Schwieters CD, Meredith SC, Tycko R. Molecular structure of β-amyloid fibrils in Alzheimer’s disease brain tissue. Cell. 2013;154:1257–68.
38. Gremer L, Schölzel D, Schenk C, Reinartz E, Labahn J, Ravelli RBG, et al. Fibril structure of amyloid-β(1–42) by cryo–electron microscopy. Science (80- ). 2017;358:116–9.
39. Haass C, Selkoe DJ. Soluble protein oligomers in neurodegeneration: lessons from the Alzheimer’s amyloid β-peptide. Nat Rev Mol Cell Biol. 2007;8:101–12.
40. Walsh DM, Selkoe DJ. A beta oligomers - a decade of discovery. J Neurochem. 2007;101:1172–84.
41. Gouras GK, Tampellini D, Takahashi RH, Capetillo-Zarate E. Intraneuronal beta-amyloid accumulation and synapse pathology in Alzheimer’s disease. Acta Neuropathol. 2010;119:523–41.
42. Villegas S. Enfermedad de Alzheimer: nuevas estrategias terapéuticas. Med Clin (Barc). 2015;145:76–83.
43. Lu J-X, Qiang W, Yau W-M, Schwieters CD, Meredith SC, Tycko R. Molecular structure of β-amyloid fibrils in Alzheimer’s disease brain tissue. Cell. 2013;154:1257–68.
44. Wälti MA, Ravotti F, Arai H, Glabe CG, Wall JS, Böckmann A, et al. Atomic-resolution structure of a disease-relevant Aβ(1-42) amyloid fibril. Proc Natl Acad Sci U S A. 2016;113:E4976-84.
45. Querfurth HW, LaFerla FM. Alzheimer’s disease. N Engl J Med. 2010;362:329–44.
46. Amemori T, Jendelova P, Ruzicka J, Urdzikova LM, Sykova E. Alzheimer’s Disease: Mechanism and Approach to Cell Therapy. Int J Mol Sci. 2015;16:26417–51.
47. Marei HE, Althani A, Suhonen J, El Zowalaty ME, Albanna MA, Cenciarelli C, et al. Recent Perspective About the Amyloid Cascade Hypothesis and Stem Cell-Based Therapy in the Treatment of Alzheimer’s Disease. In: Atta-ur-Rahman BSP, editor. Frontiers in Clinical Drug Research - Alzheimer Disorders. BENTHAM SCIENCE PUBLISHERS; 2016.
48. Lambracht-Washington D, Rosenberg RN. Anti-amyloid beta to tau - based immunization: Developments in immunotherapy for Alzheimer disease. ImmunoTargets Ther. 2013;2013:105–14.
49. Oddo S, Vasilevko V, Caccamo A, Kitazawa M, Cribbs DH, LaFerla FM. Reduction of soluble Abeta and tau, but not soluble Abeta alone, ameliorates cognitive decline in transgenic mice with plaques and tangles. J Biol Chem. 2006;281:39413–23.
50. Bloom GS. Amyloid-β and tau: the trigger and bullet in Alzheimer disease pathogenesis. JAMA Neurol. 2014;71:505–8.
51. DeKosky ST, Scheff SW. Synapse loss in frontal cortex biopsies in Alzheimer’s disease: correlation with cognitive severity. Ann Neurol. 1990;27:457–64.
52. Snyder EM, Nong Y, Almeida CG, Paul S, Moran T, Choi EY, et al. Regulation of NMDA receptor trafficking by amyloid-beta. Nat Neurosci. 2005;8:1051–8.
156
53. Hsieh H, Boehm J, Sato C, Iwatsubo T, Tomita T, Sisodia S, et al. AMPAR removal underlies Abeta-induced synaptic depression and dendritic spine loss. Neuron. 2006;52:831–43.
54. Wang H-Y. Beta-amyloid(1-42) binds to alpha 7 nicotinic acetylcholine receptor with high affinity. Implications for Alzheime’s disease pathology. J Biol Chem. 2000;275:5626–32.
55. Devi L, Prabhu BM, Galati DF, Avadhani NG, Anandatheerthavarada HK. Accumulation of Amyloid Precursor Protein in the Mitochondrial Import Channels of Human Alzheimer’s Disease Brain Is Associated with Mitochondrial Dysfunction. J Neurosci. 2006;26:9057–68.
56. Barsoum MJ, Yuan H, Gerencser AA, Liot G, Kushnareva Y, Gräber S, et al. Nitric oxide-induced mitochondrial fission is regulated by dynamin-related GTPases in neurons. EMBO J. 2006;25:3900–11.
57. Popugaeva E, Bezprozvanny I. Can the Calcium Hypothesis Explain Synaptic Loss in Alzheimer’s Disease? Neurodegener Dis. 2013;13:139–41.
58. Isaacs AM, Senn DB, Yuan M, Shine JP, Yankner BA. Acceleration of Amyloid β-Peptide Aggregation by Physiological Concentrations of Calcium. J Biol Chem. 2006;281:27916–23.
59. de Moura MB, dos Santos LS, Van Houten B. Mitochondrial dysfunction in neurodegenerative diseases and cancer. Environ Mol Mutagen. 2010;51:NA-NA.
60. Lustbader JW, Cirilli M, Lin C, Xu HW, Takuma K, Wang N, et al. ABAD Directly Links A to Mitochondrial Toxicity in Alzheimer’s Disease. Science (80- ). 2004;304:448–52.
61. Barone E, Butterfield DA. Insulin resistance in Alzheimer disease: Is heme oxygenase-1 an Achille’s heel? Neurobiol Dis. 2015;84:69–77.
62. Messier C, Teutenberg K. The role of insulin, insulin growth factor, and insulin-degrading enzyme in brain aging and Alzheimer’s disease. Neural Plast. 2005;12:311–28.
63. Heneka MT, Golenbock DT, Latz E. Innate immunity in Alzheimer’s disease. Nat Immunol. 2015;16:229–36.
64. Greenberg SM, Gurol ME, Rosand J, Smith EE. Amyloid angiopathy-related vascular cognitive impairment. Stroke. 2004;35 11 Suppl 1:2616–9.
65. Deane R, Zlokovic B V. Role of the blood-brain barrier in the pathogenesis of Alzheimer’s disease. Curr Alzheimer Res. 2007;4:191–7.
66. Alzheimer’s Association. 2013 Alzheimer’s disease facts and figures. Alzheimers Dement. 2013;9:208–45.
67. Hardy J, Selkoe DJ. The amyloid hypothesis of Alzheimer’s disease: progress and problems on the road to therapeutics. Science. 2002;297:353–6.
68. Cruts M, Theuns J VBC. AD&FTD Mutation Database. http://www.molgen.vib-ua.be/ADMutations/default.cfm?MT=0&ML=0&Page=Home. Accessed 7 Aug 2015.
69. Pimplikar SW. Reassessing the amyloid cascade hypothesis of Alzheimer’s disease. Int J Biochem Cell Biol. 2009;41:1261–8.
70. Ho L, Fukuchi K i, Younkin SG. The alternatively spliced Kunitz protease inhibitor domain alters amyloid beta protein precursor processing and amyloid beta protein production in cultured cells. J Biol Chem. 1996;271:30929–34.
71. Esquerda-Canals G, Montoliu-Gaya L, Güell-Bosch J, Villegas S. Mouse Models of Alzheimer’s Disease. J Alzheimer’s Dis. 2017;57:1171–83.

157
72. Shen J, Kelleher RJ. The presenilin hypothesis of Alzheimer’s disease: evidence for a loss-of-function pathogenic mechanism. Proc Natl Acad Sci U S A. 2007;104:403–9.
73. Hoenicka J. Genes in Alzheimer’s disease. Rev Neurol. 2006;42:302–5.
74. Bu G. Apolipoprotein E and its receptors in Alzheimer’s disease: pathways, pathogenesis and therapy. Nat Rev Neurosci. 2009;10:333–44.
75. Farrer LA, Cupples LA, Haines JL, Hyman B, Kukull WA, Mayeux R, et al. Effects of age, sex, and ethnicity on the association between apolipoprotein E genotype and Alzheimer disease. A meta-analysis. APOE and Alzheimer Disease Meta Analysis Consortium. JAMA. 1997;278:1349–56.
76. Hauser PS, Narayanaswami V, Ryan RO. Apolipoprotein E: from lipid transport to neurobiology. Prog Lipid Res. 2011;50:62–74.
77. Winkler K, Scharnagl H, Tisljar U, Hoschützky H, Friedrich I, Hoffmann MM, et al. Competition of Abeta amyloid peptide and apolipoprotein E for receptor-mediated endocytosis. J Lipid Res. 1999;40:447–55.
78. Bell RD, Sagare AP, Friedman AE, Bedi GS, Holtzman DM, Deane R, et al. Transport pathways for clearance of human Alzheimer’s amyloid β-peptide and apolipoproteins E and J in the mouse central nervous system. J Cereb Blood Flow Metab. 2006;27:909–18.
79. Miyata M, Smith JD. Apolipoprotein E allele-specific antioxidant activity and effects on cytotoxicity by oxidative insults and beta-amyloid peptides. Nat Genet. 1996;14:55–61.
80. Sen A, Alkon DL, Nelson TJ. Apolipoprotein E3 (ApoE3) but not ApoE4 protects against synaptic loss through increased expression of protein kinase C epsilon. J Biol Chem. 2012;287:15947–58.
81. Hashimoto T, Serrano-Pozo A, Hori Y, Adams KW, Takeda S, Banerji AO, et al. Apolipoprotein E, especially apolipoprotein E4, increases the oligomerization of amyloid β peptide. J Neurosci. 2012;32:15181–92.
82. Harold D, Abraham R, Hollingworth P, Sims R, Gerrish A, Hamshere ML, et al. Genome-wide association study identifies variants at CLU and PICALM associated with Alzheimer’s disease. Nat Genet. 2009;41:1088–93.
83. Lambert J-C, Heath S, Even G, Campion D, Sleegers K, Hiltunen M, et al. Genome-wide association study identifies variants at CLU and CR1 associated with Alzheimer’s disease. Nat Genet. 2009;41:1094–9.
84. Bohm C, Chen F, Sevalle J, Qamar S, Dodd R, Li Y, et al. Current and future implications of basic and translational research on amyloid-β peptide production and removal pathways. Molecular and Cellular Neuroscience. 2015;66 PA:3–11.
85. Butterfield DA, Di Domenico F, Barone E. Elevated risk of type 2 diabetes for development of Alzheimer disease: a key role for oxidative stress in brain. Biochim Biophys Acta. 2014;1842:1693–706.
86. Bennett DA, Yu L, Yang J, Srivastava GP, Aubin C, De Jager PL. Epigenomics of Alzheimer’s disease. Transl Res. 2015;165:200–20.
87. Neha, Sodhi RK, Jaggi AS, Singh N. Animal models of dementia and cognitive dysfunction. Life Sci. 2014;109:73–86.
88. Braidy N, Muñoz P, Palacios AG, Castellano-Gonzalez G, Inestrosa NC, Chung RS, et al.

158
Recent rodent models for Alzheimer’s disease: clinical implications and basic research. J Neural Transm. 2012;119:173–95.
89. Jones D. Genetic engineering of a mouse: Dr. Frank Ruddle and somatic cell genetics. Yale J Biol Med. 2011;84:117–24.
90. Do Carmo S, Cuello AC. Modeling Alzheimer’s disease in transgenic rats. Mol Neurodegener. 2013;8:37.
91. Teich AF, Patel M, Arancio O. A reliable way to detect endogenous murine β-amyloid. PLoS One. 2013;8:e55647.
92. Gossler A, Doetschman T, Korn R, Serfling E, Kemler R. Transgenesis by means of blastocyst-derived embryonic stem cell lines. Proc Natl Acad Sci U S A. 1986;83:9065–9.
93. Daya S, Berns KI. Gene therapy using adeno-associated virus vectors. Clin Microbiol Rev. 2008;21:583–93.
94. Giraldo P, Montoliu L. Size matters: use of YACs, BACs and PACs in transgenic animals. Transgenic Res. 2001;10:83–103.
95. Götz J. Tau and transgenic animal models. Brain Res Rev. 2001;35:266–86.
96. Hall AM, Roberson ED. Mouse models of Alzheimer’s disease. Brain Research Bulletin. 2012;88:3–12.
97. Games D, Adams D, Alessandrini R, Barbour R, Berthelette P, Blackwell C, et al. Alzheimer-type neuropathology in transgenic mice overexpressing V717F beta-amyloid precursor protein. Nature. 1995;373:523–7.
98. Oddo S, Caccamo A, Shepherd JD, Murphy MP, Golde TE, Kayed R, et al. Triple-transgenic model of Alzheimer’s disease with plaques and tangles: intracellular Aβ and synaptic dysfunction. Neuron. 2003;39:409–21.
99. Graybeal JJ, Bozzelli PL, Graybeal LL, Groeber CM, McKnight PE, Cox DN, et al. Human ApoE ε4 alters circadian rhythm activity, IL-1β, and GFAP in CRND8 mice. J Alzheimers Dis. 2015;43:823–34.
100. Hummel KP, Dickie MM, Coleman DL. Diabetes, a new mutation in the mouse. Science. 1966;153:1127–8.
101. ALZFORUM | NETWORKING FOR A CURE. http://www.alzforum.org/mutations/search?genes%255B%255D=348&diseases%255B%255D=145&keywords-entry=&keywords=#results. Accessed 10 Feb 2015.
102. Oddo S, Caccamo A, Kitazawa M, Tseng BP, LaFerla FM. Amyloid deposition precedes tangle formation in a triple transgenic model of Alzheimer’s disease. Neurobiol Aging. 2003;24:1063–70.
103. Mastrangelo MA, Bowers WJ. Detailed immunohistochemical characterization of temporal and spatial progression of Alzheimer’s disease-related pathologies in male triple-transgenic mice. BMC Neurosci. 2008;9:81.
104. Oh K-J, Perez SE, Lagalwar S, Vana L, Binder L, Mufson EJ. Staging of Alzheimer’s pathology in triple transgenic mice: a light and electron microscopic analysis. Int J Alzheimers Dis. 2010;2010.
105. Billings LM, Oddo S, Green KN. Intraneuronal Aβ Causes the Onset of Early Alzheimer’s Disease-Related Cognitive Deficits in Transgenic Mice. Neuron. 2005;45:675–88.
159
106. Stover KR, Campbell MA, Van Winssen CM, Brown RE. Early detection of cognitive deficits in the 3xTg-AD mouse model of Alzheimer’s disease. Behav Brain Res. 2015;289:29–38.
107. Webster SJ, Bachstetter AD, Nelson PT, Schmitt FA, Van Eldik LJ. Using mice to model Alzheimer’s dementia: an overview of the clinical disease and the preclinical behavioral changes in 10 mouse models. Front Genet. 2014;5:88.
108. Giménez-Llort L, Blázquez G, Cañete T, Johansson B, Oddo S, Tobeña A, et al. Modeling behavioral and neuronal symptoms of Alzheimer’s disease in mice: A role for intraneuronal amyloid. Neurosci Biobehav Rev. 2007;31:125–47.
109. Holliger P, Hudson PJ. Engineered antibody fragments and the rise of single domains. Nat Biotechnol. 2005;23:1126–36.
110. Monnier P, Vigouroux R, Tassew N. In Vivo Applications of Single Chain Fv (Variable Domain) (scFv) Fragments. Antibodies. 2013;2:193–208.
111. Huang L, Su X, Federoff H. Single-Chain Fragment Variable Passive Immunotherapies for Neurodegenerative Diseases. Int J Mol Sci. 2013;14:19109–27.
112. Sperling RA, Jack CR, Black SE, Frosch MP, Greenberg SM, Hyman BT, et al. Amyloid-related imaging abnormalities in amyloid-modifying therapeutic trials: recommendations from the Alzheimer’s Association Research Roundtable Workgroup. Alzheimers Dement. 2011;7:367–85.
113. Manoutcharian K, Perez-Garmendia R, Gevorkian G. Recombinant Antibody Fragments for Neurodegenerative Diseases. Curr Neuropharmacol. 2017;15:779–88.
114. Hybrigenics Services. Hybribody: The future of single-domain antibodies. https://www.hybribody.com/contenu/synthetic-vhh-library-menu/take-advantage-of-vhh-antibody-properties. Accessed 29 Oct 2017.
115. Frenkel D, Katz O, Solomon B. Immunization against Alzheimer’s beta -amyloid plaques via EFRH phage administration. Proc Natl Acad Sci U S A. 2000;97:11455–9.
116. Boado RJ, Lu JZ, Hui EK-W, Pardridge WM. IgG-single chain Fv fusion protein therapeutic for alzheimer’s disease: Expression in CHO cells and pharmacokinetics and brain delivery in the rhesus monkey. Biotechnol Bioeng. 2010;105:627–35.
117. Wörn A, Plückthun A. Mutual Stabilization of V L and V H in Single-Chain Antibody Fragments, Investigated with Mutants Engineered for Stability †. Biochemistry. 1998;37:13120–7.
118. Ramm K, Gehrig P, Plückthun A. Removal of the conserved disulfide bridges from the scFv fragment of an antibody: effects on folding kinetics and aggregation. J Mol Biol. 1999;290:535–46.
119. Wörn A, Plückthun A. Stability engineering of antibody single-chain Fv fragments. J Mol Biol. 2001;305:989–1010.
120. Marín-Argany M, Rivera-Hernández G, Martí J, Villegas S. An anti-Aβ (amyloid β) single-chain variable fragment prevents amyloid fibril formation and cytotoxicity by withdrawing Aβ oligomers from the amyloid pathway. Biochem J. 2011;437:25–34.
121. Salloway S, Sperling R, Fox NC, Blennow K, Klunk W, Raskind M, et al. Two phase 3 trials of bapineuzumab in mild-to-moderate Alzheimer’s disease. N Engl J Med. 2014;370:322–33.
122. Montoliu-Gaya L, Murciano-Calles J, Martinez JC, Villegas S. Towards the improvement in
160
stability of an anti-Aβ single-chain variable fragment, scFv-h3D6, as a way to enhance its therapeutic potential. Amyloid. 2017;24:167–75.
123. Rivera-Hernández G, Marin-Argany M, Blasco-Moreno B, Bonet J, Oliva B, Villegas S. Elongation of the C-terminal domain of an anti-amyloid β single-chain variable fragment increases its thermodynamic stability and decreases its aggregation tendency. MAbs. 5:678–89.
124. Giménez-Llort L, Rivera-Hernández G, Marín-Argany M, Sánchez-Quesada JL, Villegas S. Early intervention in the 3xTg-AD mice with an amyloid β-antibody fragment ameliorates first hallmarks of Alzheimer disease. MAbs. 2013;5:665–77.
125. Geovanny Rivera Hernández. Obtención de un fragmento de anticuerpo específico contra oligómeros de beta-amiloide como agente inmunoterapéutico de la enfermedad de Alzheimer: demostración de su eficacia en el modelo murino 3xT-AD y mejora de su estabilidad termodinámica. Universitat Autònoma de Barcelona; 2013.
126. Giménez-Llort L, Rivera-Hernández G, Marín-Argany M, Sánchez-Quesada JL, Villegas S. Early intervention in the 3xTg-AD mice with an amyloid β-antibody fragment ameliorates first hallmarks of Alzheimer disease. MAbs. 2013;5:665–864.
127. Marín-Argany M, Rivera-Hernández G, Martí J, Villegas S. An anti-Aβ (amyloid β) single-chain variable fragment prevents amyloid fibril formation and cytotoxicity by withdrawing Aβ oligomers from the amyloid pathway. Biochem J. 2011;437:25–34.
128. Carroll JC, Rosario ER, Kreimer S, Villamagna A, Gentzschein E, Stanczyk FZ, et al. Sex differences in β-amyloid accumulation in 3xTg-AD mice: role of neonatal sex steroid hormone exposure. Brain Res. 2010;1366:233–45.
129. LaboratoryInfo.com. Hematoxylin and Eosin staining : principle, procedure and interpretation. http://laboratoryinfo.com/hematoxylin-and-eosin-staining/. Accessed 18 Oct 2017.
130. IHCWORLD Life Science Products & Services. Nissl Staining Method and Protocol on Paraffin Sections. http://www.ihcworld.com/_protocols/special_stains/nissl.htm. Accessed 18 Oct 2017.
131. IHCWORLD Life Science Products & Services. Masson’s Trichrome Staining Protocol for Collagen Fibers. http://www.ihcworld.com/_protocols/special_stains/masson_trichrome.htm. Accessed 18 Oct 2017.
132. SIGMA Product Information Sudan III. https://www.sigmaaldrich.com/content/dam/sigma-aldrich/docs/Sigma/Product_Information_Sheet/1/s4131pis.pdf. Accessed 18 Oct 2017.
133. LaboratoryInfo.com. Periodic Acid Schiff (PAS) Staining Technique For Carbohydrates. http://laboratoryinfo.com/periodic-acid-schiff-pas-staining-technique-for-carbohydrates/. Accessed 18 Oct 2017.
134. DeFelipe J, Fariñas I. The pyramidal neuron of the cerebral cortex: morphological and chemical characteristics of the synaptic inputs. Prog Neurobiol. 1992;39:563–607.
135. Markram H, Toledo-Rodriguez M, Wang Y, Gupta A, Silberberg G, Wu C. Interneurons of the neocortical inhibitory system. Nat Rev Neurosci. 2004;5:793–807.
136. Kita Y, Kawakami K, Takahashi Y, Murakami F. Development of cerebellar neurons and glias revealed by in utero electroporation: Golgi-like labeling of cerebellar neurons and glias.

161
PLoS One. 2013;8:e70091.
137. Franklin KBJ, Paxinos G. The Mouse Brain in Stereotaxic Coordinates. 4th Editio. Sydney: Academic Press; 2012.
138. Allen Institute. Allen Reference Atlases. http://atlas.brain-map.org/. Accessed 1 Nov 2017.
139. Prut L, Belzung C. The open field as a paradigm to measure the effects of drugs on anxiety-like behaviors: a review. Eur J Pharmacol. 2003;463:3–33.
140. Leger M, Quiedeville A, Bouet V, Boulouard M, Schumann-Bard P, Freret T. Object recognition test in mice. Nat Protoc. 2013;8:2531–7.
141. Ennaceur A, Delacour J. A new one-trial test for neurobiological studies of memory in rats. 1: Behavioral data. Behav Brain Res. 1988;31:47–59.
142. Antunes M, Biala G. The novel object recognition memory: neurobiology, test procedure, and its modifications. Cogn Process. 2012;13:93–110.
143. Morris RG, Garrud P, Rawlins JN, O’Keefe J. Place navigation impaired in rats with hippocampal lesions. Nature. 1982;297:681–3.
144. Nunez J. Morris Water Maze Experiment. J Vis Exp. 2008.
145. Gouras GK, Tampellini D, Takahashi RH, Capetillo-Zarate E. Intraneuronal β-amyloid accumulation and synapse pathology in Alzheimer’s disease. Acta Neuropathol. 2010;119:523–41.
146. Oakley H, Cole SL, Logan S, Maus E, Shao P, Craft J, et al. Intraneuronal beta-amyloid aggregates, neurodegeneration, and neuron loss in transgenic mice with five familial Alzheimer’s disease mutations: potential factors in amyloid plaque formation. J Neurosci. 2006;26:10129–40.
147. Eimer WA, Vassar R. Neuron loss in the 5XFAD mouse model of Alzheimer’s disease correlates with intraneuronal Aβ42 accumulation and Caspase-3 activation. Mol Neurodegener. 2013;8:2.
148. Langui D, Girardot N, El Hachimi KH, Allinquant B, Blanchard V, Pradier L, et al. Subcellular topography of neuronal Abeta peptide in APPxPS1 transgenic mice. Am J Pathol. 2004;165:1465–77.
149. Morrison JH, Hof PR. Life and Death of Neurons in the Aging Brain. Science (80- ). 1997;278:412–9.
150. Bayer TA, Wirths O. Intracellular accumulation of amyloid-Beta - a predictor for synaptic dysfunction and neuron loss in Alzheimer’s disease. Front Aging Neurosci. 2010;2:8.
151. Esquerda-Canals G, Marti J, Rivera-Hernández G, Giménez-Llort L, Villegas S. Loss of deep cerebellar nuclei neurons in the 3xTg-AD mice and protection by an anti-amyloid β antibody fragment. MAbs. 2013;5:660–4.
152. Wirths O, Dins A, Bayer TA. AβPP accumulation and/or intraneuronal amyloid-β accumulation? The 3xTg-AD mouse model revisited. J Alzheimers Dis. 2012;28:897–904.
153. Horikoshi Y, Sakaguchi G, Becker AG, Gray AJ, Duff K, Aisen PS, et al. Development of Abeta terminal end-specific antibodies and sensitive ELISA for Abeta variant. Biochem Biophys Res Commun. 2004;319:733–7.
154. Winton MJ, Lee EB, Sun E, Wong MM, Leight S, Zhang B, et al. Intraneuronal APP, not free

162
Aβ peptides in 3xTg-AD mice: implications for tau versus Aβ-mediated Alzheimer neurodegeneration. J Neurosci. 2011;31:7691–9.
155. Soejima N, Ohyagi Y, Nakamura N, Himeno E, Iinuma KM, Sakae N, et al. Intracellular accumulation of toxic turn amyloid-β is associated with endoplasmic reticulum stress in Alzheimer’s disease. Curr Alzheimer Res. 2013;10:11–20.
156. Youmans KL, Tai LM, Kanekiyo T, Stine WB, Michon S-C, Nwabuisi-Heath E, et al. Intraneuronal Aβ detection in 5xFAD mice by a new Aβ-specific antibody. Mol Neurodegener. 2012;7:8.
157. Rasool S, Martinez-Coria H, Wu JW, LaFerla F, Glabe CG. Systemic vaccination with anti-oligomeric monoclonal antibodies improves cognitive function by reducing Aβ deposition and tau pathology in 3xTg-AD mice. J Neurochem. 2013;126:473–82.
158. Guzmán EA, Bouter Y, Richard BC, Lannfelt L, Ingelsson M, Paetau A, et al. Abundance of Aβ₅-x like immunoreactivity in transgenic 5XFAD, APP/PS1KI and 3xTG mice, sporadic and familial Alzheimer’s disease. Mol Neurodegener. 2014;9:13.
159. Ji L, Zhao X, Lu W, Zhang Q, Hua Z. Intracellular Aβ and its Pathological Role in Alzheimer’s Disease: Lessons from Cellular to Animal Models. Curr Alzheimer Res. 2016;13:621–30.
160. Montoliu-Gaya L, Martínez JC, Villegas S. Understanding the contribution of disulphide bridges to the folding and misfolding of an anti-Aβ scFv. Protein Sci. 2017.
161. Bard F, Cannon C, Barbour R, Burke RL, Games D, Grajeda H, et al. Peripherally administered antibodies against amyloid beta-peptide enter the central nervous system and reduce pathology in a mouse model of Alzheimer disease. Nat Med. 2000;6:916–9.
162. Bouter Y, Lopez Noguerola JS, Tucholla P, Crespi GAN, Parker MW, Wiltfang J, et al. Abeta targets of the biosimilar antibodies of Bapineuzumab, Crenezumab, Solanezumab in comparison to an antibody against N‑truncated Abeta in sporadic Alzheimer disease cases and mouse models. Acta Neuropathol. 2015;130:713–29.
163. Aho L, Pikkarainen M, Hiltunen M, Leinonen V, Alafuzoff I. Immunohistochemical visualization of amyloid-beta protein precursor and amyloid-beta in extra- and intracellular compartments in the human brain. J Alzheimers Dis. 2010;20:1015–28.
164. LaFerla FM, Green KN, Oddo S. Intracellular amyloid-beta in Alzheimer’s disease. Nat Rev Neurosci. 2007;8:499–509.
165. Oka S, Leon J, Sakumi K, Ide T, Kang D, LaFerla FM, et al. Human mitochondrial transcriptional factor A breaks the mitochondria-mediated vicious cycle in Alzheimer’s disease. Sci Rep. 2016;6:37889.
166. Gyure KA, Durham R, Stewart WF, Smialek JE, Troncoso JC. Intraneuronal abeta-amyloid precedes development of amyloid plaques in Down syndrome. Arch Pathol Lab Med. 2001;125:489–92.
167. Lott IT, Head E, Doran E, Busciglio J. Beta-amyloid, oxidative stress and down syndrome. Curr Alzheimer Res. 2006;3:521–8.
168. Hane FT, Lee BY, Leonenko Z. Recent Progress in Alzheimer’s Disease Research, Part 1: Pathology. J Alzheimer’s Dis. 2017;57:1–28.
169. Price JL, Ko AI, Wade MJ, Tsou SK, McKeel DW, Morris JC. Neuron number in the entorhinal cortex and CA1 in preclinical Alzheimer disease. Arch Neurol. 2001;58:1395–402.
163
170. Rössler M, Zarski R, Bohl J, Ohm T. Stage-dependent and sector-specific neuronal loss in hippocampus during Alzheimer’s disease. Acta Neuropathol. 2002;103:363–9.
171. West MJ, Kawas CH, Stewart WF, Rudow GL, Troncoso JC. Hippocampal neurons in pre-clinical Alzheimer’s disease. Neurobiol Aging. 2004;25:1205–12.
172. Gómez-Isla T, Price JL, McKeel DW, Morris JC, Growdon JH, Hyman BT. Profound loss of layer II entorhinal cortex neurons occurs in very mild Alzheimer’s disease. J Neurosci. 1996;16:4491–500.
173. Casas C, Sergeant N, Itier J-M, Blanchard V, Wirths O, van der Kolk N, et al. Massive CA1/2 neuronal loss with intraneuronal and N-terminal truncated Abeta42 accumulation in a novel Alzheimer transgenic model. Am J Pathol. 2004;165:1289–300.
174. LaFerla FM, Oddo S. Alzheimer’s disease: Aβ, tau and synaptic dysfunction. Trends Mol Med. 2005;11:170–6.
175. Lomoio S, López-González I, Aso E, Carmona M, Torrejón-Escribano B, Scherini E, et al. Cerebellar Amyloid-β Plaques: Disturbed Cortical Circuitry in AβPP/PS1 Transgenic Mice as a Model of Familial Alzheimer’s Disease. J Alzheimer’s Dis. 2012;31:285–300.
176. Brasnjevic I, Lardenoije R, Schmitz C, Kolk N, Dickstein D, Takahashi H, et al. Region-specific neuron and synapse loss in the hippocampus of APPSL/PS1 knock-in mice. Transl Neurosci. 2013;4:8–19.
177. Bittner T, Fuhrmann M, Burgold S, Ochs SM, Hoffmann N, Mitteregger G, et al. Multiple events lead to dendritic spine loss in triple transgenic Alzheimer’s disease mice. PLoS One. 2010;5:e15477.
178. Schaeffer EL, Catanozi S, West MJ, Gattaz WF. Stereological investigation of the CA1 pyramidal cell layer in untreated and lithium-treated 3xTg-AD and wild-type mice. Ann Anat - Anat Anzeiger. 2017;209:51–60.
179. Tseng BP, Kitazawa M, LaFerla FM. Amyloid beta-peptide: the inside story. Curr Alzheimer Res. 2004;1:231–9.
180. Lipton SA, Rezaie T, Nutter A, Lopez KM, Parker J, Kosaka K, et al. Therapeutic advantage of pro-electrophilic drugs to activate the Nrf2/ARE pathway in Alzheimer’s disease models. Cell Death Dis. 2016;7:e2499.
181. Kanekiyo T, Xu H, Bu G. ApoE and Aβ in Alzheimer’s disease: accidental encounters or partners? Neuron. 2014;81:740–54.
182. Nielsen HM, Mulder SD, Beliën JAM, Musters RJP, Eikelenboom P, Veerhuis R. Astrocytic Aβ1-42 uptake is determined by Aβ-aggregation state and the presence of amyloid-associated proteins. Glia. 2010;:n/a-n/a.
183. Söllvander S, Nikitidou E, Brolin R, Söderberg L, Sehlin D, Lannfelt L, et al. Accumulation of amyloid-β by astrocytes result in enlarged endosomes and microvesicle-induced apoptosis of neurons. Mol Neurodegener. 2016;11:38.
184. Maragakis NJ, Rothstein JD. Mechanisms of Disease: astrocytes in neurodegenerative disease. Nat Clin Pract Neurol. 2006;2:679–89.
185. Sofroniew M V, Vinters H V. Astrocytes: biology and pathology. Acta Neuropathol. 2010;119:7–35.
186. Fuhrmann M, Bittner T, Jung CKE, Burgold S, Page RM, Mitteregger G, et al. Microglial

164
Cx3cr1 knockout prevents neuron loss in a mouse model of Alzheimer’s disease. Nat Neurosci. 2010;13:411–3.
187. Giménez-Llort L, García Y, Buccieri K, Revilla S, Suñol C, Cristofol R, et al. Gender-Specific Neuroimmunoendocrine Response to Treadmill Exercise in 3xTg-AD Mice. Int J Alzheimers Dis. 2010;2010:128354.
188. García-Mesa Y, López-Ramos JC, Giménez-Llort L, Revilla S, Guerra R, Gruart A, et al. Physical exercise protects against Alzheimer’s disease in 3xTg-AD mice. J Alzheimers Dis. 2011;24:421–54.
189. Filali M, Lalonde R, Theriault P, Julien C, Calon F, Planel E. Cognitive and non-cognitive behaviors in the triple transgenic mouse model of Alzheimer’s disease expressing mutated APP, PS1, and Mapt (3xTg-AD). Behav Brain Res. 2012;234:334–42.
190. Fuller JP, Stavenhagen JB, Teeling JL. New roles for Fc receptors in neurodegeneration-the impact on Immunotherapy for Alzheimer’s Disease. Front Neurosci. 2014;8:235.
191. Esquerda-Canals G, Martí-Clúa J, Roda AR, Villegas S. An Intracellular Amyloid-β/AβPP Epitope Correlates with Neurodegeneration in those Neuronal Populations Early Involved in Alzheimer’s Disease. J Alzheimer’s Dis. 2017;:In press.
192. Fuller JP, Stavenhagen JB, Christensen S, Kartberg F, Glennie MJ, Teeling JL. Comparing the efficacy and neuroinflammatory potential of three anti-abeta antibodies. Acta Neuropathol. 2015;130:699–711.
193. Vleming LJ, Baelde JJ, Westendorp RG, Daha MR, van Es LA, Bruijn JA. The glomerular deposition of PAS positive material correlates with renal function in human kidney diseases. Clin Nephrol. 1997;47:158–67.
194. Güell-Bosch J, Montoliu-Gaya L, Esquerda-Canals G, Villegas S. Aβ immunotherapy for Alzheimer’s disease: where are we? Neurodegener Dis Manag. 2016;6:179–81.
195. Montoliu-Gaya L, Villegas S. Aβ-Immunotherapeutic strategies: a wide range of approaches for Alzheimer’s disease treatment. Expert Rev Mol Med. 2016;18:e13.
196. ClinicalTrials.gov. U.S. National Institutes of Health, Bethesda. 1988. https://clinicaltrials.gov/. Accessed 3 Feb 2015.
197. Wisniewski T, Goñi F. Immunotherapy for Alzheimer’s disease. Biochem Pharmacol. 2014;88:499–507.
198. Fernandez-Funez P, Zhang Y, Sanchez-Garcia J, de Mena L, Khare S, Golde TE, et al. Anti-Aβ single-chain variable fragment antibodies exert synergistic neuroprotective activities in Drosophila models of Alzheimer’s disease. Hum Mol Genet. 2015;24:6093–105.
199. Antonios G, Borgers H, Richard BC, Brauß A, Meißner J, Weggen S, et al. Alzheimer therapy with an antibody against N-terminal Abeta 4-X and pyroglutamate Abeta 3-X. Sci Rep. 2015;5:17338.
200. Dai C, Chen X, Kazim SF, Liu F, Gong C-X, Grundke-Iqbal I, et al. Passive immunization targeting the N-terminal projection domain of tau decreases tau pathology and improves cognition in a transgenic mouse model of Alzheimer disease and tauopathies. J Neural Transm. 2015;122:607–17.
201. Petrushina I, Davtyan H, Hovakimyan A, Davtyan A, Passos GF, Cribbs DH, et al. Comparison of Efficacy of Preventive and Therapeutic Vaccines Targeting the N Terminus of β-Amyloid in an Animal Model of Alzheimer’s Disease. Mol Ther. 2017;25:153–64.

165
202. Ryan DA, Mastrangelo MA, Narrow WC, Sullivan MA, Federoff HJ, Bowers WJ. Aβ-directed Single-chain Antibody Delivery Via a Serotype-1 AAV Vector Improves Learning Behavior and Pathology in Alzheimer’s Disease Mice. Mol Ther. 2010;18:1471–81.
203. Marchese M, Cowan D, Head E, Ma D, Karimi K, Ashthorpe V, et al. Autoimmune manifestations in the 3xTg-AD model of Alzheimer’s disease. J Alzheimers Dis. 2014;39:191–210.
204. Birmingham DJ, Hebert LA. CR1 and CR1-like: the primate immune adherence receptors. Immunol Rev. 2001;180:100–11.
205. Hess C, Schifferli JA. Immune adherence revisited: novel players in an old game. News Physiol Sci. 2003;18:104–8.
206. Brubaker WD, Crane A, Johansson JU, Yen K, Garfinkel K, Mastroeni D, et al. Peripheral complement interactions with amyloid β peptide: Erythrocyte clearance mechanisms. Alzheimer’s Dement. 2017.
207. Molina H, Wong W, Kinoshita T, Brenner C, Foley S, Holers VM. Distinct receptor and regulatory properties of recombinant mouse complement receptor 1 (CR1) and Crry, the two genetic homologues of human CR1. J Exp Med. 1992;175:121–9.
208. Crane A, Brubaker WD, Johansson JU, Trigunaite A, Ceballos J, Bradt B, et al. Peripheral complement interactions with amyloid β peptide in Alzheimer’s disease: 2. Relationship to Aβ immunotherapy. Alzheimer’s Dement. 2017.
209. Kamal MA, Tan Y, Seale JP, Qu X. Targeting BuChE-inflammatory Pathway by SK0506 to Manage Type 2 Diabetes and Alzheimer Disease. Neurochem Res. 2009;34:2163–9.
210. Esquerda-Canals G, Roda AR, Martí-Clúa J, Rivera-Hernández G, Villegas S. An anti-Aβ single chain antibody fragment prevents neuronal death and improves behavioral and cognitive impairment in 3xTg-AD mice by reducing intracellular amyloid-β burden. Alzheimers Res Ther.
211. García-Cabezas MÁ, John YJ, Barbas H, Zikopoulos B. Distinction of Neurons, Glia and Endothelial Cells in the Cerebral Cortex: An Algorithm Based on Cytological Features. Front Neuroanat. 2016;10:107.
212. Güell-Bosch J, Esquerda-Canals G, Montoliu-Gaya L, Villegas S. Prospective Therapies for Alzheimer Disease: Biomarkers, Clinical Trials and Preclinical Research. In: Atta-ur-Rahman F, editor. Frontiers in Clinical Drug Research - CNS and Neurological Disorders. Cambridge; 2016. p. Vol.4, 3-80.
213. Montoliu-Gaya L, Villegas S. Aβ-Immunotherapeutic strategies: a wide range of approaches for Alzheimer’s disease treatment. Expert Rev Mol Med. 2016;18:e13.
214. Iwata A, Iwatsubo T. Disease-modifying therapy for Alzheimer’s disease: Challenges and hopes. Neurol Clin Neurosci. 2013;1:49–54.
215. Benet LZ. Pharmacokinetic parameters: which are necessary to define a drug substance? Eur J Respir Dis Suppl. 1984;134:45–61.
216. Das P, Howard V, Loosbrock N, Dickson D, Murphy MP, Golde TE. Amyloid-beta immunization effectively reduces amyloid deposition in FcRgamma-/- knock-out mice. J Neurosci. 2003;23:8532–8.
217. Kou J, Kim H, Pattanayak A, Song M, Lim J-E, Taguchi H, et al. Anti-Amyloid-β Single-Chain Antibody Brain Delivery Via AAV Reduces Amyloid Load But May Increase Cerebral
166
Hemorrhages in an Alzheimer’s Disease Mouse Model. J Alzheimers Dis. 2011;27:23–38.
218. Wang Y-J, Pollard A, Zhong J-H, Dong X-Y, Wu X-B, Zhou H-D, et al. Intramuscular delivery of a single chain antibody gene reduces brain Abeta burden in a mouse model of Alzheimer’s disease. Neurobiol Aging. 2009;30:364–76.
219. Schenk D, Barbour R, Dunn W, Gordon G, Grajeda H, Guido T, et al. Immunization with amyloid-beta attenuates Alzheimer-disease-like pathology in the PDAPP mouse. Nature. 1999;400:173–7.
220. Wilcock DM, Rojiani A, Rosenthal A, Levkowitz G, Subbarao S, Alamed J, et al. Passive amyloid immunotherapy clears amyloid and transiently activates microglia in a transgenic mouse model of amyloid deposition. J Neurosci. 2004;24:6144–51.
221. DeMattos RB, Bales KR, Cummins DJ, Dodart J-C, Paul SM, Holtzman DM. Peripheral anti-A antibody alters CNS and plasma A clearance and decreases brain A burden in a mouse model of Alzheimer’s disease. Proc Natl Acad Sci. 2001;98:8850–5.
222. Robert R, Wark KL. Engineered antibody approaches for Alzheimer’s disease immunotherapy. Arch Biochem Biophys. 2012;526:132–8.
223. Watt AD, Crespi GAN, Down RA, Ascher DB, Gunn A, Perez KA, et al. Do current therapeutic anti-Aβ antibodies for Alzheimer’s disease engage the target? Acta Neuropathol. 2014;127:803–10.
224. Lee G, Cho S, Hoang PM, Kim D, Lee Y, Kil E-J, et al. Therapeutic Strategy for the Prevention of Pseudorabies Virus Infection in C57BL/6 Mice by 3D8 scFv with Intrinsic Nuclease Activity. Mol Cells. 2015;38:773–80.
225. Lai AY, McLaurin J. Mechanisms of amyloid-Beta Peptide uptake by neurons: the role of lipid rafts and lipid raft-associated proteins. Int J Alzheimers Dis. 2010;2011:548380.
226. Parameswaran N, Patial S. Tumor necrosis factor-α signaling in macrophages. Crit Rev Eukaryot Gene Expr. 2010;20:87–103.
227. Janus C, Westaway D. Transgenic mouse models of Alzheimer’s disease. Physiol Behav. 2001;73:873–86.
228. Scheltens NME, Tijms BM, Koene T, Barkhof F, Teunissen CE, Wolfsgruber S, et al. Cognitive subtypes of probable Alzheimer’s disease robustly identified in four cohorts. Alzheimer’s Dement. 2017.
229. Albert MS, DeKosky ST, Dickson D, Dubois B, Feldman HH, Fox NC, et al. The diagnosis of mild cognitive impairment due to Alzheimer’s disease: recommendations from the National Institute on Aging-Alzheimer’s Association workgroups on diagnostic guidelines for Alzheimer’s disease. Alzheimers Dement. 2011;7:270–9.
230. Visser PJ, Vos S, van Rossum I, Scheltens P. Comparison of International Working Group criteria and National Institute on Aging-Alzheimer’s Association criteria for Alzheimer’s disease. Alzheimers Dement. 2012;8:560–3.
231. Carrillo MC, Dean RA, Nicolas F, Miller DS, Berman R, Khachaturian Z, et al. Revisiting the framework of the National Institute on Aging-Alzheimer’s Association diagnostic criteria. Alzheimers Dement. 2013;9:594–601.
232. Piccininni M, Di Carlo A, Baldereschi M, Zaccara G, Inzitari D. Behavioral and Psychological Symptoms in Alzheimer’s Disease: Frequency and Relationship with Duration and Severity of the Disease. Dement Geriatr Cogn Disord. 2005;19:276–81.
167
233. McKhann GM, Knopman DS, Chertkow H, Hyman BT, Jack CR, Kawas CH, et al. The diagnosis of dementia due to Alzheimer’s disease: Recommendations from the National Institute on Aging-Alzheimer’s Association workgroups on diagnostic guidelines for Alzheimer’s disease. Alzheimer’s Dement. 2011;7:263–9.
234. Pietropaolo S, Feldon J, Yee BK. Age-dependent phenotypic characteristics of a triple transgenic mouse model of Alzheimer disease. Behav Neurosci. 2008;122:733–47.
235. Halagappa VKM, Guo Z, Pearson M, Matsuoka Y, Cutler RG, Laferla FM, et al. Intermittent fasting and caloric restriction ameliorate age-related behavioral deficits in the triple-transgenic mouse model of Alzheimer’s disease. Neurobiol Dis. 2007;26:212–20.
236. Pietropaolo S, Sun Y, Li R, Brana C, Feldon J, Yee BK. Limited impact of social isolation on Alzheimer-like symptoms in a triple transgenic mouse model. Behav Neurosci. 2009;123:181–95.
237. Arsenault D, Julien C, Tremblay C, Calon F. DHA improves cognition and prevents dysfunction of entorhinal cortex neurons in 3xTg-AD mice. PLoS One. 2011;6:e17397.
238. Filali M, Lalonde R, Theriault P, Julien C, Calon F, Planel E. Cognitive and non-cognitive behaviors in the triple transgenic mouse model of Alzheimer’s disease expressing mutated APP, PS1, and Mapt (3xTg-AD). Behav Brain Res. 2012;234:334–42.
239. Ojha J, Karmegam R V, Masilamoni JG, Terry A V, Cashikar AG. Behavioral defects in chaperone-deficient Alzheimer’s disease model mice. PLoS One. 2011;6:e16550.
240. Carroll JC, Rosario ER, Chang L, Stanczyk FZ, Oddo S, LaFerla FM, et al. Progesterone and estrogen regulate Alzheimer-like neuropathology in female 3xTg-AD mice. J Neurosci. 2007;27:13357–65.
241. Hebda-Bauer EK, Simmons TA, Sugg A, Ural E, Stewart JA, Beals JL, et al. 3xTg-AD mice exhibit an activated central stress axis during early-stage pathology. J Alzheimers Dis. 2013;33:407–22.
242. Stevens LM, Brown RE. Reference and working memory deficits in the 3xTg-AD mouse between 2 and 15-months of age: A cross-sectional study. Behav Brain Res. 2015;278:496–505.
243. Sterniczuk R, Antle MC, Laferla FM, Dyck RH. Characterization of the 3xTg-AD mouse model of Alzheimer’s disease: part 2. Behavioral and cognitive changes. Brain Res. 2010;1348:149–55.
244. Sperling RA, Aisen PS, Beckett LA, Bennett DA, Craft S, Fagan AM, et al. Toward defining the preclinical stages of Alzheimer’s disease: recommendations from the National Institute on Aging-Alzheimer’s Association workgroups on diagnostic guidelines for Alzheimer’s disease. Alzheimers Dement. 2011;7:280–92.
245. Derek Lowe. Just How Worthless Are the Standard Alzheimer’s Models? http://blogs.sciencemag.org/pipeline/archives/2016/09/23/just-how-worthless-are-the-standard-alzheimers-models. Accessed 7 Nov 2017.
246. McGowan E, Eriksen J, Hutton M. A decade of modeling Alzheimer’s disease in transgenic mice. Trends Genet. 2006;22:281–9.
247. Hall AM, Roberson ED. Mouse models of Alzheimer’s disease. Brain Res Bull. 2012;88:3–12.
248. Campos-Peña V, Antonio M. Alzheimer Disease: The Role of Aβ in the Glutamatergic System. In: Neurochemistry. InTech; 2014.
168
249. España J, Giménez-Llort L, Valero J, Miñano A, Rábano A, Rodriguez-Alvarez J, et al. Intraneuronal β-Amyloid Accumulation in the Amygdala Enhances Fear and Anxiety in Alzheimer’s Disease Transgenic Mice. Biol Psychiatry. 2010;67:513–21.
250. Su F, Bai F, Zhang Z. Inflammatory Cytokines and Alzheimer’s Disease: A Review from the Perspective of Genetic Polymorphisms. Neurosci Bull. 2016;32:469–80.
251. Carriba P, Jimenez S, Navarro V, Moreno-Gonzalez I, Barneda-Zahonero B, Moubarak R, et al. Amyloid-β reduces the expression of neuronal FAIM-L, thereby shifting the inflammatory response mediated by TNFα from neuronal protection to death. 2015;6.
252. Carriba P, Comella JX. Amyloid Beta, TNF?? and FAIM-L; Approaching New Therapeutic Strategies for AD. Front Neurol. 2014;5.
253. Janelsins MC, Mastrangelo MA, Park KM, Sudol KL, Narrow WC, Oddo S, et al. Chronic neuron-specific tumor necrosis factor-alpha expression enhances the local inflammatory environment ultimately leading to neuronal death in 3xTg-AD mice. Am J Pathol. 2008;173:1768–82.
254. Janelsins MC, Mastrangelo MA, Oddo S, LaFerla FM, Federoff HJ, Bowers WJ. Early correlation of microglial activation with enhanced tumor necrosis factor-alpha and monocyte chemoattractant protein-1 expression specifically within the entorhinal cortex of triple transgenic Alzheimer’s disease mice. J Neuroinflammation. 2005;2:23.
255. Cleary JP, Walsh DM, Hofmeister JJ, Shankar GM, Kuskowski MA, Selkoe DJ, et al. Natural oligomers of the amyloid-β protein specifically disrupt cognitive function. Nat Neurosci. 2005;8:79–84.
256. Selkoe DJ. Soluble oligomers of the amyloid β-protein impair synaptic plasticity and behavior. Behav Brain Res. 2008;192:106–13.
257. DeKosky ST, Scheff SW. Synapse loss in frontal cortex biopsies in Alzheimer’s disease: Correlation with cognitive severity. Ann Neurol. 1990;27:457–64.
258. DeKosky ST, Scheff SW, Styren SD. Structural correlates of cognition in dementia: quantification and assessment of synapse change. Neurodegeneration. 1996;5:417–21.
259. Selkoe DJ. Alzheimer’s Disease Is a Synaptic Failure. Science (80- ). 2002;298:789–91.
260. Roselli F, Tirard M, Lu J, Hutzler P, Lamberti P, Livrea P, et al. Soluble -Amyloid1-40 Induces NMDA-Dependent Degradation of Postsynaptic Density-95 at Glutamatergic Synapses. J Neurosci. 2005;25:11061–70.
261. Shankar GM, Bloodgood BL, Townsend M, Walsh DM, Selkoe DJ, Sabatini BL. Natural Oligomers of the Alzheimer Amyloid- Protein Induce Reversible Synapse Loss by Modulating an NMDA-Type Glutamate Receptor-Dependent Signaling Pathway. J Neurosci. 2007;27:2866–75.
262. Geda YE, Schneider LS, Gitlin LN, Miller DS, Smith GS, Bell J, et al. Neuropsychiatric symptoms in Alzheimer’s disease: past progress and anticipation of the future. Alzheimers Dement. 2013;9:602–8.
263. Gatta V, D’Aurora M, Granzotto A, Stuppia L, Sensi SL. Early and sustained altered expression of aging-related genes in young 3xTg-AD mice. Cell Death Dis. 2014;5:e1054.
264. Rodríguez JJ, Verkhratsky A. Neurogenesis in Alzheimer’s disease. J Anat. 2011;219:78–89.
265. Hamilton LK, Aumont A, Julien C, Vadnais A, Calon F, Fernandes KJL. Widespread deficits

169
in adult neurogenesis precede plaque and tangle formation in the 3xTg mouse model of Alzheimer’s disease. Eur J Neurosci. 2010;32:905–20.
266. España J, Giménez-Llort L, Valero J, Miñano A, Rábano A, Rodriguez-Alvarez J, et al. Intraneuronal β-Amyloid Accumulation in the Amygdala Enhances Fear and Anxiety in Alzheimer’s Disease Transgenic Mice. Biol Psychiatry. 2010;67:513–21.
267. Güell-Bosch J. Diagnòstic i monitorització de la malaltia d’Alzheimer mitjançant tècniques de ressonància magnètica in vivo en el model 3xTg-AD: Avaluació de l’eficiència del tractament longitudinal amb dos fragments d’anticòs contra el pèptid beta-amiloide. Universitat Autònoma de Barcelona; 2017.

170

171
SUPPLEMENATARY MATERIAL

172

Supplementary material
173
SUPPLEMENTARY FIGURES
Supplementary Figure 1. Non-alcoholic steatosis in 5-mo-old 3xTg females and hepatic function.
Lipid droplets were observed by the hematoxylin-eosin staining in the hepatic tissue from the 3xTg
mice, and confirmed by Sudan III staining of cryopreserved sections (A). Scale bar, 50 µm. Plasma
levels of AST and ALT are represented as markers of the hepatic function (B). No significant
differences were found (U-test) among groups. NTg/-, untreated non-transgenic mice; NTg/+,
treated non-transgenic mice; 3xTg/-, untreated 3xTg-AD mice; and 3xTg/+, treated 3xTg-AD ones.
Values are represented by medians within box plots and whiskers represent maximum and
minimum values (n=5).
B
A

Supplementary material
174
Supplementary Figure 2. Mean swimming speed in the MWM. The plot represents the mean
swimming speed over the five acquisition stages in 5-, 7- and 9-months-old non-transgenic (NTg, in
green) and triple-transgenic (3xTg, in red) mice. Values are represented by means and error bars
correspond to the SEM. * indicates significant differences with p≤0.05, ** p≤0.01, *** p≤0.001, and
**** p≤0.0001. Swimming speed in each group did not significantly vary over the acquisition stages
in any of the ages tested, but differences were evident between both groups in all the stages.
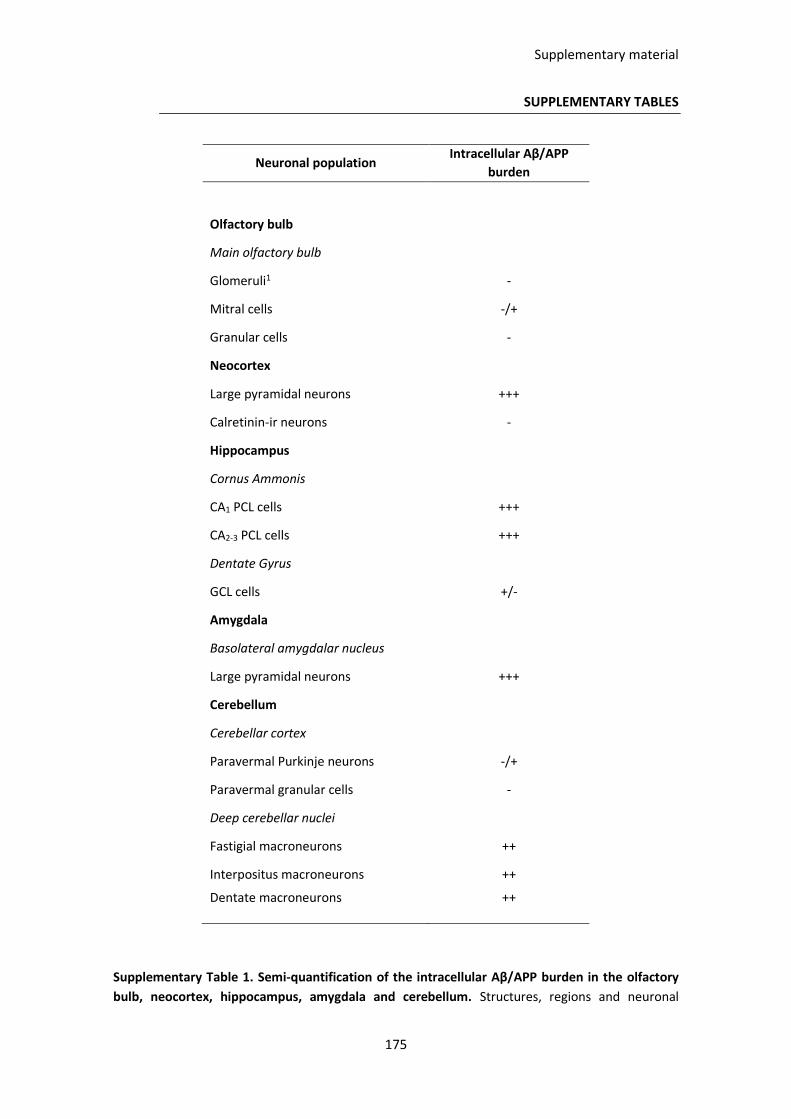
Supplementary material
175
SUPPLEMENTARY TABLES
Neuronal population Intracellular Aβ/APP
burden
Olfactory bulb
Main olfactory bulb
Glomeruli1 -
Mitral cells -/+
Granular cells -
Neocortex
Large pyramidal neurons +++
Calretinin-ir neurons -
Hippocampus
Cornus Ammonis
CA1 PCL cells +++
CA2-3 PCL cells +++
Dentate Gyrus
GCL cells +/-
Amygdala
Basolateral amygdalar nucleus
Large pyramidal neurons +++
Cerebellum
Cerebellar cortex
Paravermal Purkinje neurons -/+
Paravermal granular cells -
Deep cerebellar nuclei
Fastigial macroneurons ++
Interpositus macroneurons ++
Dentate macroneurons ++
Supplementary Table 1. Semi-quantification of the intracellular Aβ/APP burden in the olfactory
bulb, neocortex, hippocampus, amygdala and cerebellum. Structures, regions and neuronal

Supplementary material
176
populations analyzed. CA1 and CA2-3, regions 1 and 2-3, from the Cornus Ammonis. PCL, pyramidal
cells layer. GCL, granular cells layer. The second column contains the intracellular Aβ/APP burden
measured by fluorescent intensity. Symbols represent the different intensity gradients of relative
fluorescent signal: -, no signal; -/+, ambiguous; +, faint; ++, medium; +++, strong intensity.1
Glomeruli is an exception from the neuronal categorization, since it is an interneuronal connection
structure.
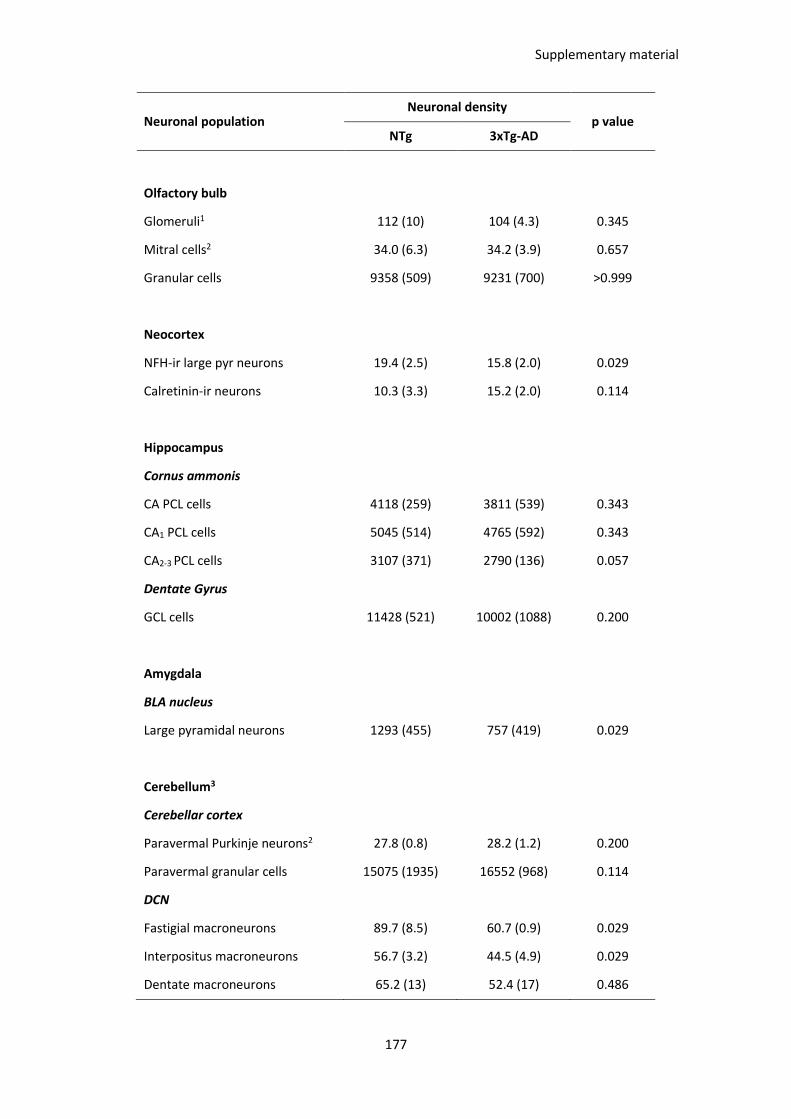
Supplementary material
177
Neuronal population Neuronal density
p value NTg 3xTg-AD
Olfactory bulb
Glomeruli1 112 (10) 104 (4.3) 0.345
Mitral cells2 34.0 (6.3) 34.2 (3.9) 0.657
Granular cells 9358 (509) 9231 (700) >0.999
Neocortex
NFH-ir large pyr neurons 19.4 (2.5) 15.8 (2.0) 0.029
Calretinin-ir neurons 10.3 (3.3) 15.2 (2.0) 0.114
Hippocampus
Cornus ammonis
CA PCL cells 4118 (259) 3811 (539) 0.343
CA1 PCL cells 5045 (514) 4765 (592) 0.343
CA2-3 PCL cells 3107 (371) 2790 (136) 0.057
Dentate Gyrus
GCL cells 11428 (521) 10002 (1088) 0.200
Amygdala
BLA nucleus
Large pyramidal neurons 1293 (455) 757 (419) 0.029
Cerebellum3
Cerebellar cortex
Paravermal Purkinje neurons2 27.8 (0.8) 28.2 (1.2) 0.200
Paravermal granular cells 15075 (1935) 16552 (968) 0.114
DCN
Fastigial macroneurons 89.7 (8.5) 60.7 (0.9) 0.029
Interpositus macroneurons 56.7 (3.2) 44.5 (4.9) 0.029
Dentate macroneurons 65.2 (13) 52.4 (17) 0.486
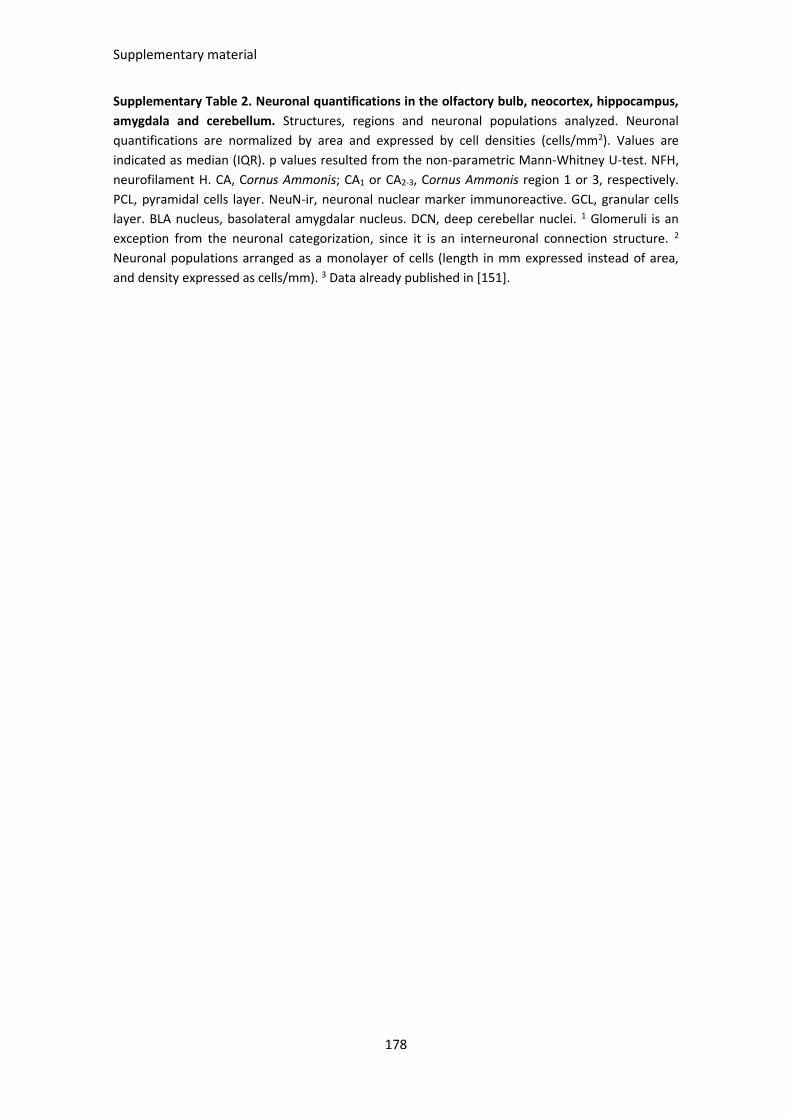
Supplementary material
178
Supplementary Table 2. Neuronal quantifications in the olfactory bulb, neocortex, hippocampus,
amygdala and cerebellum. Structures, regions and neuronal populations analyzed. Neuronal
quantifications are normalized by area and expressed by cell densities (cells/mm2). Values are
indicated as median (IQR). p values resulted from the non-parametric Mann-Whitney U-test. NFH,
neurofilament H. CA, Cornus Ammonis; CA1 or CA2-3, Cornus Ammonis region 1 or 3, respectively.
PCL, pyramidal cells layer. NeuN-ir, neuronal nuclear marker immunoreactive. GCL, granular cells
layer. BLA nucleus, basolateral amygdalar nucleus. DCN, deep cerebellar nuclei. 1 Glomeruli is an
exception from the neuronal categorization, since it is an interneuronal connection structure. 2
Neuronal populations arranged as a monolayer of cells (length in mm expressed instead of area,
and density expressed as cells/mm). 3 Data already published in [151].
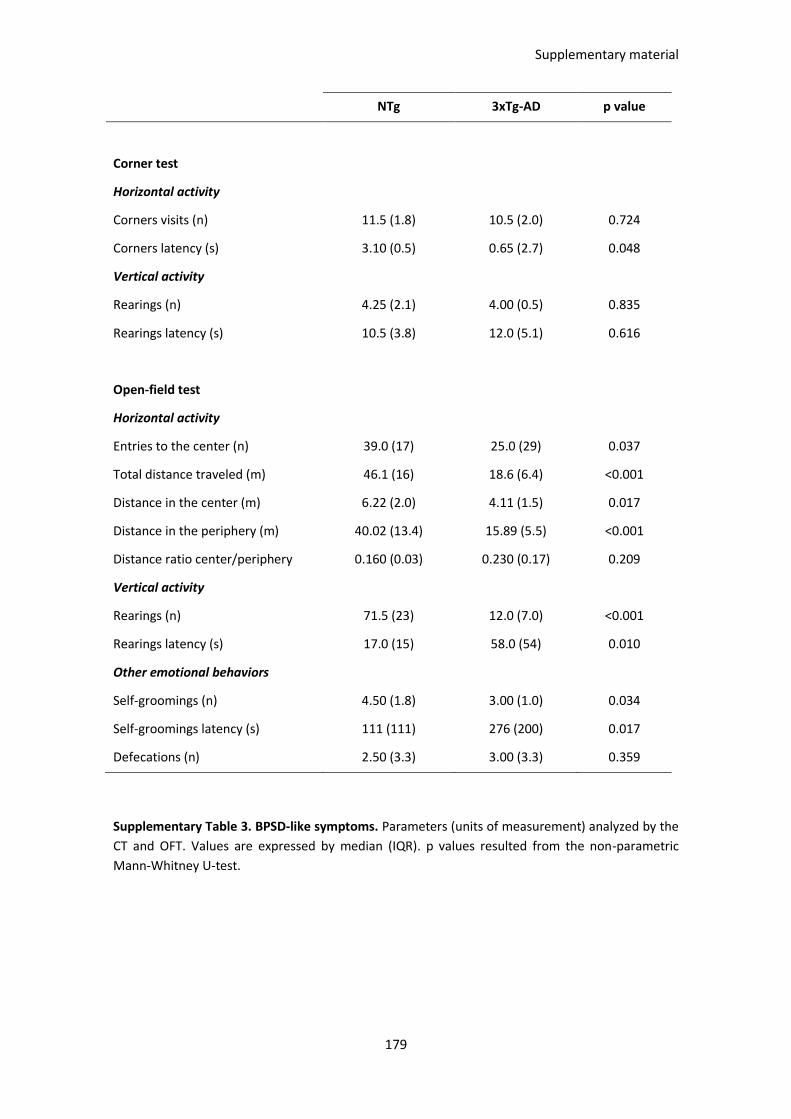
Supplementary material
179
NTg 3xTg-AD p value
Corner test
Horizontal activity
Corners visits (n) 11.5 (1.8) 10.5 (2.0) 0.724
Corners latency (s) 3.10 (0.5) 0.65 (2.7) 0.048
Vertical activity
Rearings (n) 4.25 (2.1) 4.00 (0.5) 0.835
Rearings latency (s) 10.5 (3.8) 12.0 (5.1) 0.616
Open-field test
Horizontal activity
Entries to the center (n) 39.0 (17) 25.0 (29) 0.037
Total distance traveled (m) 46.1 (16) 18.6 (6.4) <0.001
Distance in the center (m) 6.22 (2.0) 4.11 (1.5) 0.017
Distance in the periphery (m) 40.02 (13.4) 15.89 (5.5) <0.001
Distance ratio center/periphery 0.160 (0.03) 0.230 (0.17) 0.209
Vertical activity
Rearings (n) 71.5 (23) 12.0 (7.0) <0.001
Rearings latency (s) 17.0 (15) 58.0 (54) 0.010
Other emotional behaviors
Self-groomings (n) 4.50 (1.8) 3.00 (1.0) 0.034
Self-groomings latency (s) 111 (111) 276 (200) 0.017
Defecations (n) 2.50 (3.3) 3.00 (3.3) 0.359
Supplementary Table 3. BPSD-like symptoms. Parameters (units of measurement) analyzed by the
CT and OFT. Values are expressed by median (IQR). p values resulted from the non-parametric
Mann-Whitney U-test.
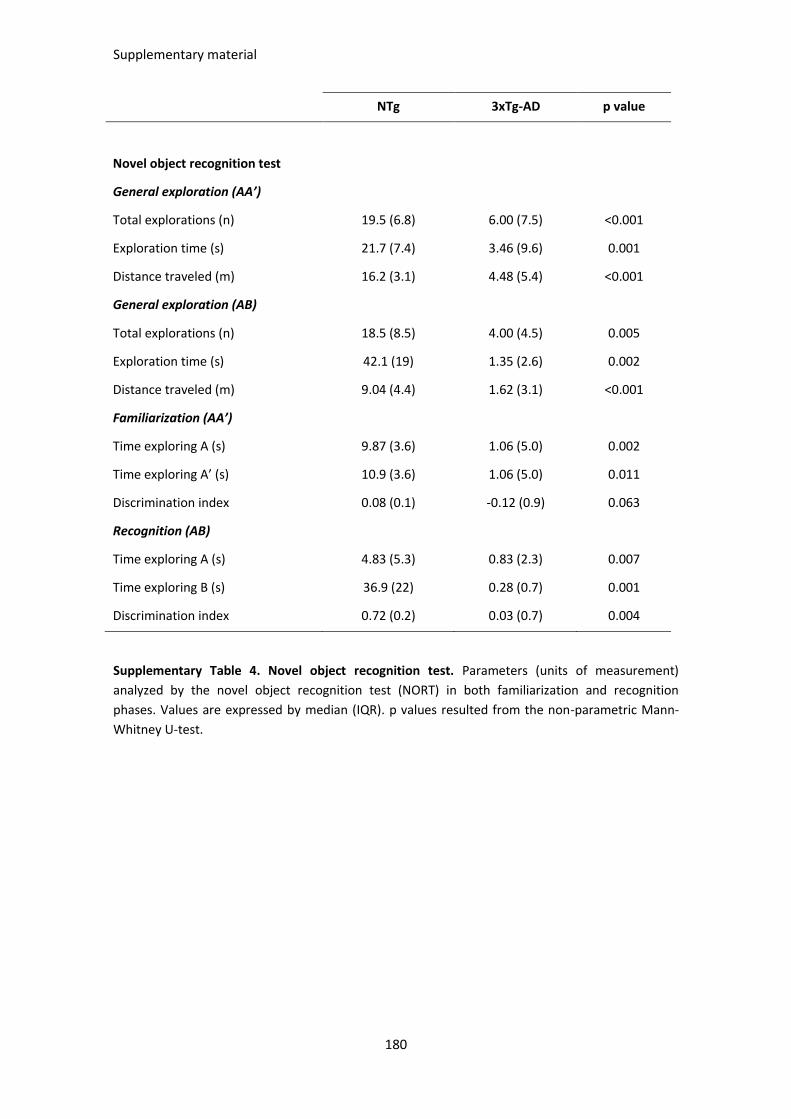
Supplementary material
180
NTg 3xTg-AD p value
Novel object recognition test
General exploration (AA’)
Total explorations (n) 19.5 (6.8) 6.00 (7.5) <0.001
Exploration time (s) 21.7 (7.4) 3.46 (9.6) 0.001
Distance traveled (m) 16.2 (3.1) 4.48 (5.4) <0.001
General exploration (AB)
Total explorations (n) 18.5 (8.5) 4.00 (4.5) 0.005
Exploration time (s) 42.1 (19) 1.35 (2.6) 0.002
Distance traveled (m) 9.04 (4.4) 1.62 (3.1) <0.001
Familiarization (AA’)
Time exploring A (s) 9.87 (3.6) 1.06 (5.0) 0.002
Time exploring A’ (s) 10.9 (3.6) 1.06 (5.0) 0.011
Discrimination index 0.08 (0.1) -0.12 (0.9) 0.063
Recognition (AB)
Time exploring A (s) 4.83 (5.3) 0.83 (2.3) 0.007
Time exploring B (s) 36.9 (22) 0.28 (0.7) 0.001
Discrimination index 0.72 (0.2) 0.03 (0.7) 0.004
Supplementary Table 4. Novel object recognition test. Parameters (units of measurement)
analyzed by the novel object recognition test (NORT) in both familiarization and recognition
phases. Values are expressed by median (IQR). p values resulted from the non-parametric Mann-
Whitney U-test.
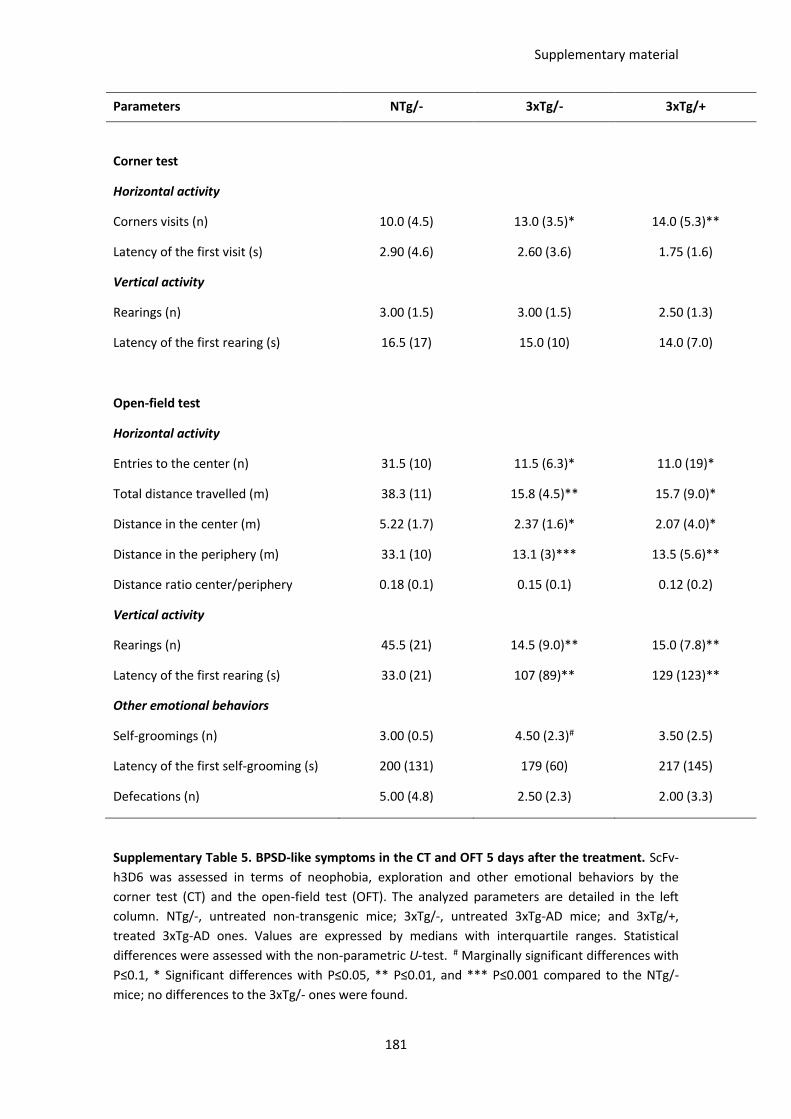
Supplementary material
181
Parameters NTg/- 3xTg/- 3xTg/+
Corner test
Horizontal activity
Corners visits (n) 10.0 (4.5) 13.0 (3.5)* 14.0 (5.3)**
Latency of the first visit (s) 2.90 (4.6) 2.60 (3.6) 1.75 (1.6)
Vertical activity
Rearings (n) 3.00 (1.5) 3.00 (1.5) 2.50 (1.3)
Latency of the first rearing (s) 16.5 (17) 15.0 (10) 14.0 (7.0)
Open-field test
Horizontal activity
Entries to the center (n) 31.5 (10) 11.5 (6.3)* 11.0 (19)*
Total distance travelled (m) 38.3 (11) 15.8 (4.5)** 15.7 (9.0)*
Distance in the center (m) 5.22 (1.7) 2.37 (1.6)* 2.07 (4.0)*
Distance in the periphery (m) 33.1 (10) 13.1 (3)*** 13.5 (5.6)**
Distance ratio center/periphery 0.18 (0.1) 0.15 (0.1) 0.12 (0.2)
Vertical activity
Rearings (n) 45.5 (21) 14.5 (9.0)** 15.0 (7.8)**
Latency of the first rearing (s) 33.0 (21) 107 (89)** 129 (123)**
Other emotional behaviors
Self-groomings (n) 3.00 (0.5) 4.50 (2.3)# 3.50 (2.5)
Latency of the first self-grooming (s) 200 (131) 179 (60) 217 (145)
Defecations (n) 5.00 (4.8) 2.50 (2.3) 2.00 (3.3)
Supplementary Table 5. BPSD-like symptoms in the CT and OFT 5 days after the treatment. ScFv-
h3D6 was assessed in terms of neophobia, exploration and other emotional behaviors by the
corner test (CT) and the open-field test (OFT). The analyzed parameters are detailed in the left
column. NTg/-, untreated non-transgenic mice; 3xTg/-, untreated 3xTg-AD mice; and 3xTg/+,
treated 3xTg-AD ones. Values are expressed by medians with interquartile ranges. Statistical
differences were assessed with the non-parametric U-test. # Marginally significant differences with
P≤0.1, * Significant differences with P≤0.05, ** P≤0.01, and *** P≤0.001 compared to the NTg/-
mice; no differences to the 3xTg/- ones were found.
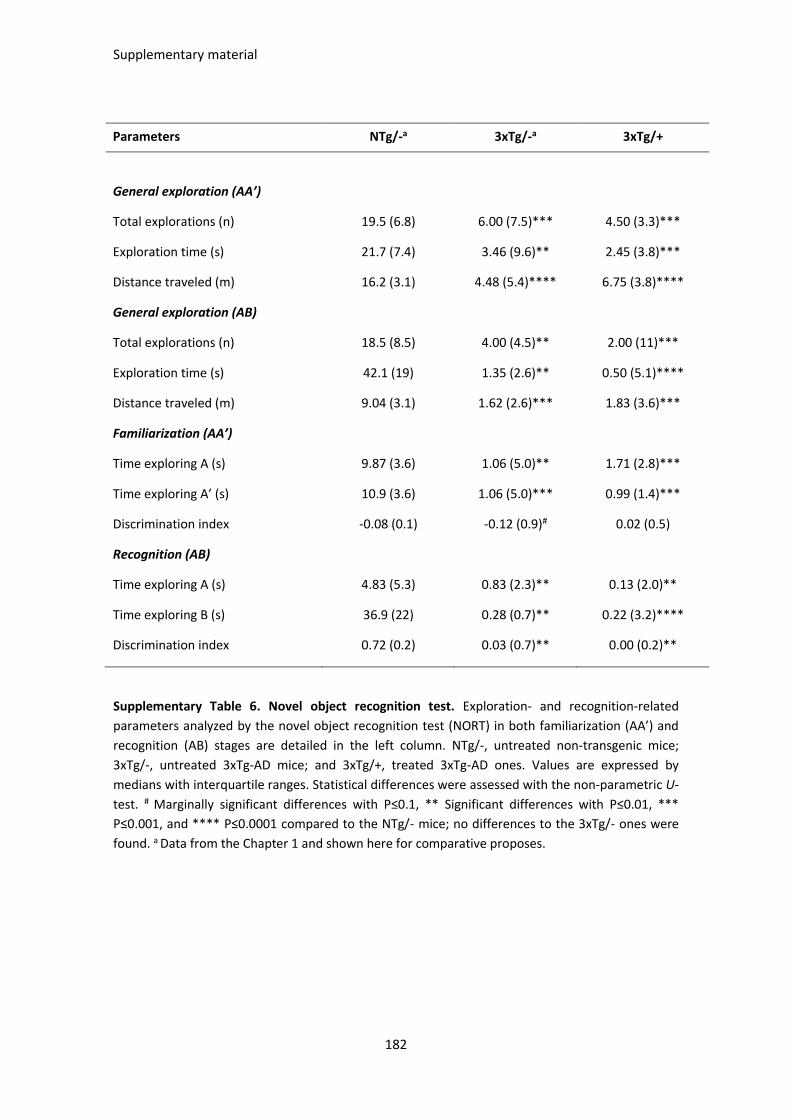
Supplementary material
182
Parameters NTg/-a 3xTg/-a 3xTg/+
General exploration (AA’)
Total explorations (n) 19.5 (6.8) 6.00 (7.5)*** 4.50 (3.3)***
Exploration time (s) 21.7 (7.4) 3.46 (9.6)** 2.45 (3.8)***
Distance traveled (m) 16.2 (3.1) 4.48 (5.4)**** 6.75 (3.8)****
General exploration (AB)
Total explorations (n) 18.5 (8.5) 4.00 (4.5)** 2.00 (11)***
Exploration time (s) 42.1 (19) 1.35 (2.6)** 0.50 (5.1)****
Distance traveled (m) 9.04 (3.1) 1.62 (2.6)*** 1.83 (3.6)***
Familiarization (AA’)
Time exploring A (s) 9.87 (3.6) 1.06 (5.0)** 1.71 (2.8)***
Time exploring A’ (s) 10.9 (3.6) 1.06 (5.0)*** 0.99 (1.4)***
Discrimination index -0.08 (0.1) -0.12 (0.9)# 0.02 (0.5)
Recognition (AB)
Time exploring A (s) 4.83 (5.3) 0.83 (2.3)** 0.13 (2.0)**
Time exploring B (s) 36.9 (22) 0.28 (0.7)** 0.22 (3.2)****
Discrimination index 0.72 (0.2) 0.03 (0.7)** 0.00 (0.2)**
Supplementary Table 6. Novel object recognition test. Exploration- and recognition-related
parameters analyzed by the novel object recognition test (NORT) in both familiarization (AA’) and
recognition (AB) stages are detailed in the left column. NTg/-, untreated non-transgenic mice;
3xTg/-, untreated 3xTg-AD mice; and 3xTg/+, treated 3xTg-AD ones. Values are expressed by
medians with interquartile ranges. Statistical differences were assessed with the non-parametric U-
test. # Marginally significant differences with P≤0.1, ** Significant differences with P≤0.01, ***
P≤0.001, and **** P≤0.0001 compared to the NTg/- mice; no differences to the 3xTg/- ones were
found. a Data from the Chapter 1 and shown here for comparative proposes.

183
NTg/- 3xTg/- 3xTg/WT 3xTg/EL
Horizontal activity Distance traveled (m) 5-mo-old 1.53 ± 0.14 1.90 ± 0.15#A 2.29 ± 0.20**A 2.06 ± 0.23 7-mo-old 0.96 ± 0.06 0.51 ± 0.11*A 0.56 ± 0.16#A 1.09 ± 0.18*B;#C 9-mo-old 0.50 ± 0.13 0.49 ± 0.16 0.49 ± 0.13 0.65 ± 0.14 Corner visits (n) 5-mo-old 11.00 ± 0.68 10.80 ± 0.77 12.10 ± 1.08 10.00 ± 1.01 7-mo-old 6.50 ± 0.37 2.4 ± 0.69***A 3.10 ± 0.88**A 4.80 ± 1.12 9-mo-old 5.20 ± 0.85 2.63 ± 0.58*A 2.70 ± 0.65*A 3.80 ± 0.81 Corner latency (s) 5-mo-old 3.37 ± 0.63 1.76 ± 0.75*A 1.15 ± 0.41**A 3.62 ± 1.08 7-mo-old 1.95 ± 0.43 10.67 ± 3.64 10.67 ± 3.77 3.99 ± 1.56#C 9-mo-old 1.94 ± 0.67 5.50 ± 2.43 4.88 ± 2.39 7.39 ± 3.53 Time in the corner (s) 5-mo-old 10.56 ± 0.66 10.25 ± 1.12 9.26 ± 1.17 7.64 ± 0.65**A;#B 7-mo-old 10.52 ± 1.08 5.99 ± 1.78 4.70 ± 1.43**A 7.98 ± 1.59 9-mo-old 9.08 ± 1.77 8.20 ± 2.93 7.71 ± 1.86 6.95 ± 1.68 Vertical activity Rearings (n) 5-mo-old 4.15 ± 0.49 4.20 ± 0.51 3.70 ± 0.83 3.85 ± 0.48 7-mo-old 4.00 ± 0.45 2.67 ± 1.01#A 1.00 ± 0.33***A 2.60 ± 1.07 9-mo-old 2.80 ± 0.89 0.38 ± 0.24*A 0.40 ± 0.16*A 1.30 ± 0.50#B 1st rearing latency (s) 5-mo-old 0.13 ± 0.02 0.13 ± 0.02 0.12 ±0.03 0.14 ± 0.02 7-mo-old 7.30 ± 1.24 18.00 ± 3.72 23.00 ± 2.53***A 21.30 ± 3.26**A 9-mo-old 12.30 ± 3.18 25.88 ± 2.43**A 25.40 ± 2.76*A 22.40 ± 2.96#A Other emotional behaviors
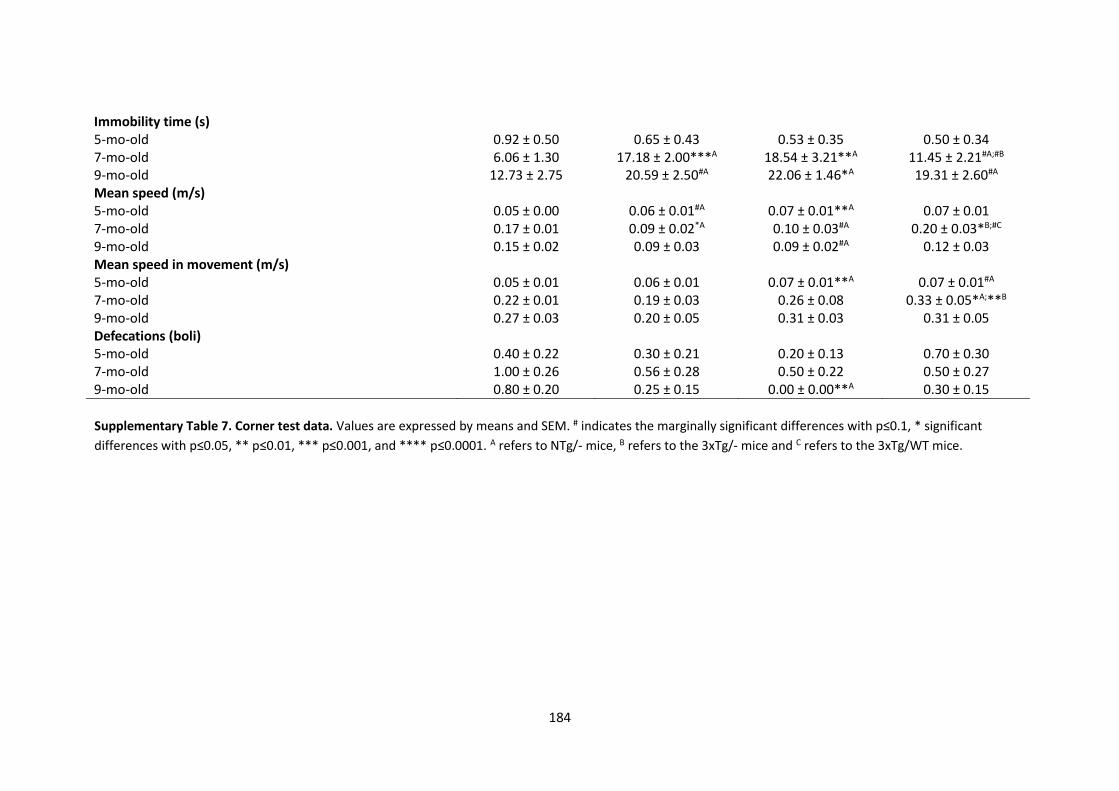
184
Immobility time (s) 5-mo-old 0.92 ± 0.50 0.65 ± 0.43 0.53 ± 0.35 0.50 ± 0.34 7-mo-old 6.06 ± 1.30 17.18 ± 2.00***A 18.54 ± 3.21**A 11.45 ± 2.21#A;#B 9-mo-old 12.73 ± 2.75 20.59 ± 2.50#A 22.06 ± 1.46*A 19.31 ± 2.60#A Mean speed (m/s) 5-mo-old 0.05 ± 0.00 0.06 ± 0.01#A 0.07 ± 0.01**A 0.07 ± 0.01 7-mo-old 0.17 ± 0.01 0.09 ± 0.02*A 0.10 ± 0.03#A 0.20 ± 0.03*B;#C 9-mo-old 0.15 ± 0.02 0.09 ± 0.03 0.09 ± 0.02#A 0.12 ± 0.03 Mean speed in movement (m/s) 5-mo-old 0.05 ± 0.01 0.06 ± 0.01 0.07 ± 0.01**A 0.07 ± 0.01#A 7-mo-old 0.22 ± 0.01 0.19 ± 0.03 0.26 ± 0.08 0.33 ± 0.05*A;**B 9-mo-old 0.27 ± 0.03 0.20 ± 0.05 0.31 ± 0.03 0.31 ± 0.05 Defecations (boli) 5-mo-old 0.40 ± 0.22 0.30 ± 0.21 0.20 ± 0.13 0.70 ± 0.30 7-mo-old 1.00 ± 0.26 0.56 ± 0.28 0.50 ± 0.22 0.50 ± 0.27 9-mo-old 0.80 ± 0.20 0.25 ± 0.15 0.00 ± 0.00**A 0.30 ± 0.15
Supplementary Table 7. Corner test data. Values are expressed by means and SEM. # indicates the marginally significant differences with p≤0.1, * significant
differences with p≤0.05, ** p≤0.01, *** p≤0.001, and **** p≤0.0001. A refers to NTg/- mice, B refers to the 3xTg/- mice and C refers to the 3xTg/WT mice.

185
NTg/- 3xTg/- 3xTg/WT 3xTg/EL
Horizontal activity
Total distance traveled (m)
5-mo-old 46.87 ± 3.54 19.36 ± 2.79****A 24.30 ± 2.88***A 35.55 ± 8.75**A;#B
7-mo-old 22.49 ± 2.88 12.94 ± 3.75*A 9.23 ± 1.82***A 13.90 ± 3.21*A
9-mo-old 17.54 ± 3.07 10.43 ± 2.05 12.74 ± 2.75 14.26 ± 2.33
Entries to the center (n)
5-mo-old 41.70 ± 5.32 23.50 ± 4.92*A 26.60 ± 5.73#A 39.20 ± 9.28
7-mo-old 22.00 ± 2.77 13.20 ± 4.86*A 12.3 ± 3.81*A 20.8 ± 4.59
9-mo-old 15.6 ± 2.76 15.25 ± 4.64 14.10 ± 4.29 15.4 ± 4.10*A;* C
Distance in the center (m)
5-mo-old 6.61 ± 0.58 3.68 ± 0.73**A 4.02 ± 0.88*A 6.39 ± 1.70
7-mo-old 2.85 ± 0.45 2.10 ± 0.82#A 1.57 ± 0.52*A 2.91 ± 0.78
9-mo-old 1.93 ± 0.31 1.58 ± 0.45 1.91 ± 0.58 2.26 ± 0.59
Distance in the periphery (m)
5-mo-old 40.26 ± 3.08 15.49 ± 2.20****A 20.29 ± 2.34***A 29.16 ± 7.15**A;*B
7-mo-old 19.65 ± 2.52 10.83 ± 3.06 7.66 ± 1.32 10.99 ± 2.54*A;* C
9-mo-old 15.61 ± 2.82 8.86 ± 1.61 10.84 ± 2.22 12.00 ± 1.78
Ratio center/periphery (dist)
5-mo-old 0.17 ± 0.01 0.24 ± 0.04 0.20 ± 0.03 0.21 ± 0.02
7-mo-old 0.15 ± 0.01 0.23 ± 0.05 0.17 ± 0.03 0.25 ± 0.5
9-mo-old 0.13 ± 0.02 0.15 ± 0.03 0.16 ± 0.03 0.17 ± 0.02
Time in the center (s)
5-mo-old 76.75 ± 9.03 93.07 ± 23.87 75.20 ± 17.30 90.31 ± 32.33
7-mo-old 50.66 ± 7.40 159.5 ± 46.4 52.46 ± 17.91 179.3 ± 49.20*A;* C

186
9-mo-old 38.99 ± 7.74 57.98 ± 25.95 68.30 ± 23.00 87.35 ± 30.06
Time in the periphery (s)
5-mo-old 823.3 ± 9.04 723.2 ± 78.2 824.7 ± 17.3 809.6 ± 32.3
7-mo-old 849.3 ± 7.39 740.2 ± 46.34*A 847.5 ± 17.9***A 702.7 ± 49.1**A
9-mo-old 861.01 ± 7.73 841.98 ± 25.94 831.7 ± 23.0 812.56 ± 30.06
Ratio center/periphery (time)
5-mo-old 0.09 ± 0.01 0.15 ± 0.04 0.10 ± 0.02 0.13 ± 0.06#A
7-mo-old 0.06 ± 0.01 0.27 ± 0.10 0.07 ± 0.02 0.25 ± 0.12*A;* C
9-mo-old 0.05 ± 0.01 0.08 ± 0.04 0.09 ± 0.03 0.12 ± 0.05
Vertical activity
Rearings (n)
5-mo-old 73.20 ± 6.28 14.78 ± 3.22****A 14.50 ± 2.25****A 17.90 ± 3.03****A
7-mo-old 35.60 ± 7.26 6.60 ± 1.75****A 3.80 ± 0.89****A 5.70 ± 1.40****A
9-mo-old 26.50 ± 6.36 3.57 ± 1.09**A 5.10 ± 1.33**A 6.30 ± .71*A
1st rearing latency (s)
5-mo-old 18.70 ± 3.10 64.89 ± 13.50*A 54.40 ± 14.48#A 26.30 ± 6.74*B;#C
7-mo-old 18.20 ± 4.36 360.9 ± 124.8***A 243.3 ± 57.1****A 181.8 ±43.9***A
9-mo-old 123.4 ± 87.7 269.1 ± 48.9*A 314.9 ± 105.1*A 140.9 ± 25.4*A
Other emotional behaviors
Immobility time (s)
5-mo-old 116.8 ± 38.44 304.95 ± 84.19 215.27 ± 88.67 281.94 ± 85.62
7-mo-old 229.41 ± 80.38 459.06 ± 107.27 310.07 ± 127.14 344.58 ± 116.60
9-mo-old 364.31 ± 108.38 285.86 ± 125.45 525.6 ± 115.84 281.23 ± 117.79
Mean speed
5-mo-old 0.05 ± 0.00 0.02 ± 0.00****A 0.03 ± 0.00***A 0.04 ± 0.01*A;#B
7-mo-old 0.03 ±0.00 0.01 ± 0.00*A 0.01 ± 0.00***A 0.02 ± 0.00*A
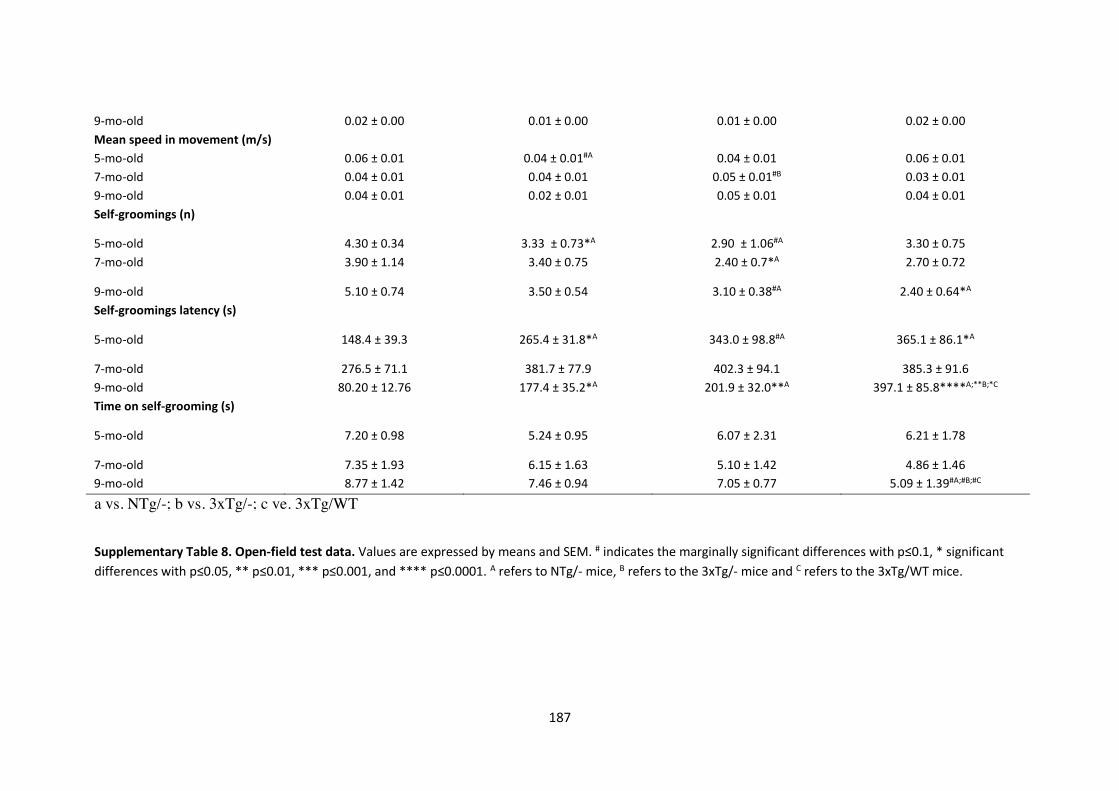
187
9-mo-old 0.02 ± 0.00 0.01 ± 0.00 0.01 ± 0.00 0.02 ± 0.00
Mean speed in movement (m/s)
5-mo-old 0.06 ± 0.01 0.04 ± 0.01#A 0.04 ± 0.01 0.06 ± 0.01
7-mo-old 0.04 ± 0.01 0.04 ± 0.01 0.05 ± 0.01#B 0.03 ± 0.01
9-mo-old 0.04 ± 0.01 0.02 ± 0.01 0.05 ± 0.01 0.04 ± 0.01
Self-groomings (n)
5-mo-old 4.30 ± 0.34 3.33 ± 0.73*A 2.90 ± 1.06#A 3.30 ± 0.75
7-mo-old 3.90 ± 1.14 3.40 ± 0.75 2.40 ± 0.7*A 2.70 ± 0.72
9-mo-old 5.10 ± 0.74 3.50 ± 0.54 3.10 ± 0.38#A 2.40 ± 0.64*A
Self-groomings latency (s)
5-mo-old 148.4 ± 39.3 265.4 ± 31.8*A 343.0 ± 98.8#A 365.1 ± 86.1*A
7-mo-old 276.5 ± 71.1 381.7 ± 77.9 402.3 ± 94.1 385.3 ± 91.6
9-mo-old 80.20 ± 12.76 177.4 ± 35.2*A 201.9 ± 32.0**A 397.1 ± 85.8****A;**B;*C
Time on self-grooming (s)
5-mo-old 7.20 ± 0.98 5.24 ± 0.95 6.07 ± 2.31 6.21 ± 1.78
7-mo-old 7.35 ± 1.93 6.15 ± 1.63 5.10 ± 1.42 4.86 ± 1.46
9-mo-old 8.77 ± 1.42 7.46 ± 0.94 7.05 ± 0.77 5.09 ± 1.39#A;#B;#C
a vs. NTg/-; b vs. 3xTg/-; c ve. 3xTg/WT
Supplementary Table 8. Open-field test data. Values are expressed by means and SEM. # indicates the marginally significant differences with p≤0.1, * significant
differences with p≤0.05, ** p≤0.01, *** p≤0.001, and **** p≤0.0001. A refers to NTg/- mice, B refers to the 3xTg/- mice and C refers to the 3xTg/WT mice.
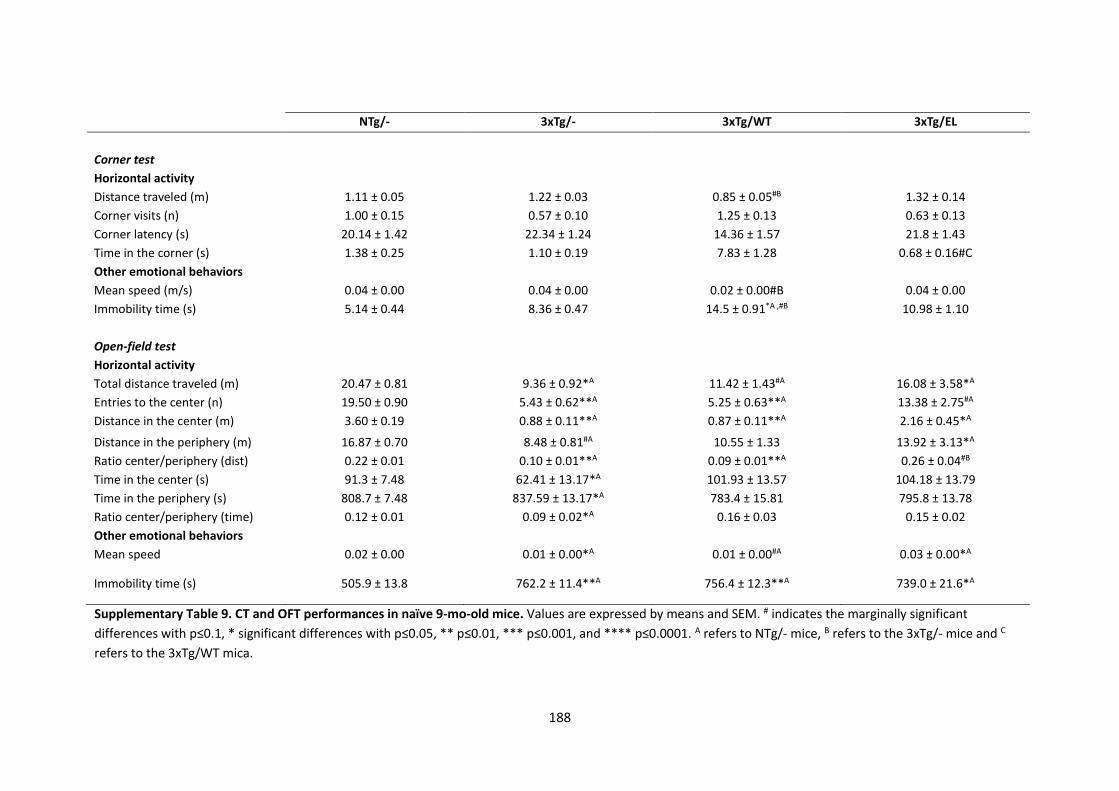
188
NTg/- 3xTg/- 3xTg/WT 3xTg/EL
Corner test
Horizontal activity
Distance traveled (m) 1.11 ± 0.05 1.22 ± 0.03 0.85 ± 0.05#B 1.32 ± 0.14
Corner visits (n) 1.00 ± 0.15 0.57 ± 0.10 1.25 ± 0.13 0.63 ± 0.13
Corner latency (s) 20.14 ± 1.42 22.34 ± 1.24 14.36 ± 1.57 21.8 ± 1.43
Time in the corner (s) 1.38 ± 0.25 1.10 ± 0.19 7.83 ± 1.28 0.68 ± 0.16#C
Other emotional behaviors
Mean speed (m/s) 0.04 ± 0.00 0.04 ± 0.00 0.02 ± 0.00#B 0.04 ± 0.00
Immobility time (s) 5.14 ± 0.44 8.36 ± 0.47 14.5 ± 0.91*A ,#B 10.98 ± 1.10
Open-field test
Horizontal activity
Total distance traveled (m) 20.47 ± 0.81 9.36 ± 0.92*A 11.42 ± 1.43#A 16.08 ± 3.58*A
Entries to the center (n) 19.50 ± 0.90 5.43 ± 0.62**A 5.25 ± 0.63**A 13.38 ± 2.75#A
Distance in the center (m) 3.60 ± 0.19 0.88 ± 0.11**A 0.87 ± 0.11**A 2.16 ± 0.45*A
Distance in the periphery (m) 16.87 ± 0.70 8.48 ± 0.81#A 10.55 ± 1.33 13.92 ± 3.13*A
Ratio center/periphery (dist) 0.22 ± 0.01 0.10 ± 0.01**A 0.09 ± 0.01**A 0.26 ± 0.04#B
Time in the center (s) 91.3 ± 7.48 62.41 ± 13.17*A 101.93 ± 13.57 104.18 ± 13.79
Time in the periphery (s) 808.7 ± 7.48 837.59 ± 13.17*A 783.4 ± 15.81 795.8 ± 13.78
Ratio center/periphery (time) 0.12 ± 0.01 0.09 ± 0.02*A 0.16 ± 0.03 0.15 ± 0.02
Other emotional behaviors
Mean speed 0.02 ± 0.00 0.01 ± 0.00*A 0.01 ± 0.00#A 0.03 ± 0.00*A
Immobility time (s) 505.9 ± 13.8 762.2 ± 11.4**A 756.4 ± 12.3**A 739.0 ± 21.6*A
Supplementary Table 9. CT and OFT performances in naïve 9-mo-old mice. Values are expressed by means and SEM. # indicates the marginally significant
differences with p≤0.1, * significant differences with p≤0.05, ** p≤0.01, *** p≤0.001, and **** p≤0.0001. A refers to NTg/- mice, B refers to the 3xTg/- mice and C
refers to the 3xTg/WT mica.

189