Soluble factors secreted by T-cells promote β-cell...
38
1 Soluble factors secreted by T-cells promote β-cell proliferation Ercument Dirice 1 , Sevim Kahraman 1* , Wenyu Jiang 2* , Abdelfattah El Ouaamari 1 , Dario F. De Jesus 1 , Adrian K.K. Teo 1 , Jiang Hu 1 , Dan Kawamori 1 , Jason L. Gaglia 3 , Diane Mathis 4 , Rohit N. Kulkarni 1 1 Section of Islet Cell Biology and Regenerative Medicine, Joslin Diabetes Center and Harvard Medical School, Boston, Massachusetts, 02215, USA 2 Department of Pathology, Brigham and Women’s Hospital, Boston, Massachusetts, 02215, USA 3 Section of Immunobiology, Joslin Diabetes Center and Harvard Medical School, Boston, Massachusetts, 02215, USA 4 Division of Immunology, Department of Microbiology and Immunobiology, Harvard Medical School, Boston, Massachusetts, 02215, USA Running Title: T-cells mediate β-cell proliferation *: equal authors Correspondence to: Rohit N. Kulkarni Joslin Diabetes Center and Harvard Medical School Boston, 02215, MA, USA 001-617-309 3460 001-617-309 2593 [email protected] Word Count Abstract: 162 Main Text: 4885 Page 1 of 38 Diabetes Diabetes Publish Ahead of Print, published online October 2, 2013
Transcript of Soluble factors secreted by T-cells promote β-cell...
1
Soluble factors secreted by T-cells promote β-cell proliferation
Ercument Dirice1, Sevim Kahraman
1*, Wenyu Jiang
2*, Abdelfattah El Ouaamari
1,
Dario F. De Jesus1, Adrian K.K. Teo
1, Jiang Hu
1, Dan Kawamori
1, Jason L. Gaglia
3,
Diane Mathis4, Rohit N. Kulkarni
1
1Section of Islet Cell Biology and Regenerative Medicine, Joslin Diabetes Center and Harvard
Medical School, Boston, Massachusetts, 02215, USA
2Department of Pathology, Brigham and Women’s Hospital, Boston, Massachusetts, 02215,
USA
3Section of Immunobiology, Joslin Diabetes Center and Harvard Medical School, Boston,
Massachusetts, 02215, USA
4Division of Immunology, Department of Microbiology and Immunobiology, Harvard
Medical School, Boston, Massachusetts, 02215, USA
Running Title: T-cells mediate β-cell proliferation
*: equal authors
Correspondence to: Rohit N. Kulkarni
Joslin Diabetes Center and Harvard Medical School
Boston, 02215, MA, USA
001-617-309 3460
001-617-309 2593
Word Count
Abstract: 162
Main Text: 4885
Page 1 of 38 Diabetes
Diabetes Publish Ahead of Print, published online October 2, 2013
2
ABSTRACT
Type 1 diabetes is characterized by infiltration of pancreatic islets with immune cells leading
to insulin deficiency. While infiltrating immune cells are traditionally considered to
negatively impact β-cells by promoting their death, their contribution to proliferation is not
fully understood. Here we report that islets exhibiting insulitis also manifested proliferation of
β-cells which positively correlated with the extent of lymphocyte infiltration. Adoptive
transfer of diabetogenic CD4+ and CD8
+ T-cells, but not B-cells, selectively promoted β-cell
proliferation in vivo independent from the effects of blood glucose, circulating insulin or by
modulating apoptosis. Complementary to our in vivo approach co-culture of diabetogenic
CD4+ and CD8
+ T-cells with NOD.RAG1
-/- islets in an in vitro transwell system led to a dose-
dependent secretion of candidate cytokine/chemokines (IL-2, IL-6, IL-10, MIP-1α and
RANTES) that together enhanced β-cell proliferation. These data suggest that soluble factors
secreted from T cells are potential therapeutic candidates to enhance β-cell proliferation in
efforts to prevent and/or delay the onset of type 1 diabetes.
INTRODUCTION
Type 1 Diabetes (T1D) is a chronic T-cell mediated autoimmune disease characterized by
selective destruction of β-cells resulting in hyperglycemia (1). A major limitation to
successful therapy has been a lack of complete understanding of the precise pathways and
mechanisms that trigger T1D compounded by the polygenic nature of the disease and the
influence of environmental and/or stochastic factors (2).
Studies using the non-obese diabetic (NOD) mice have identified roles for CD4+ and CD8+
T-cells, and macrophages in β-cell destruction. Other cell types including B-cells, natural
killer (NK) cells, NKT-cells and the DC subsets have also been detected in the pancreatic
infiltrate and draining lymph nodes and could contribute to β-cell death (3).
Page 2 of 38Diabetes
3
While immune-cells are generally considered to promote β-cell death, some studies argue that
they also enhance their replication. For example, Sreenan et al. have reported increased β-cell
proliferation in NOD mice which exhibit infiltration of pancreatic islets prior to the onset of
diabetes (4). In addition, von Herrath et al. reported that non-diabetic RIP-LCMV x SV129
mice, where the numbers and effector functions of autoaggressive CD4 and CD8 lymphocytes
were not decreased, have increased β-cell regeneration compared to non-diabetic C57BL/6
controls (5). In other studies, Sherry et al. suggested the increased β-cell proliferation that
occurs after arresting the autoimmune process is secondary to effects of the inflammatory
infiltrate. The latter study also showed that reversal of infiltration by anti-CD3 mAb or T-reg
therapy was associated with reduced β-cell proliferation (6). A notable study that partially
addressed the mechanism is that by Dor and colleagues who reported that the use of standard
immunosuppression drugs abolished β-cell proliferation and recovery from diabetes (7).
Recent studies have also reported that humans with T1D exhibit persistent mature β-cells in
the pancreas that may be secondary to protective factors that prevent their destruction (8; 9).
A n understanding of how these β-cells survive and/or regenerate is an exciting and timely
area of interest.
Notwithstanding the scant information on the ability of human β-cells to replicate (10; 11),
studies in rodent models indicate that β-cell proliferation is increased in physiologic
conditions, pathophysiologic states, and in injury models(7; 12-15). In these models, glucose,
insulin, IGFs (insulin like growth factors), GH (growth hormone), GLP-1 (glucagon-like-
peptide-1), adipokines such as leptin, HGF (hepatocyte growth factor) and lactogens such as
prolactin (PRL) have all been implicated in regulating β-cell proliferation (16).
In addition to the factors noted above, cytokines derived from the inflammatory response
itself have been reported to stimulate islet-cell replication (17; 18), and treatment with IL-4 or
Page 3 of 38 Diabetes
4
IL-10 has been reported to inhibit the development and prevent the recurrence of T1D in
NOD mice (19; 20).
In this study, we tested the hypothesis that one or more lymphocytes, or their secretions,
promote β-cell regeneration in vivo. We report, for the first time to our knowledge, that CD4+
and CD8+ T-cell subsets, but not B-lymphocytes, secrete soluble factors and are potential
novel targets that can be harnessed to promote β-cell proliferation to counter the progression
of T1D.
RESEARCH DESIGN AND METHODS
Mice: Female NOD/shiLTJ mice, 20 weeks of age were used as splenocyte donors and
NOD.RAG1-/-
mice, 5-6 week of age were used as recipients for adoptive transfer studies and
islet donors for splenocyte-islet co-culture experiments. Male C57BL/6J (B6) mice islets, 5-6
weeks of age, were used for recombinant protein treatments. Blood glucose was measured
under ad libidum conditions and mice were considered diabetic when two consecutive
measurements of blood glucose exceeded 200 mg/dl.
Adoptive transfer of diabetes and depletion of splenocytes: A total of 107 splenocytes
(SPLs) were purified from NOD mice with diabetes and injected intravenously into a single
NOD.RAG1-/-
mouse. To obtain SPL preparations devoid of B-cells, CD4+, CD8
+ T cells,
they were incubated with anti-B220-PE, anti-CD4-PE and anti-CD8a-PE (Biolegend),
respectively. The cells were washed in PBS and resuspended in MACS (magnetic activated
cell sorter) buffer and anti-PE Microbeads and run on the AutoMACS system (Miltenyi
Biotec). Samples from the B-cell, CD4+-, CD8
+ -depleted splenocyte aliquots were stained
with anti-mouse CD19-PE, anti-CD4-Pasific Blue and anti-CD8a-FITC (Biolegend),
respectively, analyzed with a FACSAria (BD Biosciences) and determined to be >98%
Page 4 of 38Diabetes
5
depleted (data not shown). For CD4+ and CD8
+ double-depletion, fractionated depleted cells
were injected into NOD.RAG1-/-
mice. We also used in vivo depletion by injecting 0.5 mg of
anti-CD4, anti-CD8 or both mAb into NOD.RAG1-/-
mice every three days after depleted-
splenocyte transfer. Three weeks post-injection of total or depleted splenocytes, pancreas was
harvested and prepared for β-cell morphometry. To track lymphocytes homing to host
pancreatic islets in adoptively transferred mice we used NOD.Raspberry splenocytes from
mice generated by microinjection of a β-actin/mRaspberry construct in the pronucleus of
fertilized NOD mouse eggs.
Streptozotocin injection and insulitis scoring: Eighteen female NOD mice 6 weeks of age
were injected intraperitoneally with streptozotocin (STZ, Sigma) at a concentration of 75 or
100 mg/kg/BW. Day 0 was defined as the first day of injection and pancreas was harvested
from 3 mice every other day starting at day 1 until day 7. Insulitis was evaluated as reported
(21).
Immunohistochemistry: Pancreata were harvested, fixed and embedded in paraffin 6 h post-
injection with BrdU (100mg/kg/BW). Sections were stained using antibodies to BrdU, Ki67,
phosphohistone H3), or insulin, appropriate secondary antibodies and counterstained with
DAPI. At least, 1,000-2,000 β-cell nuclei were counted per animal and data were expressed
as % of BrdU+, Ki67+ or pHH3+ β-cells. Cell death was detected by TUNEL assay
(Chemicon, ApopTag S7100). Frozen sections were co-immunostained for insulin and a
DSRed polyclonal antibody (Clontech) to detect mRaspberey protein followed by appropriate
secondary antibodies.
Islet isolation and mixed lymphocyte-islet cell culture: Islets were isolated from 5-6 weeks
old NOD.RAG1-/-
or B6 mice and cultured as described previously (22). In parallel we
prepared depleted or total lymphocyte cell suspensions from 20 week old diabetic or 7-8 week
Page 5 of 38 Diabetes
6
old pre-diabetic female NOD mice (23). After starvation, 150 size-matched islets were co-
cultured with splenocytes or treated with recombinant proteins in 5mM glucose. Contact
between islets and splenocytes placed above the transwell membrane was prevented by using
a 0.4 µm Transwell insert (Corning Life Sciences). Forty-eight hours after co-culture, medium
was collected for luminex assay and islets were embedded in agar for β-cell morphometry. At
least 1000-2000 β-cell nuclei were counted for quantifying proliferation and apoptosis.
Islet dispersion and cell sorting: Overnight cultured islets were dispersed and β-cells were
sorted as described previously (24). Sorted β-cells were washed and stained with anti-CD45
(eBioscience) followed by fixation, permeabilization and staining with anti-BrdU (BrdU
staining kit-APC, eBioscience). Cells were analyzed with BD LSR II analyzer.
Recombinant protein treatment: One hundred and fifty handpicked islets isolated from B6
mice were cultured in the absence or presence of IL-2 (5 pg/ml or: 500pg/ml), IL-6 (200
pg/ml or 200 ng/ml), IL-10 (4 pg/ml or 400 pg/ml), MIP-1α (10 pg/ml or10 ng/ml), RANTES
(5 pg/ml or 500 pg/ml), a low dose combination of all the cytokines/chemokines or 15% FBS
(positive control). Low doses were selected from our luminex assay results and high doses
were based on manufacturer’s recommendations (R&D Systems). To determine whether the
proliferative effects are direct, islets treated with either recombinant proteins or total DM
splenocytes were cultured in the presence of specific inhibitors/neutralizing molecules: Ro 26-
4550 (IC50=3µM), anti-IL6 (ND50=0.005µg/ml), anti-IL10 (ND50=0.045µg/ml), Maraviroc
(IC50=3.3nM) and Maraviroc (IC50=5.2nM) to block IL-2, IL-6, IL-10, MIP-1α and RANTES,
respectively
Statistics: Data are expressed as means ±SEM following a 2-tailed Student’s t test, and
considered significant at P value ≤ 0.05.
Page 6 of 38Diabetes
7
Study Approval: All animal experiments were conducted following approved by the
Institutional Animal Care and Use Committee of the Joslin Diabetes Center in accordance
with NIH guidelines.
RESULTS
Adoptive transfer of diabetogenic splenocytes promote β-cell replication in NOD.RAG1-
/- mice
To directly examine whether splenocytes induce proliferation of β-cells we performed
adoptive transfer experiments (6; 25). We used 20 week old hyperglycemic (Diabetic mice,
DM) or 7-8 week old normoglycemic NOD mice (Pre-diabetic mice, Pre-DM) as splenocyte
donors. Since the kinetics of disease transfer are dependent on the age of the mice when the
splenocytes are transferred (26) and most islets in pre-diabetic animals have only peri-insulitis
(Supplemental Fig. 1A) we considered Pre-DM as the control cohort. To confirm that
splenocytes after adoptive transfer target host pancreatic islets we injected splenocytes
derived from hyperglycemic NOD.Raspberry mice congenically marked with mRaspberry
fluorescent protein, a far red protein which is generally preferred for in vivo imaging, into
female NOD mice. We visualized that marked cells accumulate and infiltrate into host islets
(Supplemental Fig. 1B).Intravenous injection of freshly isolated total DM splenocytes or
control Pre-DM splenocytes into 5-6 week old immune-deficient NOD.RAG1-/-
mice (Fig.
1A) showed a significant increase in β-cell mitosis in the group injected with DM splenocytes
compared with controls. To ascertain that we were counting only proliferating β-cells and not
overlapping immune cells we used confocal microscopy z-stack, 3D and orthographic
imaging and double staining for insulin and CD3, a T-cell receptor marker, or F4/80, a
common macrophage marker (Fig. 2, A-N). A 5-fold increase in BrdU incorporation indicated
β-cells in the S-phase of the cell cycle (Fig. 1, B and C), while an augmentation in pHH3
Page 7 of 38 Diabetes
8
immunostaining suggested progression into the G2 or M phases (Fig. 1, B and D). The
enhanced mitosis was confirmed using Ki67 (Fig. 1, B and E). To confirm our
immunohistological findings we performed FACS analysis of dispersed islets for β-cell
sorting according to autoflourescence and size (Fig. 2, O and P). We used CD45 staining to
gate out immune cells and quantified BrdU positive β-cells (Fig. 2Q). We examined BrdU
immunostaining in the CD45 positive cell population as an internal control (Supplemental
Fig. 1 C-F). The increase in proliferating β-cells was consistent with the immunohistological
data (Fig. 2, R-T). In addition, co-immunostaining for BrdU and insulin or GLUT2 (β-cell
membrane marker) confirmed the identity of the cells (Supplemental Fig. 2, A and B).
TUNEL immunostaining did not reveal significant differences in β-cell apoptosis between
groups (Fig. 1, F and G). Together these data indicate that injection of splenocytes isolated
from DM promotes β-cell replication in vivo.
T-cells, but not B-cells, are the dominant players in β-cell proliferation
Previous studies have reported that T1D is primarily a T-cell mediated autoimmune disease
(27-29). To evaluate the effect of B-cells on β-cell proliferation we injected total (107) or B-
cell depleted (6.4 x 10⁶) cell populations intravenously into female NOD.RAG1
-/- mice (Fig.
1A) followed, three weeks later, by harvesting of pancreas, liver and epididymal fat. Co-
immunostaining of BrdU and insulin in pancreas sections from animals receiving total
splenocytes from diabetic animals and animals administered B-cell depleted splenocytes
showed no significant difference in β-cell replication (Fig. 3, A and B). Furthermore, co-
immunostaining of pancreas sections for PDX1 (Pancreatic and duodenal homebox-1), a β-
cell transcription factor, and BrdU did not reveal differences between groups (Supplemental
Fig. 2C). The β-cell specificity of the effects on proliferation was confirmed by a virtual lack
Page 8 of 38Diabetes
9
of proliferation in hepatocytes or adipocytes (Supplemental Fig. 2, D and E). These data
demonstrate that B-cells are unlikely to contribute to β-cell proliferation in this model.
We next evaluated the relative importance of T-cells for β-cell proliferation using a similar
approach. We considered CD4+ and CD8
+ T cells to be likely candidate(s) because they are
the major T-cell subsets infiltrating in or around the islets and are the final executors of β-cell
destruction (30). In addition to in vitro depletion, we injected NOD.RAG1-/-
mice receiving in
vitro depleted splenocytes with anti-CD4, anti-CD8 or both mAbs to promote in vivo
depletion. The groups receiving the individual CD4+ and CD8
+ depleted splenocytes as well
as the CD4/CD8 double depleted splenocytes exhibited dramatically decreased β-cell
proliferation compared to the groups injected either with whole splenocytes from diabetic
animals or B-cell depleted splenocytes. Moreover, mice which received CD8+ depleted
splenocytes showed a slightly greater β-cell proliferation compared to animals administered
CD4+ or double-depleted splenocytes (p<0.05) (Fig. 3B). Apoptosis trended to be higher in
the total DM splenocyte and B-cell depleted splenocyte-administered animals but did not
reach statistical significance (Supplemental Fig 5A). These results suggest that CD4+ and
CD8+ T-cells act together to stimulate β-cell replication in animals injected with diabetogenic
splenocytes.
β-cell proliferation is positively correlated with islet infiltration
Infiltration in the pancreatic islets with mononuclear inflammatory cells is a key feature in
T1D in NOD mice. An interesting observation during the analyses of sections for β-cell
proliferation in the different groups discussed above was a striking difference in the
percentage of infiltrated cells (Fig. 4A). Scoring for insulitis revealed that while the animals
receiving total DM splenocytes and B-cell depleted DM splenocytes contained islets with
moderate to severe insulitis, the number of affected islets was significantly reduced in animals
Page 9 of 38 Diabetes
10
receiving Pre-DM splenocytes. In contrast, all the groups that received T-cell subtype(s)-
depleted splenocytes were virtually free of insulitis with a few scattered islets exhibiting
minimal infiltration (Fig. 4, A and B). We observed a linear and significant correlation
between the islets manifesting insulitis and β-cell proliferation (r=0.71; p=0.004) (Fig. 4C).
To confirm this finding we used an alternative model that promotes infiltration in islets,
namely the streptozotocin (STZ)-induced diabetic NOD mouse. Examination of pancreas
sections in mice that receive intra-peritoneal injection of a single dose (75 or 100 mg/kg/b.wt)
of STZ again revealed a positive correlation between β-cell proliferation and mononuclear
cell infiltration beginning on day one and peaking on day five or day three after injection (Fig.
4, D and E). The lack of significant alterations in blood glucose and insulin levels at the peak
of the proliferation effect suggested the proliferation was independent of the effects of
glycemia or insulin (Supplemental Fig. 3, A and B). The mice that were subjected to the
adoptive transfer experiments over the three week period following splenocyte injection were
also normoglycemic (Supplemental Fig. 3C). The virtual absence of mononuclear immune-
cell infiltration in liver and adipose confirmed the β-cell specificity (Supplemental Fig. 3D).
Together these results suggest that β-cell proliferation occurs soon after immune-cell
infiltration, prior to the onset of diabetes, and is independent of the effects of glucose and
insulin.
Soluble factors secreted by lymphocytes promote β-cell proliferation
Our in vivo data indicated that increasing numbers of infiltrating lymphocytes positively
correlated with β-cell proliferation. To determine whether this direct effect is observed in
vitro we designed mixed lymphocyte-islet culture (MLIC) experiments to examine whether
splenocytes (total or T-cell depleted) from diabetic NOD mice promoted β-cell proliferation.
Page 10 of 38Diabetes
11
Briefly, islets were isolated from NOD.RAG1-/-
mice and cultured overnight; in parallel, we
isolated aliquots of diabetogenic total or T-cell depleted splenocytes (Fig. 5A).
Prior to co-culture of lymphocytes with islets, we hypothesized that a specific ratio of islet
cells to lymphocytes is critical to promote proliferation of β-cells and that soluble factors
mediate the proliferation. Analyses of β-cell proliferation in single islets showed a positive
correlation with lymphocyte infiltration, (Fig. 5B), that was similar to the in vivo studies (Fig.
4C). To determine the ratio between infiltrating immune cells vs insulin(+) β-cells pancreas
sections from total splenocyte- or STZ-injected mice were examined for both cell types; the
infiltrating cells were between 4 to 10 times greater than β-cells in the islets that exhibited
proliferation (Fig. 5C). Therefore, we co-cultured freshly isolated splenocytes with 150 islets
in varying ratios (see below) for 48 hours followed by embedding the islets in agar for
immunohistochemical analyses (Fig. 5A). To address whether the effects are mediated by
soluble factors or by direct contact we co-cultured the lymphocytes with the islets either in the
presence or absence of microporous transwell inserts which prevent direct splenocyte-islet
contact while allowing soluble factors to diffuse across (Fig. 5D). We first assessed the
capacity of total DM and Pre-DM splenocytes to stimulate β-cell proliferation at an increasing
islet-cell to splenocyte ratio (1:1, 1:2, 1:5, 1:10). Forty-eight hours after co-culture, we
observed that total splenocytes from diabetic mice, at a ratio of 1:5 and 1:10, significantly
induced β-cell proliferation in a dose-dependent manner compared to islets co-cultured with
Pre-DM splenocytes in transwell conditions, suggesting a role for soluble factors secreted
from lymphocytes isolated from DM in β-cell proliferation (Fig. 5D). On the other hand, non-
transwell conditions which permitted cell-cell contact also revealed an effect on β-cell
proliferation that was slightly higher compared to the transwell studies likely due to the
increased cell-cell contact (Fig. 5E).
Page 11 of 38 Diabetes
12
Next, we performed a second set of co-culture experiments to examine the effects of selected
T-cell subtype(s) on β-cell proliferation in vitro (Fig. 5F). A 1:1 and 1:10 islet-cell to
splenocyte ratio in the transwell system revealed that islets co-cultured with total DM
splenocytes promoted a 3 to 10 fold higher β-cell proliferation at the 1:10 ratio compared to
Pre-DM splenocytes or splenocytes that are depleted for T-cell subtype(s). The proliferation
was either very low or undetectable (ND) at the 1:1 ratio. Among the groups treated with
splenocytes that are depleted of the T-cell subtype(s) the CD8+ depleted group revealed
statistically significant higher β-cell proliferation compared to CD4+ only or CD4
+/CD8
+
double depleted (p<0.05) groups. Moreover, in positive selection experiments, islets cultured
with only CD4+
cells (1 to 10 ratio of islet cells to CD4+ cells) showed higher (p=0.07) β-cell
proliferation compared to CD8+ only co-cultured groups (Fig. 5F) and was consistent with our
negative selection experiments exhibiting low proliferation in the CD4+ depleted group.
Evaluation of β-cell death by TUNEL assay did not reveal significant differences between
groups (Supplemental Fig. 5B). These results support our in vivo findings that CD4+ and
CD8+ T-cells act together and that CD4
+ T-cells are likely more effective in stimulating β-cell
proliferation by secreting soluble factors and independent of cell-cell contact.
Effects of cytokines on β-cell proliferation
To identify the soluble factor(s) that drive β-cell proliferation in pancreatic islets we analyzed
media in the co-culture experiments to detect potential cytokines/chemokines/growth factors
released by the splenocytes. We ranked the cytokines/chemokines from 1 to 4 according to
their significant differences between DM and Pre-DM splenocyte treatments in the two
transwell conditions (Supplemental Table 1). Among them group 1 cytokines/chemokines
included candidate molecules (IL-2, IL-6, IL-10, MIP-1α and RANTES)which showed a
dose-dependent higher concentration in the group treated with splenocytes from the DM
Page 12 of 38Diabetes

13
compared to mice treated with splenocytes from Pre-DM in both co-culture conditions (Fig. 6,
A-E). We ruled out IP-10 as a candidate since it is not expressed on lymphocytes, is a known
chemoattractant for immune cells and has been shown to be produced by the β-cells. The
candidate molecules in the other groups (groups 2,3 and-4) were not significantly increased
between DM and Pre-DM splenocytes treated mice at least in one or both co-culture
conditions and were therefore not studied in detail. While some of the candidates (IL-2 and
IL-6) were increased in both ‘with’ and ‘without’ transwell conditions, others (IL-10, MIP-1α
and RANTES) were higher in the ‘without’ transwell condition probably due to direct cell-
cell contact that potentially allows immune cells to respond rapidly via multiple pathways. In
support of a potential proliferative role for each of the five cytokines/chemokines on β-cells
we first confirmed expression of their receptors on sorted β-cells. (Fig. 7A). Second, we
investigated the effects of the individual cytokines/chemokines on pancreatic islets isolated
from B6 mice in the presence or absence of specific inhibitors and/or neutralizing antibodies
over a range of concentrations (18; 31; 32). Low doses of IL-6 (200 pg/ml) strongly induced
β-cell proliferation and increased up to 10-fold at the higher dose (200 ng/ml)
(p<0.05)(Supplemental Fig. 4B). Moreover, IL-2, IL-10 and MIP-1α demonstrated
significantly higher proliferation even at low levels with 8-, 4- and 3-fold increases
respectively (p<0.05) (Supplemental Fig. 4, A, C and D). On the other hand, treatment with
RANTES resulted in β-cell proliferation at lower doses (5 and 500 pg/ml) but the effect was
surprisingly reduced at 50 ng/ml (Supplemental Fig. 4E). To determine specificity we
examined the effects of specific inhibitors or neutralizing antibodies in islets treated with low
dose cytokines/chemokines. In all cases we observed neutralization of the proliferative effects
of the respective cytokine/chemokine (Fig. 7 B-F). In some cases (IL-2 inhibitor and
Maraviroc 3.3nM) the neutralization was not complete and is likely due to variable IC50s of
the compounds (Fig 7G). Cytokines and/or chemokines are known to be secreted by
Page 13 of 38 Diabetes
14
macrophages or dendritic cells to impact T-cell function and conversely secretions from T-
cells can also impact macrophages (27; 33). To examine whether the cytokine/chemokines act
synergistically to enhance β-cell proliferation we compared the individual effects versus a
combination (Supplemental Fig. 4F). In addition to their significant individual effects on
proliferation a combination of the cytokines/chemokines ,at doses used in the individual
treatments, showed a significant increase (p<0.001) but was not dramatically different from
the individual effects likely because some of the cytokines share common downstream
pathways to stimulate proliferation. Finally, to confirm the recombinant protein treatment
findings we undertook an independent experiment wherein total DM splenocytes served as the
source of cytokines/chemokines. Islet-cells and splenocytes were cultured in a 1:10 ratio in a
transwell system in the presence or absence of inhibitory/neutralizing antibodies against the
candidate factors. While splenocytes alone significantly increased β-cell proliferation
compared to untreated islets (Fig. 8 A and B), adding the inhibitory/neutralizing molecule
reversed this effect. Consistent with our previous observations theses data suggested that each
candidate has a potential to induce β-cell regeneration (Fig. 8 C-H). In summary,
cytokines/chemokines that are secreted from lymphocytes in close proximity to islet cells
promote detectable β-cell proliferation.
DISCUSSION
Although immune-cells have been implicated in the proliferation of β-cells during the
progression of T1D (4; 6), the cell type(s) and mechanisms that control β-cell regeneration
remain unknown. Here we report that soluble factors secreted from CD4+ and CD8
+ T-cells
directly stimulate β-cell proliferation.
NOD.RAG1-/-
mice injected with DM splenocytes exhibited a significant elevation in all
markers of β-cell proliferation compared to controls. Adoptive transfer of diabetes to
Page 14 of 38Diabetes
15
immunocompromised syngenic recipients can be achieved only when a combination of
splenic CD4+ and CD8
+ T-cells from donor NOD mice is used and not by either T-cell subsets
alone (34). Injecting CD4+-, CD8
+- or CD4
+/CD8
+ double-depleted splenocytes into
NOD.RAG1-/-
animals resulted in a dramatic decrease in β-cell proliferation compared to the
animals that received total DM splenocytes. In addition, we also observed that animals in
whom T-cell subtype(s) were depleted exhibited minimal pancreatic islet infiltration
compared to animals receiving total splenocytes or B-cell depleted splenocytes. Considering
that the development of T1D requires the presence of both CD4+ and CD8
+ T-cells, depleting
one or both of these cells would impact the inflammatory response and alter β-cell replication.
This possibility was supported by a linear and significant correlation between β-cell
proliferation and immune cell infiltration in our studies. Among the T-cell subtypes, both
CD8+ T-cell depleted splenocyte injection (in vivo) and islet co-culture (in vitro) studies
demonstrated higher proliferation compared to CD4+ depleted or CD4
+/CD8
+ double-depleted
cohorts. Similar results were observed when islets were cultured with CD4+ T-cell subset
alone signifying their role in β-cell proliferation. We did not detect a significant difference in
β-cell apoptosis between the groups either because the duration following injection of
splenocytes is not sufficient to promote significant apoptosis and/or because it is often
difficult to detect dead β-cells due to their rapid engulfment and disposal (35).
While our studies point to CD4+ and CD8
+ T-cells as critical for β-cell proliferation during
T1D progression, we cannot exclude the potential contribution of macrophages or dendritic
cells and their secreted products (36). Our data suggests that B-cells are unlikely to play a role
in β-cell replication. Depletion of macrophages prevents T1D development (37) and
macrophages have been reported to impact β-cells by producing pro-inflammatory cytokines
(38). One possible role for macrophages in β-cell proliferation is that T-cell subtypes,
Page 15 of 38 Diabetes
16
especially CD4+, recruit additional CD4
+, CD8
+ or granulocytes into the infiltrate and
contribute to local secretion of cytokines and chemokines. Indeed, T-cells secrete soluble
factors such as GM-CSF (granulocyte macrophage-colony stimulating factor) (39) to
influence leukocytes and recruit them to inflammatory sites during inflammation (40; 41).
Thus, in addition to their direct effect on β-cell proliferation by cytokine secretion, it is
possible that T-cells act indirectly by triggering mononuclear cells to secrete soluble factors,
via the classical or non-classical pathways, that can in turn enhance β-cell proliferation.
While earlier studies implicate a T-cell dependent proliferative effect on aortic smooth muscle
(42) and orbital fibroblasts (43), the mechanism(s) remains unclear. Careful analyses of our
data from the transwell experiments indicate that CD4+ and CD8+ lymphocytes secrete IL-2,
IL-6, IL-10, MIP-1α and RANTES, each of which showed a dose-dependent effect on β-cell
proliferation. Some of these factors have been associated with proliferation of other cell types.
For example, IL-2, regulates the growth and function of T-cells (44), while IL-6 stimulates α-
and β-cell proliferation in vitro (18) and is known to reinforce the effects of IL-2 in promoting
the differentiation of CD4+ cells into Type-2 T helper cells (TH2) (45). RANTES acts with IL-
2 to induce the proliferation and activation of natural-killer (NK) cells to form chemokine-
activated killer cells (46). Since β-cells themselves have been reported to produce
inflammatory cytokines such as IL-1β (47) we do not exclude the β-cell as a source of some
of these molecules. Cytokines, such as IL-1β and INF-γ, when used in combination, can
induce de-differentiation of newly generated β-cells mediated by re-expression of the Notch-
Delta pathway (48). Whether the soluble factors detected in our experiments are also involved
in similar pathways to modulate β-cell mass warrants further investigation.
Although, the capacity to proliferate are strikingly different between rodents and human the
observations that β-cells can regenerate in humans have prompted studies to investigate safe
Page 16 of 38Diabetes

17
approaches to enhance their functional mass. Whether the candidate molecules identified in
our study can be used either individually or in combination with an appropriate
immunosuppressive regimen to preserve β-cell mass requires further research. In the context
of cytokines, IL-6 has been reported to stimulate human islet proliferation (18). Although
attempts at expansion ex-vivo resulted in a change in the β-cell phenotype, lineage-tracing
studies suggest that de-differentiated human β-cells are able to survive and replicate in
vitro(49). Thus, testing the candidates we have identified in ex-vivo conditions can be a first
step to evaluate their ability to expand human β-cells. However, a role for these molecules as
‘therapeutic’ agents has to be viewed with caution due to their well-established roles in the
immune network. For example, rapamycin, an immunosuppressant drug used to protect
rejection in organ transplantations, inhibits lymphocyte proliferation by inhibiting their
response to IL-2(50). Despite IL-2 being important in lymphocyte activation, it also
contributes to the development and expansion of CD4+ CD25
+ regulatory T-cells, which
promote self-tolerance by suppressing T-cell responses in vivo. Thus, extensive and careful
dosing studies are necessary to examine the potential of the candidate cytokines/chemokines
for β-cell expansion.
We propose that some of the pro- and anti-inflammatory cytokines/chemokines secreted in the
islet microenvironment during insulitis have the potential to promote proliferation by
activating diverse signaling cascades (e.g. JAK/STAT, MAPK or PI3K/AKT). This potential
beneficial effect triggers the islets to secrete chemoattractant molecules [e.g. eotaxin
(CCL11), IP-10 (CXCL-10) and MCP-1(CCL2)] which in turn amplify the recruitment of
mononuclear cells and the release of multiple cytokines/chemokines. The detection of
increased levels of chemotactic molecules in our experiments, especially IP-10 and eotaxin
Page 17 of 38 Diabetes
18
likely amplifies the number of immune cells that secrete soluble factors in the inflamed area
to further promote β-cell proliferation and prevent progression of diabetes.
In summary, we report that CD4+ and CD8
+ T-cells secrete soluble factors that promote β-cell
replication in the NOD model of T1D. Therapeutic targeting of one or a combination of these
soluble factors may prove useful to delay and/or counter the progression of T1D by enhancing
functional β-cell mass.
ACKNOWLEDGMENTS
This work was supported by a Juvenile Diabetes Research Foundation (3-2010-474)
Fellowship and Turkish Diabetes, Obesity and Nutrition Association (Novartis Science
Award) to E.D.; some of the reagents were supported by National Institutes of Health Grant
RO1 DK 67536 to R.N.K. and the Joslin Diabetes Center Flow Cytometry Cores supported by
Diabetes Research Center Grant (NIH P30DK036836) and NIH PO1 AI054904 to D.M.
No potential conflicts of interest relevant to this article were reported.
E.D. and R.N.K. conceived the idea and designed the experiments. E.D. performed all
experiments, analyzed the data and wrote the manuscript; W.J. assisted in the adoptive
transfer experiments; S.K. and D.J.D.F. contributed to animal maintenance; S.K. and A.E.O.
assisted in islet isolation; A.K.K.T. assisted in the real time-PCR experiments; J.H. and D.K.
assisted in the immunohistochemical experiments; J.L.G. contributed to the flow cytometry
analysis and NOD.Raspberry studies; D.M. contributed to designing the experiments,
troubleshooting and the NOD.Raspberry studies and R.N.K supervised the project and wrote
the manuscript. R.N.K and E.D. are the guarantors of this work and, as such, had full access
to all the data in the study and takes the responsibility for the integrity of the data and the
accuracy of the data analysis.
Page 18 of 38Diabetes
19
The authors thank Gordon C. Weir, MD (Joslin Diabetes Center and Harvard Medical School,
Boston, MA), and Fumihiko Urano, MD, PhD (Washington University School of Medicine,
St.Louis, MO) for discussions and advice, and Olivia Lovegreen (Joslin Diabetes Center,
Boston, MA) for editorial assistance and the Specialized Assay Core (Joslin Diabetes Center,
MA) for hormone and metabolite analyses.
REFERENCES
1. Mathis D, Vence L, Benoist C: beta-Cell death during progression to diabetes. Nature
2001;414:792-798
2. Redondo MJ, Fain PR, Eisenbarth GS: Genetics of type 1A diabetes. Recent progress in hormone
research 2001;56:69-89
3. Turley S, Poirot L, Hattori M, Benoist C, Mathis D: Physiological beta cell death triggers priming of
self-reactive T cells by dendritic cells in a type-1 diabetes model. The Journal of experimental
medicine 2003;198:1527-1537
4. Sreenan S, Pick AJ, Levisetti M, Baldwin AC, Pugh W, Polonsky KS: Increased beta-cell proliferation
and reduced mass before diabetes onset in the nonobese diabetic mouse. Diabetes 1999;48:989-996
5. von Herrath MG, Wolfe T, Mohrle U, Coon B, Hughes A: Protection from type 1 diabetes in the face
of high levels of activated autoaggressive lymphocytes in a viral transgenic mouse model crossed to
the SV129 strain. Diabetes 2001;50:2700-2708
6. Sherry NA, Kushner JA, Glandt M, Kitamura T, Brillantes AM, Herold KC: Effects of autoimmunity
and immune therapy on beta-cell turnover in type 1 diabetes. Diabetes 2006;55:3238-3245
7. Nir T, Melton DA, Dor Y: Recovery from diabetes in mice by beta cell regeneration. The Journal of
clinical investigation 2007;117:2553-2561
8. Keenan HA, Sun JK, Levine J, Doria A, Aiello LP, Eisenbarth G, Bonner-Weir S, King GL: Residual
insulin production and pancreatic ss-cell turnover after 50 years of diabetes: Joslin Medalist Study.
Diabetes 2010;59:2846-2853
9. Meier JJ, Bhushan A, Butler AE, Rizza RA, Butler PC: Sustained beta cell apoptosis in patients with
long-standing type 1 diabetes: indirect evidence for islet regeneration? Diabetologia 2005;48:2221-
2228
10. Lee YC, Nielsen JH: Regulation of beta cell replication. Molecular and cellular endocrinology
2009;297:18-27
11. Meier JJ, Butler AE, Saisho Y, Monchamp T, Galasso R, Bhushan A, Rizza RA, Butler PC: Beta-cell
replication is the primary mechanism subserving the postnatal expansion of beta-cell mass in
humans. Diabetes 2008;57:1584-1594
12. Finegood DT, Scaglia L, Bonner-Weir S: Dynamics of beta-cell mass in the growing rat pancreas.
Estimation with a simple mathematical model. Diabetes 1995;44:249-256
13. Karnik SK, Chen H, McLean GW, Heit JJ, Gu X, Zhang AY, Fontaine M, Yen MH, Kim SK: Menin
controls growth of pancreatic beta-cells in pregnant mice and promotes gestational diabetes
mellitus. Science 2007;318:806-809
Page 19 of 38 Diabetes
20
14. Michael MD, Kulkarni RN, Postic C, Previs SF, Shulman GI, Magnuson MA, Kahn CR: Loss of insulin
signaling in hepatocytes leads to severe insulin resistance and progressive hepatic dysfunction.
Molecular cell 2000;6:87-97
15. Peshavaria M, Larmie BL, Lausier J, Satish B, Habibovic A, Roskens V, Larock K, Everill B, Leahy JL,
Jetton TL: Regulation of pancreatic beta-cell regeneration in the normoglycemic 60% partial-
pancreatectomy mouse. Diabetes 2006;55:3289-3298
16. Dirice E, Kulkarni RN: Pathways underlying β-cell regeneration in type 1, type 2 and gestational
diabetes. In Islet Cell Growth Factors Kulkarni RN, Ed. Texas, Landies Bioscience, 2011, p. 1-15
17. Maedler K, Schumann DM, Sauter N, Ellingsgaard H, Bosco D, Baertschiger R, Iwakura Y,
Oberholzer J, Wollheim CB, Gauthier BR, Donath MY: Low concentration of interleukin-1beta induces
FLICE-inhibitory protein-mediated beta-cell proliferation in human pancreatic islets. Diabetes
2006;55:2713-2722
18. Ellingsgaard H, Ehses JA, Hammar EB, Van Lommel L, Quintens R, Martens G, Kerr-Conte J, Pattou
F, Berney T, Pipeleers D, Halban PA, Schuit FC, Donath MY: Interleukin-6 regulates pancreatic alpha-
cell mass expansion. Proceedings of the National Academy of Sciences of the United States of
America 2008;105:13163-13168
19. Cameron MJ, Strathdee CA, Holmes KD, Arreaza GA, Dekaban GA, Delovitch TL: Biolistic-mediated
interleukin 4 gene transfer prevents the onset of type 1 diabetes. Human gene therapy
2000;11:1647-1656
20. Pennline KJ, Roque-Gaffney E, Monahan M: Recombinant human IL-10 prevents the onset of
diabetes in the nonobese diabetic mouse. Clinical immunology and immunopathology 1994;71:169-
175
21. Flodstrom-Tullberg M, Yadav D, Hagerkvist R, Tsai D, Secrest P, Stotland A, Sarvetnick N: Target
cell expression of suppressor of cytokine signaling-1 prevents diabetes in the NOD mouse. Diabetes
2003;52:2696-2700
22. Kulkarni RN, Winnay JN, Daniels M, Bruning JC, Flier SN, Hanahan D, Kahn CR: Altered function of
insulin receptor substrate-1-deficient mouse islets and cultured beta-cell lines. The Journal of clinical
investigation 1999;104:R69-75
23. Haxhinasto S, Mathis D, Benoist C: The AKT-mTOR axis regulates de novo differentiation of
CD4+Foxp3+ cells. The Journal of experimental medicine 2008;205:565-574
24. King AJ, Fernandes JR, Hollister-Lock J, Nienaber CE, Bonner-Weir S, Weir GC: Normal relationship
of beta- and non-beta-cells not needed for successful islet transplantation. Diabetes 2007;56:2312-
2318
25. Gonzalez A, Andre-Schmutz I, Carnaud C, Mathis D, Benoist C: Damage control, rather than
unresponsiveness, effected by protective DX5+ T cells in autoimmune diabetes. Nature immunology
2001;2:1117-1125
26. Fuchtenbusch M, Larger E, Thebault K, Boitard C: Transfer of diabetes from prediabetic NOD mice
to NOD-SCID/SCID mice: association with pancreatic insulin content. Hormone and metabolic
research = Hormon- und Stoffwechselforschung = Hormones et metabolisme 2005;37:63-67
27. Lehuen A, Diana J, Zaccone P, Cooke A: Immune cell crosstalk in type 1 diabetes. Nature reviews
Immunology 2010;10:501-513
28. Adorini L, Gregori S, Harrison LC: Understanding autoimmune diabetes: insights from mouse
models. Trends in molecular medicine 2002;8:31-38
29. Bluestone JA, Herold K, Eisenbarth G: Genetics, pathogenesis and clinical interventions in type 1
diabetes. Nature 2010;464:1293-1300
30. van Belle TL, Coppieters KT, von Herrath MG: Type 1 diabetes: etiology, immunology, and
therapeutic strategies. Physiological reviews 2011;91:79-118
31. Crawley JB, Rawlinson L, Lali FV, Page TH, Saklatvala J, Foxwell BM: T cell proliferation in response
to interleukins 2 and 7 requires p38MAP kinase activation. The Journal of biological chemistry
1997;272:15023-15027
Page 20 of 38Diabetes
21
32. Hanifi-Moghaddam P, Kappler S, Seissler J, Muller-Scholze S, Martin S, Roep BO, Strassburger K,
Kolb H, Schloot NC: Altered chemokine levels in individuals at risk of Type 1 diabetes mellitus.
Diabetic medicine : a journal of the British Diabetic Association 2006;23:156-163
33. Eizirik DL, Colli ML, Ortis F: The role of inflammation in insulitis and beta-cell loss in type 1
diabetes. Nature reviews Endocrinology 2009;5:219-226
34. Phillips JM, Parish NM, Raine T, Bland C, Sawyer Y, De La Pena H, Cooke A: Type 1 diabetes
development requires both CD4+ and CD8+ T cells and can be reversed by non-depleting antibodies
targeting both T cell populations. The review of diabetic studies : RDS 2009;6:97-103
35. Scaglia L, Cahill CJ, Finegood DT, Bonner-Weir S: Apoptosis participates in the remodeling of the
endocrine pancreas in the neonatal rat. Endocrinology 1997;138:1736-1741
36. Hu CY, Rodriguez-Pinto D, Du W, Ahuja A, Henegariu O, Wong FS, Shlomchik MJ, Wen L:
Treatment with CD20-specific antibody prevents and reverses autoimmune diabetes in mice. The
Journal of clinical investigation 2007;117:3857-3867
37. Jun HS, Yoon CS, Zbytnuik L, van Rooijen N, Yoon JW: The role of macrophages in T cell-mediated
autoimmune diabetes in nonobese diabetic mice. The Journal of experimental medicine
1999;189:347-358
38. Dahlen E, Dawe K, Ohlsson L, Hedlund G: Dendritic cells and macrophages are the first and major
producers of TNF-alpha in pancreatic islets in the nonobese diabetic mouse. Journal of immunology
1998;160:3585-3593
39. Khajah M, Millen B, Cara DC, Waterhouse C, McCafferty DM: Granulocyte-macrophage colony-
stimulating factor (GM-CSF): a chemoattractive agent for murine leukocytes in vivo. Journal of
leukocyte biology 2011;89:945-953
40. Codarri L, Gyulveszi G, Tosevski V, Hesske L, Fontana A, Magnenat L, Suter T, Becher B:
RORgammat drives production of the cytokine GM-CSF in helper T cells, which is essential for the
effector phase of autoimmune neuroinflammation. Nature immunology 2011;12:560-567
41. Huffnagle GB, Lipscomb MF, Lovchik JA, Hoag KA, Street NE: The role of CD4+ and CD8+ T cells in
the protective inflammatory response to a pulmonary cryptococcal infection. Journal of leukocyte
biology 1994;55:35-42
42. Rolfe BE, Campbell JH, Smith NJ, Cheong MW, Campbell GR: T lymphocytes affect smooth muscle
cell phenotype and proliferation. Arteriosclerosis, thrombosis, and vascular biology 1995;15:1204-
1210
43. Feldon SE, Park DJ, O'Loughlin CW, Nguyen VT, Landskroner-Eiger S, Chang D, Thatcher TH, Phipps
RP: Autologous T-lymphocytes stimulate proliferation of orbital fibroblasts derived from patients
with Graves' ophthalmopathy. Investigative ophthalmology & visual science 2005;46:3913-3921
44. Liou HC, Smith KA: The roles of c-rel and interleukin-2 in tolerance: a molecular explanation of
self-nonself discrimination. Immunology and cell biology 2011;89:27-32
45. Diehl S, Rincon M: The two faces of IL-6 on Th1/Th2 differentiation. Molecular immunology
2002;39:531-536
46. Maghazachi AA, Al-Aoukaty A, Schall TJ: CC chemokines induce the generation of killer cells from
CD56+ cells. European journal of immunology 1996;26:315-319
47. Maedler K, Sergeev P, Ris F, Oberholzer J, Joller-Jemelka HI, Spinas GA, Kaiser N, Halban PA,
Donath MY: Glucose-induced beta cell production of IL-1beta contributes to glucotoxicity in human
pancreatic islets. The Journal of clinical investigation 2002;110:851-860
48. Darville MI, Eizirik DL: Notch signaling: a mediator of beta-cell de-differentiation in diabetes?
Biochemical and biophysical research communications 2006;339:1063-1068
49. Russ HA, Bar Y, Ravassard P, Efrat S: In vitro proliferation of cells derived from adult human beta-
cells revealed by cell-lineage tracing. Diabetes 2008;57:1575-1583
50. Kay JE, Kromwel L, Doe SE, Denyer M: Inhibition of T and B lymphocyte proliferation by
rapamycin. Immunology 1991;72:544-549
Page 21 of 38 Diabetes
22
FIGURE LEGENDS
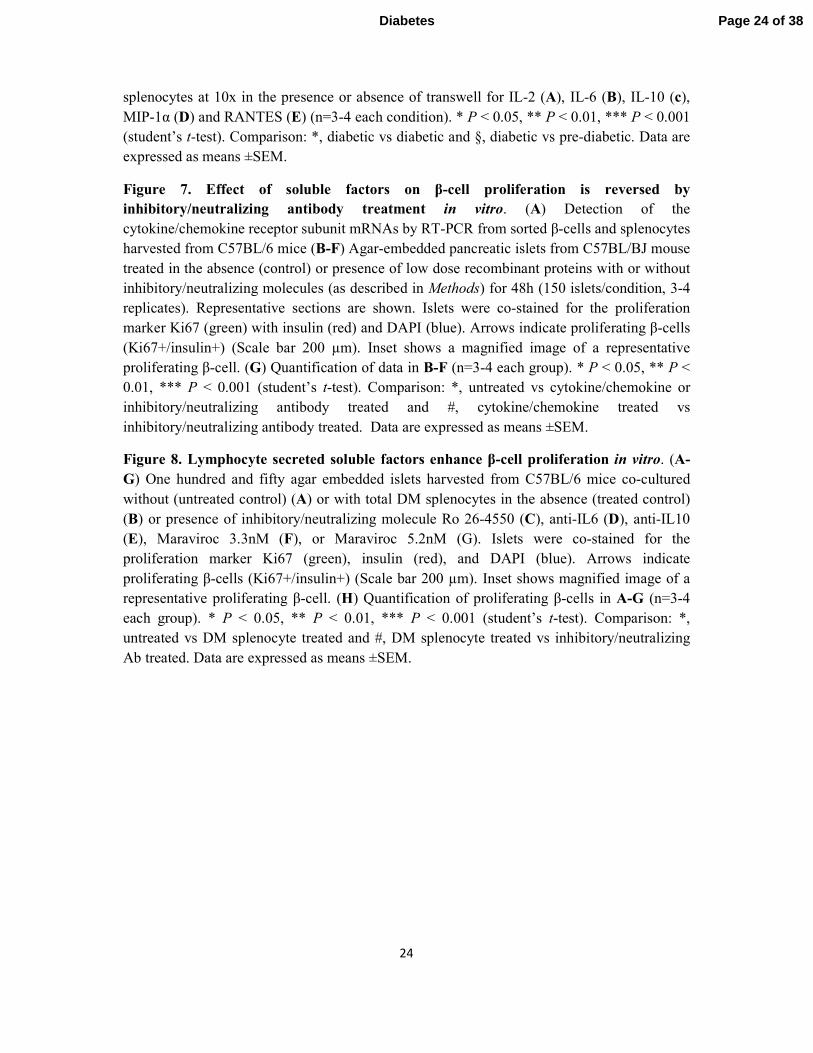
Figure 1. Adoptive transfer of diabetes stimulates β-cell proliferation in NOD.RAG1-/-
recipients. (A) Experimental strategy showing total splenocyte (DM or Pre-DM) or depleted
splenocyte (diabetic mice) transfer (1 x 10⁷ cells) into NOD.RAG1
-/- mice.
Bromodeoxyuridine (BrdU; 100mg/kg/b.wt) was injected three weeks post-transfer and 6
hours later the pancreases were harvested for immunohistochemical analyses. (B) Paraffin-
embedded sections of pancreas from mice receiving DM or Pre-DM splenocytes, co-stained
with proliferation markers BrdU, pHH3 or Ki67 with insulin and DAPI. (Scale bar 50 µm)
Arrows indicate proliferating β-cells (BrdU+/insulin+). Inset shows magnified view of
representative proliferating β-cells. (C-E) Quantification of data shown in B for BrdU (C),
pHH3 (D) and Ki67 (E) (n=4-16 mice each group). * P < 0.05, ** P < 0.01, *** P < 0.001
(student’s t-test). (F) TUNEL staining of paraffin-embedded sections of pancreatic tissues
obtained from recipient mice receiving DM or Pre-DM splenocytes for apoptosis detection.
(Scale bar 100 µm) Arrows indicate TUNEL+/β-cell+ cells undergoing apoptosis. Inset shows
a magnified representative image of TUNEL(+) β-cell. Lower image represents positive
control of TUNEL staining in rat tumor tissue. (G) Quantification of data in F. (n=4-6 mice
each group). Data are expressed as means ±SEM.
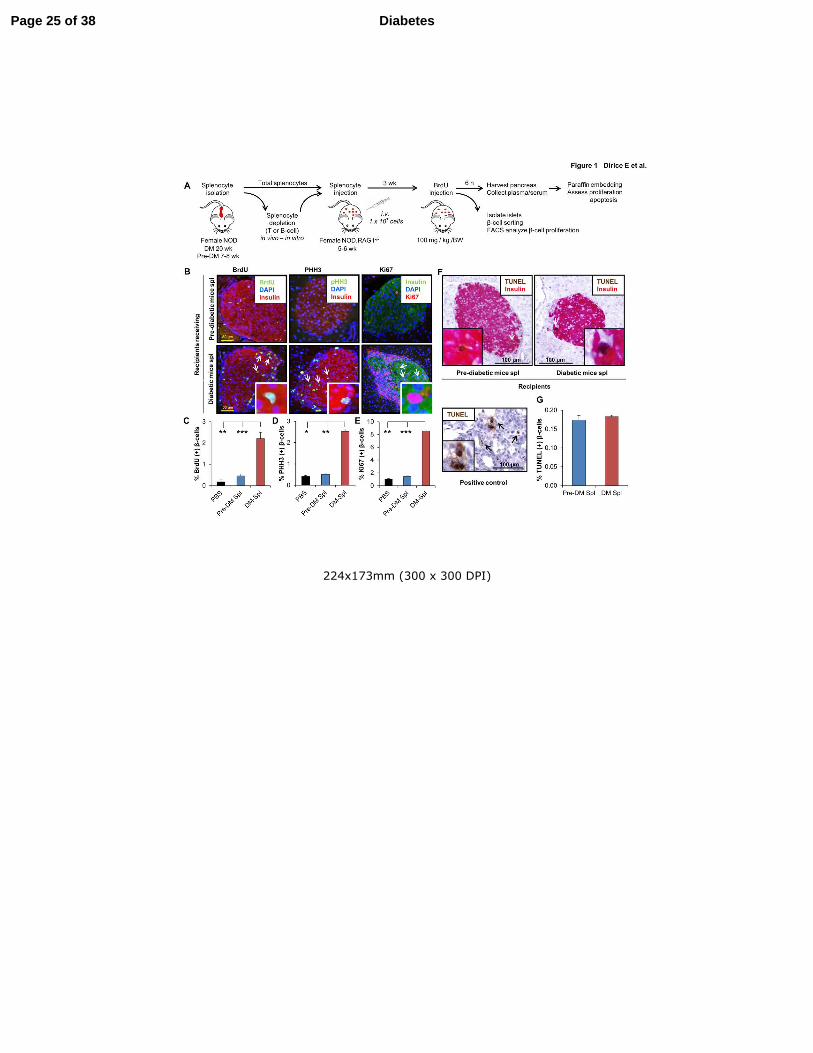
Figure 2. Confirmation of proliferating β-cells. (A-E) 2D (A) and 3D (B) confocal
microscopy view of pancreatic section derived from total diabetic NOD mouse splenocyte
injected animal. Magnified area highlighted from B shows 3D imaging of insulin (red) (C),
Ki67 (green) (D) and DAPI (blue) (E). (Scale bar 100 µm) Arrows indicate proliferating β-
cells. (F) Orthographic image of the same pancreatic section in A shows the horizontal and
vertical view of a proliferating β-cell in a circle (ZEN-2009). (G) Mouse spleen section
stained as positive control for F4/80 (green), common macrophage marker, and Ki67 (red).
(H) Total diabetic splenocyte injected NOD.RAG1-/-
pancreatic section stained for F4/80
(green), insulin (blue) and Ki67 (red) (Scale bar 100 µm). Arrows indicate proliferating β-
cells. (I,J) Magnified view of proliferating (I) and non-proliferating (J) macrophages from H.
(K) Mouse spleen section stained as positive control for CD3 (red), T-cell marker, and Ki67
(green). (L) Total diabetic splenocyte injected NOD.RAG1-/-
pancreatic section stained for
CD3 (red), insulin (blue) and Ki67 (green) (Scale bar 100 µm). (M,N) Magnified view of
proliferating T-cell (M) and β-cell (N) from L. (O) Sorting of β- and non-β-cells from
dispersed islets from mice following adoptive transfer of Pre-DM or DM splenocytes by flow
cytometry based on size (FS Lin) and autoflourescence (FL1). (P) Sorted β-cells stained for
CD45 and BrdU. (Q-S) Dot-plot showing gated out CD45+ cells (Q), and BrdU+ β-cells from
Pre-DM (R) or DM (S) splenocyte transferred mice. (T) Quantification of data in R and S.
(n=3 each group). ** P < 0.01. Experiment was performed in triplicate. Data are expressed as
means ±SEM.
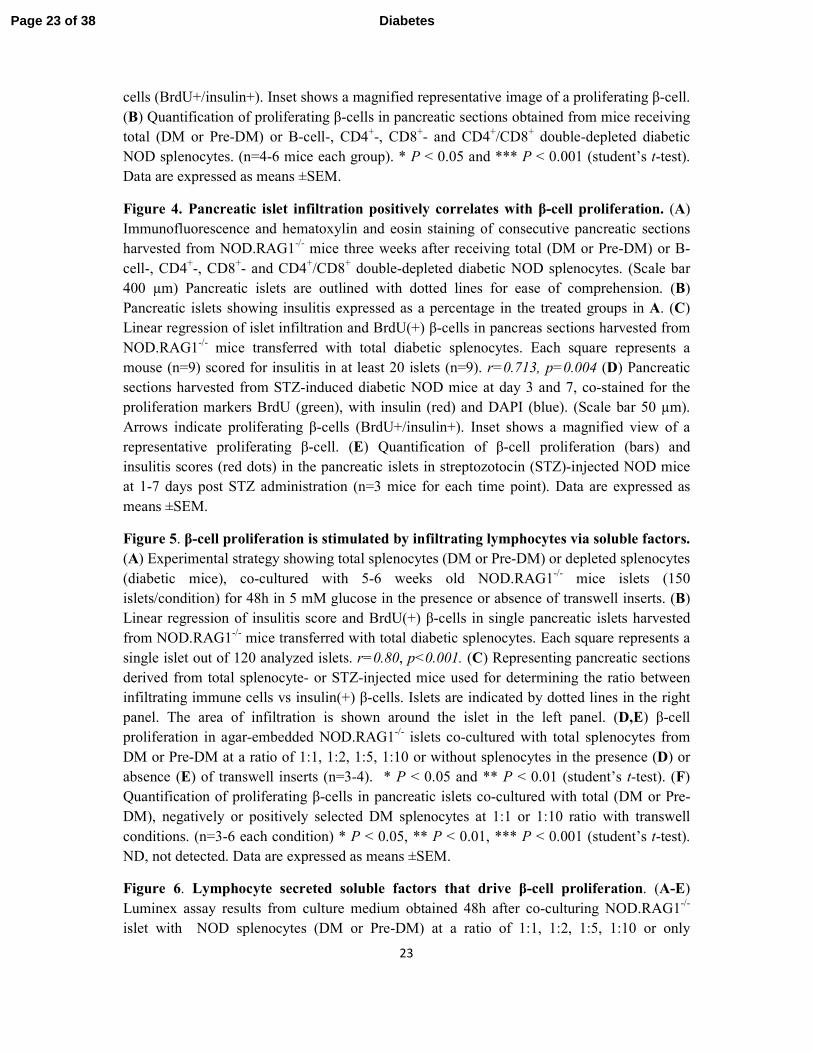
Figure 3. T-cell subsets play a major role in β-cell proliferation. (A) Paraffin-embedded
sections of pancreatic tissues derived from recipient mice receiving total diabetic or B-cell
depleted diabetic NOD mouse splenocytes, co-stained for the proliferation marker BrdU
(green) with insulin (red) and DAPI (blue). (Scale bar 50 µm) Arrows indicate proliferating β-
Page 22 of 38Diabetes
23
cells (BrdU+/insulin+). Inset shows a magnified representative image of a proliferating β-cell.
(B) Quantification of proliferating β-cells in pancreatic sections obtained from mice receiving
total (DM or Pre-DM) or B-cell-, CD4+-, CD8
+- and CD4
+/CD8
+ double-depleted diabetic
NOD splenocytes. (n=4-6 mice each group). * P < 0.05 and *** P < 0.001 (student’s t-test).
Data are expressed as means ±SEM.
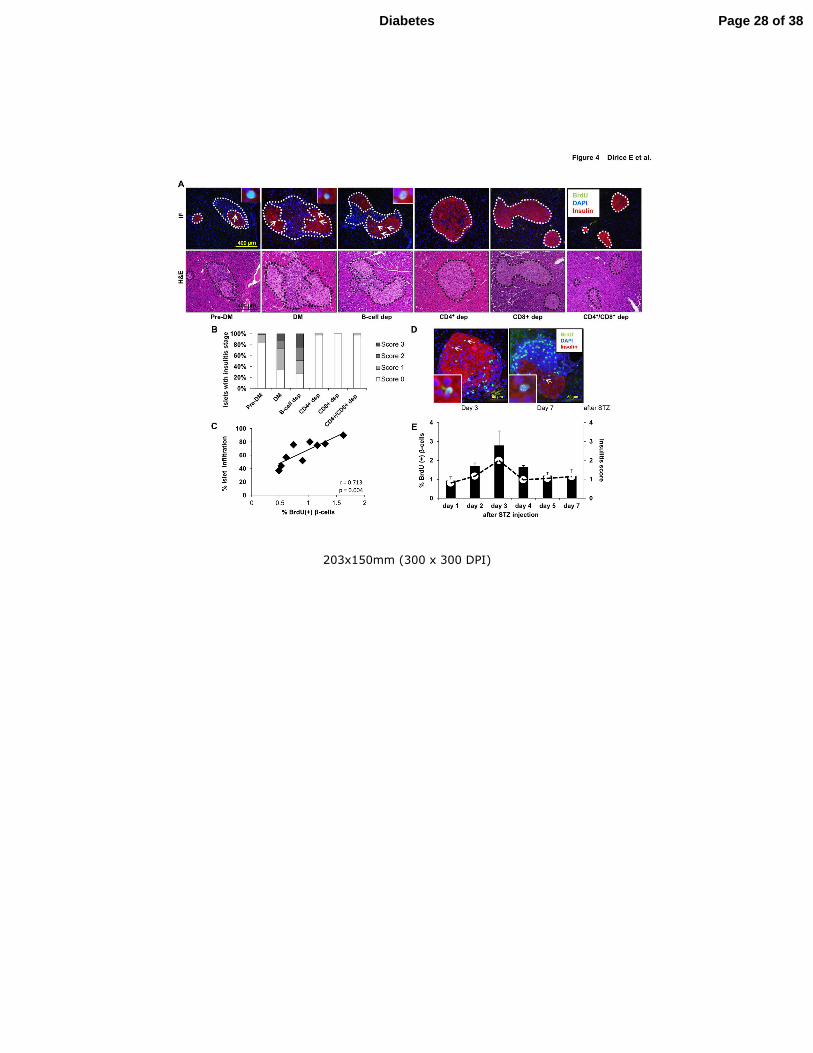
Figure 4. Pancreatic islet infiltration positively correlates with β-cell proliferation. (A)
Immunofluorescence and hematoxylin and eosin staining of consecutive pancreatic sections
harvested from NOD.RAG1-/-
mice three weeks after receiving total (DM or Pre-DM) or B-
cell-, CD4+-, CD8
+- and CD4
+/CD8
+ double-depleted diabetic NOD splenocytes. (Scale bar
400 µm) Pancreatic islets are outlined with dotted lines for ease of comprehension. (B)
Pancreatic islets showing insulitis expressed as a percentage in the treated groups in A. (C)
Linear regression of islet infiltration and BrdU(+) β-cells in pancreas sections harvested from
NOD.RAG1-/-
mice transferred with total diabetic splenocytes. Each square represents a
mouse (n=9) scored for insulitis in at least 20 islets (n=9). r=0.713, p=0.004 (D) Pancreatic
sections harvested from STZ-induced diabetic NOD mice at day 3 and 7, co-stained for the
proliferation markers BrdU (green), with insulin (red) and DAPI (blue). (Scale bar 50 µm).
Arrows indicate proliferating β-cells (BrdU+/insulin+). Inset shows a magnified view of a
representative proliferating β-cell. (E) Quantification of β-cell proliferation (bars) and
insulitis scores (red dots) in the pancreatic islets in streptozotocin (STZ)-injected NOD mice
at 1-7 days post STZ administration (n=3 mice for each time point). Data are expressed as
means ±SEM.
Figure 5. β-cell proliferation is stimulated by infiltrating lymphocytes via soluble factors.
(A) Experimental strategy showing total splenocytes (DM or Pre-DM) or depleted splenocytes
(diabetic mice), co-cultured with 5-6 weeks old NOD.RAG1-/-
mice islets (150
islets/condition) for 48h in 5 mM glucose in the presence or absence of transwell inserts. (B)
Linear regression of insulitis score and BrdU(+) β-cells in single pancreatic islets harvested
from NOD.RAG1-/-
mice transferred with total diabetic splenocytes. Each square represents a
single islet out of 120 analyzed islets. r=0.80, p<0.001. (C) Representing pancreatic sections
derived from total splenocyte- or STZ-injected mice used for determining the ratio between
infiltrating immune cells vs insulin(+) β-cells. Islets are indicated by dotted lines in the right
panel. The area of infiltration is shown around the islet in the left panel. (D,E) β-cell
proliferation in agar-embedded NOD.RAG1-/-
islets co-cultured with total splenocytes from
DM or Pre-DM at a ratio of 1:1, 1:2, 1:5, 1:10 or without splenocytes in the presence (D) or
absence (E) of transwell inserts (n=3-4). * P < 0.05 and ** P < 0.01 (student’s t-test). (F)
Quantification of proliferating β-cells in pancreatic islets co-cultured with total (DM or Pre-
DM), negatively or positively selected DM splenocytes at 1:1 or 1:10 ratio with transwell
conditions. (n=3-6 each condition) * P < 0.05, ** P < 0.01, *** P < 0.001 (student’s t-test).
ND, not detected. Data are expressed as means ±SEM.
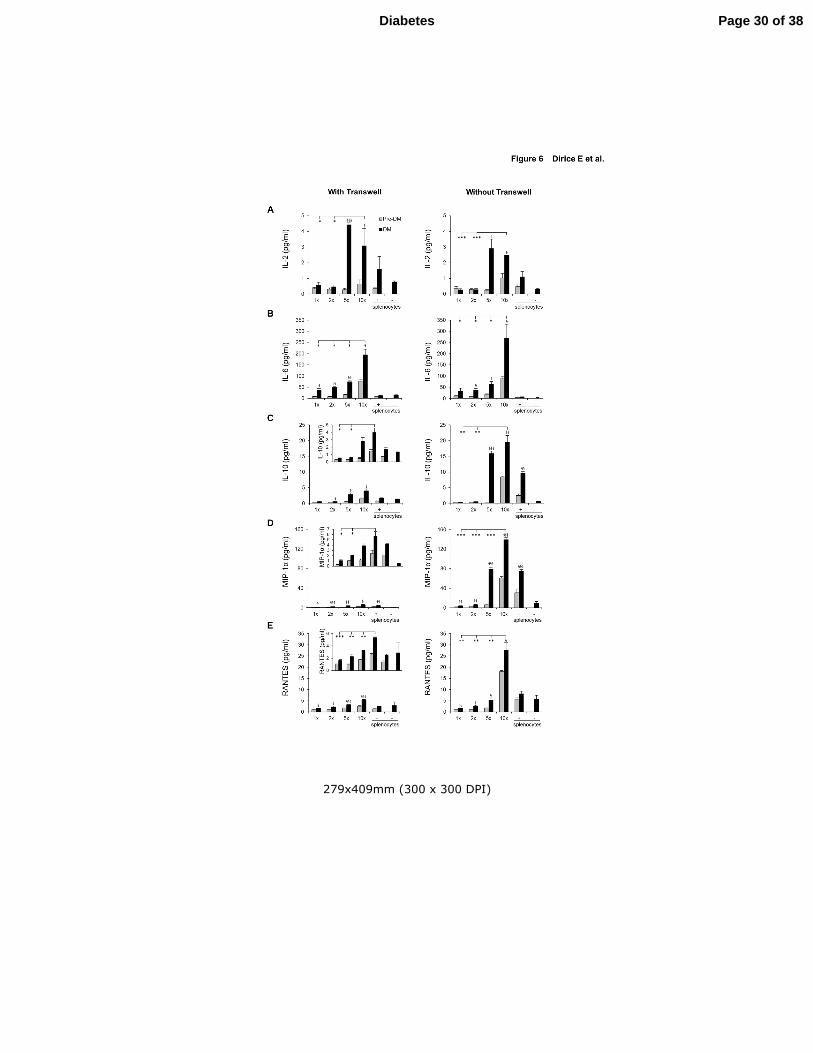
Figure 6. Lymphocyte secreted soluble factors that drive β-cell proliferation. (A-E)
Luminex assay results from culture medium obtained 48h after co-culturing NOD.RAG1-/-
islet with NOD splenocytes (DM or Pre-DM) at a ratio of 1:1, 1:2, 1:5, 1:10 or only
Page 23 of 38 Diabetes
24
splenocytes at 10x in the presence or absence of transwell for IL-2 (A), IL-6 (B), IL-10 (c),
MIP-1α (D) and RANTES (E) (n=3-4 each condition). * P < 0.05, ** P < 0.01, *** P < 0.001
(student’s t-test). Comparison: *, diabetic vs diabetic and §, diabetic vs pre-diabetic. Data are
expressed as means ±SEM.
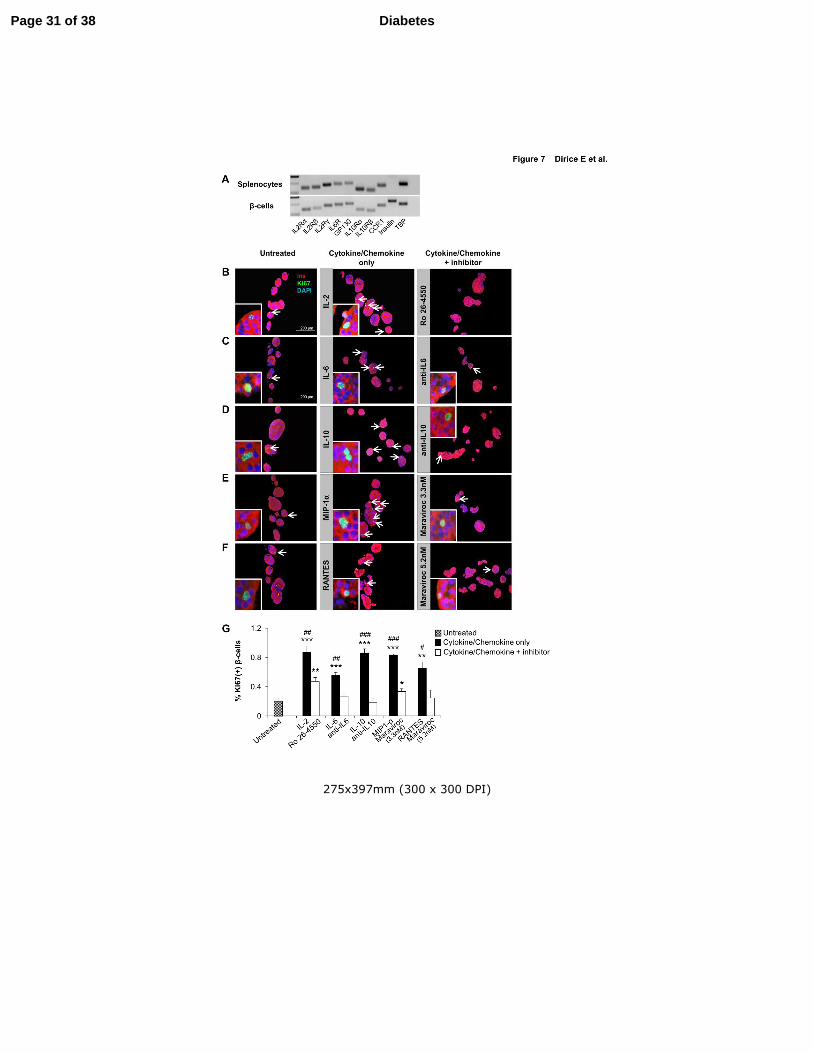
Figure 7. Effect of soluble factors on β-cell proliferation is reversed by
inhibitory/neutralizing antibody treatment in vitro. (A) Detection of the
cytokine/chemokine receptor subunit mRNAs by RT-PCR from sorted β-cells and splenocytes
harvested from C57BL/6 mice (B-F) Agar-embedded pancreatic islets from C57BL/BJ mouse
treated in the absence (control) or presence of low dose recombinant proteins with or without
inhibitory/neutralizing molecules (as described in Methods) for 48h (150 islets/condition, 3-4
replicates). Representative sections are shown. Islets were co-stained for the proliferation
marker Ki67 (green) with insulin (red) and DAPI (blue). Arrows indicate proliferating β-cells
(Ki67+/insulin+) (Scale bar 200 µm). Inset shows a magnified image of a representative
proliferating β-cell. (G) Quantification of data in B-F (n=3-4 each group). * P < 0.05, ** P <
0.01, *** P < 0.001 (student’s t-test). Comparison: *, untreated vs cytokine/chemokine or
inhibitory/neutralizing antibody treated and #, cytokine/chemokine treated vs
inhibitory/neutralizing antibody treated. Data are expressed as means ±SEM.
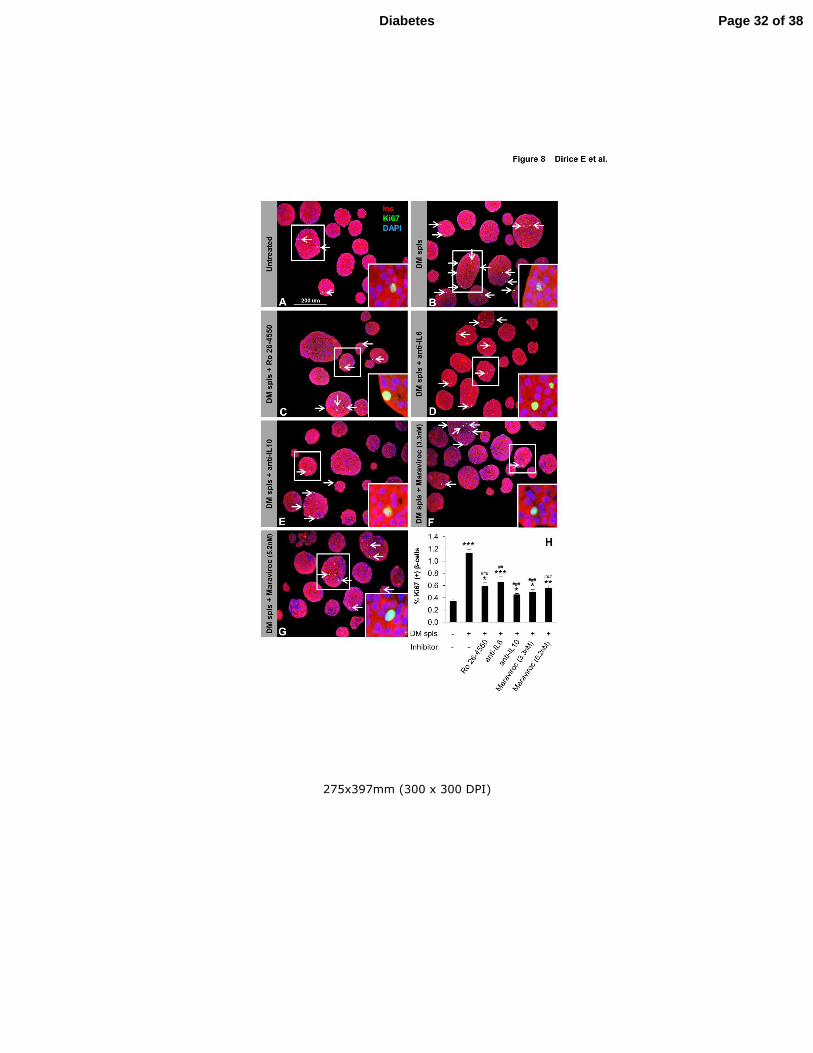
Figure 8. Lymphocyte secreted soluble factors enhance β-cell proliferation in vitro. (A-
G) One hundred and fifty agar embedded islets harvested from C57BL/6 mice co-cultured
without (untreated control) (A) or with total DM splenocytes in the absence (treated control)
(B) or presence of inhibitory/neutralizing molecule Ro 26-4550 (C), anti-IL6 (D), anti-IL10
(E), Maraviroc 3.3nM (F), or Maraviroc 5.2nM (G). Islets were co-stained for the
proliferation marker Ki67 (green), insulin (red), and DAPI (blue). Arrows indicate
proliferating β-cells (Ki67+/insulin+) (Scale bar 200 µm). Inset shows magnified image of a
representative proliferating β-cell. (H) Quantification of proliferating β-cells in A-G (n=3-4
each group). * P < 0.05, ** P < 0.01, *** P < 0.001 (student’s t-test). Comparison: *,
untreated vs DM splenocyte treated and #, DM splenocyte treated vs inhibitory/neutralizing
Ab treated. Data are expressed as means ±SEM.
Page 24 of 38Diabetes
224x173mm (300 x 300 DPI)
Page 25 of 38 Diabetes
275x397mm (300 x 300 DPI)
Page 26 of 38Diabetes

275x397mm (300 x 300 DPI)
Page 27 of 38 Diabetes
203x150mm (300 x 300 DPI)
Page 28 of 38Diabetes

203x150mm (300 x 300 DPI)
Page 29 of 38 Diabetes
279x409mm (300 x 300 DPI)
Page 30 of 38Diabetes
275x397mm (300 x 300 DPI)
Page 31 of 38 Diabetes
275x397mm (300 x 300 DPI)
Page 32 of 38Diabetes
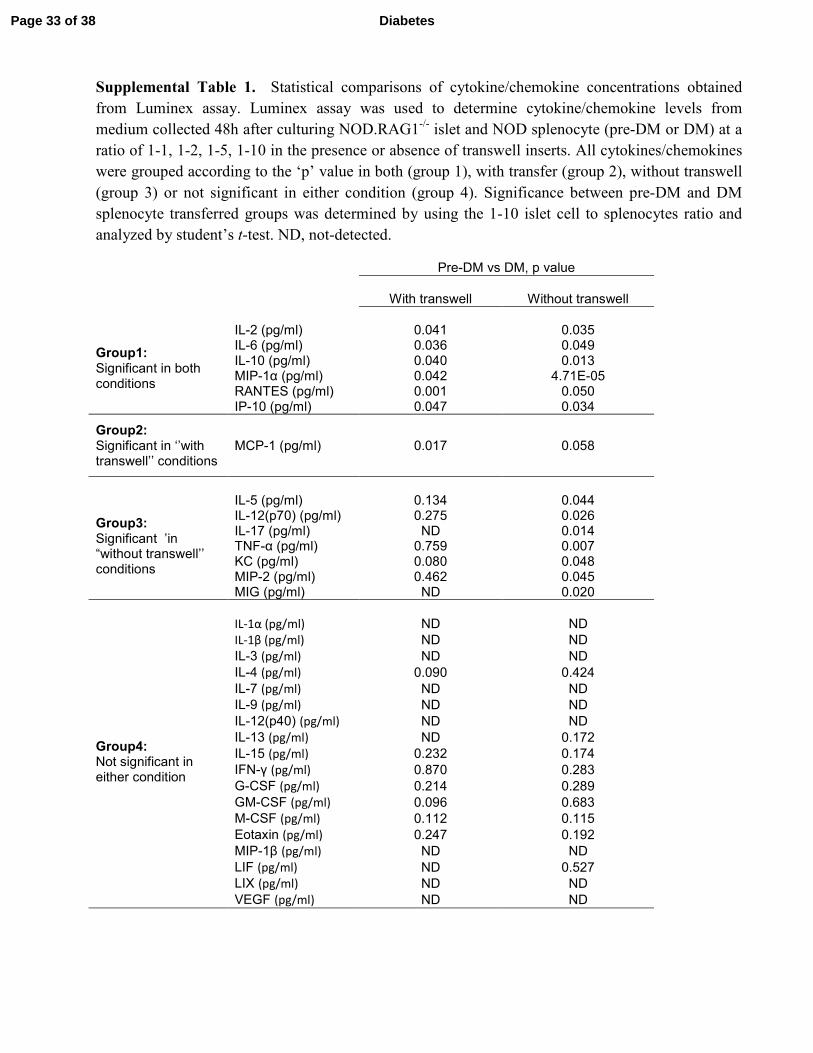
Supplemental Table 1. Statistical comparisons of cytokine/chemokine concentrations obtained
from Luminex assay. Luminex assay was used to determine cytokine/chemokine levels from
medium collected 48h after culturing NOD.RAG1-/-
islet and NOD splenocyte (pre-DM or DM) at a
ratio of 1-1, 1-2, 1-5, 1-10 in the presence or absence of transwell inserts. All cytokines/chemokines
were grouped according to the ‘p’ value in both (group 1), with transfer (group 2), without transwell
(group 3) or not significant in either condition (group 4). Significance between pre-DM and DM
splenocyte transferred groups was determined by using the 1-10 islet cell to splenocytes ratio and
analyzed by student’s t-test. ND, not-detected.
Pre-DM vs DM, p value
With transwell Without transwell
Group1: Significant in both conditions
IL-2 (pg/ml) 0.041 0.035 IL-6 (pg/ml) 0.036 0.049 IL-10 (pg/ml) 0.040 0.013 MIP-1α (pg/ml) 0.042 4.71E-05 RANTES (pg/ml) 0.001 0.050 IP-10 (pg/ml) 0.047 0.034
Group2: Significant in ‘’with transwell’’ conditions
MCP-1 (pg/ml) 0.017 0.058
Group3: Significant ’in “without transwell’’ conditions
IL-5 (pg/ml) 0.134 0.044 IL-12(p70) (pg/ml) 0.275 0.026 IL-17 (pg/ml) ND 0.014 TNF-α (pg/ml) 0.759 0.007 KC (pg/ml) 0.080 0.048 MIP-2 (pg/ml) 0.462 0.045 MIG (pg/ml) ND 0.020
Group4: Not significant in either condition
IL-1α (pg/ml) ND ND
IL-1β (pg/ml) ND ND
IL-3 (pg/ml) ND ND
IL-4 (pg/ml) 0.090 0.424
IL-7 (pg/ml) ND ND
IL-9 (pg/ml) ND ND
IL-12(p40) (pg/ml) ND ND
IL-13 (pg/ml) ND 0.172
IL-15 (pg/ml) 0.232 0.174
IFN-γ (pg/ml) 0.870 0.283
G-CSF (pg/ml) 0.214 0.289
GM-CSF (pg/ml) 0.096 0.683
M-CSF (pg/ml) 0.112 0.115
Eotaxin (pg/ml) 0.247 0.192
MIP-1β (pg/ml) ND ND
LIF (pg/ml) ND 0.527
LIX (pg/ml) ND ND
VEGF (pg/ml) ND ND
Page 33 of 38 Diabetes
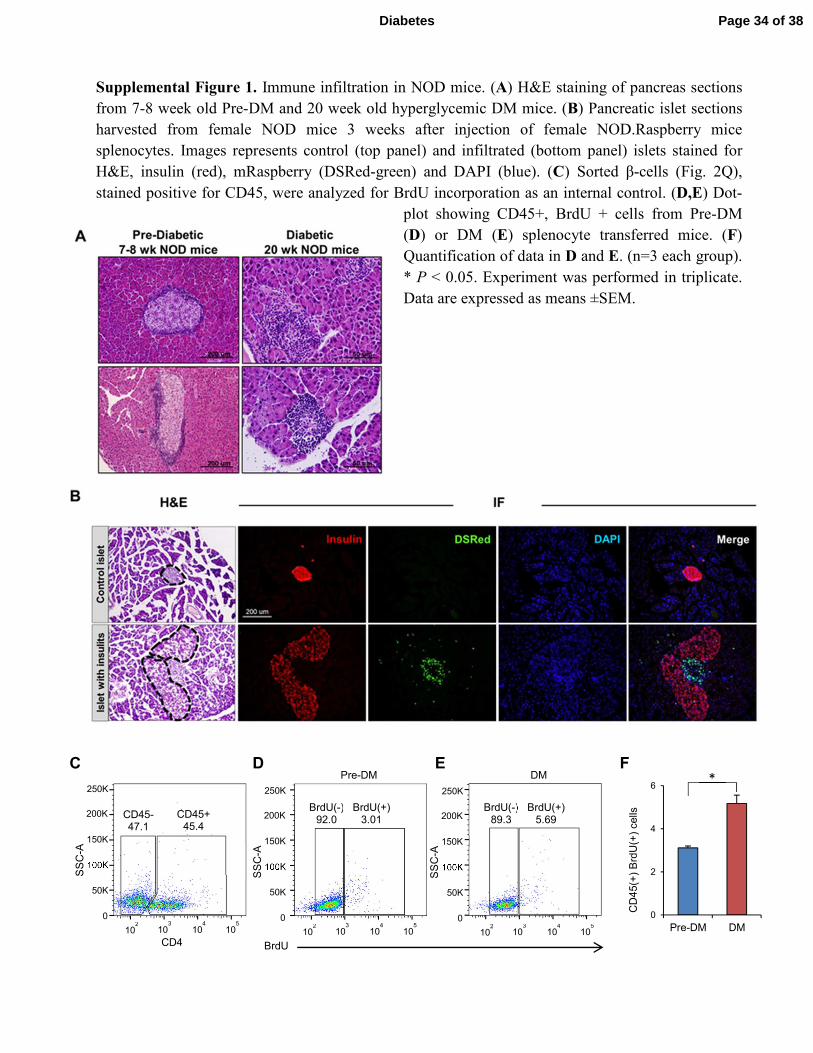
Supplemental Figure 1. Immune infiltration in NOD mice. (A) H&E staining of pancreas sections
from 7-8 week old Pre-DM and 20 week old hyperglycemic DM mice. (B) Pancreatic islet sections
harvested from female NOD mice 3 weeks after injection of female NOD.Raspberry mice
splenocytes. Images represents control (top panel) and infiltrated (bottom panel) islets stained for
H&E, insulin (red), mRaspberry (DSRed-green) and DAPI (blue). (C) Sorted β-cells (Fig. 2Q),
stained positive for CD45, were analyzed for BrdU incorporation as an internal control. (D,E) Dot-
plot showing CD45+, BrdU + cells from Pre-DM
(D) or DM (E) splenocyte transferred mice. (F)
Quantification of data in D and E. (n=3 each group).
* P < 0.05. Experiment was performed in triplicate.
Data are expressed as means ±SEM.
C
0
50K
100K
150K
200K
250K
SS
C-A
102
103
104
105
CD45- 47.1
CD45+ 45.4
CD4
D E Pre-DM DM
0
50K
100K
150K
200K
250K
SS
C-A
102
103
104
105
0
50K
100K
150K
200K
250K
SS
C-A
102
103
104
105
BrdU(-) 92.0
BrdU(+) 3.01
BrdU(-) 89.3
BrdU(+) 5.69
BrdU
0
2
4
6
Pre-DM DM
CD
45(+
) B
rdU
(+)
cells
* F
Page 34 of 38Diabetes
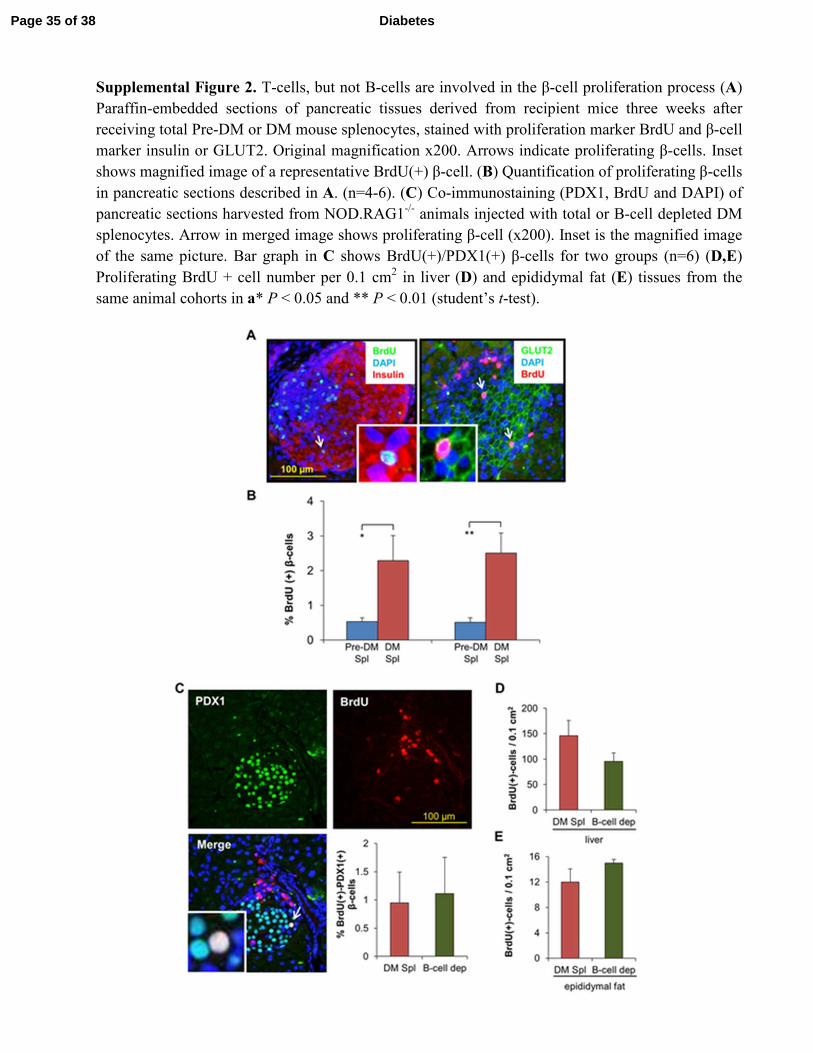
Supplemental Figure 2. T-cells, but not B-cells are involved in the β-cell proliferation process (A)
Paraffin-embedded sections of pancreatic tissues derived from recipient mice three weeks after
receiving total Pre-DM or DM mouse splenocytes, stained with proliferation marker BrdU and β-cell
marker insulin or GLUT2. Original magnification x200. Arrows indicate proliferating β-cells. Inset
shows magnified image of a representative BrdU(+) β-cell. (B) Quantification of proliferating β-cells
in pancreatic sections described in A. (n=4-6). (C) Co-immunostaining (PDX1, BrdU and DAPI) of
pancreatic sections harvested from NOD.RAG1-/-
animals injected with total or B-cell depleted DM
splenocytes. Arrow in merged image shows proliferating β-cell (x200). Inset is the magnified image
of the same picture. Bar graph in C shows BrdU(+)/PDX1(+) β-cells for two groups (n=6) (D,E)
Proliferating BrdU + cell number per 0.1 cm2 in liver (D) and epididymal fat (E) tissues from the
same animal cohorts in a* P < 0.05 and ** P < 0.01 (student’s t-test).
Page 35 of 38 Diabetes
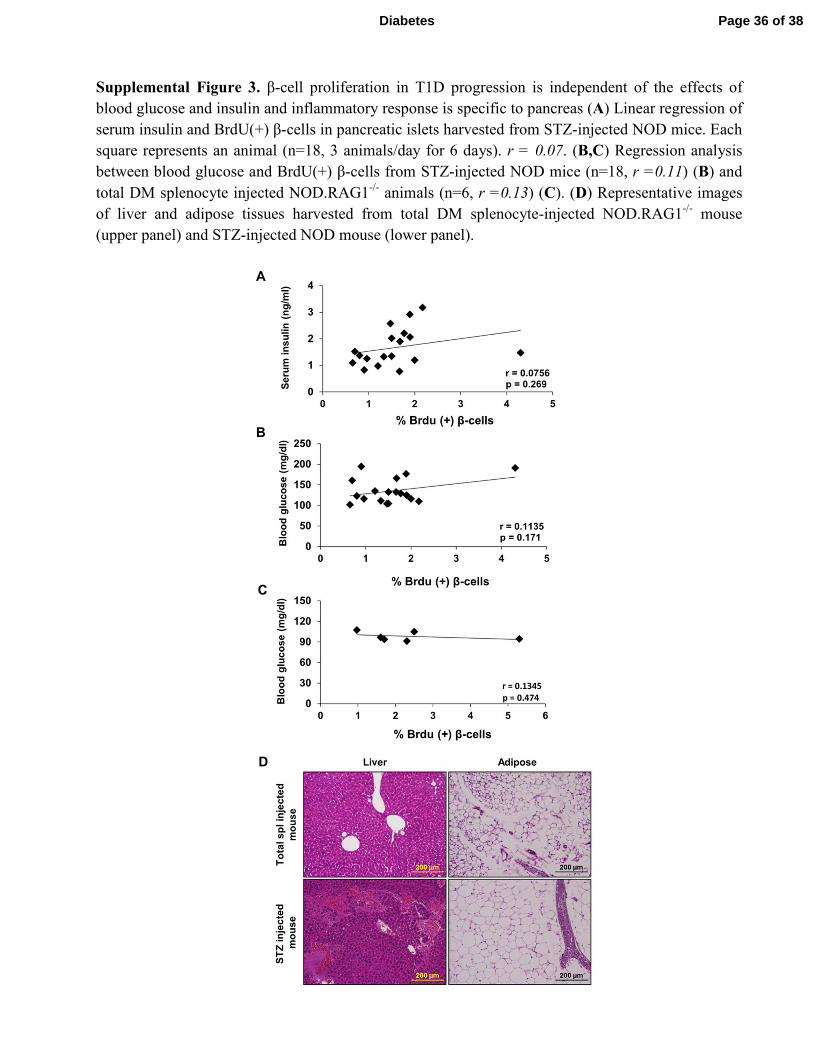
Supplemental Figure 3. β-cell proliferation in T1D progression is independent of the effects of
blood glucose and insulin and inflammatory response is specific to pancreas (A) Linear regression of
serum insulin and BrdU(+) β-cells in pancreatic islets harvested from STZ-injected NOD mice. Each
square represents an animal (n=18, 3 animals/day for 6 days). r = 0.07. (B,C) Regression analysis
between blood glucose and BrdU(+) β-cells from STZ-injected NOD mice (n=18, r =0.11) (B) and
total DM splenocyte injected NOD.RAG1-/-
animals (n=6, r =0.13) (C). (D) Representative images
of liver and adipose tissues harvested from total DM splenocyte-injected NOD.RAG1-/-
mouse
(upper panel) and STZ-injected NOD mouse (lower panel).
Page 36 of 38Diabetes
0.0
0.4
0.8
1.2
1.6
% K
i67 (
+)
β-c
ells
*
** **
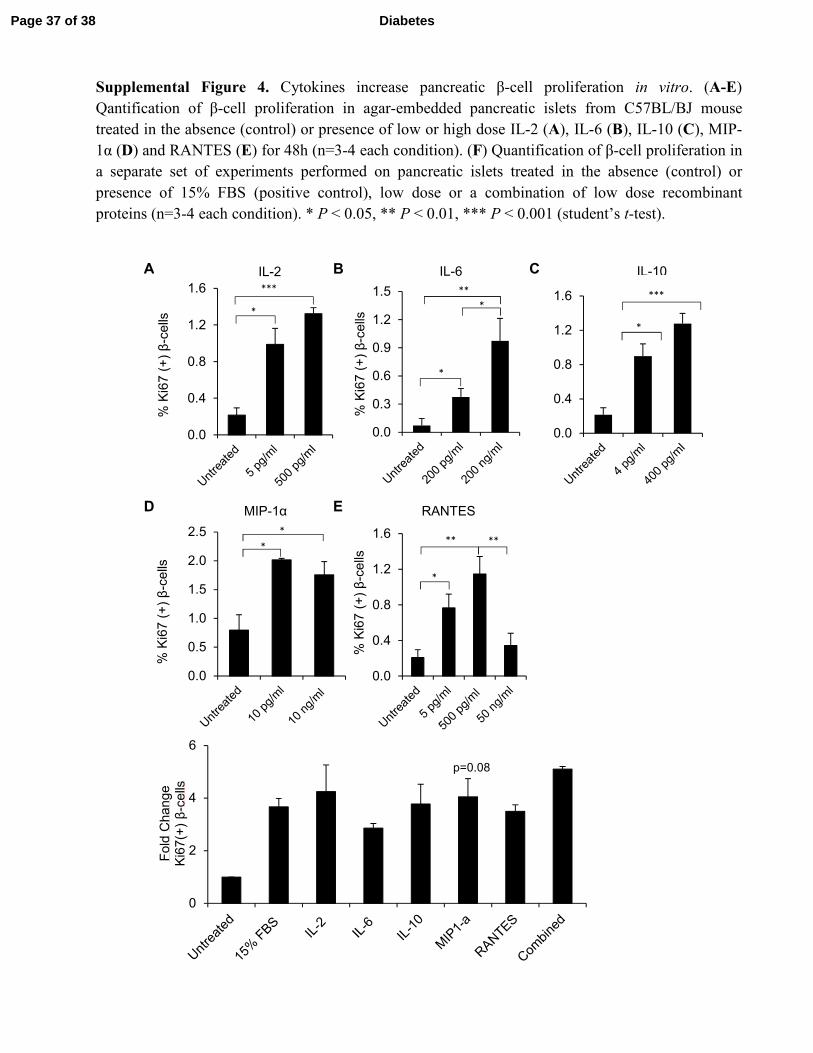
Supplemental Figure 4. Cytokines increase pancreatic β-cell proliferation in vitro. (A-E)
Qantification of β-cell proliferation in agar-embedded pancreatic islets from C57BL/BJ mouse
treated in the absence (control) or presence of low or high dose IL-2 (A), IL-6 (B), IL-10 (C), MIP-
1α (D) and RANTES (E) for 48h (n=3-4 each condition). (F) Quantification of β-cell proliferation in
a separate set of experiments performed on pancreatic islets treated in the absence (control) or
presence of 15% FBS (positive control), low dose or a combination of low dose recombinant
proteins (n=3-4 each condition). * P < 0.05, ** P < 0.01, *** P < 0.001 (student’s t-test).
B
E
C
D
A
F
*
* *
***
IL-2 IL-6 IL-10
MIP-1α RANTES
0.0
0.4
0.8
1.2
1.6
% K
i67 (
+)
β-c
ells
***
*
0.0
0.4
0.8
1.2
1.6
% K
i67 (
+)
β-c
ells
***
*
0.0
0.5
1.0
1.5
2.0
2.5
% K
i67 (
+)
β-c
ells
* *
0
2
4
6
Fold
Change
Ki6
7(+
) β
-cells
p=0.08
0.0
0.3
0.6
0.9
1.2
1.5
% K
i67 (
+)
β-c
ells
* **
*
Page 37 of 38 Diabetes
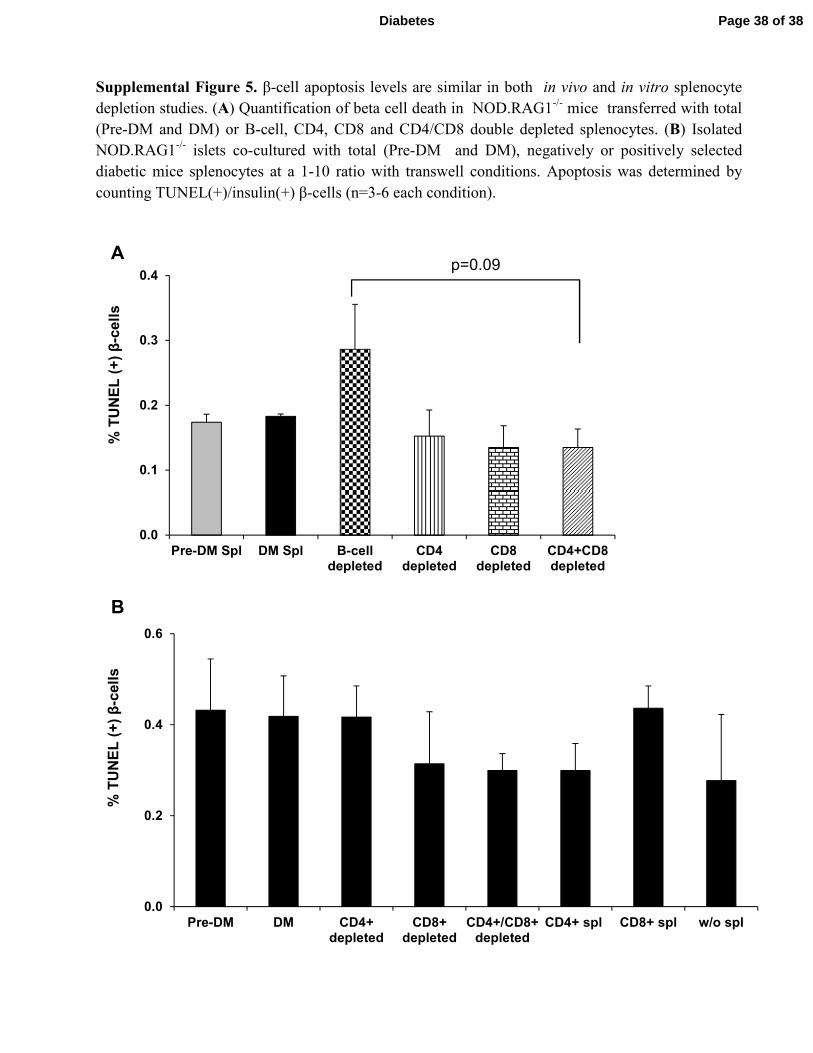
Supplemental Figure 5. β-cell apoptosis levels are similar in both in vivo and in vitro splenocyte
depletion studies. (A) Quantification of beta cell death in NOD.RAG1-/-
mice transferred with total
(Pre-DM and DM) or B-cell, CD4, CD8 and CD4/CD8 double depleted splenocytes. (B) Isolated
NOD.RAG1-/-
islets co-cultured with total (Pre-DM and DM), negatively or positively selected
diabetic mice splenocytes at a 1-10 ratio with transwell conditions. Apoptosis was determined by
counting TUNEL(+)/insulin(+) β-cells (n=3-6 each condition).
0.0
0.2
0.4
0.6
Pre-DM DM CD4+depleted
CD8+depleted
CD4+/CD8+depleted
CD4+ spl CD8+ spl w/o spl
% T
UN
EL
(+
) β
-cell
s
0.0
0.1
0.2
0.3
0.4
Pre-DM Spl DM Spl B-celldepleted
CD4depleted
CD8depleted
CD4+CD8depleted
% T
UN
EL
(+
) β
-cell
s
p=0.09 A
B
Page 38 of 38Diabetes