SOCIETY, SUSTAINABILITY, AND THE GLOBAL CONCRETE …
22
1 51° Congresso Brasileiro do Concreto IBRACOM 2009 Curitiba, Brasil Oct. 08, 2009 SOCIETY, SUSTAINABILITY, AND THE GLOBAL CONCRETE INDUSTRY P.K. Mehta Professor Emeritus Civil and Environmental Engineering University of California, Berkeley Topics I. STATE OF THE WORLD TODAY A O i – An Overview II. THE MOST URGENT SUSTAINABILITY ISSUE – Climate change (global warming) III. CEMENT AND CONCRETE INDUSTRIES’ CARBON EMISSIONS. Direct carbon CARBON EMISSIONS. Direct carbon emissions from cement kilns (2x10 9 T/y) IV. TOOLS FOR CUTTING CARBON EMISSIONS BY A HALF IN 20 YEARS
Transcript of SOCIETY, SUSTAINABILITY, AND THE GLOBAL CONCRETE …

1
51° Congresso Brasileiro do Concreto IBRACOM 2009Curitiba, BrasilOct. 08, 2009
SOCIETY, SUSTAINABILITY, AND THE GLOBAL CONCRETE
INDUSTRY
P.K. MehtaProfessor EmeritusCivil and Environmental EngineeringUniversity of California, Berkeley
Topics
I. STATE OF THE WORLD TODAY
A O i– An Overview
II. THE MOST URGENT SUSTAINABILITY ISSUE – Climate change (global warming)
III. CEMENT AND CONCRETE INDUSTRIES’ CARBON EMISSIONS. Direct carbon CARBON EMISSIONS. Direct carbon emissions from cement kilns (2x10⁹ T/y)
IV. TOOLS FOR CUTTING CARBON EMISSIONS BY A HALF IN 20 YEARS

2
I. STATE OF THE WORLD TODAY
CROWDED
FLAT
HOT
Thomas Friedman(2008)
HOT
THE CROWDED WORLD
THE 20TH CENTURY POPULATION EXPLOSION: FROM ONE TO SIX BILLION PEOPLE.TODAY’S POPULATION IS ABOUT 7 BILLION TODAY S POPULATION IS ABOUT 7 BILLION, AND IS PROJECTED TO GROW TO 10 BILLION DURING THIS CENTURY
ALMOST HALF OF THE PEOPLE ON THE PLANET LIVE IN A FEW DEVELOPED NATIONS (e.g. USA, JAPAN, EU, AUSTRALIA) AND FOUR COUNTRIES WITH LARGE POPULATIONS, THAT ARE ALSO RAPIDLY DEVELOPING (CHINA, INDIA, BRAZIL, INDONESIA)

3
THE CROWDED AND FLAT WORLD
As a result of globalization of the American Model of Economic Development, the pdeveloping countries like China and India have achieved fast economic growth rates in two to three decades by rapid industrialization, with little attention to environmental pollution from huge volumes environmental pollution from huge volumes of solid, liquid, and gaseous wastes.
- continued
- continued, The Crowded and Flat World
Many overcrowded large cities (>10 million), including 15 megacities (>15 million) are located in the developed and rapidly developing countries. Today, more than 3 billion people live in and around large towns and cities.
Even before the end of the 20th century, it was realized that economic growth supported by wasteful technologies, and a life-style of wasteful consumption by affluent sections of
i t i NOT SUSTAINABLEsociety, is NOT SUSTAINABLE.Before running out of non-renewable resources, already the Earth has run out of space for safe disposal of polluents (e.g. CO2). Therefore, we need a new definition of sustainability.
4
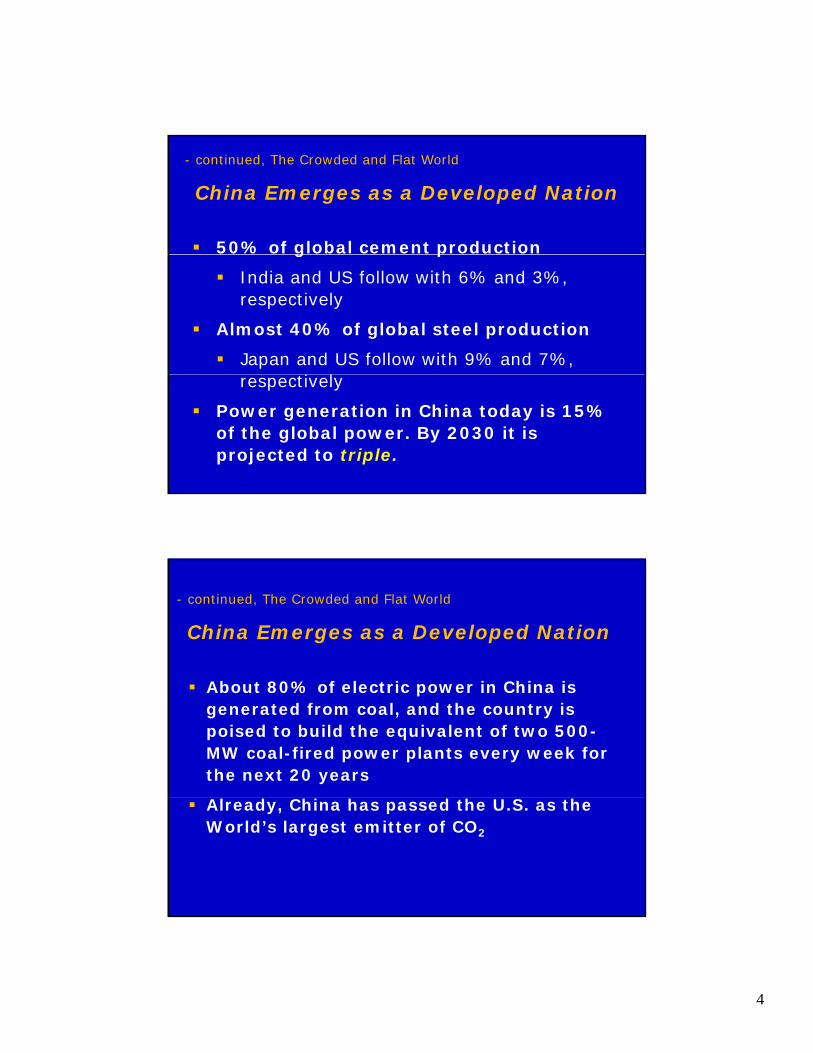
- continued, The Crowded and Flat World
China Emerges as a Developed Nation
50% of global cement production g p
India and US follow with 6% and 3%, respectively
Almost 40% of global steel production
Japan and US follow with 9% and 7%, lrespectively
Power generation in China today is 15% of the global power. By 2030 it is projected to triple.
- continued, The Crowded and Flat World
China Emerges as a Developed Nation
About 80% of electric power in China is generated from coal, and the country is poised to build the equivalent of two 500-MW coal-fired power plants every week for the next 20 years
Already, China has passed the U.S. as the World’s largest emitter of CO2
5
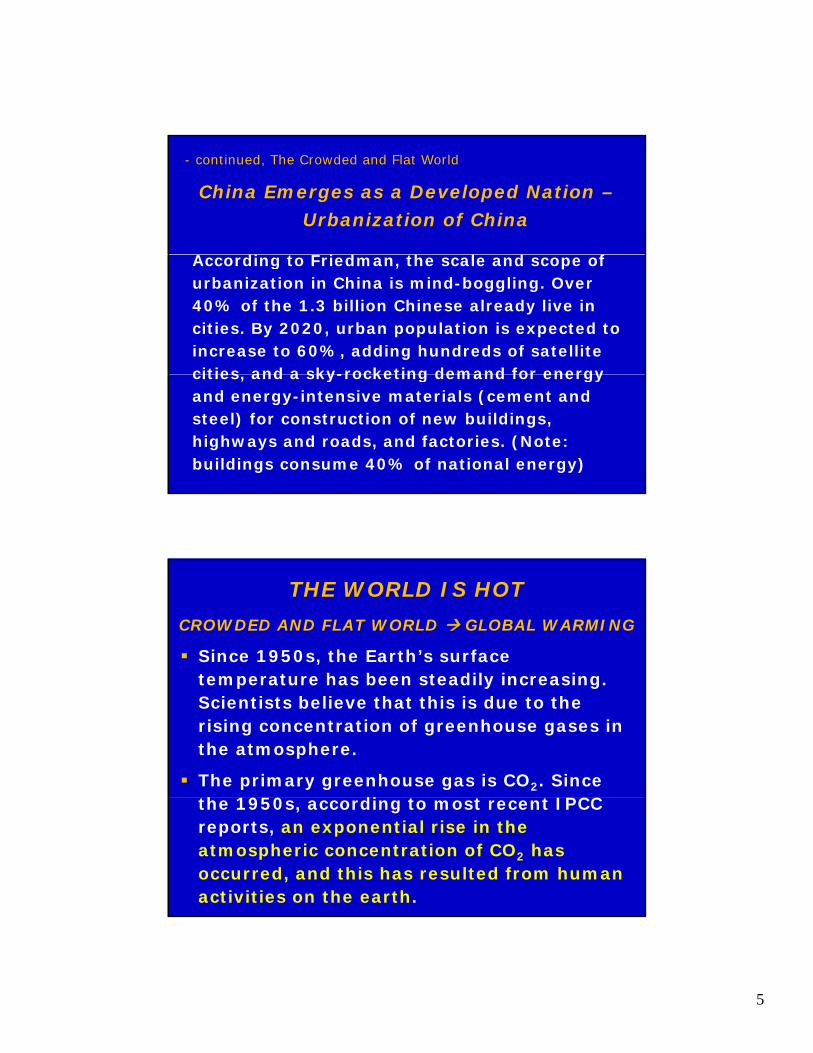
- continued, The Crowded and Flat World
China Emerges as a Developed Nation –Urbanization of China
A di F i d h l d f According to Friedman, the scale and scope of urbanization in China is mind-boggling. Over 40% of the 1.3 billion Chinese already live in cities. By 2020, urban population is expected to increase to 60%, adding hundreds of satellite cities and a sky-rocketing demand for energy cities, and a sky-rocketing demand for energy and energy-intensive materials (cement and steel) for construction of new buildings, highways and roads, and factories. (Note: buildings consume 40% of national energy)
THE WORLD IS HOTCROWDED AND FLAT WORLD GLOBAL WARMING
Since 1950s, the Earth’s surface temperature has been steadily increasing temperature has been steadily increasing. Scientists believe that this is due to the rising concentration of greenhouse gases in the atmosphere.
The primary greenhouse gas is CO2. Since th 1950 di t t t IPCC the 1950s, according to most recent IPCC reports, an exponential rise in the atmospheric concentration of CO2 has occurred, and this has resulted from human activities on the earth.
6
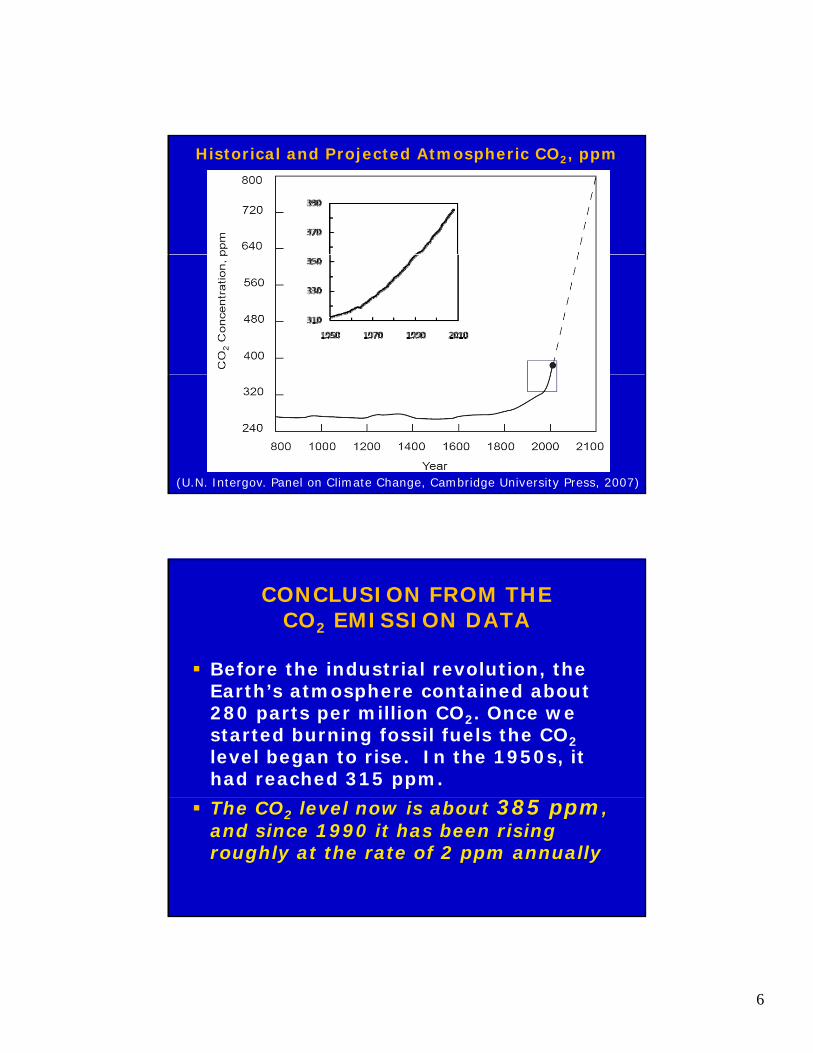
Historical and Projected Atmospheric CO2, ppm
(U.N. Intergov. Panel on Climate Change, Cambridge University Press, 2007)
CONCLUSION FROM THE CO2 EMISSION DATA
Before the industrial revolution, the ,Earth’s atmosphere contained about 280 parts per million CO2. Once we started burning fossil fuels the CO2level began to rise. In the 1950s, it had reached 315 ppm.The CO2 level now is about 385 ppm, and since 1990 it has been rising roughly at the rate of 2 ppm annually
7
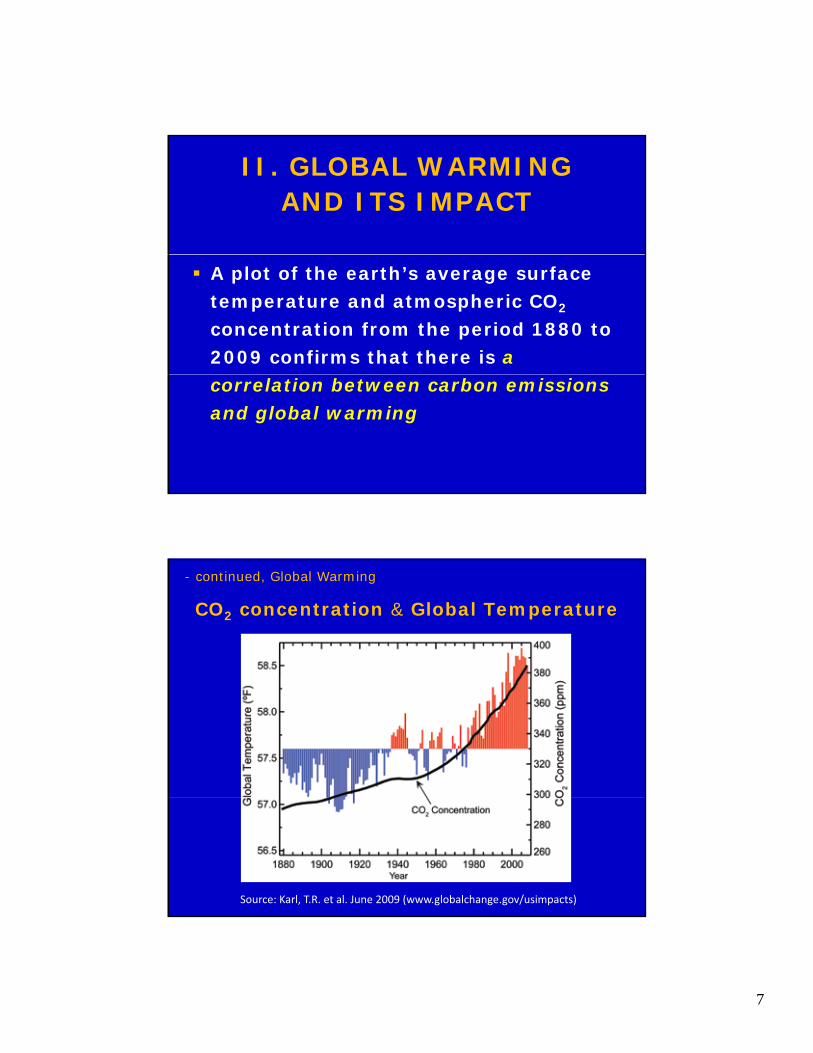
II. GLOBAL WARMING AND ITS IMPACT
A plot of the earth’s average surface temperature and atmospheric CO2
concentration from the period 1880 to 2009 confirms that there is a correlation between carbon emissions and global warming
CO2 concentration & Global Temperature
- continued, Global Warming
Source: Karl, T.R. et al. June 2009 (www.globalchange.gov/usimpacts)
8
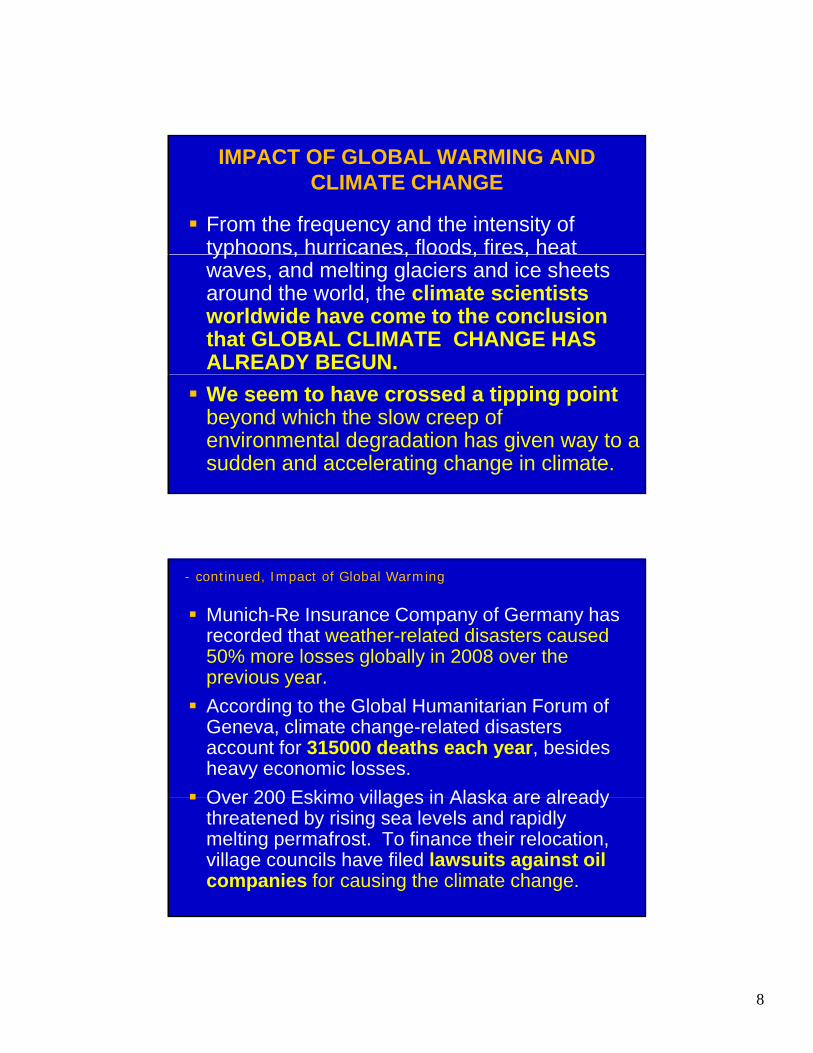
IMPACT OF GLOBAL WARMING AND CLIMATE CHANGE
From the frequency and the intensity of typhoons, hurricanes, floods, fires, heat yp , , , ,waves, and melting glaciers and ice sheets around the world, the climate scientists worldwide have come to the conclusion that GLOBAL CLIMATE CHANGE HAS ALREADY BEGUN.We seem to have crossed a tipping pointbeyond which the slow creep of environmental degradation has given way to a sudden and accelerating change in climate.
Munich-Re Insurance Company of Germany has recorded that weather-related disasters caused 50% more losses globally in 2008 over the previous year
- continued, Impact of Global Warming
previous year.According to the Global Humanitarian Forum of Geneva, climate change-related disasters account for 315000 deaths each year, besides heavy economic losses.Over 200 Eskimo villages in Alaska are alreadyOver 200 Eskimo villages in Alaska are already threatened by rising sea levels and rapidly melting permafrost. To finance their relocation, village councils have filed lawsuits against oil companies for causing the climate change.

9
According to James Hansen, a world renowned climate scientist, 350 ppm
h i CO “ h i i
- continued, Carbon Emissions
atmospheric CO2 was “the tipping point” that started worldwide weather-related disasters.
Many scientists believe that 450 ppm atmospheric CO2 is “the point of at osp e c CO2 s t e po t oirreversible climate change” that would lead to devastating consequences on the planet Earth
Historical and Future CO2 Concentrations
Business-as-usual scenario
Tipping Point
Point of No Return
Tipping Point

10
Historical Data on Population and Carbon Emissions, 1900-2008
1900 1950 1990 20081900 1950 1990 2008
Population, billions 1.6 2.6 5.3 6.8
Carbon emission
Gigatons/yr 0.53 1.63 6.14 8.47Atmospheric concentration (ppm)
296 312 354 386
16 i 50
Average rate of rise in CO2 concentration
16 ppm in 50y= 0.32 ppm/y
42 ppm in 40y= 1 ppm/y
32 ppm in 18y= 1.8 ppm/y
HOW MUCH TIME DO WE HAVE BEFORE CLIMATE CHANGE BECOMES IRREVERSIBLE?
The rate of carbon emissions now is nearly The rate of carbon emissions now is nearly two ppm/y and it is steadily increasing, therefore we have less than 30 years before we can stabilize and then reduce the rate of carbon emissions; otherwise the climate change will become irreversible.In conclusion, climate change has emerged as the most urgent sustainability issue of today
11
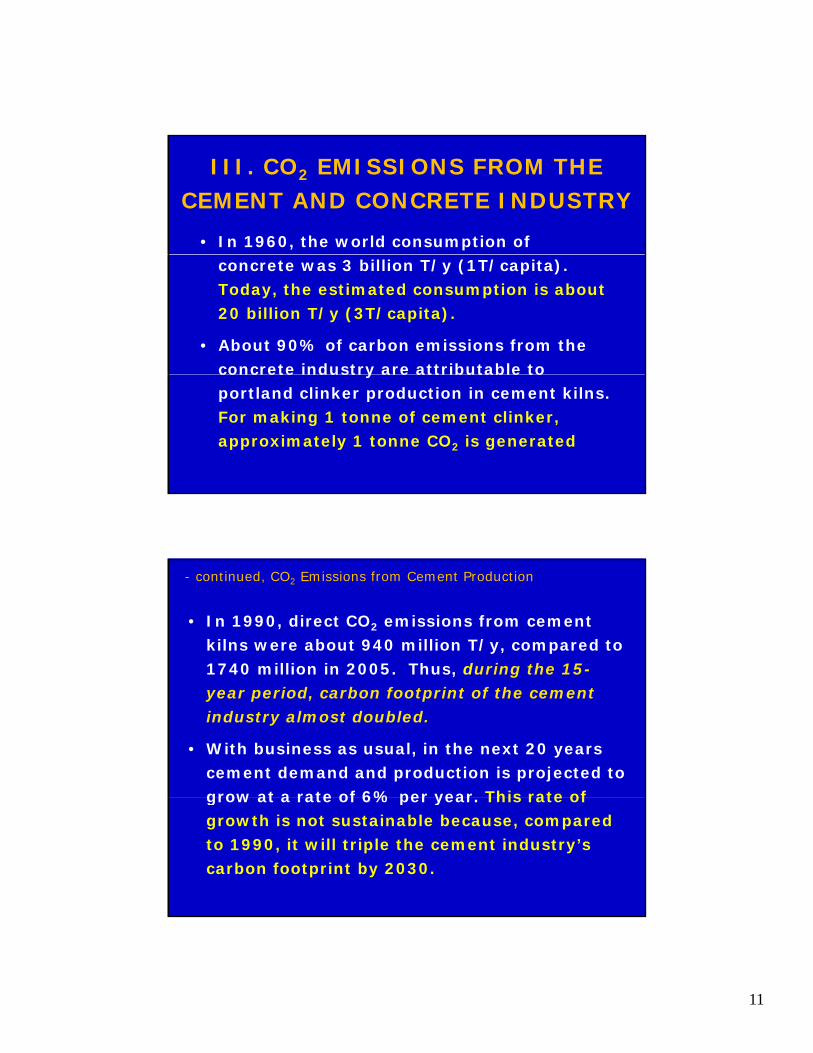
III. CO2 EMISSIONS FROM THE CEMENT AND CONCRETE INDUSTRY
• In 1960, the world consumption of concrete was 3 billion T/y (1T/capita). Today, the estimated consumption is about 20 billion T/y (3T/capita).
• About 90% of carbon emissions from the concrete industry are attributable to concrete industry are attributable to portland clinker production in cement kilns. For making 1 tonne of cement clinker, approximately 1 tonne CO2 is generated
• In 1990, direct CO2 emissions from cement kilns were about 940 million T/y, compared to 1740 million in 2005. Thus, during the 15-
- continued, CO2 Emissions from Cement Production
year period, carbon footprint of the cement industry almost doubled.
• With business as usual, in the next 20 years cement demand and production is projected to grow at a rate of 6% per year This rate of grow at a rate of 6% per year. This rate of growth is not sustainable because, compared to 1990, it will triple the cement industry’s carbon footprint by 2030.

12
CONCRETE INDUSTRY SUSTAINABILITYA Road Map for cutting the cement industry’s carbon
emissions to the 1990 level in next 20 years
Tool #1CONSUME LESS CONCRETE
for new structures
Sustainability
of the
Cement Industry
Tool #1 + Tool #2 30% cement saving
Tool #1 + Tool #2 + Tool #3 40 - 50% clinker saving
Tool #2CONSUME LESS CEMENT
in concrete mixtures
Tool #3CONSUME LESS CLINKER
for making cements
Source: Mehta, PK; ACI Concrete International, February 2009
TOOLS FOR CONSUMING LESS CONCRETE
Note that 45% of the world’s concrete is consumed by new buildings, 15% by infrastructure projects, and 40% for repair infrastructure projects, and 40% for repair and renovation of the built environment.
• Reduce project footprint by innovative architecture.
• Reduce thickness of foundations, columns, walls and beams by smart structural designs.y g
• Use highly durable concrete mix designs for foundations and other massive elements of new structures and for repair of old structures.
13
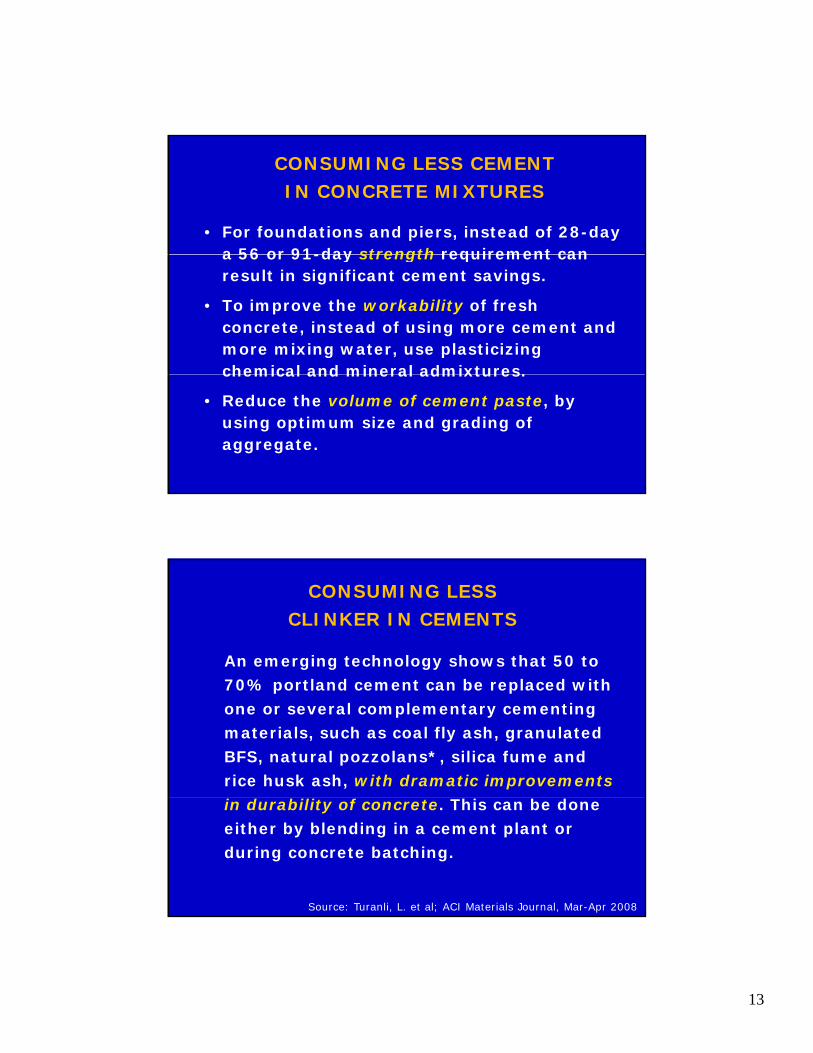
CONSUMING LESS CEMENT IN CONCRETE MIXTURES
• For foundations and piers, instead of 28-day a 56 or 91-day strength requirement can a 56 or 91-day strength requirement can result in significant cement savings.
• To improve the workability of fresh concrete, instead of using more cement and more mixing water, use plasticizing chemical and mineral admixtures.chemical and mineral admixtures.
• Reduce the volume of cement paste, by using optimum size and grading of aggregate.
An emerging technology shows that 50 to
CONSUMING LESS CLINKER IN CEMENTS
70% portland cement can be replaced with one or several complementary cementing materials, such as coal fly ash, granulated BFS, natural pozzolans*, silica fume and rice husk ash, with dramatic improvements in durability of concrete. This can be done either by blending in a cement plant or during concrete batching.
Source: Turanli, L. et al; ACI Materials Journal, Mar-Apr 2008
14
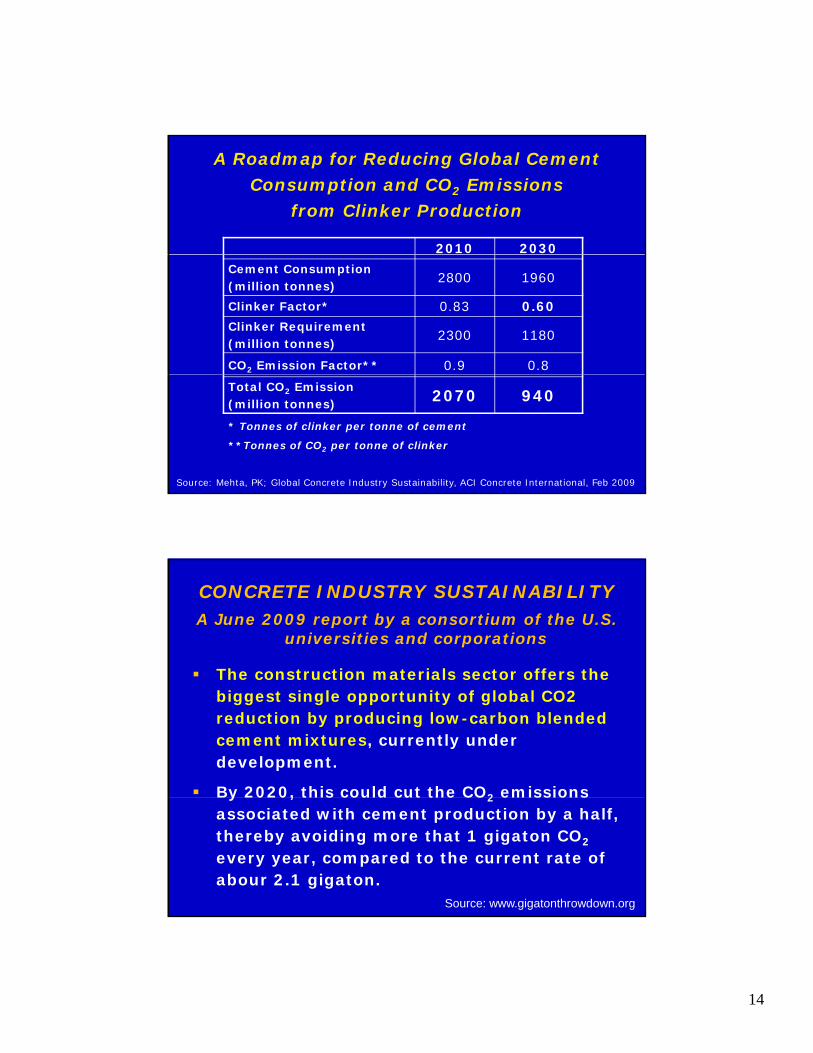
2010 2030
A Roadmap for Reducing Global Cement Consumption and CO2 Emissions
from Clinker Production
Cement Consumption (million tonnes)
2800 1960
Clinker Factor* 0.83 0.60Clinker Requirement(million tonnes)
2300 1180
CO2 Emission Factor** 0.9 0.8Total CO2 Emission(million tonnes) 2070 940
* Tonnes of clinker per tonne of cement
**Tonnes of CO2 per tonne of clinker
Source: Mehta, PK; Global Concrete Industry Sustainability, ACI Concrete International, Feb 2009
CONCRETE INDUSTRY SUSTAINABILITYA June 2009 report by a consortium of the U.S.
universities and corporations
The construction materials sector offers the The construction materials sector offers the biggest single opportunity of global CO2 reduction by producing low-carbon blended cement mixtures, currently under development.
By 2020, this could cut the CO2 emissions y 0 0, s ou d u O2 ss o sassociated with cement production by a half, thereby avoiding more that 1 gigaton CO2
every year, compared to the current rate of abour 2.1 gigaton.
Source: www.gigatonthrowdown.org

15
MAJOR ENHANCEMENT OF DURABILITY - A HOLISTIC TECHNOLOGY
• Major enhancement of durability of materials is essential as a long-term materials is essential as a long term strategy for sustainability, because a material saved is a material gained without incurring any financial and environmental costs.
Using a holistic rather than remedial • Using a holistic, rather than remedial approach, it is possible to understand and control all of the primary causes of deterioration of concrete in field structures
Source: Mehta, PK; ACI SP-234, 2006
HETEROGENEITIES IN THE CEMENT PASTE
Interconnected microcracks: the primary cause of loss of water-tightness in concrete
16
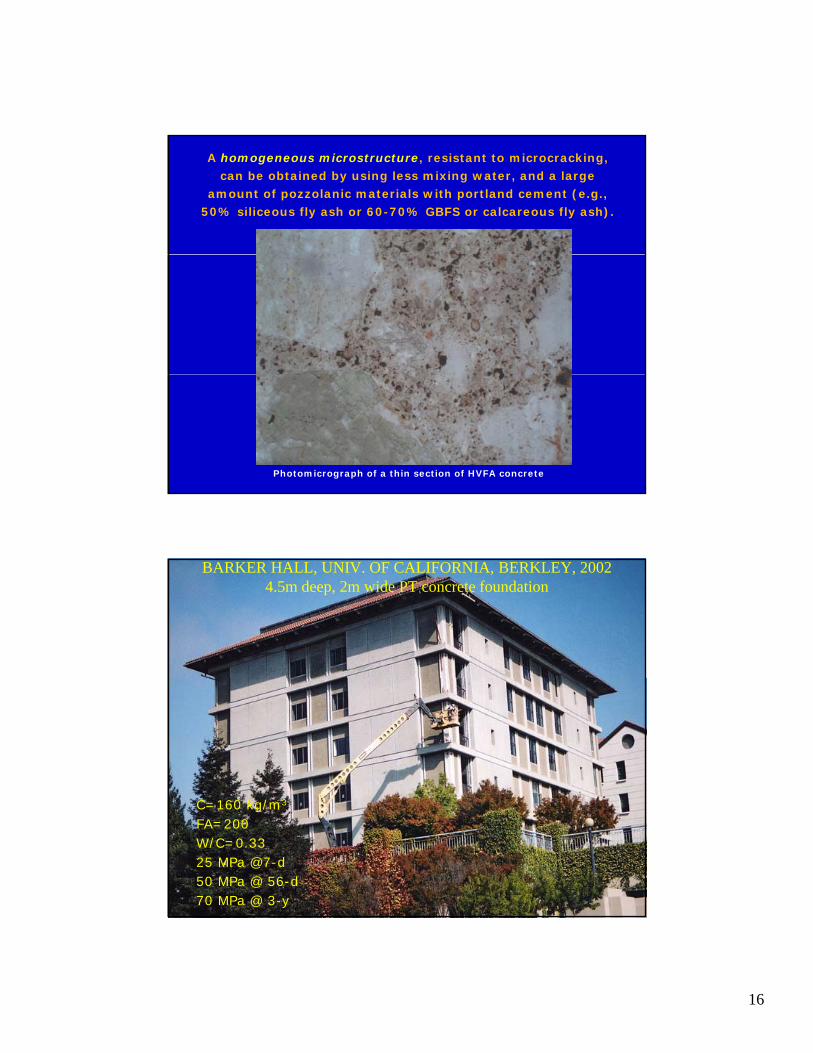
A homogeneous microstructure, resistant to microcracking, can be obtained by using less mixing water, and a large
amount of pozzolanic materials with portland cement (e.g., 50% siliceous fly ash or 60-70% GBFS or calcareous fly ash).
Photomicrograph of a thin section of HVFA concrete
BARKER HALL, UNIV. OF CALIFORNIA, BERKLEY, 20024.5m deep, 2m wide PT concrete foundation
C=160 kg/m3
FA=200W/C=0.3325 MPa @7-d50 MPa @ 56-d70 MPa @ 3-y
17
Wall Reinforcement
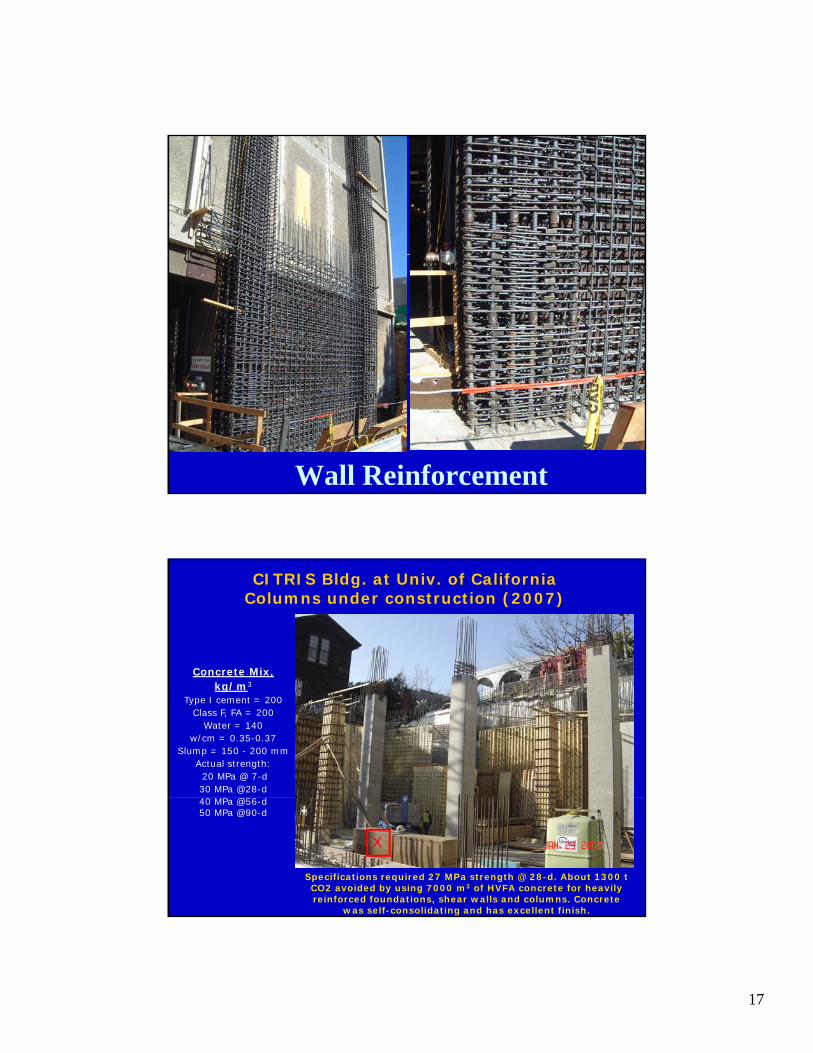
Concrete Mix,
CITRIS Bldg. at Univ. of California Columns under construction (2007)
kg/m3
Type I cement = 200Class F, FA = 200
Water = 140w/cm = 0.35-0.37
Slump = 150 - 200 mmActual strength:
20 MPa @ 7-d 30 MPa @28-d
d40 MPa @56-d50 MPa @90-d
Specifications required 27 MPa strength @ 28-d. About 1300 t CO2 avoided by using 7000 m3 of HVFA concrete for heavily reinforced foundations, shear walls and columns. Concrete
was self-consolidating and has excellent finish.
X

18
Mix, kg/m3
C = 160FA = 200
Water = 130
Utah State Capitol Building, Salt Lake City (2006)
w/cm = 0.36
Foundations, beams, shear walls for seismic rehabilitation4,500 m3, 27 MPa High-Volume Fly Ash Concrete specified
Utah State Capitol Building, Salt Lake City (2006)
Utah State Capitol – Seismic Retrofit:
HVFA concretew/cm = 0.38 0.44 clinker factor900 t CO2 reduction34 MPa @ 28-day
19
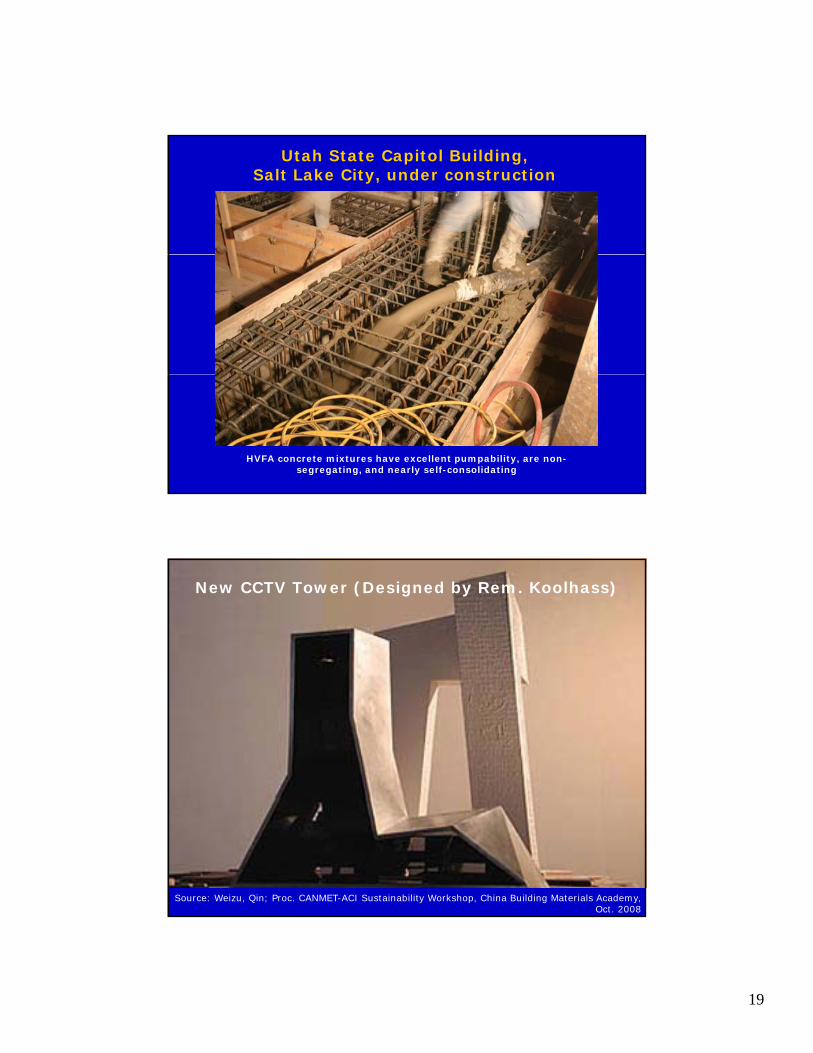
Utah State Capitol Building, Salt Lake City, under construction
HVFA concrete mixtures have excellent pumpability, are non-segregating, and nearly self-consolidating
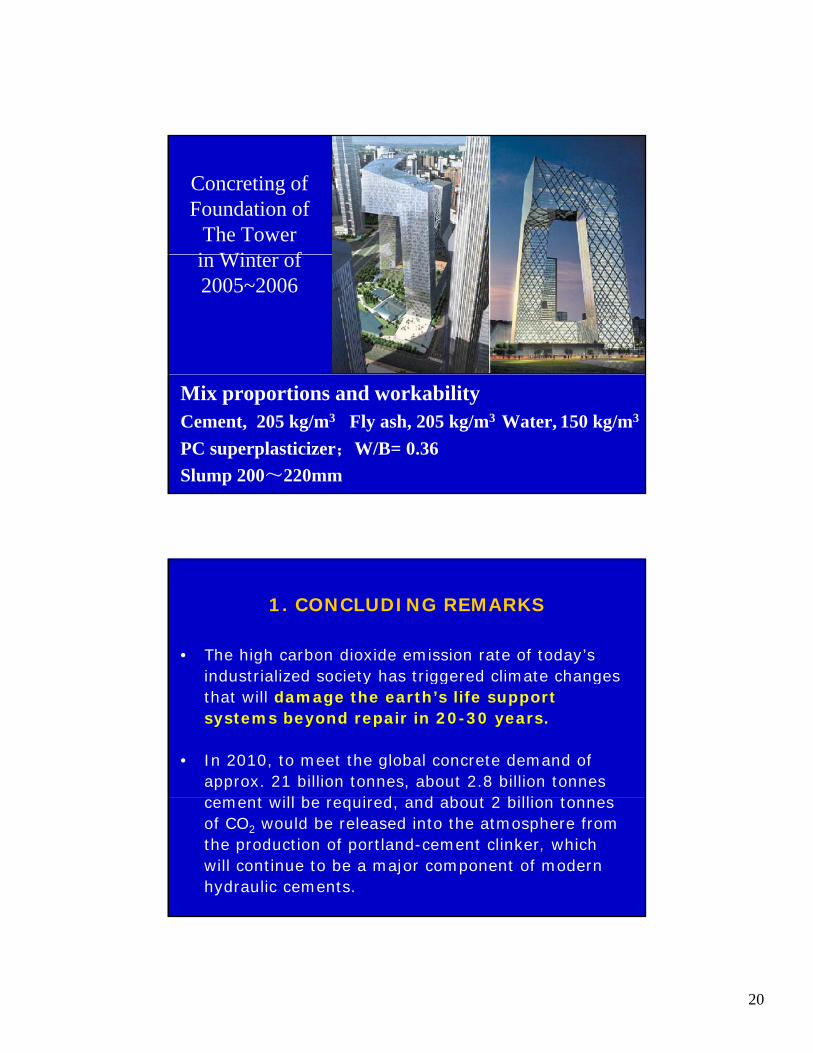
New CCTV Tower (Designed by Rem. Koolhass)
Source: Weizu, Qin; Proc. CANMET-ACI Sustainability Workshop, China Building Materials Academy, Oct. 2008
20
Concreting of Foundation of
The Toweri Wi t fin Winter of 2005~2006
Mix proportions and workabilityCement, 205 kg/m3 Fly ash, 205 kg/m3 Water, 150 kg/m3
PC superplasticizer;W/B= 0.36 Slump 200~220mm
1. CONCLUDING REMARKS
• The high carbon dioxide emission rate of today’s industrialized society has triggered climate changes industrialized society has triggered climate changes that will damage the earth’s life support systems beyond repair in 20-30 years.
• In 2010, to meet the global concrete demand of approx. 21 billion tonnes, about 2.8 billion tonnes
t ill b i d d b t 2 billi t cement will be required, and about 2 billion tonnes of CO2 would be released into the atmosphere from the production of portland-cement clinker, which will continue to be a major component of modern hydraulic cements.

21
2. CONCLUDING REMARKS
Predicted Cement and Clinker Requirements According to the Suggested Roadmap
By 2030, CO2 emission rate from portland clinker production can be brought down to the
• Reducing the global cement and concrete consumption by 30%.
• Lowering the average clinker factor of
to the Suggested Roadmap
500
1000
1500
2000
2500
3000
Cement
Clinker
brought down to the 1990 level by:
milli
on to
nnes
cement from 0.83 to 0.6 with blended portland cements containing 40% or more complementary cementing materials.
01950 1975 2000 2025 2050 2075 2100
Year
3. CONCLUDING REMARKS
Using a high proportion of complementary i i l lik l fl h d cementing materials like coal fly ash and
considerably less portland-clinker, a provenand low-cost technology is already available for making highly durable and sustainable structural concrete products. All we need now, is to join hands to take immediate and decisive action for implementation of this technology.
22
4. CONCLUDING REMARKS
• The era of unrestricted use of energy and materials is over because we have crossed the tipping point in 1990 that has triggered the climate change already
dunderway.
• In the next 20 years, every segment of the global economy must make a determined effort to reduce their CO2 emission to the 1990 level or less.
• The challenge before the construction community –the owners designers contractors and cement and the owners, designers, contractors, and cement and concrete producers – is to learn and use the new technologies of building sustainable structures, with sustainable designs, sustainable construction practices, and sustainable and durable structural materials.
. ___ . ___ . ___ . ___ . ___ . ___ .
Thank YouThank You. ___ . ___ . ___ . ___ . ___ . ___ .
Obrigado. ___ . ___ . ___ . ___ . ___ . ___ .