S. La Rochebrochard, C. Narváez, J. Vázquez Padin...
15
Development of a new microalgae‐based wastewater treatment and reuse system with bioenergy production S. de La Rochebrochard, C. Narváez, J. Vázquez‐Padin and C.A. Aragón
Transcript of S. La Rochebrochard, C. Narváez, J. Vázquez Padin...
Development of a new microalgae‐based wastewater treatment and reuse system with
bioenergy production
S. de La Rochebrochard, C. Narváez, J. Vázquez‐Padin and C.A. Aragón
Project background
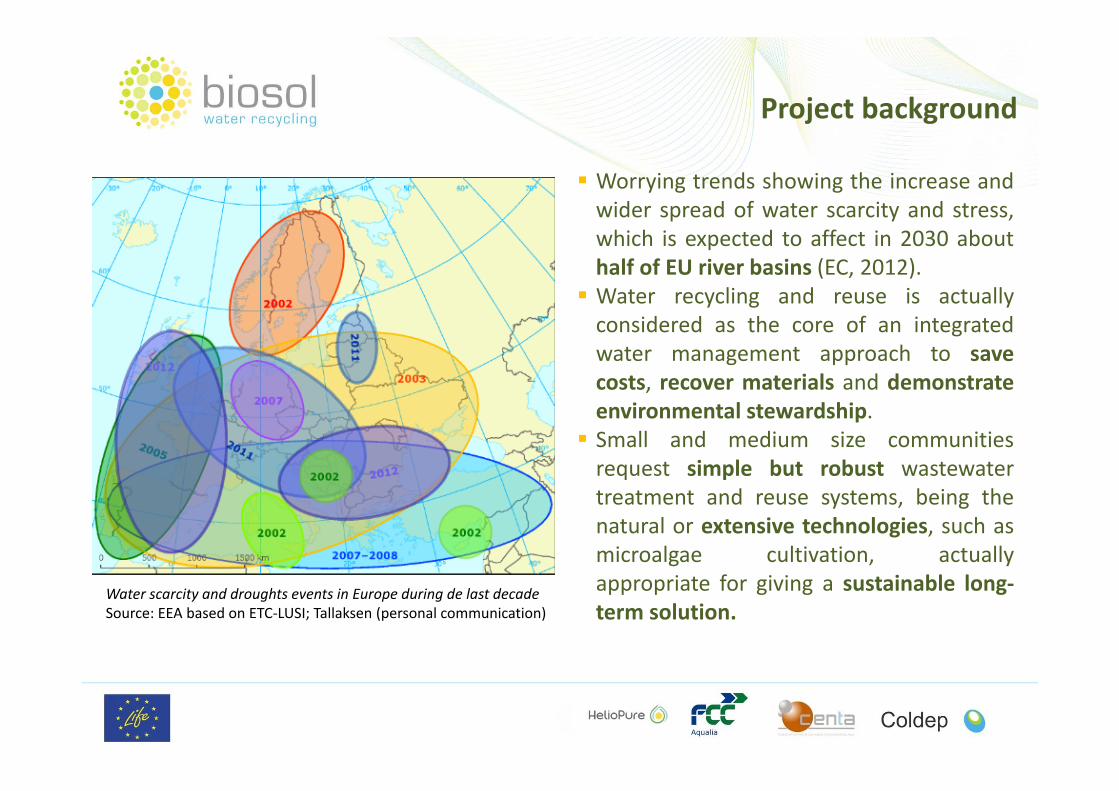
Water scarcity and droughts events in Europe during de last decadeSource: EEA based on ETC‐LUSI; Tallaksen (personal communication)
Worrying trends showing the increase andwider spread of water scarcity and stress,which is expected to affect in 2030 abouthalf of EU river basins (EC, 2012). Water recycling and reuse is actuallyconsidered as the core of an integratedwater management approach to savecosts, recover materials and demonstrateenvironmental stewardship. Small and medium size communitiesrequest simple but robust wastewatertreatment and reuse systems, being thenatural or extensive technologies, such asmicroalgae cultivation, actuallyappropriate for giving a sustainable long‐term solution.

LIFE‐ BioSolWaRe project
Total budget: 2.322.837,00 €EU contribution: 1.146.793,00 €Duration 2014-2019 (54 months)Funding entity:
Bio‐Solar Water Recycling: Demonstration wastewatertreatment system dedicated to wastewater reuse andrecycling, BioSolWaRe – LIFE (LIFE13 ENV/FR/000711).
Main goal: the development and validation of an innovative,efficient and competitive system for wastewater treatmentbased on an ecological process called “Bio‐Solar Purification”(BSP). This system has been specially designed for smallpopulations and isolated dwellings. It combines bothbiological processes (algae cultivation) and the solartechnology to reuse up to 80% of the treated water,facilitating the recovery and later valorisation of greenhousegases and other organic wastes produced during thetreatment.
Target result: pilot plant with a production capacity of 50 m3/day of reclaimed anddisinfected water that will improve both the energy and carbon balances in comparisonwith the traditional wastewater treatment and reuse technologies.
LIFE‐ BioSolWaRe project
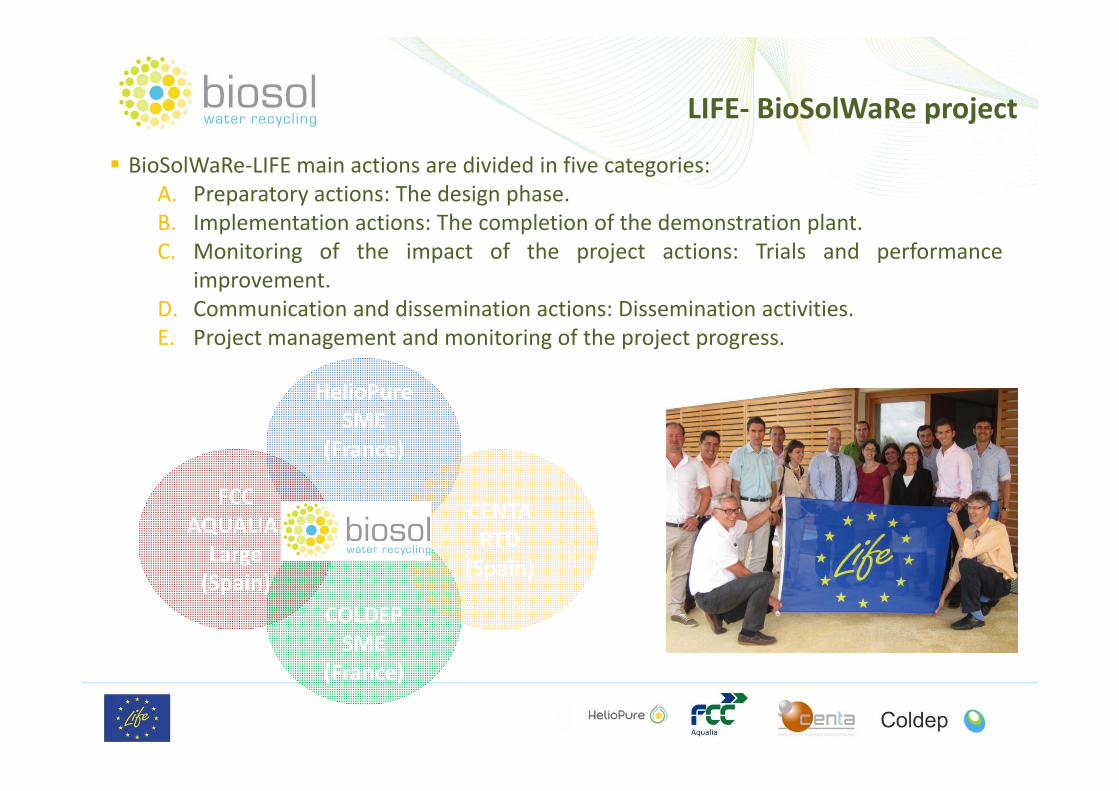
BioSolWaRe‐LIFE main actions are divided in five categories:A. Preparatory actions: The design phase.B. Implementation actions: The completion of the demonstration plant.C. Monitoring of the impact of the project actions: Trials and performance
improvement.D. Communication and dissemination actions: Dissemination activities.E. Project management and monitoring of the project progress.
HelioPureSME
(France)
FCC AQUALIA. Large(Spain)
COLDEPSME
(France)
CENTA RTD
(Spain)
BioSolWaRe demo 1
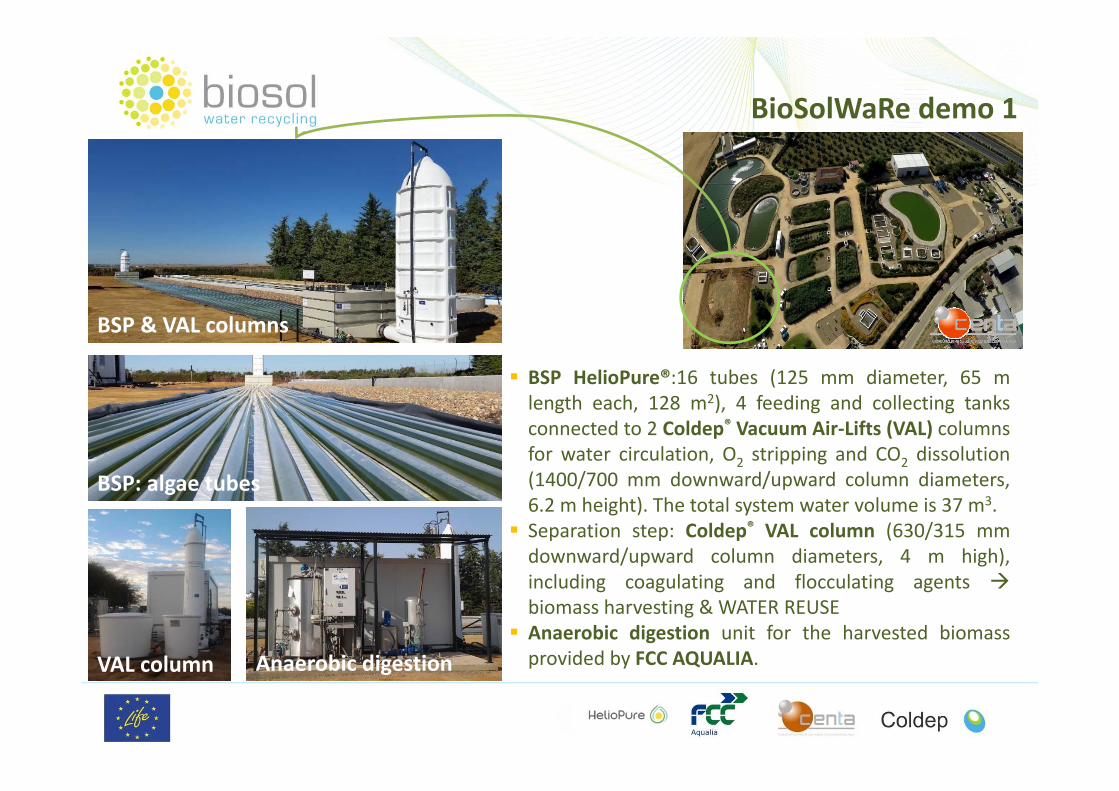
BSP & VAL columns
BSP: algae tubes
VAL column Anaerobic digestion
BSP HelioPure®:16 tubes (125 mm diameter, 65 mlength each, 128 m2), 4 feeding and collecting tanksconnected to 2 Coldep® Vacuum Air‐Lifts (VAL) columnsfor water circulation, O2 stripping and CO2 dissolution(1400/700 mm downward/upward column diameters,6.2 m height). The total system water volume is 37 m3. Separation step: Coldep® VAL column (630/315 mmdownward/upward column diameters, 4 m high),including coagulating and flocculating agents biomass harvesting & WATER REUSE Anaerobic digestion unit for the harvested biomassprovided by FCC AQUALIA.
BioSolWaRe demo 1: first results
First results dealing with:
Hydraulic trials to assess the performances of 1400/700 VAL columns for watercirculation in BSP units.
Treatment and reuse batch tests to study the effect of the circulating velocity inBSP tubes on treatment performances.
Separation batch trials to optimize the functioning of the VAL column andchemical dosage to harvest microalgae biomass.
Individual digestion trials to monitor both quantitatively and qualitatively thebiogas from the digestion of the algal biomass harvested through BiochemicalMethane Potential (BMP) tests.
The whole BioSol Water Recycling facility has been first studied in batch mode in orderto optimize operating procedures and controlled parameters on each component first.
LCA on each of the components to evaluate the environmental impact (CENTA).

BioSolWaRe demo 1: first results Hydraulic trials
Number of pumps working: 1 ‐3
Water velocity ranges from 0.04 to 0.38 m.s‐1,thus overcoming the 0.25 m.s‐1 settling threshold(Stokes law); That velocity ensures enoughturbulence so that microalgae cells frequentlymove to the better illuminated peripheral zoneand thus not starved of light for extendedperiods (Molina et al, 2001).
According to previous results of COLDEP, inoptimum conditions, the energy consumptionper m3 circulated water shall be reduced to 3Wh.m‐3 without head losses
Water velocity as a function of air flow rates in VAL columns
Energy consumption for water circulation in VAL columns
BioSolWaRe demo 1: first results Treatment and reuse batch tests
BSP was fed only once (13 m3). Spot samples at 8 AM and 8 PM, during 6 days.
2 circulating velocities in BSP tubes:
BSPVAL‐T‐1: 0.17±0.02 m.s‐1 (7.4±0.9 m3.h‐1)
BSPVAL‐T‐2: 0.28±0.02 m.s‐1 (12.7±0.9m3.h‐1).
2 temperature regimes (not planned):
BSPVAL‐T‐1, mean value : 20.5±0.8°C, min/max : 17/46°C;
BSPVAL‐T‐2, mean value : 26.4±0.4°C, min/max : 15/35°C).
Constant volume and sunlight intensity (6‐7 KWh.m‐2.d‐1).

BioSolWaRe demo 1: first results Treatment and reuse batch tests
High strength wastewater (IT and initial reactor’s content) in BSPVAL‐T‐1 incomparison with BSPVAL‐T‐2.
Microalgae concentration at the beginning of the test is lower in BSPVAL‐T‐1 (920g/l) than in 2 (1500 g/l),
BUT, the performance of the BSP unit its similar in both tests in terms of organicmatter removal.
An increase of velocity from 0.17 to 0.3 m.s‐1 has not noticeable effects on the organic matter removal rates. This effect probably is minimised due to the use
of an Imhoff tank as a primary treatment (removes SS and 30% COD).
Initial concentration in Imhoff tank
Initial concentration in
BSP system
Removal efficiency
mg.L‐1 mg.L‐1 % %BSPVAL‐T 1 2 1 2 11 2
COD 437 277 498 371 68% 68%CODsol 213 130 149 100 39% 6%BOD5 260 160 190 120 79% 80%BOD5.sol 115 55 60 18 93% 56%
BioSolWaRe demo 1: first results Treatment and reuse batch tests
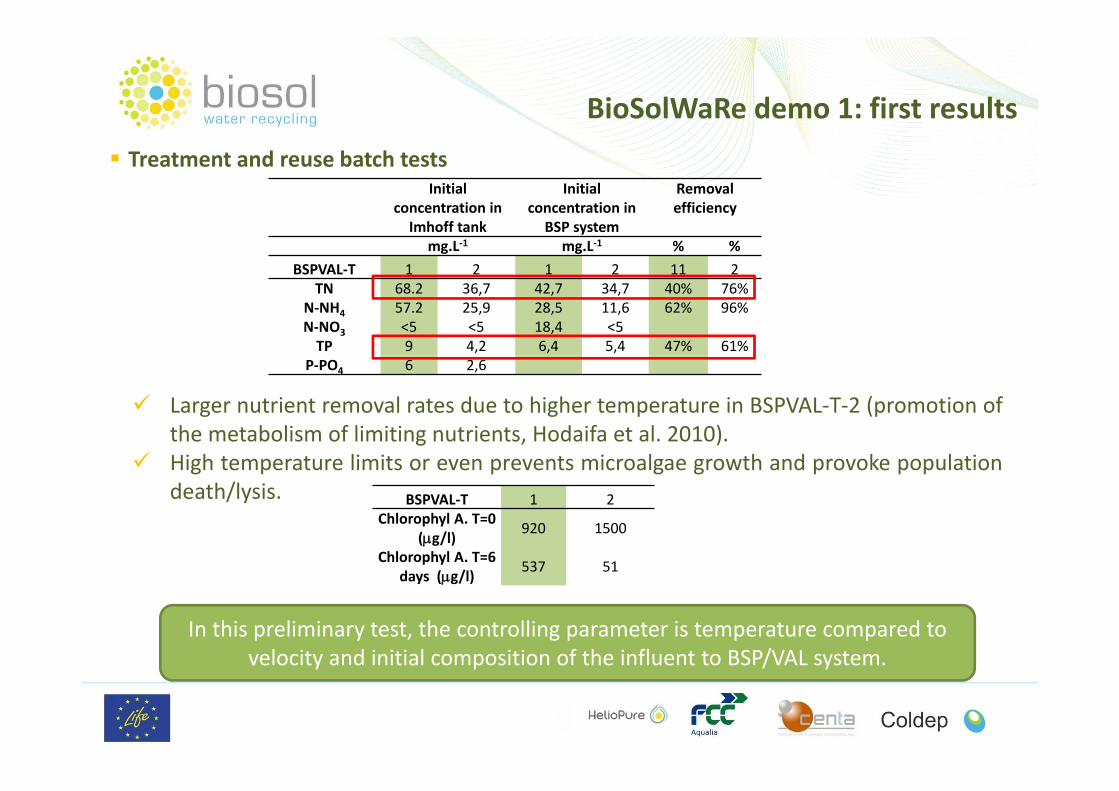
Larger nutrient removal rates due to higher temperature in BSPVAL‐T‐2 (promotion ofthe metabolism of limiting nutrients, Hodaifa et al. 2010).
High temperature limits or even prevents microalgae growth and provoke populationdeath/lysis.
In this preliminary test, the controlling parameter is temperature compared to velocity and initial composition of the influent to BSP/VAL system.
Initial concentration in Imhoff tank
Initial concentration in
BSP system
Removal efficiency
mg.L‐1 mg.L‐1 % %BSPVAL‐T 1 2 1 2 11 2
TN 68.2 36,7 42,7 34,7 40% 76%N‐NH4 57.2 25,9 28,5 11,6 62% 96%N‐NO3 <5 <5 18,4 <5TP 9 4,2 6,4 5,4 47% 61%
P‐PO4 6 2,6
BSPVAL‐T 1 2Chlorophyl A. T=0
(g/l) 920 1500
Chlorophyl A. T=6 days (g/l) 537 51
BioSolWaRe demo 1: first results Separation batch trials
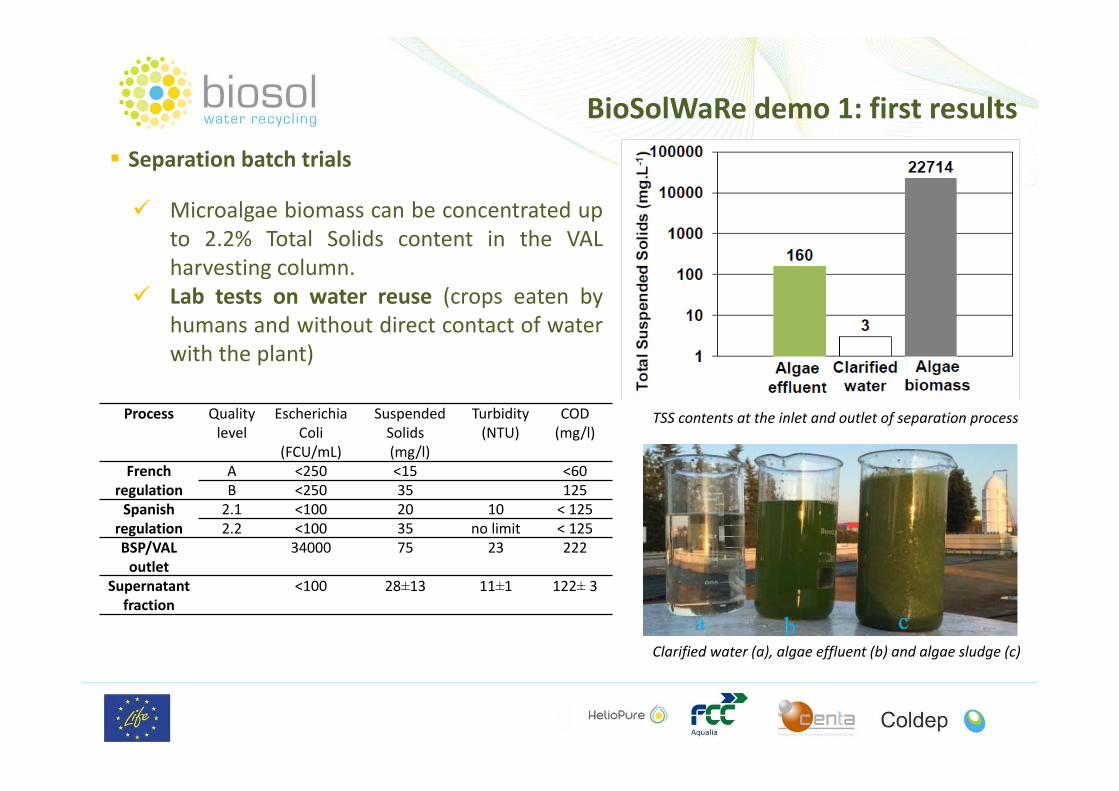
Microalgae biomass can be concentrated upto 2.2% Total Solids content in the VALharvesting column.
Lab tests on water reuse (crops eaten byhumans and without direct contact of waterwith the plant)
TSS contents at the inlet and outlet of separation process
Clarified water (a), algae effluent (b) and algae sludge (c)
Process Quality level
Escherichia Coli
(FCU/mL)
Suspended Solids(mg/l)
Turbidity(NTU)
COD(mg/l)
French regulation
A <250 <15 <60B <250 35 125
Spanish regulation
2.1 <100 20 10 < 1252.2 <100 35 no limit < 125
BSP/VAL outlet
34000 75 23 222
Supernatant fraction
<100 28±13 11±1 122± 3
BioSolWaRe demo 1: first results Digestion batch trials
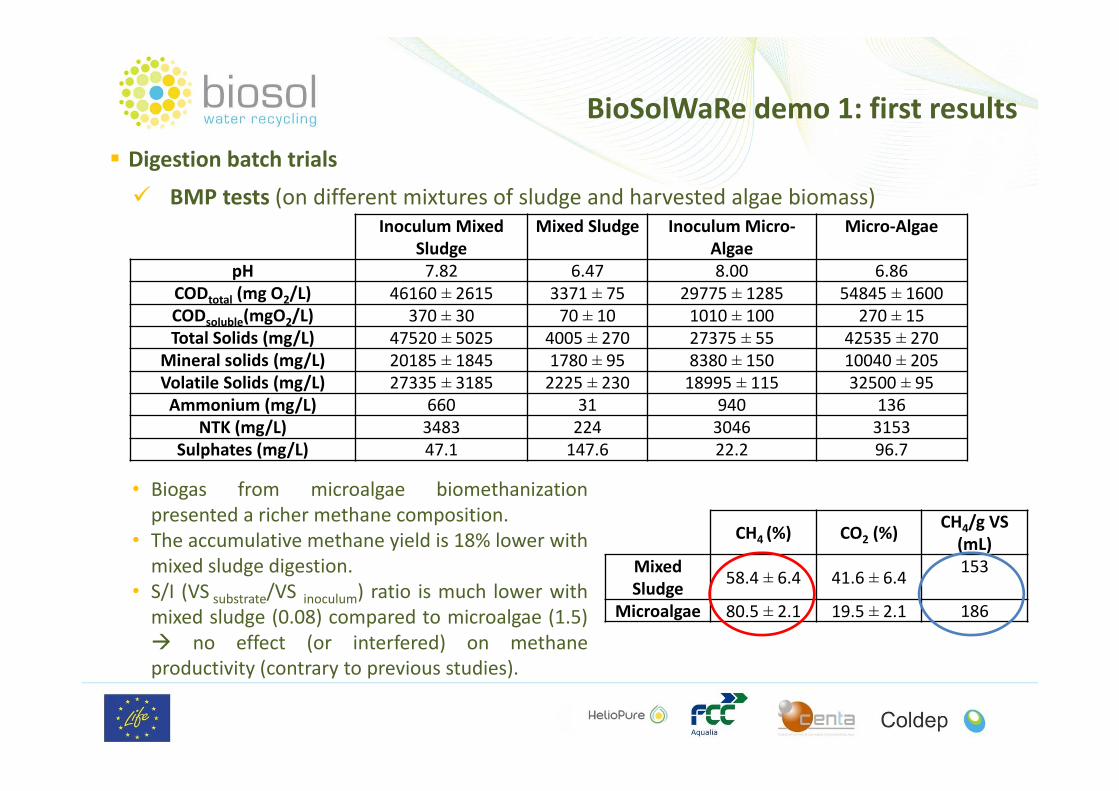
BMP tests (on different mixtures of sludge and harvested algae biomass)Inoculum Mixed
SludgeMixed Sludge Inoculum Micro‐
AlgaeMicro‐Algae
pH 7.82 6.47 8.00 6.86CODtotal (mg O2/L) 46160 ± 2615 3371 ± 75 29775 ± 1285 54845 ± 1600CODsoluble(mgO2/L) 370 ± 30 70 ± 10 1010 ± 100 270 ± 15Total Solids (mg/L) 47520 ± 5025 4005 ± 270 27375 ± 55 42535 ± 270
Mineral solids (mg/L) 20185 ± 1845 1780 ± 95 8380 ± 150 10040 ± 205Volatile Solids (mg/L) 27335 ± 3185 2225 ± 230 18995 ± 115 32500 ± 95Ammonium (mg/L) 660 31 940 136
NTK (mg/L) 3483 224 3046 3153Sulphates (mg/L) 47.1 147.6 22.2 96.7
CH4 (%) CO2 (%)CH4/g VS (mL)
Mixed Sludge 58.4 ± 6.4 41.6 ± 6.4 153
Microalgae 80.5 ± 2.1 19.5 ± 2.1 186
• Biogas from microalgae biomethanizationpresented a richer methane composition.
• The accumulative methane yield is 18% lower withmixed sludge digestion.
• S/I (VS substrate/VS inoculum) ratio is much lower withmixed sludge (0.08) compared to microalgae (1.5) no effect (or interfered) on methaneproductivity (contrary to previous studies).

BioSolWaRe demo 1: first results Digestion batch trials
Mixed sludge showed a sigmoidal curve ofcumulative CH4 production hydrolysisphase is the limiting step. Explanation: less hydrolytic potential of theinoculum. Sulphate concentration (147.6 mg.L‐1, inmixed sludge vs. 96.7 mg.L‐1 inmicroalgae competition betweensulphate reducing bacteria andmethanogenic bacteria (especially, atsulphate concentrations > 150 mg/L).
BiodegradabilityMixed Sludge 28.8 ± 7.4Micro‐Algae 31.5 ± 2.9Similar biodegradability
BioSolWaRe demo 1: conclusions and perspectives
This study provides interesting perspectives consisting in operating the process at lowvelocity (0.15 m.s‐1) or even lower in order to reach similar performances at lower energyconsumption.
Treatment and reuse performances, carbon and energy balances will be studied byoptimizing together Hydraulic Retention Times of BSP/VAL and VAL separation processesin a continuous‐operation mode.
The aim of this study is both preparing trials in continuous mode and optimizing thedesign of the whole plant (Demo 2 ~ 50 m3.d‐1) to be located in Almeria (south‐easternregion of Spain). Indeed solution dedicated to wastewater treatment and reuse foragriculture, such as BioSol Water Recycling system, target at meeting treatment and reuseneeds resulting from high local hydric stress and high demand for intensive farming ingreenhouses.
Development of a new microalgae‐based wastewater treatment and reuse system with
bioenergy production
ACKNOWLEDGEMENTS This work is funded by the EuropeanCommission through the LIFE+ program:BIOSOL project (LIFE13ENV/FR/000711).
More info at: www.life‐bioso.eu
@BiosolW