¿QUIENES SOMOS ¿QUE NECESITAMOS · RESUMEN EJECUTIVO XIII HISPANIC IMMIGRANTS IN NORTH GEORGIA 1...
70
¿Q UIENES SOMOS ? ¿Q UE NECESITAMOS ? NEEDS ASSESSMENT OF HISPANICS IN THE ARCHDIOCESE OF ATLANTA Martha Woodson Rees and T. Danyael Miller With the collaboration of Gonzalo Saldaña Hispanic Apostolate Office and Staff of the Archdiocese of Atlanta 2 October, 2011
Transcript of ¿QUIENES SOMOS ¿QUE NECESITAMOS · RESUMEN EJECUTIVO XIII HISPANIC IMMIGRANTS IN NORTH GEORGIA 1...
¿QUIENES SOMOS? ¿QUE NECESITAMOS?
NEEDS ASSESSMENT OF HISPANICS IN THE ARCHDIOCESE OF ATLANTA
Martha Woodson Rees and
T. Danyael Miller
With the collaboration of Gonzalo Saldaña Hispanic Apostolate Office
and Staff of the Archdiocese of Atlanta
2 October, 2011

Hispanic Survey ii
TABLE OF CONTENTS
ACKNOWLEDGEMENTS V EXECUTIVE SUMMARY VI RESUMEN EJECUTIVO XIII
HISPANIC IMMIGRANTS IN NORTH GEORGIA 1 Beliefs and Culture 6 Limitations 8 Sample limitations 9 Privacy considerations 9
THE SETTING: PARISHES AND MISSIONS 9 Sociodemographic Data 10 Culture and social relations: Life in the US of A 23 Religious Practice And Needs 26
CONCLUSIONS: DIVERSITY 33 Summary 35 RECOMMENDATIONS 36 Future research 38 Endings and Beginnings 38
SELECT REFERENCES 39 Appendix A. Methodology 40 Appendix B. Encuesta Hispana 43 Appendix C. Instruction Sheet 45 Appendix D. Hispanic Population in Georgia 48 Appendix E. Sample Characteristics 52 Appendix F. Religious Services Offered 54 Appendix G. Social Services offered 56

Hispanic Survey iii
FIGURES
Figure 1. Georgia Hispanic Population (1990) 2 Figure 2. Hispanic Population of the Atlanta Metropolitan Area, 1981-1998 2 Figure 3. Metropolitan Atlanta Hispanics, 1998 3 Figure 4. Atlanta Area Immigrants—1996 3 Figure 5. First US Region 5 Figure 6. Age 11 Figure 7. Gender 11 Figure 8. Women and Children in Mass by Parish 12 Figure 9. Weeks since Last Mass 12 Figure 10. Education by Gender 13 Figure 11. Residential Stability 13 Figure 12. Marital Status 13 Figure 13. Occupation by Gender in Home Country 14 Figure 14. Occupation by Gender in US 15 Figure 15. Spouse's Residence 16 Figure 16. Children by age group 16 Figure 17. Education by Birth Country 17 Figure 18. Education by Parish 18 Figure 19. Birth Country (%) 19 Figure 20. Birth Country by Parish (%) 20 Figure 21. Migration 21 Figure 22. Birth Region by US Year 21 Figure 23. Year Arrived in Georgia 22 Figure 24. Relation of Remittances to Migration Year 22 Figure 25. Remitters 23 Figure 26. Household Composition 23 Figure 27. Household Characteristics 24 Figure 28. Type of Housing 24 Figure 29 Languages Spoken by Respondent 25 Figure 30. Main Language Spoken in Home 25 Figure 31. Last Mass Attended by Gender 26 Figure 32. Mass transport 27 Figure 33. Work Transport 27 Figure 34. Preferred Mass 27 Figure 35. Mass Reflects Traditions 27 Figure 36. Participation in other Religions 28 Figure 37. Number of Children and Registration 28 Figure 38. Preferred school 29 Figure 39. Use of Religious Services and Sacraments 29 Figure 40. Accept ministry 29 Figure 41. Past participation in religious ministries 30 Figure 42. Other Household to Mass 30 Figure 43. Household Members who Practice another Religion 30 Figure 44. Knowledge of religious services offered 31 Figure 45. Social Needs 31 Figure 46. Religious Needs % 31 Figure 47. Knowledge of Social Services Offered 32 Figure 48. Use of Social services 32 Figure 49. First US Region (%) 59 Figure 50. Age 60 Figure 51. Gender 61

Hispanic Survey iv
Figures (continued) Figure 52. Women and Children in Mass by Parish 62 Figure 53. Weeks since Last Mass 63 Figure 54. Years of Education 64 Figure 55. Residential Stability (months at current residence) 65 Figure 56. Marital Status 66 Figure 57. Men’s Occupation in US (%) 67 Figure 58. Women’s Occupation 68 Figure 59. Spouse's Residence 69 Figure 60. Children by age group 70 Figure 61. Birth Country (%) 71 Figure 62. Migration Year 72 Figure 63. Remitters 73 Figure 64. Type of Housing 74 Figure 65. Vehicles and Housing 75 Figure 66. Languages Spoken by Respondent 76 Figure 67. Main Language Spoken in Home 77 Figure 68. Mass transport 78 Figure 69. Work Transport 79 Figure 70. Mass Reflects Traditions 80 Figure 71. Participation in other Religions 81 Figure 72. Preferred school 82 Figure 73. Accept ministry 83 Figure 74. Past participation in religious ministries 84 Figure 75. Others in Household Who… 85 Figure 76. Religious Needs 86 Figure 77. Social Needs 87

Hispanic Survey v
Acknowledgements It would be a mistake to take credit for the work presented here, it was a team effort, composed of
experienced social scientists and researchers, aided by lay and religious staff—all of us committed to the Hispanic
community.
As an associate professor of anthropology at Agnes Scott College in Decatur, Georgia, I have carried out
research in the Hispanic community in Atlanta for over ten years (Rees and Nettles 2000; Rees and Miller 2000,
Rees 2001b and c), in addition to continuous community and volunteer work (Mexican Center of Atlanta, among
others). In addition, I lived and worked in Mexico for over 14 years. As coordinator, I bring my knowledge of the
local and origin communities, as well as long experience with surveys and ethnographic work.
The field coordinator and research associate, Danyael Miller, has lived in Venezuela and Costa Rica, as
well as done field work and research in Mexico, including coordinating data collection for a large research project in
Guadalajara, Jalisco and Tezuitlán, Puebla. In addition, her senior thesis at Agnes Scott College was on breast-
feeding among migrant Hispanic women in Atlanta (Miller 1999).
Other people also formed a crucial part of the research team. First and foremost, Gonzalo Saldaña, director
of the Hispanic Apostolate and Silvia Maldonado of the Apostolate office, both were indispensable in the successful
completion of this project, in more ways than I can mention here—from late night phone calls with questions, to
purchase of supplies, managing meetings, copying, and more. The coordinating committee (Monsignor David P.
Talley, Dr. James Kantner, and Ms. Betti Knott) has been working on this project for years, and—in many
meetings—was instrumental in deciding the many design and methodology issues. In addition, numerous Hispanic
employees at the Catholic Center (among them, Cristina Sánchez, Elvira Carillo, Margarita Rice, Julisa Delgado and
Teresa Keebler) helped us apply and collect questionnaires. All of these people, plus parish priests, religious sisters,
deacons, employees and volunteers helped design, test and carry out the survey. Susan Dougherty of Agnes Scott
College designed the data capture program. Julia Perilla and Arthur Murphy consulted on the questionnaire and
sample design. Most of all, we thank the over 2700 people who willingly filled out our survey. We dedicate this
report to those volunteers, the Hispanic community in Georgia.
Martha Woodson Rees Danyael Miller

EXECUTIVE SUMMARY
¿Quienes somos? ¿Qué necesitamos? Needs Assessment of Hispanics in the Archdiocese of Atlanta
Martha Woodson Rees
and T. Danyael Miller
Hispanics in North Georgia
Not only the Catholic Church, but the United States as a whole is becoming more Hispanic. The number of
Hispanic immigrants to the north Georgia area has grown over two hundred percent in the last decade, with most
growth after 1995. Just in the metropolitan area of Atlanta, the Hispanic population grew over 130%, from 30,000 in
1982 to over 110,000 in 1992, to over 234,010 in 1998, becoming the largest non traditional minority group in the
city. There are lots of reasons people migrate, but the most important factor for us here in the United States is to
recognize the benefits immigrants bring us—cheaper labor, housing, child chare, domestic work, etc. We all benefit
from this new class of Americans in our midst.
This study reports on a unique step by the Archdiocese of Atlanta to describe the diversity, and resultant
divergent needs, of its Hispanic members through a random survey of over 10% of participants in Spanish masses,
probably the only one ever done—a systematic "listening session" initiated from the top down. This is in line with
Vatican II on the rights and duties of migrating people and the local Church's response: the right to have a
homeland, with its spiritual and cultural links; second, not only the right to emigrate, but duties toward the host
country, such as learning the local language; third, immigrants' right to their language and spiritual heritage.
The Methods
The questionnaire is a short survey applied to a sample of 50 individuals at each Saturday and Sunday
mass. We estimate that there are up to 25,000 participants in the over 60 Spanish masses in the Archdiocese of
Atlanta in a given week. This data give us a "snapshot" of active Hispanic Catholics, which prepares the
Archdiocese for continued work. This project simply describes the basic characteristics of the population in order to
lay the groundwork for this future, more qualitative, work.

Hispanic Survey vii
Outcomes
This report summarizes the findings from the survey, as well as from interviews in the parishes. Our
conclusions deal with (I) the Archdiocese, and (II) the parishioners. These conclusions lead us to make a number of
recommendations, which we offer as a first step in an on-going process of reflection and analysis to be carried forth
by the Archdiocese.
I. The Archdiocese 1. Communication. From our work with the parishes, both in terms of difficulties in contacting many of
them, as well as from comments and needs expressed by parish priests, religious sisters, staff and volunteers, it is
clear that communication is not clear, swift or easy in many cases. If fact, communication is iffy throughout much of
the Archdiocese. Many of the parishes (priests and/or staff) are not linked to others either socially or professionally.
This contact would increase the viability of all the work of the archdiocese. Within parishes, there needs to be
increased communication and coordination between Spanish and English clergy, laity and staff.
2. Hispanic diversity. There is incredible economic and cultural variation within the Hispanic population.
Even within one nation, or state, like ours, there is significant variation. In Latin American countries these
differences are often even more exaggerated. In the Archdiocese, these differences were often represented to us in
negative terms (especially with respect to Mexicans), where in fact, they are an asset and an opportunity.
3. Hispanic/Anglo Relations. In addition to differences within the Hispanic community, there is a vast gap
in understanding between the English- and Spanish-speaking communities. This is also often represented in negative
terms, instead of as the opportunity that it is. There is significant anger toward the institution and between different
national groups within the Archdiocese. For example, English-speaking host parishes often comment on the mess
that people leave in the Hispanic masses. This is easily corrected by understanding how people use restrooms and
conceive of trash in Latin America and by coordinating volunteer clean-up committees. First and foremost comes
communication across these constituencies. Another example is the insulting stereotype that Mexican Catholics are
more "uneducated" (which glosses as bad-mannered in Spanish).
II. Parishioners There are vast numbers of Hispanics in north Georgia, and many are not being served by the Catholic
Church. The institution needs to decide what role to play in the lives of the Hispanic minority (soon to be a majority,
according to Bishop Arthur N. Tafoya, chair of the US Bishops' Committee on Hispanic Affairs). Hispanics are such

Hispanic Survey viii
an important minority, if we can still call them that, that are increasingly important players in the future of the
Church.
What are the main characteristics of the Hispanic population?
• The ratio of males:females in mass is 55:46 • We conservatively estimate the total population of Hispanics in North Georgia to be 460,000 • The average age of the population is 33 years • Women go to mass more often and are more likely to be married • Most people, 86% of the sample, are married or in a common law marriage • 15% have no children • Over 80% have no children in their home country (males of any age and all older migrants have more children
in home country) • The population as a whole has an average education of 9.7 years, women have 10 years, and men, barely 9—but
this differs widely by region and nation of origin • Hispanics come from 20 countries: Mexico is the birth country for over 75% of the sample, Colombia for 7%
and Guatemala for 4% • The average year of arrival in the US is 1992, and in Georgia is 1995 • At least 50% of the total Hispanic population is undocumented • About half send money home; especially those who report children left behind with relatives • Many still have strong ties to their country of origin—40% own a house there • The longer the US residence, the less money people send home • The most common form of household is for 3 family members to occupy two bedrooms and rent out the third
bedroom (or the living room) to 2 non family members • Hispanics not as mobile as is commonly thought—over two years average in their current housing; males are a
more mobile population than women. • Average rent is $665 per month • Most live in a house (49%), followed by apartments (36%) and trailers (12.5%) • Women work in meat packing (chicken plants) (11%) and domestic service (8%), professionals (7%) (13%
were professionals at home) • Men work in carpet (7%), meat packing (chickens) (10%) and construction (29%), including 8% who are skilled
construction workers or crew chiefs • In their home country, the largest group worked in agriculture (31%), with 13% in construction (13%) and 11%
professionals • Unemployment is less than 4% • Most (61%) do not speak any English, while 35% report that they are bilingual; 3.9% speak an indigenous
language • The main language spoken in the home is Spanish, but 10% speak English or English and Spanish at home • Most report that they come to mass every week • 80% get to mass in car, 9% by (paid) ride • 43% prefer mass at noon; and 80% prefer mass on Sunday • The mass in Spanish reflects their traditions • Few, 6.5%, have participated in another religion (or few who have participated in another religion return to the
Catholic church) • Half would prefer a parochial school for their children • 10% need baptism services, over 25% have used these services • 25% report a need for Bible study or spiritual study • Three-quarters of the population would serve in a ministry in the parish; 73% have never served in a parish
ministry • Most come to mass with between two and three other members of their household • 10% reported living in households with people who practice another religion

Hispanic Survey ix
What are the main needs of the Hispanic population?
• More report social needs (35%) than religious needs (29%) • Most people know what services are offered in their parishes • The greatest needs are for English classes (35%), legal advice (33%), helping getting driver’s licenses (28%),
and medical care (17%) • Few need financial help or job fairs—most are working and supporting themselves. • Services actually used include English (20%), other services (youth group, financial support and newcomers
groups) • Few parishes offer social services
Summary
The population of Hispanics is young, mobile, and recent (1995). It is predominantly male, but many live in
families in stable housing. The average household in this sample is made up of a married couple with two kids, who
share a three bedroom house ($665 rent) with 1 or 2 non relatives. They’ve lived in their residence for almost two
years, and have an average of two cars per household. Almost 90% speak mainly Spanish at home. Hispanics who
attend mass in north Georgia are relatively more highly educated than the majority of the population in their home
countries. Hispanics do not live in conditions that are much different from the non-Spanish speaking population,
except for the composition of the household. Only the presence of an average of two non family members in each
household indicates the composite structure of the household unit.
The needs, participation in and knowledge of religious services offered at parishes indicate that Hispanics
rate their sacramental, religious and pastoral needs highly (29%), although a somewhat higher figure report social
needs (35%). People are willing to participate in their parishes, but there is a big gap between willingness and actual
participation.
Hispanics in the Archdiocese "want to be welcomed" (Unity in Diversity, United States Catholic
Conference 2000),1 but often feel unwelcome. They want to be bicultural, and have begun the acculturation process,
but they do not want to lose their native language and customs. They want to learn English and participate in the life
of the church in the United States. This certainly resonates with the US Catholic Bishops' pastoral on "Welcoming
the Stranger," as well as Pope John Paul II's message.
1 Ibañez (2002) reports that students who feel welcome, do better in school.

Hispanic Survey x
Recommendations
Our recommendations are made with the recognition that we giving our professional advice, we report and
interpret what we see and what people tell us in the surveys and interviews. We make a series of recommendations,
followed by specific implementation strategies, where indicated. In addition, it would behoove the Archdiocese to
find out what other Arch/Dioceses have learned and done in this context.
1. Communication and Structure. We recommend email and web page contact for each parish—for
announcements, services, changes, help and more. We recommend increased intra-institutional contact among
diocesan leadership.
There are structural problems within the parishes, roles and responsibilities within Hispanic ministry aren’t
clearly defined, and as a result, messages get lost, ideas dissipate while being juggled around, and a “he said-they
said” confusion often reigns.
2. Hispanic Diversity. In order to become aware of the differences in the Hispanic population, and, in order
to reach people and to reduce misunderstandings, we recommend that the Archdiocese form groups of clergy, staff
and lay people from different nations and regions within nations to serve as advisors on cultural issues.
Implementation: The form could be as focus groups or committees. Independent consultants may best coordinate
focus groups, in which up to 10 people are recruited to discuss a topic with a moderator who is a combination
interviewer, researcher and therapist. The moderator must create a "safe" environment for people to be able to talk
about sensitive issues, which allows focus groups to produce meaningful information. Priests and staff should not be
present. Implementation: In addition, "listening sessions", dinners, or social events within the Archdiocese would
help increase communication and understanding. These should include the Archbishop, curia priests, and deacons—
both Hispanic and Anglo or African American or Asian, etc. Pot luck suppers, especially those that highlight
regional specialties, would be another way of encouraging all constituencies to know and appreciate each other. We
found only a few parishes that offer coffee after mass.
3. Hispanic/Anglo Relations. The Archdiocese needs a more thorough pastoral planning with respect to
diversity. Our experience in education has taught us that learning about folks who are different helps us understand
and appreciate them. Implementation. One way to increase understanding across cultural differences is to
incorporate those differences in the religious service, as testimony, or in some other way (see suggestions above, as
well). Implementation: Another way to increase understanding and communication across Hispanic constituencies

Hispanic Survey xi
and between Hispanic and English ones are cultural diversity workshops that deal with differences in language,
class, race (including skin color or ethnic group), and national origin. In addition, foreign clergy and religious sisters
need to learn English more proficiently and to learn about life in the US, both for immigrants and natives alike.
Implementation: cultural orientation of foreign clergy and religious sisters.
4. Broader Community Issues. A common frustration expressed by parishes is how to reach Hispanics who
are not active Catholics. From our work in the community, we know that most Hispanics learn about people and
places by word-of-mouth. We find that some people are very well informed; others aren't. The most common way of
finding out about church activities is via the announcements in mass—a time when there are lots of distractions. A
simple and effective way to increase knowledge about church locations and masses is to change advertising
strategies: post flyers with a mass schedule in businesses frequented by Hispanics or place a billboard in Spanish on
the interstate with a calling to mass. In a market where other churches are actively recruiting Hispanics, a little more
advertising could go a long way.
5. Stewardship. There is an apparent gap between actual participation (including tithing) and willingness to
participate in ministries. Increased participation would probably increase stewardship and overall support. First and
foremost, Hispanics need to feel welcomed in their church. Second, differential income and ability to contribute
must be accommodated. One of the common Latin American systems (see cargos, p. 6) could be adapted to include
men, women and children, to help run the church, and to give immigrants ownership of their US church, something
that we’ve seen in only a few places. Third, several parishes expressed a need for deacon training in Spanish, which
would facilitate many of the changes already mentioned here. The feeling was that deacons have to train in English,
a policy that inhibits Spanish-speakers from participating.
It appears as if Hispanics may not contribute proportionate to their numbers. In terms of stewardship, there
are a number of alternatives. One is to educate the more affluent parishes, and to encourage them to share their
resources and parish home with newer arrivals. If this doesn't work, we suggest encouraging Hispanics to take
greater ownership of their church in the United States. Welcoming strategies include Spanish signage and literature,
as well as social services. In addition, social ministries with active volunteer groups would help immigrant
parishioners to feel at home.

Hispanic Survey xii
6. Needs. The Hispanic population has high social and religious needs. We recommend expanded religious
and social services, include catechesis in Spanish, English classes,2 medical and legal advice. Implementation:
Create a social service ministry and organize volunteers in social service and other ministries, or use the concept of
"twinning" to teach successful models to other parishes.
In conclusion, we recommend that the Archdiocese help bridge differences without erasing those
differences. This would enrich the whole culture, reduce misunderstandings and increase participation at the same
time as it would help meet the urgent, very real needs of this population.
Future research
Further questions to study, in addition to a re-study every five years of the Hispanic population in mass,
would be a study of the total population of Catholics (especially non attendees and former Catholics). Another study
would target more acculturated Hispanics, i.e., those who attend English masses, to learn from their experience.
Endings and Beginnings
We see this report as a first step, a start toward increased understanding across constitutencies, a step
towards meeting the needs of people in great need, a step toward adapting to our changing world.
2 Of 26 free English classes offered in the area, 13 are offered in Baptist churches, a handful in churches of other denominations, some in secular organizations and a handful at Catholic churches.

RESUMEN EJECUTIVO
¿Quiénes somos? ¿Qué necesitamos? Evaluación de las necesidades de los Hispanos en la Arquidiócesis de Atlanta
Martha Woodson Rees y
T. Danyael Miller
Hispanos en el Norte de Georgia No solamente la Iglesia Católica pero todo los Estados Unidos en su totalidad se está volviendo más
Hispano. El número de inmigrantes Hispanos en el área del norte de Georgia ha crecido más de un 200% en la
última década con un crecimiento mayor después de 1995. Solamente en el área metropolitana de Atlanta, la
población Hispana creció por encima de 130%, de 30,000 en 1982 a más de 110,000 en 1992, a más de 234,010 en
1998, convirtiéndose en el mayor grupo minoritario no tradicional en la ciudad. Existen muchas razones por que la
gente emigra pero el factor más importante para nosotros en los Estados Unidos es el reconocer los beneficios que
los inmigrantes nos traen – mano de obra barata, viviendas, cuidado de niños, trabajo doméstico, etc. Todos nosotros
nos beneficiamos con esta nueva clase de Americanos entre nosotros.
Este estudio es un esfuerzo único por la Arquidiócesis de Atlanta de describir la diversidad y las
necesidades divergentes de los Hispanos a través de una encuesta al azar de más de un 10% de participantes en las
misas en Español. Probablemente, la única que se ha hecho hasta la fecha, una “sesión de escuchar” sistemática,
iniciada desde arriba hacia abajo. Esto va de acuerdo con el documento Vaticano II sobre los derechos y deberes de
la gente migratoria y la respuesta de la Iglesia local: el derecho de tener patria con sus lazos culturales y espirituales;
segundo, no solamente al derecho de emigrar sino los deberes del país anfitrión, como aprender el idioma; tercero, el
derecho del emigrante a conservar su lenguage y herencia espiritual.
Los Métodos
El cuestionario es un corto survey aplicado a una muestra de 50 individuos en cada una de las misas de los
sábados y domingos. Nosotros estimamos que 25,000 personas asisten a más de 60 misas en Español en la
Arquidiócesis de Atlanta todas las semanas . Estos datos nos dan una “fotografía” de los Católicos activos Hispanos
Hispanic Survey xiv
preparando a la Arquidiócesis para continuar el trabajo. Este proyecto simplemente describe las características
básicas de la población en orden de preparar el terreno para un futuro trabajo más cualitativo.
Resultados
Este reporte resume los resultados del survey y las entrevistas en las parroquias. Nuestras conclusiones tratan con (I)
la Arquidiócesis, y (II) los feligreses. Estas conclusiones nos llevan a una serie de recomendaciones las cuáles
ofrecemos como un primer paso a un proceso contínuo de reflexión y análisis llevado adelante por la Arquidiócesis.
I. La Arquidiócesis 1. Comunicación. Desde nuestro trabajo con las parroquias, ambos en término de dificultades en contactar a
muchos de ellos como también por los comentarios y necesidades expresadas por los sacerdotes, religiosas, personal
de las oficinas y voluntarios, esta claro que la comunicación no es clara, suave o fácil en muchos de los casos. De
hecho, la comunicación es dudosa a través de una gran parte de la Arquidiócesis. Muchas de las parroquias
(sacerdotes y el personal de las oficinas) no están conectadas con otros social o profesionalmente. Este contacto
aumentaría la viabilidad de todo el trabajo de la Arquidiócesis. Dentro de las parroquias hay necesidad de aumentar
la comunicación y coordinación entre el clero Hispano y el no-Hispano, laicado y personal de las oficinas de las
parroquias.
2. Diversidad Hispana. Existe una increíble variación económica y cultural de la población Hispana. Aún
dentro de una nación o estado como el nuestro hay una variación significativa. En países de Latinoamérica estas
diferencias son frecuentemente exagerada. En la Arquidiócesis estas diferencias muchas veces nos han sido
presentadas en términos negativos (especialmente con respecto a los Mexicanos), cuando de hecho, son una riqueza
y una oportunidad.
3. Relaciones Anglo/Hispana. Además de las diferencias con la comunidad Hispana existe un gran abismo
en comprender entre la comunidad Americana e Hispana. Esto también se representa muchas veces en términos
negativos en vez de la oportunidad que es. Existe un enojo significativo hacia la institución y entre los diferentes
grupos nacionales dentro de la Arquidiócesis. Por ejemplo, parroquias anfitrionas no-Hispanas, muchas veces
comentan en la condición que queda la Iglesia después de la misa en Español. Esto se corrige fácilmente
comprendiendo como la gente usa las facilidades sanitarias y el concepto de la basura en Latinoamérica y
Hispanic Survey xv
coordinando comités voluntarios de limpieza. Primero que nada tiene que existir comunicación entre los
constituyentes. Otro ejemplo es el insulto estereotipo que los Católicos Mexicanos son menos educados.
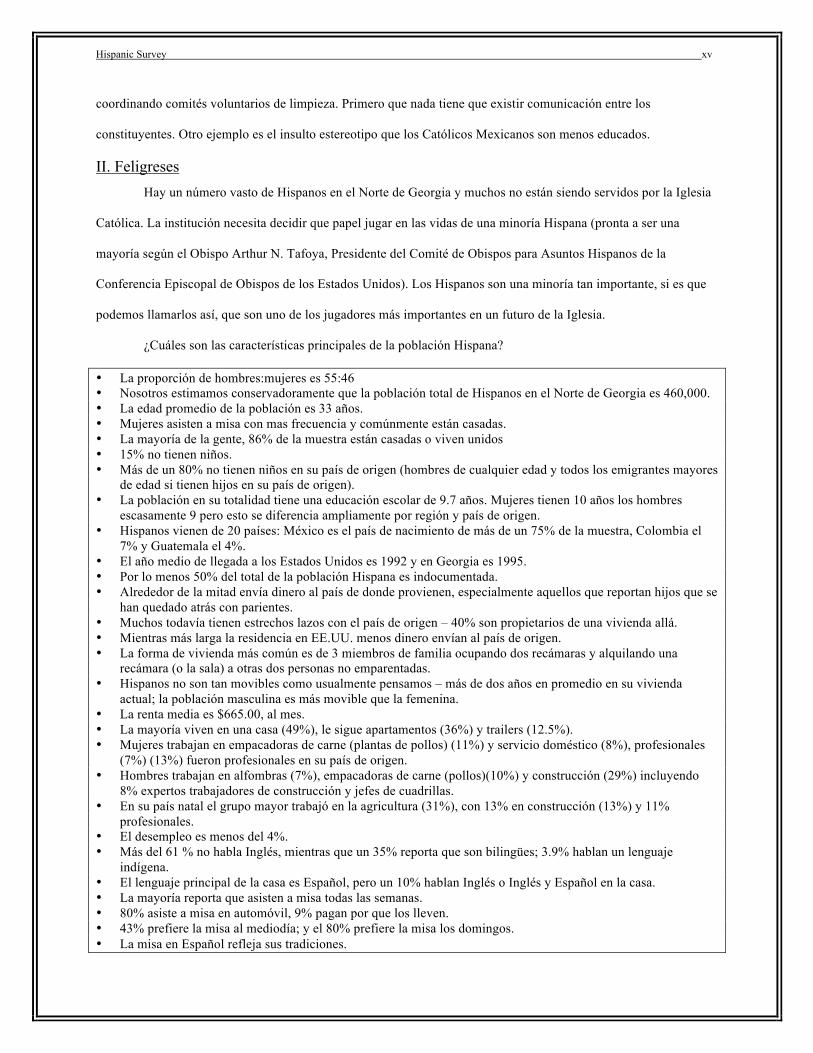
II. Feligreses Hay un número vasto de Hispanos en el Norte de Georgia y muchos no están siendo servidos por la Iglesia
Católica. La institución necesita decidir que papel jugar en las vidas de una minoría Hispana (pronta a ser una
mayoría según el Obispo Arthur N. Tafoya, Presidente del Comité de Obispos para Asuntos Hispanos de la
Conferencia Episcopal de Obispos de los Estados Unidos). Los Hispanos son una minoría tan importante, si es que
podemos llamarlos así, que son uno de los jugadores más importantes en un futuro de la Iglesia.
¿Cuáles son las características principales de la población Hispana?
• La proporción de hombres:mujeres es 55:46 • Nosotros estimamos conservadoramente que la población total de Hispanos en el Norte de Georgia es 460,000. • La edad promedio de la población es 33 años. • Mujeres asisten a misa con mas frecuencia y comúnmente están casadas. • La mayoría de la gente, 86% de la muestra están casadas o viven unidos • 15% no tienen niños. • Más de un 80% no tienen niños en su país de origen (hombres de cualquier edad y todos los emigrantes mayores
de edad si tienen hijos en su país de origen). • La población en su totalidad tiene una educación escolar de 9.7 años. Mujeres tienen 10 años los hombres
escasamente 9 pero esto se diferencia ampliamente por región y país de origen. • Hispanos vienen de 20 países: México es el país de nacimiento de más de un 75% de la muestra, Colombia el
7% y Guatemala el 4%. • El año medio de llegada a los Estados Unidos es 1992 y en Georgia es 1995. • Por lo menos 50% del total de la población Hispana es indocumentada. • Alrededor de la mitad envía dinero al país de donde provienen, especialmente aquellos que reportan hijos que se
han quedado atrás con parientes. • Muchos todavía tienen estrechos lazos con el país de origen – 40% son propietarios de una vivienda allá. • Mientras más larga la residencia en EE.UU. menos dinero envían al país de origen. • La forma de vivienda más común es de 3 miembros de familia ocupando dos recámaras y alquilando una
recámara (o la sala) a otras dos personas no emparentadas. • Hispanos no son tan movibles como usualmente pensamos – más de dos años en promedio en su vivienda
actual; la población masculina es más movible que la femenina. • La renta media es $665.00, al mes. • La mayoría viven en una casa (49%), le sigue apartamentos (36%) y trailers (12.5%). • Mujeres trabajan en empacadoras de carne (plantas de pollos) (11%) y servicio doméstico (8%), profesionales
(7%) (13%) fueron profesionales en su país de origen. • Hombres trabajan en alfombras (7%), empacadoras de carne (pollos)(10%) y construcción (29%) incluyendo
8% expertos trabajadores de construcción y jefes de cuadrillas. • En su país natal el grupo mayor trabajó en la agricultura (31%), con 13% en construcción (13%) y 11%
profesionales. • El desempleo es menos del 4%. • Más del 61 % no habla Inglés, mientras que un 35% reporta que son bilingües; 3.9% hablan un lenguaje
indígena. • El lenguaje principal de la casa es Español, pero un 10% hablan Inglés o Inglés y Español en la casa. • La mayoría reporta que asisten a misa todas las semanas. • 80% asiste a misa en automóvil, 9% pagan por que los lleven. • 43% prefiere la misa al mediodía; y el 80% prefiere la misa los domingos. • La misa en Español refleja sus tradiciones.

Hispanic Survey xvi
• Algunos 6.5% han participado en otra religión (o algunos que han participado en otra religión regresan a la Iglesia Católica).
• La mitad preferiría una escuela parroquial para sus hijos. • 10% necesitan bautizarse, más del 25% han sido bautizados. • 25% reporta la necesidad de un estudio Bíblico o espiritual. • Tres cuartos de la población servirían en algún ministerio en la parroquia; 73% nunca a servido en un ministerio
parroquial. • La mayoría asiste a misa con dos o tres otros miembros del hogar. • 10% reportó que viven en la casa con personas que practican o pertenecen a otra religión.
¿Cuáles son las necesidades principales de la población Hispana?
• Más reportan necesidades sociales (35%) que necesidades religiosas (29%). • La gran mayoría de la gente conoce que servicios ofrecen en sus parroquias. • Las necesidades más grandes son; clases de Inglés (35%), asistencia legal (33%), ayuda para conseguir licencia
de conducir (28%), y asistencia médica (17%). • Algunos necesitan ayuda económica o ferias de trabajo- la mayoría están trabajando y se mantienen ellos
mismos. • Servicios que actualmente han usado incluyen Inglés (20%), otros servicios (grupos juveniles, apoyo económico
y grupo de recién llegados). • Pocas parroquias ofrecen servicios sociales.
Resumen
La población Hispana es joven, movible y reciente (1995). Es predominantemente masculina pero muchos
viven en familia con vivienda estable. El modelo de hogar en esta muestra esta compuesto por una pareja casada con
dos niños y comparten una casa de tres recámaras ($665.00 pago mensual) con 1 o 2 parientes. Viven en su
residencia actual por casi dos años y tienen dos automóviles por vivienda. Casi el 90% solamente hablan Español en
la casa. Hispanos que asisten a misa en el norte de Georgia son relativamente más educados que la mayoría de la
población en su país. Los Hispanos no viven en condiciones muy diferentes a las que viven la población no-Hispana,
con la excepción de la composición del hogar. Solamente, la presencia de un promedio de dos personas que no son
parientes en el hogar es indicación de la composición estructurada de cada hogar.
Las necesidades, participación en y el conocimiento de los servicios religiosos que ofrecen las parroquias
indican que los Hispanos valoran altamente sus necesidades religiosas y pastorales (29%), aunque un número mayor
reporta necesidades sociales (35%). La gente está dispuesta a participar en sus parroquias pero existe una gran
separación entre la disposición y la participación actual.
Los Hispanos en la Arquidiócesis “quieren ser bienvenidos” (Unidad en la Diversidad, Conferencia
Católica de los Estados Unidos 2000), 1 pero usualmente no se sienten bienvenidos. Quieren ser biculturales y han
comenzado su proceso de aculturación pero no quieren perder su lengua natal y sus costumbres. Ellos quieren

Hispanic Survey xvii
aprender Inglés y participar en la vida de la Iglesia en Estados Unidos. Esto ciertamente resuena con la carta pastoral
de los Obispos de Estados Unidos “Bienvenida al Extranjero” así como el mensaje del Papa Juan Pablo II.
RECOMENDACIONES
Nuestras recomendaciones son hechas con el reconocimiento que ofrecemos nuestro consejo profesional,
reportamos e interpretamos lo que vemos y lo que la gente nos dice en la encuesta y entrevistas. Hacemos una serie
de recomendaciones seguido por estrategias específicas de Implementación como indicado. Añadimos que
corresponde a la Arquidiócesis el encontrar lo que otras Arqui/Diócesis han aprendido y hecho en este contexto.
1. Comunicación y Estructura. Recomendamos correo electrónico y página en el internet para cada
parroquia – para anuncios, servicios, cambios, ayuda y demás. Recomendamos aumentar el contacto intra-
institucional entre el liderazgo diocesano.
Existen problemas estructurales dentro de las parroquias, papeles y responsabilidades dentro del ministerio
Hispano que no están claramente identificadas y como resultado, mensajes se pierden las ideas se disipan mientras
van de un lado al otro y la confusión de “el/ella dijo – ellos dijeron” continúa reinando.
2. Diversidad Hispana. En orden de estar consciente de las diferencias de la población Hispana y en orden
de acercarse a la gente y reducir incomprensiones, recomendamos que la Arquidiócesis forme grupos del clero,
empleados y gente laica de diferentes naciones y regiones entre naciones a servir como consejeros en asuntos
culturales. Implementación: La forma puede ser la creación de grupos de enfoque o comités. Consultores
independientes que puedan coordinar los grupos de enfoque en los cuales hasta 10 personas se reúnen para discutir
un tópico con un moderador que sea a la vez una combinación de entrevistador, analista y terapeuta. El moderador
debe crear un ambiente “seguro” para que la gente pueda hablar acerca de asuntos sensibles que permiten que los
grupos de enfoque puedan contribuir con información que sea significativa. Sacerdotes y empleados no deben estar
presentes. Implementación. Añadimos que “Sesiones para escuchar”, cenas o eventos sociales dentro de la
Arquidiócesis puede ayudar a la comunicación y comprensión. Estas deben incluir al Arzobispo, sacerdotes de la
curia y diáconos – tanto Hispanos y Anglos o Africanos Americanos o Asiáticos, etc. Cenas comunitarias,
especialmente aquellas que resaltan especialidades regionales serían otra manera de animar a los constituyentes a
conocer y apreciar a cada uno. Solamente encontramos algunas parroquias que ofrecen café después de misa.
3. Relaciones Anglo/Hispanas. La Arquidiócesis necesita una planeación más completa con respecto a la
diversidad. Nuestra experiencia en educación nos ha enseñado que aprender acerca de los demás que son diferentes
Hispanic Survey xviii
a nosotros nos ayuda a comprenderlos y apreciarlos más. Implementación. Una manera de aumentar comprensión a
través de diferencias culturales es incorporar aquellas diferencias en servicios religiosos como testimonio o en
alguna otra forma (ver sugerencias anteriores también). Implementación: Otra forma de aumentar comprensión y
comunicación a través de constituyentes Hispanos y entre Hispanos y no-Hispanos es ofrecer talleres de diversidad
cultural que tratan de diferentes idiomas, clase, raza (incluyendo color de piel o grupo étnico), y nacionalidad.
Añadiendo que el clero extranjero y hermanas religiosas necesitan hablar Inglés más fluentemente y aprender como
es la vida en Estados Unidos tanto para emigrantes como para los nativos. Implementación: Orientación cultural para
el clero extranjero y hermanas religiosas.
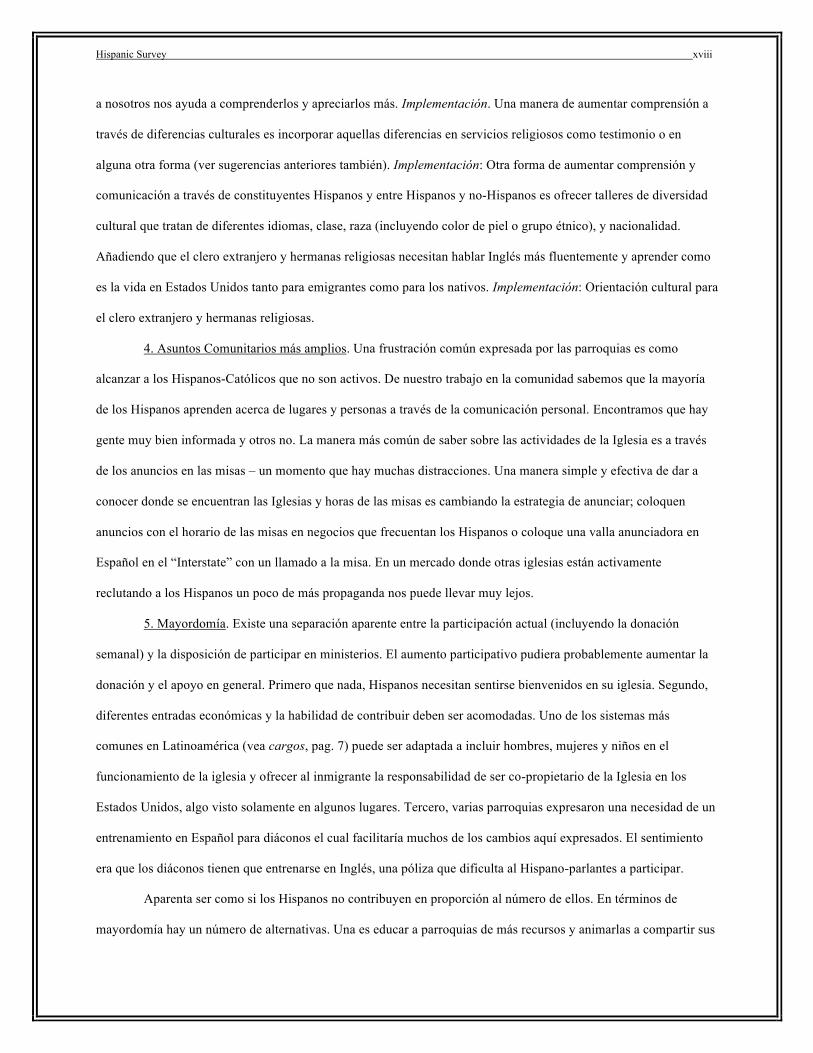
4. Asuntos Comunitarios más amplios. Una frustración común expresada por las parroquias es como
alcanzar a los Hispanos-Católicos que no son activos. De nuestro trabajo en la comunidad sabemos que la mayoría
de los Hispanos aprenden acerca de lugares y personas a través de la comunicación personal. Encontramos que hay
gente muy bien informada y otros no. La manera más común de saber sobre las actividades de la Iglesia es a través
de los anuncios en las misas – un momento que hay muchas distracciones. Una manera simple y efectiva de dar a
conocer donde se encuentran las Iglesias y horas de las misas es cambiando la estrategia de anunciar; coloquen
anuncios con el horario de las misas en negocios que frecuentan los Hispanos o coloque una valla anunciadora en
Español en el “Interstate” con un llamado a la misa. En un mercado donde otras iglesias están activamente
reclutando a los Hispanos un poco de más propaganda nos puede llevar muy lejos.
5. Mayordomía. Existe una separación aparente entre la participación actual (incluyendo la donación
semanal) y la disposición de participar en ministerios. El aumento participativo pudiera probablemente aumentar la
donación y el apoyo en general. Primero que nada, Hispanos necesitan sentirse bienvenidos en su iglesia. Segundo,
diferentes entradas económicas y la habilidad de contribuir deben ser acomodadas. Uno de los sistemas más
comunes en Latinoamérica (vea cargos, pag. 7) puede ser adaptada a incluir hombres, mujeres y niños en el
funcionamiento de la iglesia y ofrecer al inmigrante la responsabilidad de ser co-propietario de la Iglesia en los
Estados Unidos, algo visto solamente en algunos lugares. Tercero, varias parroquias expresaron una necesidad de un
entrenamiento en Español para diáconos el cual facilitaría muchos de los cambios aquí expresados. El sentimiento
era que los diáconos tienen que entrenarse en Inglés, una póliza que dificulta al Hispano-parlantes a participar.
Aparenta ser como si los Hispanos no contribuyen en proporción al número de ellos. En términos de
mayordomía hay un número de alternativas. Una es educar a parroquias de más recursos y animarlas a compartir sus

Hispanic Survey xix
recursos con otras parroquias con más recién llegados. Si esto no funciona, sugerimos animar a los Hispanos a
aceptar más co-responsabilidad por su iglesia en los Estados Unidos. Estrategias de bienvenida incluyen más
anuncios y literatura como también servicios sociales. En adición ministerios sociales con grupos de voluntarios
activos ayudarían a feligreses inmigrantes a sentirse en casa.
6. Necesidades. La población Hispana tiene grandes necesidades religiosas y sociales. Recomendamos
expandir los servicios religiosos y sociales, incluyendo catequesis en Español, clases de Inglés3 asistencia médica y
legal. Implementación: Crear un ministerio social y organizar voluntarios en servicio social y otros ministerios o
usar el concepto de (“twinning/entretejer”), enseñar modelos que han tenido éxito con otras parroquias.
En conclusión, recomendamos que el Arzobispo ayude a sobrepasar diferencias sin borrar esas diferencias.
Esto puede enriquecer la cultura en su totalidad, reducir incomprensiones y aumentar la participación y al mismo
tiempo ayudaría a responder estas necesidades urgentes y reales de la población.
Estudio Futuro
Más preguntas a estudiar, en adición a un re-estudio cada cinco años de la población Hispana en masa, sería
u estudio de la población total de Católicos (especialmente los que no asisten y los que ya dejaron de ser Católicos).
Otro estudio trataría de enfocar con los Hispanos más acculturados, por ejemplo aquellos que asisten a misas en
Inglés, para poder aprender de sus experiencias.
Principios y Fin
Nosotros vemos este reporte como el primer paso, el principio hacia un entendimiento entre todos los
constituyentes, un paso hacia la respuesta de la gente con gran necesidad, un paso hacia una adaptación de nuestro
mundo que cambia continuamente.
3 De 26 clases de inglés ofrecidas en el área, 13 son ofrecidas en iglesias Bautistas, un grupo pequeño de otras denominaciones, algunas organizaciones seculares y unas cuantas en las iglesias Católicas.

¿Quienes somos? ¿Que necesitamos? NEEDS ASSESSMENT OF HISPANICS IN THE ARCHDIOCESE OF
ATLANTA
HISPANIC IMMIGRANTS IN NORTH GEORGIA
Not only the Catholic Church, but the United States as a whole is becoming more Hispanic (US Census
Bureau 2001), the Hispanic Catholic Church is becoming more Mexican (Rodriguez 2002). The number of Hispanic
immigrants to the north Georgia area has grown over two hundred percent since 1990, with most growth after 1995
(Rees 2001b). The Hispanic population of Georgia is concentrated in the metropolitan area of Atlanta (Fulton,
DeKalb, Gwinnett, Cobb and Cherokee counties) (Figure 1),4 where the Hispanic5 population alone grew from 1982,
1992, 1998 and 2000 from 30,000 to 110,000, to 234,010, to 435,000 (Figure 2). Of these the fastest growing
subgroup was from Mexico (from 49,000 to over 265,000) with a 260% increase (Bixler 2002: E6) (Figure 3),
becoming the largest non traditional minority group in the city (CARA 1998) (see Figure 4).6 Metro Atlanta has
more than 60% of the total Hispanics in Georgia, with the largest relative concentrations in Cobb County (10%),
DeKalb (12%), Fulton (11%), and Gwinnett Counties (11%) (see Appendix D, p. 48). Much of this population is
undocumented and uncounted, thus its characteristics are largely unknown (Rees 2001b). In spite of this, the
Hispanic population is increasingly important economically and socially in the north Georgia region (Dameron and
Murphy 1997). The effects of Hispanic and Mexican immigration to Atlanta are notable: three radio stations that
broadcast in Spanish, and there are at least three Spanish language newspapers (Dameron and Murphy 1997).
Mexicans play an important role in the service sector, as well as in construction and industry (Saindon 1991).
4 Clayton, Rockdale, Henry, Douglas and Fayette counties were added to the metropolitan area in 1996. 5 The decision to use the term Hispanic to refer to the population that speaks mainly Spanish is based on popular use; other terms include Latino, as well as terms referring to people by their national identity. The definition of Hispanic population is ambiguous, although commonly agreed to include people born in Mexico, the Caribbean, South and Central America, as well as native-born US citizens of Hispanic descent.
6 Because many are undocumented or speak little English, Hispanics are hard to count. The Atlanta Journal Constitution reported 132,526 Hispanics for the expanded metro area in 1998 (Blevins 2000:JB18).

Hispanic Survey 2
Figure 1. Georgia Hispanic Population (1990)
Figure 2. Hispanic Population of the Atlanta Metropolitan Area, 1981-1998

Hispanic Survey 3
Figure 3. Metropolitan Atlanta Hispanics, 1998 County 1998 1990-1998 change % % of population
DeKalb 27,333 73 5 Fulton 23,865 76 3 Gwinnett 23,853 175 4 Cobb 22,024 128 4 Hall 9,932 116 8 Clayton 7,594 101 4 Cherokee 3,175 197 2 Fayette 2,764 176 3 Forsythe 2,324 265 3 Douglas 1,846 147 2 Henry 1,657 258 2 Rockdale 1,423 138 2 Carroll 1,296 119 2 Bartow 1,289 147 2 Coweta 1,157 201 1 Paulding 994 271 1 TOTAL 132,526
Source: Blevins (2000):JB18
Figure 4. Atlanta Area Immigrants—1996
Mexico 90,000 69.7% Puerto Rico 12,000 9.3% Colombia 8,000 6.2% Cuba 6,000 4.6% Costa Rica 2,000 1.5% Dominican Republic 2,000 1.5% El Salvador 1,300 1.0% Peru 1,300 1.0% Panama 900 0.7% Brazil 800 0.6% Honduras 700 0.5% Guatemala 700 0.5% Argentina 500 0.4% Bolivia 500 0.4% Uruguay 500 0.4% Venezuela 500 0.4% Ecuador 500 0.4% Nicaragua 400 0.3% Paraguay 300 0.2% Chile 200 0.2% TOTAL 129,100 100%
Source: CARA, spring 1996:8.

Hispanic Survey 4
"The Church, as a community of believers in Jesus Christ, has a tradition of accompanying people as they
migrate" (Kantner 1998). Of 110 missions and parishes in the Archdiocese in the fall of 2001, 48 Parishes and
Missions serve the Hispanic population with over 60 masses every week. This brief summary of work with Hispanic
immigrants in the Atlanta metropolitan region indicates that the number is rapidly growing and that we rely on
estimates and indirect information to calculate their numbers. We need accurate information, which is one of the
goals of this report. The origin of this study was in response to suggestions from priests that the needs of the
Hispanic population were not being met. These data are based on survey data from 63 Spanish masses in the
Archdiocese of Atlanta carried out in November 2001 (Appendix E, p. 52). Spanish masses make up 25% of the
services offered in the Archdiocese in 33% of the parishes.
Learning about this population is a necessary first step in being able to attend to their needs, as well as
reaching members of the population who are not currently being served. As throughout the United States, counting
undercounted population needs and characteristics is part of adequately planning for future needs and demands.
The causes of this rapid population increase are strongly debated, but the most reasoned analysis of the data
indicate that there are multiple factors, in home countries and in the United States, as well as world economic
conditions, at stake (see Jenkins 1997, Massey et al. 1994). Political and economic conditions in Latin America
contribute to migration—economic crisis, war. This situation was exacerbated by dramatic decreases in the world
markets for petroleum and other raw materials produced in Latin America. The crisis and resultant restructuring
encouraged labor (male and female) to move from sites of low wages (for example, in Mexico) to high(er) wage
areas (like the United States). In addition, conditions in Central and South America contribute to immigration to the
United States—drugs and war have pushed many migrants north.
Conditions in the United States likewise influence Hispanic immigration. As wages fell in the United States
and production continued its move to cheaper labor sites, often in Mexico, the US labor market became increasingly
service-oriented. Both of these factors (lower wages and demand for service labor) helped create a demand for low-
skilled, cheap labor (Castells 1980). Federal and state laws in the United States have sprung up in response to this
influx. US immigration laws do not stop the flow, but rather, affect the price and condition of labor—keeping it
cheap and afraid (Bustamante et al. 1992), which is why they should be called minimum wage laws instead of
immigration laws.
Hispanic Survey 5
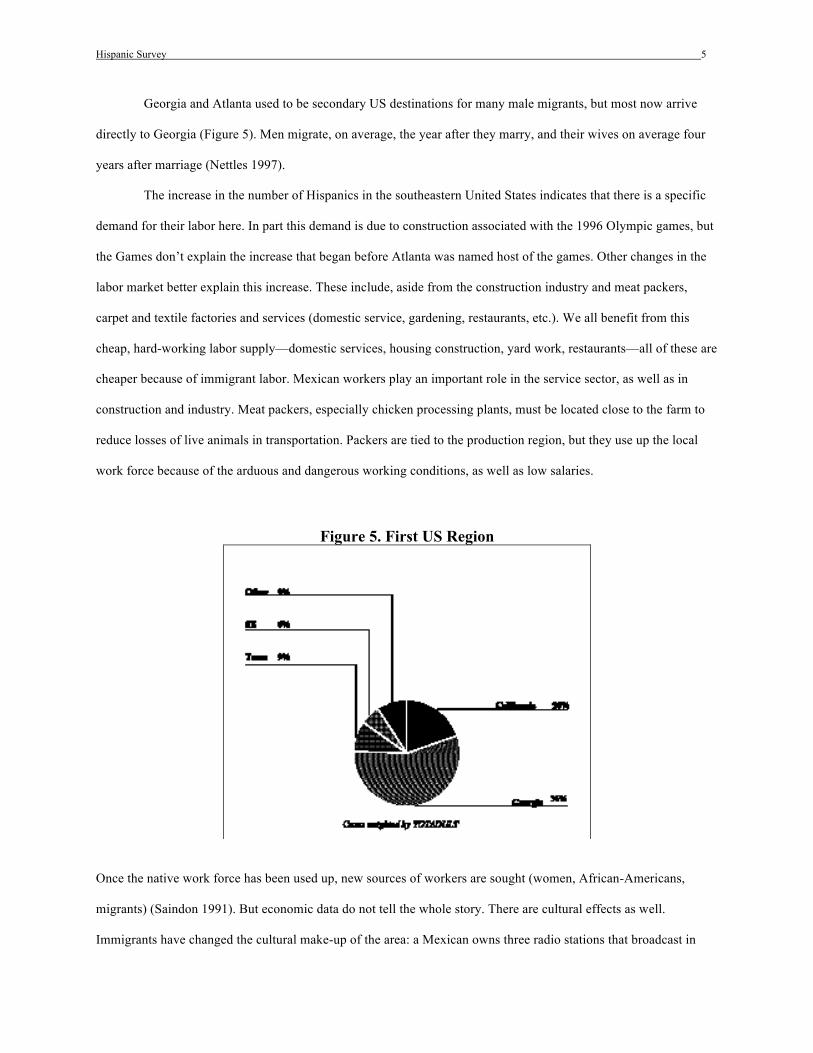
Georgia and Atlanta used to be secondary US destinations for many male migrants, but most now arrive
directly to Georgia (Figure 5). Men migrate, on average, the year after they marry, and their wives on average four
years after marriage (Nettles 1997).
The increase in the number of Hispanics in the southeastern United States indicates that there is a specific
demand for their labor here. In part this demand is due to construction associated with the 1996 Olympic games, but
the Games don’t explain the increase that began before Atlanta was named host of the games. Other changes in the
labor market better explain this increase. These include, aside from the construction industry and meat packers,
carpet and textile factories and services (domestic service, gardening, restaurants, etc.). We all benefit from this
cheap, hard-working labor supply—domestic services, housing construction, yard work, restaurants—all of these are
cheaper because of immigrant labor. Mexican workers play an important role in the service sector, as well as in
construction and industry. Meat packers, especially chicken processing plants, must be located close to the farm to
reduce losses of live animals in transportation. Packers are tied to the production region, but they use up the local
work force because of the arduous and dangerous working conditions, as well as low salaries.
Figure 5. First US Region
Once the native work force has been used up, new sources of workers are sought (women, African-Americans,
migrants) (Saindon 1991). But economic data do not tell the whole story. There are cultural effects as well.
Immigrants have changed the cultural make-up of the area: a Mexican owns three radio stations that broadcast in

Hispanic Survey 6
Spanish, and there are at least 11 Spanish language newspapers. Not only is the United States becoming
Hispanicized, so also is the Catholic Church (Rodríguez 2002). We have a new working class in the new
millennium, a working class of immigrants who are controlled by denying them working papers. We all need to be
cognizant of this change in our nation, a change that benefits us all by providing us with cheap services, houses,
food and more. This is the future: we can treat it as a problem or as an opportunity for us all. But we ignore it to our
peril.
Beliefs and Culture
Immigrants have brought many elements of their diverse cultures with them. Latin America is a vast
geographic region, more diverse than all of Europe in its languages. Even taking Spanish alone, the differences and
intelligibility vary more than the different versions of English spoken around the world (due to longer separation
from each other, and deeper isolation even today). Latin America has a longer historical tradition than almost any
area on the planet (except China, Egypt, the Middle East), going back to the earliest settlements of over 20,000 years
go, to the first cities and writing about 3000 years ago. In addition, Latin America is blessed with unparalleled and
vital ecological resources; new species of plants and animals are being discovered, many with medical or other
instrumental uses. The artistic and intellectual production of Latin Americans has played a key role in the
development of contemporary culture and religion; it has a lot to teach us about the many different voices they
represent.
Religious practices, like cultural practices, also vary from region to region. Practices in Mexico, which are
most familiar to the present authors, are markedly different from those in the United States. The most important
difference may be that support of the church in Mexico is often not through tithing, but through donations, labor and
volunteer work. Even a rich person may give only $2US per mass. This has important implications for support.
There are other than financial ways of support, especially for people whose income is low. In rural Mexico,
people, usually men, acquire social status, through their volunteer work for the community and church. Called
cargos (burdens), these transformations of colonial and earlier systems of labor taxation, account for an important
part of church support and functioning. For example, men volunteer as night watchmen for a year of service. Even if
the man migrates to the United States, he must pay some one else or get another family member to serve. From
relatively lowly positions, usually reserved for younger men, the cargos rise in importance and responsibility until
Hispanic Survey 7
the highest, which is the mayordomo, or patron of the saint’s fiesta, a cargo that involves considerable expense (up
to $10,000US). But once a person (and not everyone does) has carried out the highest cargo, he retires from
volunteer service demands and becomes an honored community elder.
Families struggle and sacrifice in order to reconstitute as one unit. They send for family members, and send
money to those back home (see Rees and Nettles 2000). They support and sponsor new migrants to the area. Just the
flow of remittance dollars (estimated to be $150 per month per household in Atlanta, and, on a national level, runs to
the billions of dollars yearly) tells us that migration is not the behavior of an individual seeking the highest wages
and best life. It is a family survival strategy—these families don't like being separated and they don't like living in
the diaspora, so they work and save and trek across the desert in order to live under one roof. Once in the United
States, Hispanics reproduce and adapt their cultures7 to their new life in the United States—food, language, some
customs. Social ties—tandas (group loan funds) for loans, music, dress, cars, exchange of goods, and ceremonial
occasions (e.g., birthdays) look Hispanic, even some churches have an Hispanic touch. People create a cultural
pluralism that resists globalization and the necessity to migrate as part of a new international division of labor by
recreating their cultures in response to their new lives in the United States. In this process, some things are changed
or dropped. Many others are adapted, but retained. Language, for example, remains strong in the home, but many
children prefer to speak English.
Hispanic immigrants, both documented and undocumented, are hard to count. Because of their history with
US officialdom, many are not counted or are missed in national and local censuses. This invisibility also keeps them
from accessing social services and their basic human rights.
The research design for this project is a synchronic (one-time) survey of a random sample of attendees at
Spanish masses. We compiled information on capacity, attendance, services and masses from a phone interview
with each parish (see Appendix F and Appendix G). The questionnaire is about 50 questions on one two-sided page;
it takes from 5 to 10 minutes to fill out, depending on the person (Appendix B, p.43). The questionnaire was applied
to a random sample of 50 adults per mass (see Appendix E, p. 40). The data reported here are averages for the whole
population, but it must be noted that there is wide variation from parish to parish (see for example, the percentage of
women and the ratio of children per woman per mass in Appendix E, p. 52).
7 There is no Hispanic culture, but multiple cultures: country, region, historical period, class and ethnicity create multiple and dynamic Hispanic cultures.

Hispanic Survey 8
In order to take the different sizes of the masses into account, we weight the masses by overall size so that
30 surveys from a mass of 250 attendees weighs less than 30 surveys from a mass of 1000 attendees.
Limitations
There are a number of methodological limitations to this, as any, survey, some of which were inevitable,
others that could have been avoided. Some men passed the survey to their wives, and some women passed the
survey to their husbands. Other couples filled out the questionnaire for both of them. Still others did not fill out the
questionnaire and either took it with them or turned it in blank. There may have been a greater number of men filling
out forms for their wives, which may give us a male bias in the questionnaire. We will take this into account in the
analysis. The only way to have avoided this would have been to have interviewers ask the selected individuals the
question, a preferable method, but not feasible given our financial and time constraints.
The questionnaire design, in spite of numerous tests, presented some difficulties. First, because the spaces
asking for age were not boxes (as elsewhere on the form), a lot of people didn’t see the question and didn’t answer
it. Second, some of the questions (especially those asking about services offered, used and needed) were repetitive,
causing respondents to get confused and inattentive to their answers. Third, there were numerous problems with
language, since the varieties (called registers by anthropologists) of Spanish spoken throughout the hemisphere vary
enormously. Even within a country, the same word can have different meanings. In addition, Spanish in the United
States is dynamic, responding to new conditions, adding words, changing pronunciation—evolving, as languages do
all the time. Often these changes are seen negatively by representatives of the ‘old guard’, especially those who
pride themselves with speaking an elite register. As anthropologists, we think that languages must change in order to
stay alive; that language represents people’s daily lives and that there is no correct form of language, just what
people speak. In the survey, there were numerous disagreements between the anthropologists (include all varieties)
and language purists over word choice.

Hispanic Survey 9
Sample limitations
One of the pressing issues is how does this sample reflect the population as a whole, including non
attendees (or those who attend other churches, including English masses)? We believe that Hispanic men attend
mass in greater numbers than they do in their home country, and that this is increasing, although not as much as do
women. Young adults, men and women, were not targeted in this survey. Hispanics in remote areas without public
or other transportation might be less likely to attend. For these reasons, we cannot generalize about the total
Hispanic population from this sample, even though it does give us rich data with which to start.
In addition, there are many Hispanics who attend English mass, especially migrants with a long history in
the US, with children whose mother tongue is English. The 1990 estimate of the number of Cubans in Atlanta was
7800 (or 3% of the Hispanics) (Bixler 2002:E6), the 1996 estimate is 6000 (CARA 1996) and the 2000 estimate is
over 12,500 (Bixler 2002:E6). In our sample, Cubans represent less than 1% of mass attendees, probably a reflection
of higher Cuban attendance at English masses due to their higher integration into mainstream US society.
Privacy considerations
As anthropologists we are bound to make sure that our research does not hurt the people who give us
information. Because this survey was carried out in mass, we assume that there was some level of pressure
involved—few people refused to answer. But also, the church is one of the few places where undocumented
immigrants feel safe. The survey was voluntary and it is completely anonymous—we can identify no individual
from their answers.
THE SETTING: Parishes and Missions
Each parish has its own distinct character, but we found that there are two main kinds of parishes with
Hispanic masses in the archdiocese: One, the most common, is an established English-speaking parish with one or
more masses in Spanish. These parishes may have a large Spanish-speaking population, with priest or vicar, lay and
religious staff and numerous activities, often with visible Spanish notices and signs outside or in the entry way (e.g.,
Gainesville). Others of these parishes have a small Hispanic population, a visiting priest and little or no Spanish
presence in the church or buildings. We only found one that has a bilingual service. The other kind of parish is the

Hispanic Survey 10
missions with resident priests and lay and religious workers, an all-Spanish environment. The missions have more
programs and activities in Spanish (see Appendix G and Appendix F).
In many parishes, there is conscious separation of Hispanics and Anglos.8 Hispanics are told not to handle
the hymnals in the English-speaking churches and we have heard comments that indicate that they are not welcome
in some parishes—a feeling that Spanish-speakers recognize. There are cultural reasons for this, based primarily on
cultural ignorance on both sides, as well as different perceptions and behavior in public and private spaces. Within
the Hispanic population itself, there is lots of resentment between people of different social class or national origin,
principally directed towards Mexicans. We’ve heard comments (in Spanish) like “Our parish is more cultured than
such-and-such (highly Mexican) parish.”
There is a lot of variation in Hispanic participation in services, especially by gender, from parish to parish.
Some parishes have women lectors; in a few, the priest shakes the hands of parishioners during the kiss of peace or
after. This report attempts to represent this diversity parish by parish and between parishes.
Sociodemographic Data
The population of Hispanics is young, mobile, and recent (1995). It is predominantly male, but many live in
families in stable housing. We assume from our work in the community and our knowledge of the migrant flow, that
there are more male Hispanics than females, by a ratio of about 80/20 (see Rees and Miller 2000). We do not see
this ratio in our data, which shows a ratio of males:females of 55:46—a higher proportion of females than in the
population as a whole. As in Latin America, more women attend mass than do males (we estimate a ratio of 20:80
males:females). Based on these assumptions, we estimate that the Hispanic mass sample (55% male) represents 80%
of the total population. If we estimate mass attendance at 5% and the total attendance was about 23,000 in
November 2001 (see Appendix E, p.52), then we conservatively estimate the total population of Hispanics in North
Georgia to be 460,000,9 a figure that agrees with other estimates of the total Hispanic population.
8 We’re not able to comment on relations between Hispanics and African-Americans. 9 See the section on Limitations for other limitations on this calculation (p. 8).

Hispanic Survey 11
Age The average age of the population is 33 years (Figure 6), much younger than the US, which has a median
age of 36 for the entire population (including children), and a median age for adults over 19 of 40-44 (US Census
Bureau 2001). The age structure jumps sharply from the late teens, since the survey was only applied to adults, and
then slopes gradually into the later years.
Figure 6. Age Mean 33.16 Median 32.00 Mode 28
Gender The population that attends mass in Spanish is just less than half female (47%) (Figure 7), but the
percentage of women in mass varies from parish to parish (see Figure 8).
Figure 7. Gender % of Total N
Female 45.8% Male 54.2%

Hispanic Survey 12
Figure 8. Women and Children in Mass by Parish
If we take into account that more women attend mass than men do, this confirms that there are lots more men out
there than women. There are gender differences in mass attendance (Figure 9), education (Figure 10), mobility
(Figure 11), marital status (Figure 12), as well as the expected differences in home and US occupation (Figure 13,
Figure 14): women go to mass more often, have one year more education, and are somewhat more likely to be
married, and more likely to be divorced or single parents.
Figure 9. Weeks since Last Mass
Mean 3.9 Median 1 Mode 1
STD. DEVIATION 13.9

Hispanic Survey 13
Figure 10. Education by Gender GENDER Mean Std. Deviation Median Female 10.11 3.98 9 Male 9.36 3.80 9 Total 9.70 3.91 9
Figure 11. Residential Stability SEX Mean Std. Deviation Median Female 33.49 88.16 18 Male 26.78 28.23 16 Total 29.80 62.76 18
Figure 12. Marital Status Percent single 17.9 married 73.9 divorced, separated or single parents 7.0 widowed 1.2 Total 100

Hispanic Survey 14
Figure 13. Occupation by Gender in Home Country Female Male Unemployed 2.6% 1.7% Child care 2.5% .2% Housework 29.9% .7% Handicapped .3% Retired .2% .0% Yard .1% 1.5% Driver .6% 5.6% Domestic 5.9% .7% Carpet .8% .4% Packing 3.5% 2.1% Restaurant 3.5% 2.0% Maintenance .5% 1.7% Administrative 10.0% 2.5% Construction .2% 13.3% Sales 3.7% 6.3% Crew chief, skilled .3% 4.0% Professional 13.9% 10.7% Employee 6.6% 5.1% Agriculture 5.1% 30.7% Factory .3% .8% Electrician .6% Seamstress .6% Student 6.8% 5.9% Commerce .1% .4% Painter .1% Hair .7% Mechanic .5% Owner .1% .3% Fireworks .1% Solder .7% Nurse 1.1% Army .9% Police .2% Crafts .0% Mining .0% Shoe maker .1% Music .1% 100.0% 100.0%
Hispanic Survey 15
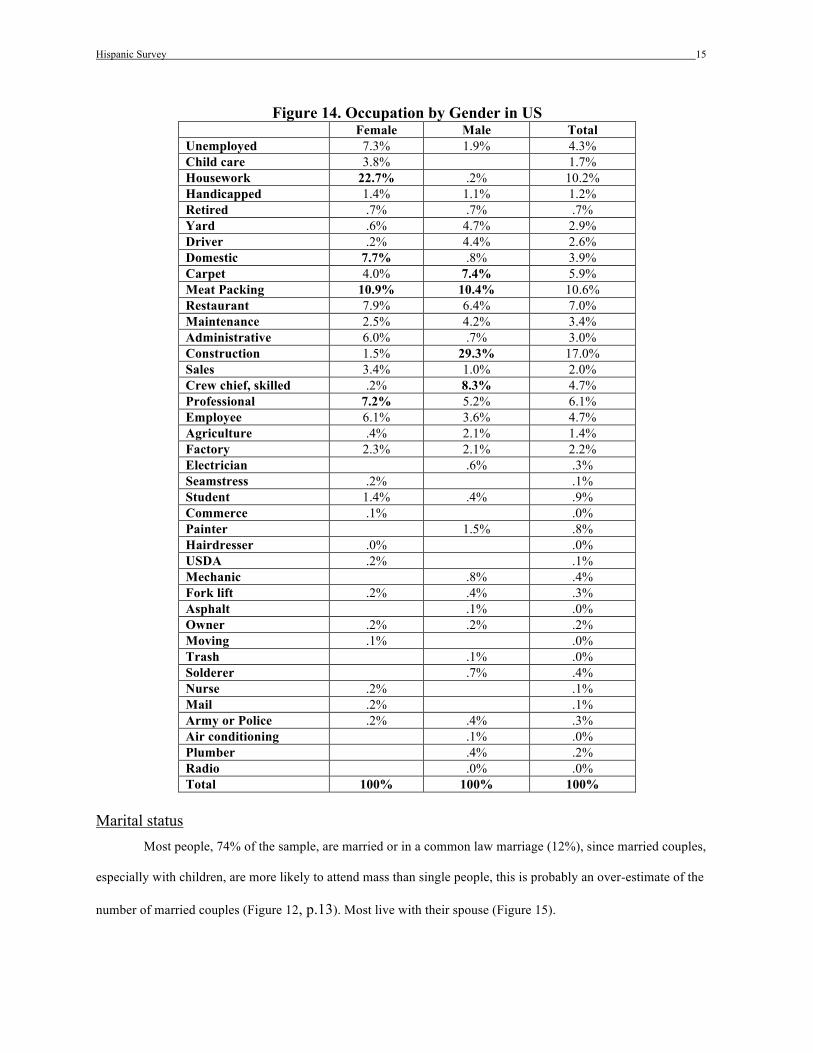
Figure 14. Occupation by Gender in US Female Male Total Unemployed 7.3% 1.9% 4.3% Child care 3.8% 1.7% Housework 22.7% .2% 10.2% Handicapped 1.4% 1.1% 1.2% Retired .7% .7% .7% Yard .6% 4.7% 2.9% Driver .2% 4.4% 2.6% Domestic 7.7% .8% 3.9% Carpet 4.0% 7.4% 5.9% Meat Packing 10.9% 10.4% 10.6% Restaurant 7.9% 6.4% 7.0% Maintenance 2.5% 4.2% 3.4% Administrative 6.0% .7% 3.0% Construction 1.5% 29.3% 17.0% Sales 3.4% 1.0% 2.0% Crew chief, skilled .2% 8.3% 4.7% Professional 7.2% 5.2% 6.1% Employee 6.1% 3.6% 4.7% Agriculture .4% 2.1% 1.4% Factory 2.3% 2.1% 2.2% Electrician .6% .3% Seamstress .2% .1% Student 1.4% .4% .9% Commerce .1% .0% Painter 1.5% .8% Hairdresser .0% .0% USDA .2% .1% Mechanic .8% .4% Fork lift .2% .4% .3% Asphalt .1% .0% Owner .2% .2% .2% Moving .1% .0% Trash .1% .0% Solderer .7% .4% Nurse .2% .1% Mail .2% .1% Army or Police .2% .4% .3% Air conditioning .1% .0% Plumber .4% .2% Radio .0% .0% Total 100% 100% 100%
Marital status Most people, 74% of the sample, are married or in a common law marriage (12%), since married couples,
especially with children, are more likely to attend mass than single people, this is probably an over-estimate of the
number of married couples (Figure 12, p.13). Most live with their spouse (Figure 15).

Hispanic Survey 16
Figure 15. Spouse's Residence Percent Georgia 85.5 US 2.5 Home Country 11.2 Don't Know .6 Other .1 Total 100
Children Women take an average of.8 children to mass, but report a total of 2.3 children each, two of whom are in
the United States. The largest age group is between 0-5 years (Figure 16) (note: many women have not finished
childbearing). About twice as many men as women have children back home (an average of .59 vs. .32). In the total
sample 15% have no children, 46% in the US have no children. Over 80% have no children in their home country
(males of any age and all older migrants have more children in home country (both significant at the.000 level).10
Figure 16. Children by age group Children
0-5 Children
Elementary (GA)
Children Middle School
(GA)
Children in High School
(GA)
Children graduated from high
school (GA)
Children in Home Country
TOTAL number of children
.73 .66 .20 .14 .15 .46 2.31
The ratio of children under 15 years of age to women is about 1.6 children per women, although the women
themselves report that they have 2.4 children in all, of whom most (2) are here in the United States. In the total
10 When we calculate the correlation (or co-variation) of two variables, we use probability to estimate the chance that that correlation is due to chance. The measure of the probability that a relation between two variables is not due to chance is significance. A level of significance of.05 or lower (.000) means that the probability that this relation is due to chance is less than 5%. Said a different way, 5% of the cases may be due to chance. An example of this would be if we want to see if there is a relation between consumption of aspirin and heart attacks. In a large enough sample, we would expect that 5% of the population would consume lots of aspirin and have a high rate of heart attacks by chance. The reverse is also important: 95% of the population does not show a relation between aspirin consumption and heart attacks. We use significance to calculate the probability, then, that a correlation is a chance phenomenon. In social sciences, we generally accept the 5% level of significance. If a relationship is

Hispanic Survey 17
sample 15% have no children, and 82% have no children in their home country. Males of any age and all older
migrants have more children in home country than do women. Children tend to stay with their mother.
Education The population as a whole has an average education of 9.7 years, but women have an average of 10 years,
and men, barely 9 (Figure 10, p. 13). But this differs widely by region and nation of origin (Figure 17), as is
indicated by the standard deviation of over four years.11 In addition, average education varies widely from parish to
parish (Figure 18).
Figure 17. Education by Birth Country
significant at the 10% level, and 10% of the cases may be due to chance, we are reluctant to say that the two variables are correlated.
11 The standard deviation (s.d.) gives us a measure of the dispersal of the distribution. A standard deviation of half the mean means that 95% of the cases are found within plus or minus half the average—a wide standard deviation in most cases.
Hispanic Survey 18
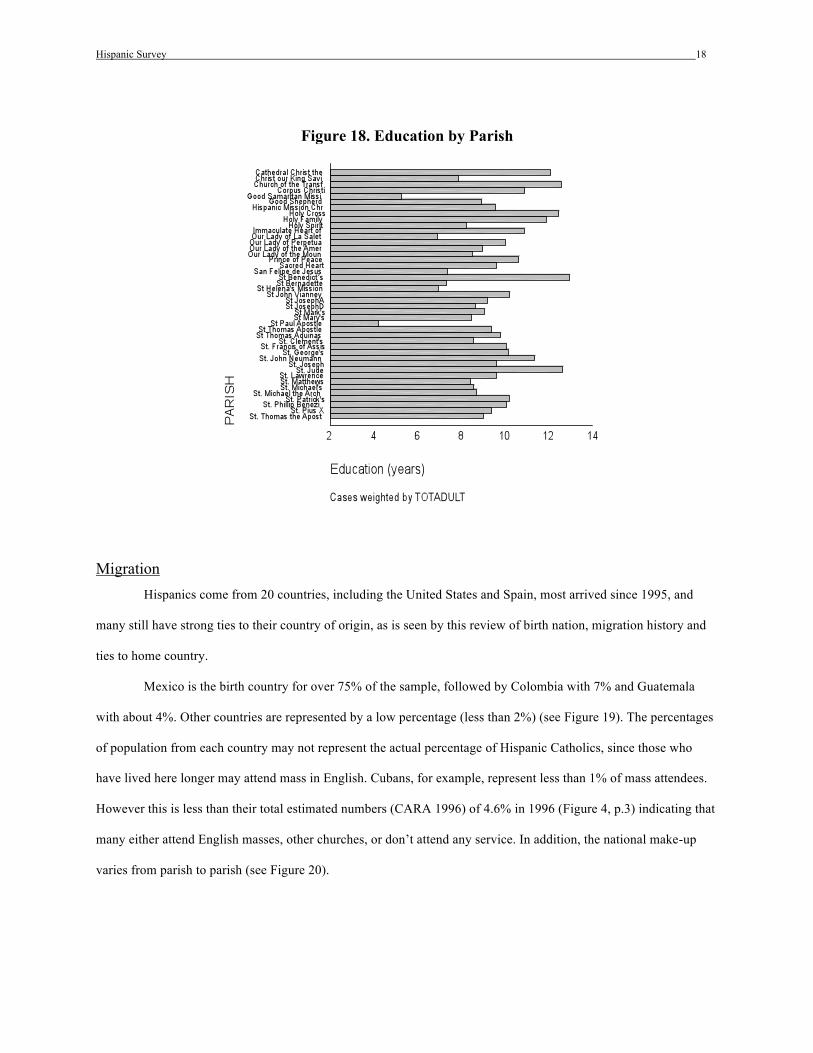
Figure 18. Education by Parish
Migration Hispanics come from 20 countries, including the United States and Spain, most arrived since 1995, and
many still have strong ties to their country of origin, as is seen by this review of birth nation, migration history and
ties to home country.
Mexico is the birth country for over 75% of the sample, followed by Colombia with 7% and Guatemala
with about 4%. Other countries are represented by a low percentage (less than 2%) (see Figure 19). The percentages
of population from each country may not represent the actual percentage of Hispanic Catholics, since those who
have lived here longer may attend mass in English. Cubans, for example, represent less than 1% of mass attendees.
However this is less than their total estimated numbers (CARA 1996) of 4.6% in 1996 (Figure 4, p.3) indicating that
many either attend English masses, other churches, or don’t attend any service. In addition, the national make-up
varies from parish to parish (see Figure 20).

Hispanic Survey 19
Figure 19. Birth Country (%) Mexico 75.1 Colombia 7.3 Guatemala 3.9 US 2.1 Peru 1.8 El Salvador 1.6 Puerto Rico 1.6 Venezuela 1.2 Honduras 1.1 Dominican Republic .8 Costa Rica .7 Cuba .6 Nicaragua .6 Ecuador .4 Chile .3 Panama .3 Argentina .2 Bolivia .1 Brazil .1 Spain .1 Romania .1 Belize .0 Japan .0 Portugal .0 Total 100

Hispanic Survey 20
Figure 20. Birth Country by Parish (%) Central
America Colombia Cuba Guatemala Mexico Caribbean South
America Other
Cathedral Christ King 2.7% 13.5% 2.7% 8.1% 56.8% 10.8% 5.4% Christ King Saviour 6.3% 4.2% 87.5% 2.1%
Corpus Christi 9.1% 9.1% 4.5% 63.6% 9.1% 4.5% Good Samaritan 3.8% 65.4% 26.9% 3.8% Good Shepherd 8.2% 2% 4.1% 83.7% 2%
Mission Christ King 7.5% 2.5% 90% Holy Cross 21.4% 21.4% 2.4% 2.4% 33.3% 2.4% 11.9% 4.8%
Holy Family 2% 30% 40% 10% 10% 8% Holy Spirit 2.3% 97.7%
IHM 8% 8.5% 2.2% 67.1% 4.8% 7% 2.3% Mision Catolica 9.2% 3.8% .7% 3.8% 73.8% .2% 6.8% 1.6%
Our Lady LaSalette 35.6% 57.8% 2.2% 2.2% 2.2% Our Lady Mts. 80% 20%
Our Lady Perpetual 44.9% 4.1% 2% 8.2% 40.8% Prince of Peace 20% 2.2% 4.4% 60% 4.4% 4.4% 4.4% Sacred Heart A 2.2% 2.2% 2.2% 88.9% 2.2% 2.2% Sacred Heart G 96.2% 1.9% 1.9%
San Felipe Mision 2.4% 97.6% St Bernadette 10.4% 87.9% 1.6% St Joe Athens 6.1% 2% 83.7% 4.1% 4.1% St Joe Dalton .8% 2.1% 7.3% 83.1% 1.3% 5.5% St Matthews 4.7% 93% 2.3%
St Michael Archa 2.1% 14.9% 74.5% 6.4% 2.1% St Paul Apostle 3.3% 96.7%
St Pius 4.2% 2.1% 85.4% 2.1% 6.3% St Thomas Apostle .7% 1.2% 93.5% 1% .9% 2.7%
St. Benedicts 1.7% 54.3% 19% 4.7% 18.2% 2.1% St. Clements 4% 2% 6% 88%
St. Francis Assisi 7.1% 83.3% 2.4% 2.4% 4.8% St. George's 100% St. Helena's 100%
St. John Neuman 6.1% 13.4% 1.4% 65.7% 8.8% 3.4% 1.4% St. John Vianney 6.7% 3.3% 3.3% 76.7% 3.3% 6.7%
St. Jude 2.1% 31.9% 2.1% 36.2% 21.3% 6.4% St. Lawrence 15.6% 4.4% 2.2% 68.9% 6.7% 2.2%
St. Mark's 3.8% 96.2% St. Mary's 2% 28% 70%
St. Michael's 1% 1% 95.8% 2.1% St. Patrick 3.9% 11.8% .5% 78.8% 2.1% 1.3% 1.6%
St. Philip Benezi 11.1% 2.2% 60% 22.2% 4.4% St.Joseph 5.6% 2.8% 77.8% 2.8% 8.3% 2.8%
StThomasAquinas 95.9% 4.1% Transfiguration 2.4% 9.5% 2.4% 4.8% 54.8% 11.9% 11.9% 2.4%
TOTAL 4.3% 7.3% .6% 3.9% 75.1% 2.4% 4.1% 2.3%

Hispanic Survey 21
The average year of arrival in the US is 1992, and in Georgia is 1995, although the most common (mode)
arrival year is 1999 (Figure 21). However, the average year of arrival varies significantly by country of origins:
Cubans are the oldest population, and South Americans (other than Colombia) are the most recent) (Figure 22). We
did not ask respondents about their immigration documents, but 76% of Mexicans arrived after 1989 (after the
Immigration Reform and Control Act—IRCA, when amnesty was granted to immigrants who could prove they’d
lived in the United States). This indicates that probably most Mexicans, and thus, most Hispanics, do not have
documents. Since 73% of the total population is Mexican, this means that at least 50% of the total Hispanic
population are undocumented. A look at the histogram shows that these numbers are increasing (Figure 23).
Figure 21. Migration Year US Year Georgia
MEAN 1992 1995 Median 1995 1997 Std. Deviation 8 5
Figure 22. Birth Region by US Year

Hispanic Survey 22
Figure 23. Year Arrived in Georgia
Migrants have strong ties to their home country: about half send money home; especially those who report
children in their home country, as well as more recent migrants (Figure 24). Over 40% report a house in the home
country. These ties have important implications for the relation of Hispanics to churches in the United States.
Figure 24. Relation of Remittances to Migration Year Remit Year US Remit Pearson Correlation12 1 -.051 Sig. (2-tailed) . .000
People who send money home (almost 50% send money at least sometimes, Figure 25) tend to be those
who have children in their home country (an average of .46 per person) (Figure 16, p. 16). Remittances in this
sample, as in other populations, relate to years in the US—the longer the US residence, the less money people send
home (Figure 25). Many people report owning property in their home country—39% have a house, 10% a vehicle,
2% a store and 15% own land.
12 See Appendix A.

Hispanic Survey 23
Figure 25. Remitters Percent yes 49.9 no 20.7 sometimes 29.4 Total 100.0
Culture and social relations: Life in the US of A
The sample is made up of 46% females and 54% males, an indication of the growing number of women
migrants in the area, although this is also a reflection of women’s higher attendance at mass (Figure 7, p. 11).
Household and Housing Hispanics live in households with an average of five people in them (S.D. 2.8) (see footnote 11); 60% of
whom are family. Since the average number of bedrooms is three (a standard deviation of three indicates that 95%
of households have between 2 and 4 bedrooms) we infer that the most common form of household is for family
members to occupy two bedrooms and rent out the third bedroom (or the living room) to non family members
(Figure 26 and Figure 27).
Figure 26. Household Composition
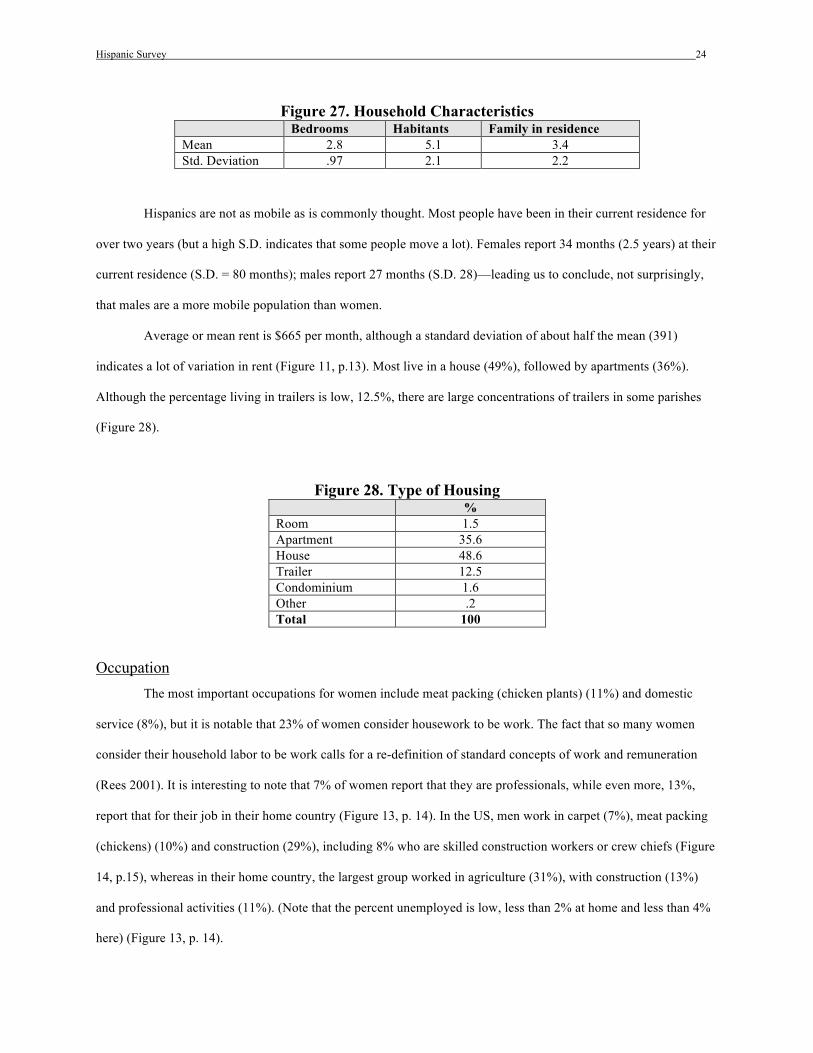
Hispanic Survey 24
Figure 27. Household Characteristics Bedrooms Habitants Family in residence Mean 2.8 5.1 3.4 Std. Deviation .97 2.1 2.2
Hispanics are not as mobile as is commonly thought. Most people have been in their current residence for
over two years (but a high S.D. indicates that some people move a lot). Females report 34 months (2.5 years) at their
current residence (S.D. = 80 months); males report 27 months (S.D. 28)—leading us to conclude, not surprisingly,
that males are a more mobile population than women.
Average or mean rent is $665 per month, although a standard deviation of about half the mean (391)
indicates a lot of variation in rent (Figure 11, p.13). Most live in a house (49%), followed by apartments (36%).
Although the percentage living in trailers is low, 12.5%, there are large concentrations of trailers in some parishes
(Figure 28).
Figure 28. Type of Housing % Room 1.5 Apartment 35.6 House 48.6 Trailer 12.5 Condominium 1.6 Other .2 Total 100
Occupation The most important occupations for women include meat packing (chicken plants) (11%) and domestic
service (8%), but it is notable that 23% of women consider housework to be work. The fact that so many women
consider their household labor to be work calls for a re-definition of standard concepts of work and remuneration
(Rees 2001). It is interesting to note that 7% of women report that they are professionals, while even more, 13%,
report that for their job in their home country (Figure 13, p. 14). In the US, men work in carpet (7%), meat packing
(chickens) (10%) and construction (29%), including 8% who are skilled construction workers or crew chiefs (Figure
14, p.15), whereas in their home country, the largest group worked in agriculture (31%), with construction (13%)
and professional activities (11%). (Note that the percent unemployed is low, less than 2% at home and less than 4%
here) (Figure 13, p. 14).

Hispanic Survey 25
Language Most (61%) do not speak any English, while 35% report that they are bilingual. The next largest language
group falls far behind these, with 3.9% speaking an indigenous language with or without Spanish or English (Figure
29). But even though over a third speak English, the main language spoken in the home is Spanish, although almost
10% speak English or English and Spanish at home (Figure 30).
Figure 29 Languages Spoken by Respondent Percent Spanish 60.8 Spanish/English 35.0 Spanish/indigenous/other 2.5 Spanish/indigenous .9 Spanish/English/indigenous .3 English .2 Indigenous .2 Spanish/Other .2 Other .0 Total 100.0
Figure 30. Main Language Spoken in Home Percent Spanish 88.9 English 2.2 Other .2 Indigenous .4 Spanish/English 7.5 Spanish/Other .6 Spanish + indigenous .1 Total 100.0
Typical family If there is any such thing as an average family, we might say that the average household in this sample is
made up of a married couple with two kids, who share a three bedroom house ($665 rent) with 1 or 2 non-relatives.
They’ve lived in their residence for almost two years, have an average of two cars per household.13 Almost 90%
speak mainly Spanish at home. Hispanics who attend mass in north Georgia are young, single and relatively more
highly educated than the majority of the population in their home countries. Hispanics do not live in conditions that
13 This is an alarming number of cars considering that about half the population is undocumented, meaning that they can’t get insurance or driver’s licenses.

Hispanic Survey 26
are much different from the non-Spanish speaking population, except for the composition of the household. Most
have a stable residence, typically a house. Only the presence of an average of two non-family members in each
household indicates the composite structure of the household unit.
Religious Practice And Needs
Mass Attendance Most report that they come to mass every week, this figure is not much different for men and women
(Figure 9, p. 12 and Figure 31). Over 80% get to mass in car, with 9% arriving by ride, and fewer by taxi or public
transportation (Figure 32). (More people use mass transportation or other means to get to work, however, see Figure
33). The greatest number, 43%, prefer mass at noon; and the overwhelming majority, 80%, prefer mass on Sunday
(Figure 34). Note that these numbers correspond roughly to the actual times that mass is offered: about 60% of the
masses are offered between 11:30 am and 3:30pm. Respondents overwhelmingly report that their mass in Spanish
reflects their traditions (Figure 35).
Figure 31. Last Mass Attended by Gender

Hispanic Survey 27
Figure 32. Mass transport Percent Car 83.4 Ride 7.9 Taxi 2.2 Bus .8 MARTA 1.2 On foot 3.3 Collective transport .9 Bicycle .0 Loaned vehicle (work) .2 Other .1 Total 100.0
Figure 33. Work Transport Percent Car 67.0 Ride 9.2 Taxi 1.7 Bus 2.7 MARTA 2.7 On foot 1.7 Collective transport 1.1 Bicycle .0 No (don’t work outside the home) 13.6 Work Vehicle .0 Other .1 Total 100.0
Figure 34. Preferred Mass % Prefer morning Mass 32 Prefer mid-day Mass 42 Prefer afternoon Mass 22 Monday mass 2.4 Tuesday Mass 1.9 Wednesday Mass 3.7 Thursday Mass 2.7 Friday Mass 3.5 Saturday Mass 18.5 Sunday Mass 80.4
Figure 35. Mass Reflects Traditions Percent
yes 96 no 4
Total 100

Hispanic Survey 28
Other Religions Just a few, 6.5%, have participated in another sect (Figure 36), although this does not mean that only 6% of
Hispanics have a religion other than Catholicism; rather it may simply indicate that converts, once they start going to
another church, do not return to mass.14 Over 40% say they are registered in the church (by this they mean that they
have registered for the sacraments). There is a significant, but not very strong relationship between whether
respondents are registered in the church and the number of children they have: people with children tend to register
(chi square 60693.344, df13, significance > .001) and they have an average of 2.4 children; non registered families
have 2.2 (Figure 37)15 in the church. Roughly half of respondents, the largest group, would prefer a parochial school
for their children (Figure 38).
Figure 36. Participation in other Religions Percent yes 6.5 no 93.5 Total 100.0
Figure 37. Number of Children and Registration
14 So what we're seeing with this data is that few people who have ever participated in another religion come to mass. Dr. Andrew Dott, of the Women's Center at Northside Hospital, tells me that his intake sheets for Hispanic women indicate that half of them report that they are not Catholic, a surprising figure that should be looked at in greater depth.
15 Chi square is a measure of association for nominal data, such as Registered (yes/no) (see Appendix A).

Hispanic Survey 29
Figure 38. Preferred school PERCENT
Public 44.7 Parochial 49.7 Private 4.8 Home school .5 Other .1 Total 100.0
The questions on needs, participation in and knowledge of religious services offered at parishes indicate
that Hispanics rate their sacramental, religious and pastoral needs highly, although a somewhat higher figure report
social needs. While 10% say they need baptism services, probably people whose children need baptizing, over 25%
have used these services (see Figure 39). Many report that they need first communion and confirmation, probably a
reflection of the next sacrament that parents want for their baptized children. A fairly large number, 25%, report a
need for Bible study or spiritual study.
Figure 39. Use of Religious Services and Sacraments % Use baptism 23.4 Use catechism 18.6 Use first communion 15.3 Use Bible study/spiritual 11.3 Use confirmation 8.3 Use marriage rites 7.6 Participate in ministry, usher 7.7
People are willing to participate in their parishes. Three-quarters of the population said they would accept a
ministry in the church (Figure 40), but 73% report that they have never carried out a religious ministry (Figure 41).
There is a big gap between willingness and actual participation.
Figure 40. Accept ministry Percent
Yes 76 No 24
Total 100.0

Hispanic Survey 30
Figure 41. Past participation in religious ministries Percent Yes 27 No 73 Total 100.0
The average time since respondents last attended mass was 4 weeks ago, but a glance at the histogram tells
us that most people at mass go every week (mode and median are 1 week) (Figure 9, p. 12)—the average is higher
because a very few people go once every year or two.
Most people come to mass with between two and three other members of their household (Figure 42). If we
recall that the average number of people in the household is 5 (Figure 27, p. 24), we conclude that most people in the
household go to mass. Only 10% reported living in households with people who practice another religion (Figure
43), and only 6.5% report having ever participated in another religion (Figure 36, p. 28).
Figure 42. Other Household to Mass Mean 2.72 Median 3.00 Mode 2
Figure 43. Household Members who Practice another Religion Percent 2 2.2 3 1.4 4 .7 5 .5 6 .3 7 .1 8 .2 10 .1 Total 100.0
Knowledge of religious services offered shows that most people know what religious services are offered in
their parishes, although a number indicate that they think services are offered which, in fact, are not (especially
driver's ed) (compare Figure 44 and Appendix G).
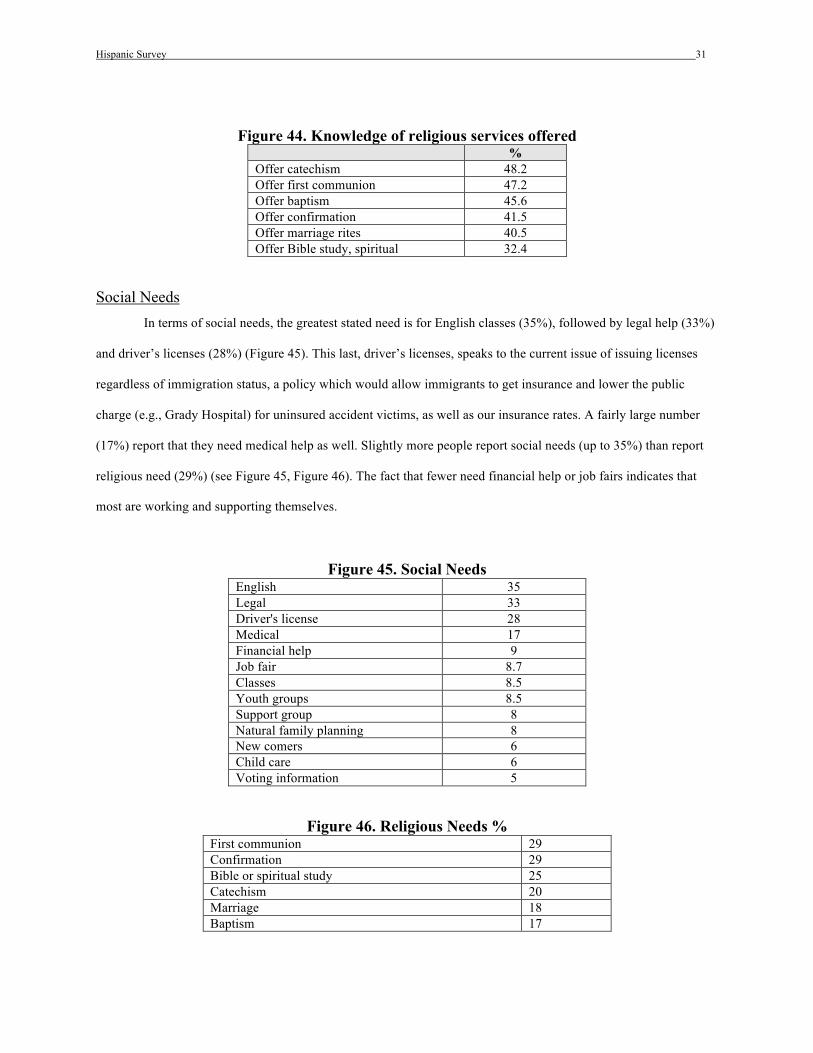
Hispanic Survey 31
Figure 44. Knowledge of religious services offered % Offer catechism 48.2 Offer first communion 47.2 Offer baptism 45.6 Offer confirmation 41.5 Offer marriage rites 40.5 Offer Bible study, spiritual 32.4
Social Needs In terms of social needs, the greatest stated need is for English classes (35%), followed by legal help (33%)
and driver’s licenses (28%) (Figure 45). This last, driver’s licenses, speaks to the current issue of issuing licenses
regardless of immigration status, a policy which would allow immigrants to get insurance and lower the public
charge (e.g., Grady Hospital) for uninsured accident victims, as well as our insurance rates. A fairly large number
(17%) report that they need medical help as well. Slightly more people report social needs (up to 35%) than report
religious need (29%) (see Figure 45, Figure 46). The fact that fewer need financial help or job fairs indicates that
most are working and supporting themselves.
Figure 45. Social Needs English 35 Legal 33 Driver's license 28 Medical 17 Financial help 9 Job fair 8.7 Classes 8.5 Youth groups 8.5 Support group 8 Natural family planning 8 New comers 6 Child care 6 Voting information 5
Figure 46. Religious Needs % First communion 29 Confirmation 29 Bible or spiritual study 25 Catechism 20 Marriage 18 Baptism 17

Hispanic Survey 32
Likewise, the services actually used include most prominently English (20%), followed by other services
(youth group, financial support and newcomers groups), which, are again the most prominent needs (Figure 45).
The lower numbers of social services that people are aware of (Figure 47) reflect the lower number of
parishes that offer these services (see Appendix F and Appendix G). However, it is interesting that the most
common service that people are aware of is English classes. The most common service used is also English classes
(Figure 48).
Figure 47. Knowledge of Social Services Offered Offer English 22.8 Offer youth group 19.9 Offer newcomers group 18.5 Offer financial support 18.4 Offer natural family planning 17.8 Offer support groups 12.3 Offer child care 12.3 Offer legal assistance 11.3 Offer classes 11.3 Offer job fair 6.9 Offer medical attention 5.9 Offer driver’s licenses 4.9 Offer voting information 4.9
Figure 48. Use of Social services English classes 6.8 Financial support 5.7 Youth Group 5.3 Childcare 3.7 Newcomers’ group 3.6 Legal Assistance 2.0 Classes 1.7 Support Groups 1.6 Medical attention 1.4 Driver’s license 1.3 Voting information .9 Job Fair .9

Hispanic Survey 33
Conclusions: Diversity
This report summarizes the findings from the survey, as well as from interviews in the parishes. Our
conclusions deal with (I) the Archdiocese, and (II) the parishioners. These conclusions lead us to make a number of
recommendations, which we offer as a first step in an on-going process of reflection and analysis to be carried forth
by the Archdiocese.
I. The Archdiocese 1. Communication. From our work with the parishes, both in terms of difficulties in contacting many of
them, as well as from comments and needs expressed by parish priests, religious sisters, staff and volunteers, it is
clear that communication is not clear, swift or easy in many cases. If fact, communication is iffy throughout much of
the Archdiocese. Many of the parishes (priests and/or staff) are not linked to others either socially or professionally.
This contact would increase the viability of all the work of the archdiocese. Within parishes, there needs to be
increased communication and coordination between Spanish and English clergy, laity and staff.
2. Hispanic diversity. There is incredible economic and cultural variation within the Hispanic population.
Even within one nation, or state, like ours, there is significant variation. In Latin American countries these
differences are often even more exaggerated. In the Archdiocese, these differences were often represented to us in
negative terms (especially with respect to Mexicans), where in fact, they are an asset and an opportunity.
3. Hispanic/Anglo Relations. In addition to differences within the Hispanic community, there is a vast gap
in understanding between the English- and Spanish-speaking communities. This is also often represented in negative
terms, instead of as the opportunity that it is. There is significant anger toward the institution and between different
national groups within the Archdiocese. For example, English-speaking host parishes often comment on the mess
that people leave in the Hispanic masses. This is easily corrected by understanding how people use restrooms and
conceive of trash in Latin America and by coordinating volunteer clean-up committees. First and foremost comes
communication across these constituencies. Another example is the insulting stereotype that Mexican Catholics are
more "uneducated" (which glosses as bad mannered in Spanish).
II. Parishioners There are vast numbers of Hispanics in north Georgia, and many are not being served by the Catholic
Church. The institution needs to decide what role to play in the lives of the Hispanic minority (soon to be a majority,
according to Bishop Arthur N. Tafoya, chair of the US Bishops' Committee on Hispanic Affairs). Hispanics are such
Hispanic Survey 34
an important minority, if we can still call them that, that are increasingly important players in the future of the
Church.
What are the main characteristics of the Hispanic population?
• The ratio of males:females in mass is 55:46 • We conservatively estimate the total population of Hispanics in North Georgia to be 460,000 • The average age of the population is 33 years • Women go to mass more often and are more likely to be married • Most people, 86% of the sample, are married or in a common law marriage • 15% have no children • Over 80% have no children in their home country (males of any age and all older migrants have more children
in home country) • The population as a whole has an average education of 9.7 years, women have 10 years, and men, barely 9—but
this differs widely by region and nation of origin • Hispanics come from 20 countries: Mexico is the birth country for over 75% of the sample, Colombia for 7%
and Guatemala for 4% • The average year of arrival in the US is 1992, and in Georgia is 1995 • At least 50% of the total Hispanic population is undocumented • About half send money home; especially those who report children left behind with relatives • Many still have strong ties to their country of origin—40% own a house there • The longer the US residence, the less money people send home • The most common form of household is for 3 family members to occupy two bedrooms and rent out the third
bedroom (or the living room) to 2 non family members • Hispanics not as mobile as is commonly thought—over two years average in their current housing; males are a
more mobile population than women are. • Average rent is $665 per month • Most live in a house (49%), followed by apartments (36%) and trailers (12.5%) • Women work in meat packing (chicken plants) (11%) and domestic service (8%), professionals (7%) (13%
were professionals at home) • Men work in carpet (7%), meat packing (chickens) (10%) and construction (29%), including 8% who are skilled
construction workers or crew chiefs • In their home country, the largest group worked in agriculture (31%), with 13% in construction (13%) and 11%
professionals • Unemployment is less than 4% • Most (61%) do not speak any English, while 35% report that they are bilingual; 3.9% speak an indigenous
language • The main language spoken in the home is Spanish, but 10% speak English or English and Spanish at home • Most report that they come to mass every week • 80% get to mass in car, 9% by (paid) ride • 43% prefer mass at noon; and 80% prefer mass on Sunday • The mass in Spanish reflects their traditions • Few, 6.5%, have participated in another religion (or few who have participated in another religion return to the
Catholic church) • Half would prefer a parochial school for their children • 10% need baptism services, over 25% have used these services • 25% report a need for Bible study or spiritual study • Three-quarters of the population would serve in a ministry in the parish; 73% have never served in a parish
ministry • Most come to mass with between two and three other members of their household • 10% reported living in households with people who practice another religion
What are the main needs of the Hispanic population?
Hispanic Survey 35
• More report social needs (35%) than religious needs (29%) • Most people know what services are offered in their parishes • The greatest needs are for English classes (35%), legal advice (33%), helping getting driver’s licenses (28%),
and medical care (17%) • Few need financial help or job fairs—most are working and supporting themselves. • Services actually used include English (20%), other services (youth group, financial support and newcomers
groups) • Few parishes offer social services
Summary
The population of Hispanics is young, mobile, and recent (1995). It is predominantly male, but many live in
families in stable housing. The average household in this sample is made up of a married couple with two kids, who
share a three bedroom house ($665 rent) with 1 or 2 non-relatives. They’ve lived in their residence for almost two
years, and have an average of two cars per household. Almost 90% speak mainly Spanish at home. Hispanics who
attend mass in north Georgia are relatively more highly educated than the majority of the population in their home
countries. Hispanics do not live in conditions that are much different from the non-Spanish speaking population,
except for the composition of the household. Only the presence of an average of two non-family members in each
household indicates the composite structure of the household unit.
The needs, participation in and knowledge of religious services offered at parishes indicate that Hispanics
rate their sacramental, religious and pastoral needs highly (29%), although a somewhat higher figure report social
needs (35%). People are willing to participate in their parishes, but there is a big gap between willingness and actual
participation.
Hispanics in the Archdiocese "want to be welcomed" (Unity in Diversity, United States Catholic
Conference 2000),16 but often feel unwelcome. They want to be bicultural, and have begun the acculturation
process, but they do not want to lose their native language and customs. They want to learn English and participate
in the life of the church in the United States. This certainly resonates with the US Catholic Bishops' pastoral on
"Welcoming the Stranger," as well as Pope John Paul II's message.
16 Ibañez (2002) reports that students who feel welcome, do better in school.

Hispanic Survey 36
Recommendations
Our recommendations are made with the recognition that we giving our professional advice, we report and
interpret what we see and what people tell us in the surveys and interviews. We make a series of recommendations,
followed by specific implementation strategies, where indicated. In addition, it would behoove the Archdiocese to
find out what other Arch/Dioceses have learned and done in this context.
1. Communication and Structure. We recommend email and web page contact for each parish—for
announcements, services, changes, help and more. We recommend increased intra-institutional contact among
diocesan leadership.
There are structural problems within the parishes, roles and responsibilities within Hispanic ministry aren’t
clearly defined, and as a result, messages get lost, ideas dissipate while being juggled around, and a “he said-they
said” confusion often reigns.
2. Hispanic Diversity. In order to become aware of the differences in the Hispanic population, and, in order
to reach people and to reduce misunderstandings, we recommend that the Archdiocese form groups of clergy, staff
and lay people from different nations and regions within nations to serve as advisors on cultural issues.
Implementation: The form could be as focus groups or committees. Independent consultants may best coordinate
focus groups, in which up to 10 people are recruited to discuss a topic with a moderator who is a combination
interviewer, researcher and therapist. The moderator must create a "safe" environment for people to be able to talk
about sensitive issues, which allows focus groups to produce meaningful information. Priests and staff should not be
present. Implementation: In addition, "listening sessions", dinners, or social events within the Archdiocese would
help increase communication and understanding. These should include the Archbishop, curia priests, and deacons—
both Hispanic and Anglo or African American or Asian, etc. Pot luck suppers, especially those that highlight
regional specialties, would be another way of encouraging all constituencies to know and appreciate each other. We
found only a few parishes that offer coffee after mass.
3. Hispanic/Anglo Relations. The Archdiocese needs a more thorough pastoral planning with respect to
diversity. Our experience in education has taught us that learning about folks who are different helps us understand
and appreciate them. Implementation. One way to increase understanding across cultural differences is to
incorporate those differences in the religious service, as testimony, or in some other way (see suggestions above, as
well). Implementation: Another way to increase understanding and communication across Hispanic constituencies

Hispanic Survey 37
and between Hispanic and English ones are cultural diversity workshops that deal with differences in language,
class, race (including skin color or ethnic group), and national origin. In addition, foreign clergy and religious sisters
need to learn English more proficiently and to learn about life in the US, both for immigrants and natives alike.
Implementation: cultural orientation of foreign clergy and religious sisters.
4. Broader Community Issues. A common frustration expressed by parishes is how to reach Hispanics who
are not active Catholics. From our work in the community, we know that most Hispanics learn about people and
places by word-of-mouth. We find that some people are very well informed; others aren't. The most common way of
finding out about church activities is via the announcements in mass—a time when there are lots of distractions. A
simple and effective way to increase knowledge about church locations and masses is to change advertising
strategies: post flyers with a mass schedule in businesses frequented by Hispanics or place a billboard in Spanish on
the interstate with a calling to mass. In a market where other churches are actively recruiting Hispanics, a little more
advertising could go a long way.
5. Stewardship. There is an apparent gap between actual participation (including tithing) and willingness to
participate in ministries. Increased participation would probably increase stewardship and overall support. First and
foremost, Hispanics need to feel welcomed in their church. Second, differential income and ability to contribute
must be accommodated. One of the common Latin American systems (see cargos, p. 6) could be adapted to include
men, women and children, to help run the church, and to give immigrants ownership of their US church, something
that we’ve seen in only a few places. Third, several parishes expressed a need for deacon training in Spanish, which
would facilitate many of the changes already mentioned here. The feeling was that deacons have to train in English,
a policy that inhibits Spanish-speakers from participating.
It appears as if Hispanics may not contribute proportionate to their numbers. In terms of stewardship, there
are a number of alternatives. One is to educate the more affluent parishes, and to encourage them to share their
resources and parish home with newer arrivals. If this doesn't work, we suggest encouraging Hispanics to take
greater ownership of their church in the United States. Welcoming strategies include Spanish signage and literature,
as well as social services. In addition, social ministries with active volunteer groups would help immigrant
parishioners to feel at home.

Hispanic Survey 38
6. Needs. The Hispanic population has high social and religious needs. We recommend expanded religious
and social services, include catechesis in Spanish, English classes,17 medical and legal advice. Implementation:
Create a social service ministry and organize volunteers in social service and other ministries, or use the concept of
"twinning" to teach successful models to other parishes.
In conclusion, we recommend that the Archdiocese help bridge differences without erasing those
differences. This would enrich the whole culture, reduce misunderstandings and increase participation at the same
time as it would help meet the urgent, very real needs of this population.
Future research
Further questions to study, in addition to a re-study every five years of the Hispanic population in mass,
would be a study of the total population of Catholics (especially non-attendees and former Catholics). Another study
would target more acculturated Hispanics, i.e., those who attend English masses, to learn from their experience.
Endings and Beginnings
We see this report as a first step, a start toward increased understanding across constituencies, a step
towards meeting the needs of people in great need, a step toward adapting to our changed world.
17 Of 26 free English classes offered in the area, 13 are offered in Baptist churches, a handful in churches of other denominations, some in secular organizations and a handful at Catholic churches.

SELECT REFERENCES Bernard, H. Russell. 1995. Research Methods in Anthropology. Second Edition. New York: Altamira Press. Bishop's Committee Approves New Directors for Hispanic Ministry. !En Marcha! (CNS), Fall 2001. Blevins, Chuck. 2000. Metro Counties at a Glance. Atlanta Journal Constitution 5/25/2000: JB18. Bustamante, Jorge, Clark W. Reynolds and Raúl A. Hinojosa Ojeda. 1992. US-Mexico Relations: Labor market
interdependences. Stanford: Stanford University Press. CARA (Center for Applied Research in Anthropology, Georgia State University). 1996. Georgia Hispanic
Population, 1981-1995. CARA (Center for Applied Research in Anthropology, Georgia State University). 1998. Metro Atlanta Immigrants. Castells, Manuel. 1980. The Economic Crisis and American Society. Princeton: Princeton University Press. Dameron, Rebecca J. and Arthur D. Murphy. 1997. An International City Too Busy to Hate? Social and Cultural
Change in Atlanta: 1970-1995. Urban Anthropology 26(1):43-70. Ibañez, Gladys. 2002. Cultural Attributes and Adaptive Strategies that Promote Future Success among Immigrant
Latino and Mexican Adolescents. Ph.D. Dissertation. Georgia State University. Department of Psychology. Jenkins, J. Craig. 1977. Push/pull in recent Mexican migration to the US. International Migration Review 11:178-
189. Kanter, James. 1998. The Many Faces of Diversity—We are all Immigrants. Georgia Bulletin. Massey, Douglas S., Joaquín Arango, Graeme Hugo, Ali Kouaouci, Adela Pellerino, J. Edward Taylor. 1994. An
Evaluation of International migration Theory: The North American Case. Population and Development Review 20(4) (December):899-751.
Miller, T. Danyael. 1999. ¿Dando Pecho?: The Effects of Migration on the Infant Feeding Practices of Mexicana Migrants in Atlanta, Georgia. Senior thesis in Anthropology. Agnes Scott College, Decatur, GA.
Milliron, David A. Atlanta Journal and Constitution ** Nettles, Jennifer. 1997. Desde muy lejos: un estudio de la vida de un mujer imigrante, mexicana. Senior Research
Paper, Agnes Scott College. Rees, Martha W. 2001a. Ayuda or work? Analysis of Labor histories of Heads of Household from Oaxaca. Annual
Meetings of the Society for Economic Anthropology. Milwaukee, WI. April 27-28, 2001 (Invited session). Rees, Martha W. 2001b. How Many Are There? Ethnographic Estimates of Mexican Women in Atlanta, Georgia.
Latino Workers in the Contemporary South. Proceedings of the Southern Anthropological Society. Arthur D. Murphy, Colleen Blanchard and Jennifer A. Hill, eds. Athens, Georgia: University of Georgia Press. Pp. 36-43.
Rees, Martha W. 2001c. How Many Mexicanas? Estimating Undercounted, Hidden Populations in Atlanta, Georgia. 2001. Michael Angrosino, ed. Ethnography: Data Collection Projects. Prospect Heights, Illinois:Waveland Press. Pp. 123-129.
Rees, Martha W. and Jennifer Nettles. 2000. Los Hogares Internacionales: Migrantes Mexicanas a Atlanta, Georgia. In, Migración Femenina hacia EUA. Pp. 73-100. Sarah Poggie and Ofelia Woo, eds. Mexico: Edamex.
Rees, Martha W. and T. Danyael Miller. (2000). Mexicana migrants in the Post-NAFTA Era: Households and Work in Atlanta, Georgia.
Rees, Martha W., T. Danyael Miller and Mariposa Arillo 1998. Atlanta Latinas. Presented at the Center for Latin American and Hispanic Studies, 1997-1998 Lecture Series: Gender, Culture and Politics in Latin America. Women and NAFTA. 14 May, 1998.
Rodriguez, Gregory. 2002. The Mexicanizing of American Catholicism. Wall Street Journal, Friday, March 8, 2002 Saindon, Jacqueline J. 1991 Piney Road: Work Education and The Remaking of the Southern Family. A Final
Report To the Ford Foundation. United States Catholic Conference. 2000. Welcoming the Stranger Among Us. Unity in Diversity. A Statement of
the U.S. Catholic Bishops. US Bureau of the Census. 2001. International Data Base. http://www.census.gov/cgi-bin/ipc/idbagg. US Bureau of the Census. 2001. The Hispanic Population in the United States: March 2000. Issued March 2001. US Conference of Catholic Bishops; Vatican II. Instruction for the Pastoral Care of People Who Migrate (Quoted in
Kantner 1998). Woo-Morales, Ofelia. 1995. Las mujeres mexicanas indocumentadas en la migración internacional y la movilidad
transfronteriza. Mujeres, migración y maquila en la Frontera Norte. Soledad Loaeza, Olivia Ruíz, Laura Velazco and Ofelia Woo, Eds. Tijuana: El Colegio de México y El Colegio de la Frontera Norte.

Appendix A. Methodology The first question to answer in proposing this assessment of needs was to decide whether to interview or
survey. Interviews provide qualitative information and are best for getting in-depth information from a small number
of people. However, interviews can be biased by small sample size. For example, if you happen to interview the five
people in a population who are single, or from Guatemala, etc., you might conclude that the population is made up
of single Guatemalans. Interviews give us rich information, but they don’t permit us to generalize about the
population as a whole. Questionnaires and surveys compile quantitative (numerical) information from large
populations. There are many limitations to quantitative data—misinterpretation of the question, errors, inadequacy
of the possible responses (there’s always someone whose case does not fit the possible answers). We design random
samples (in which every member of the population has an equal chance of being selected) (see sample, p.41).
Interview data is richer, more profound and often more meaningful than quantitative data, but it isn’t representative
of the whole population. Quantitative data permits us to look at larger numbers of people. For these reasons, our
initial proposal to the Archdiocese was to design a survey, questions with numerical answers as an initial step in
assessing the needs of the population, although we contemplate that future research by the Archdiocese would
include focus groups, interview panels or other forms of qualitative information.
The research design for this project is a synchronic (one-time) survey of a random sample of attendees at
Spanish masses. We compiled information on capacity, attendance, services and masses from a phone interview
with each parish (see Appendix G). In October, 2001, we met numerous times with the coordinating committee
(Talley, Kanter, Knott, and Saldaña) as well as with representatives from the parishes and missions with Spanish
masses to discuss our methodology. We had to decide whether to apply the questionnaire to everyone, to all adults
or to a sample of attendees. Because applying a survey to all attendees meant over 20,000 questionnaires, with
concomitant costs and difficulty of analysis, we decided on a random sample of 50 surveys per mass.
The next step was to design the survey. Based on previous surveys by Rees, and others, we designed an
initial form. We pre-tested the questionnaire outside the archdiocese, at Sacred Heart in Warner Robbins, so we
wouldn’t survey the same mass twice), and made two more revisions. We made many hard choices about what to
include, but our restrictions were space, time and understandability. The final questionnaire is about 50 questions on
one two-sided page; it takes from 5 to 10 minutes to fill out, depending on the person (Appendix B, p. 40).
Once we had the final questionnaire, we trained staff and volunteers from those parishes and missions who
volunteered to coordinate the application of the survey in their parish. The training was necessary because of our
specific method, which required the coordinator to calculate the distribution of the survey depending on a count of
mass attendees. Each coordinator received a packet containing 50 surveys, pencils and a master instruction sheet
(see Appendix C, p. 40). Rees, Miller, Saldaña, Kantner, Knott, Maldonado and employees of the Catholic Center
(Cristina Sánchez; Elvira Carillo, Margarita Rice, Julisa Delgado and Teresa Keebler) coordinated the survey in
parishes where there were no on-the-ground volunteers to coordinate. Alison Trendell and Currey Hitchens, of
Agnes Scott College assisted Rees and Miller.
Hispanic Survey 41
Sample
The questionnaire was applied to a random sample of 50 adults per mass. The sample is random, that is,
every person attending every mass had an equal chance of being selected. By selecting 50 adults per mass, we kept
the total number of surveys under 3000, while still getting the minimum for statistical significance of 30 per mass.
The most important part of the training, then, was to show survey coordinators how to calculate the distribution of
surveys by first counting attendees at each mass (after most people had arrived, so as not to interrupt the service),
usually during the offering. We needed to know the total number of adults, but because the proportions of men to
women and of women to children give us important demographic information, we asked for a count of adult men
and women, plus children. Typically volunteers divided the sanctuary into sections by pews, cry room, and standees,
and counted. The survey coordinator summed up these counts and then calculated the distribution of surveys by
dividing the total number of adults by 50. For example, the distribution for a mass with 250 adults is calculated:
250/50=5. This number tells the coordinator to distribute the survey to every fifth adult (see Appendix C, p. 45).
Once the distribution was determined, the survey was passed out, typically during the announcements, with
the permission of the priest. Volunteers stood by to answer questions or to help people fill out the forms. The survey
coordinator collected the forms and the instruction sheet in the envelope provided. We collected over 2700 surveys
from a total population of over 23,000 attendees (over 10%).
Data Analysis
We can collect three kinds of data in surveys: nominal, ordinal and interval. Nominal data is data that, even
though we assign a number to the responses, are categories for which numbers are meaningless. For example, sex
(Male=1; Female =2) is a nominal category. It is meaningless to say that the average sex is 1.5! We report this data
as percentages (see Figure 7, p. 11). Ordinal data is data that we can rank, for example responses like good-better-
best. Some researchers average numbers assigned to ordinal data (good=3; better=2; best=1), but this must be done
with care, taking into account that the average is not really an average. Finally, interval data is data in which we
know the size of the interval between one response and the next. Temperature is the classic example; we know that
60 degrees is twice as warm as 30 degrees. Age, income and other kinds of data are interval data. For these data,
means, correlations and other statistical analysis may be carried out. It is important to take the kind of data into
account in analyzing survey information.
The way responses are distributed also affects how we analyze our data. For example, Figure 9 (p.12)
shows the distribution of responses to the question, How many weeks has it been since you last attended mass? We
see that the mode (most frequent response) is 1, meaning that most respondents came to mass last week. However,
the mean (average) is four times less frequent, 4 weeks, because a very few respondents report that it has been over a
year since they last attended mass. The median (mid-point) is a good measure for unbalanced responses like these
because, it shows us where, if we weighed each response equally, the scale would balance, in this case at 1. The
statistic we use depends on the distribution and type of data we have.
With interval data, we can calculate the degree of co-variation of two variables: correlation. A significant
correlation means that two variables occur together, such that the presence of one predicts the other. For example,
Hispanic Survey 42
age and years of education are correlated negatively, so that an increase in age predicts a decrease in years of
education (Pearson’s correlation, r = -.058, significant at the.0001 level).
There are lots of other variables that we know correlate (education and number of children, gender and
numerous activities, age and number of children, age and income, etc.). Correlation, however, does not imply
causation, that one of the variables causes the other. A favorite example is the correlation between ice cream and
rape. These two variables correlate: when one goes up (ice cream sales), so also do reported rapes. Does ice cream
cause rape? Vice versa? No, rather, another variable, hot weather, influences the frequency of both. There are
different methods for calculating correlations for nominal, ordinal and interval data. However, interpretation of
correlation has to proceed with caution.
A correlation of 1 means that 100% of the time a change in one variable predicts a change in the other. But
most correlations aren’t perfect, so we measure the strength with a correlation coefficient (commonly we use
Pearson’s). The significance of a correlation is calculated in terms of the probability that that relationship could be
due to chance. A correlation significant at the.005 level means that 95% of the time the relation is not due to chance.

Appendix B. Encuesta Hispana PREGUNTAS ACERCA USTED FAVOR DE MARCAR SU RESPUESTA CON UNA X 1. Sexo Femenino Masculino 2. ¿Cuantos años tiene? ____ _____ 3. ¿En que país nació usted? Argentina Belice Bolivia Brasil Chile
Colombia Costa Rica Cuba Ecuador El Salvador España Estados Unidos Guatemala Honduras México Nicaragua Panamá Paraguay Perú Puerto Rico República Dominicana Uruguay Venezuela Otro (indique) ________________
4. ¿Qué ciudadanía tiene? ______________________________________ 5. Estado civil actual: soltero/a casado/a por lo civil casado/a por la iglesia unión libre divorciado/a viudo/a separado/a p/madre soltero/a otro (indique) ________________ 6. ¿Dónde vive su pareja actualmente? Georgia otro lugar en los Estados Unidos en otro país no tengo pareja no se sabe otro (indique) _______________ 7. Indique todos los idiomas que habla usted: español inglés otro (indique) ____________________ un idioma indígena (por ejemplo mixteco, maya, etc.) 8. ¿Cuántos años de escuela tiene? (Indique el último año terminado) _____________________ 9. Si nació en otro país, ¿en qué año llegó a los Estados Unidos? (si nació aquí, deje en blanco)____________ 10. Si nació fuera de los Estados Unidos ¿dónde vivió la primera vez en los Estados Unidos? Alabama California Carolina del Norte Carolina del Sur Florida Georgia Illinois Kentucky Nueva York Tennessee Texas Virginia no es inmigrante otro (indique) _________________________________ 11. ¿En que año llegó a Georgia la primera vez? ___ ___ ___ ___
12. ¿En que trabaja actualmente? (indique uno): desempleado/a cuidar niños (pagado) hogar incapacitado físico/no puedo trabajar jubilado, pensionado jardín, yarda chofer servicio doméstico (casas particulares) alfombras empacadora restaurante mantenimiento o janitor administrativo, secretario construcción ventas maestro de obras, carpintero profesionista/profesional empleado, cajera, dependiente campo otra (indique) _______
13. ¿Para quién trabaja? trabaja por su cuenta el gobierno para un patrón/contratista para una compañía con mas de 100 empleados para una compañía con menos de 100 empleados una institución caritativa, escuela o sin fines de lucro otro (indique) ______________________________
14. ¿Cuál fue su ocupación principal en su país de origen? (indique una) desempleado/a hogar cuidar niños (pagado) incapacitado físico/no puedo trabajar jubilado, pensionado chofer jardín, yarda servicio doméstico (casas particulares) alfombras ventas
restaurante mantenimiento o janitor administrativo, secretario construcción empacadora maestro de obras, carpintero profesionista/profesional
campo empleado, cajera, dependiente otra (indique) ___________________________
PREGUNTAS SOBRE SUS HIJOS E HIJAS 15. ¿Cuántos hijos/hijas tiene usted? (indique 0 si no tiene, y pase a la pregunta número 20) _____________ 16. ¿Cuántos de sus hijos/hijas viven en otro país? _____________________ 17. ¿Cuántos hijos/hijas están en la primaria aquí en Georgia? _________________ 18. ¿Cuántos hijos/hijas están en la secundaria o middle school aquí en Georgia? _____________________ 19. ¿Cuántos hijos/hijas están en high school o la preparatoria aquí en Georgia? ______________________ 20. ¿Cuántos de sus hijos/hijas se han graduado de high school aquí en los Estados Unidos? ____________ 21. ¿Que tipo de escuela prefiere para sus hijos? público/civil católica otra privada escuela casera otro (indique) __________________________ TRANSPORTE 22. Si trabaja fuera de la casa ¿cómo llega? no trabaja fuera coche particular ride taxi autobus/camión MARTA/ metro a pie transporte colectivo otro _______________
23. ¿Cómo llegó usted a la misa hoy? coche particular ride taxi autobus/camión MARTA/metro a pie transporte colectivo otro (indique) _______________________ 24. ¿Cuántos coches o vehículos tienen entre todos los que viven en su casa? ___________________ VIVIENDA 25. ¿En que tipo de vivienda vive? Cuarto Apartamento o departamento Casa Trailer Condominio Shelter/asilo No tengo Otro (indique) _______________________ 26. ¿La vivienda es Rentada Prestada Comprada Con hipoteca No sabe 27. ¿Cuánto tiempo tiene en esta vivienda? __________ meses o __________ años 28. ¿Cuántas recámaras tiene la vivienda? ______________________ 29. ¿Cuántas personas vivieron (durmieron) en la casa la semana pasada? ____________________ 30. ¿Con cuántos familiares vive? _________________________ 31. Indique cuál es el idioma principal que hablan en su casa: español inglés un idioma indígena (por ejemplo el mixteco, el maya, etc.) otro (indique) _______________________ 32. ¿Cuánto gastó en renta o hipoteca este mes? $_______________

Hispanic Survey 44
MUCHAS GRACIAS POR SU AYUDA. SI TIENE ALGUN COMENTARIO, FAVOR DE ANOTARLO
FAMILIARES EN OTRO PAÍS 33. ¿Qué familia tiene usted en otro país? (indique todos) padres pareja hijos pareja e hijos hermanos todos ninguna otro (indique) _________________________________ 34. ¿Les manda usted dinero? si no a veces 35. ¿Cuales de los siguientes bienes tiene usted en su país de origen? (indique todos) Propiedad Casa Vehículo Comercio Otros bienes (indique)________________________
IGLESIA: NECESIDADES Y PARTICIPACIÓN 36. ¿Antes de hoy, cuántas semanas hace que fue usted a misa la última vez? __________________ 37. ¿Cuántas personas aparte de usted que viven en su casa fueron a misa esta semana? _____________ 38. ¿Cuantas personas en su casa asisten a otras iglesias no católicas? ___________ 39. ¿Ha participado usted en otra religión o secta? si no 40. ¿A que hora le gustaría la misa? Temprano en la mañana Al mediodía En la noche 41. ¿En que día de la semana le gustaría la misa? lunes martes miércoles jueves viernes
sábado domingo 42. ¿Está registrado como miembro de esta iglesia? si no 43. ¿Las misas en español reflejan sus tradiciones? si no 44. ¿Cuales de los siguientes sacramentos o servicios pastorales necesita usted o su familia? Bautismo Catecismo/doctrina Primera comunión
Confirmación Matrimonio Planificación familiar natural Apoyo espiritual, clases bíblicas Actividades para nuevo feligreses
45. ¿Cuales de los siguientes servicios sociales necesita usted o su familia? Atención médica Ayuda de emergencia (dinero) Bolsa de trabajo Licencia de manejar Educación (capacitación, alfabetización, habilidades, etc. Cuidado de los niños Apoyo legal: actas, cartilla, migración Grupos y servicios para jóvenes Grupos de apoyo (alcohólicos, violencia doméstica, drogas, consejería familiar Clases de Inglés Información acerca del voto electoral Otro (indique) ______________________________________
46. ¿Sabe usted si ofrecen los siguientes sacramentos y servicios pastorales en esta parroquia? Bautismo Catecismo/doctrina Primera comunión Confirmación Matrimonio Planificación familiar natural Apoyo Espiritual, Clases bíblicas Actividades para nuevo feligreses 47. ¿Sabe usted si ofrecen los siguientes servicios sociales en esta parroquia? Atención médica
Ayuda de emergencia (dinero) Bolsa de trabajo Licencia de manejar Educación (capacitación, alfabetización, habilidades, etc. Cuidado de los niños Apoyo legal: actas, cartilla, migración Grupos y servicios para jóvenes Grupos de apoyo (alcohólicos, violencia doméstica, drogas, consejería familiar Clases de Inglés Información acerca del voto electoral Otro (indique) ______________________________________
48. ¿De cuales sacramentos, servicios y actividades de esta iglesia ha participado o utilizado? Bautismo Catecismo/doctrina Primera comunión Confirmación Matrimonio Planificación familiar natural Clases bíblicas Actividades para nuevo feligreses Ujier o algún ministerio en la iglesia (Lectura, ministro de la eucaristía, comité de la bienvenida, etc.)
49. ¿De cuales servicios sociales y actividades de esta iglesia ha participado o utilizado? Atención médica Ayuda de emergencia (dinero)
Bolsa de trabajo Licencia de manejar Educación (capacitación, alfabetización, habilidades, etc. Cuidado de los niños Apoyo legal: actas, cartilla, migración Grupos y servicios para jóvenes Grupos de apoyo (alcohólicos, violencia doméstica, drogas, consejería familiar Clases de Inglés Información acerca del voto electoral Otro (indique) ______________________________________
50. ¿Ha tenido algún cargo o responsabilidad en la iglesia en este u otro país? si no 51. ¿Aceptaría algún cargo o responsabilidad en alguno de los ministerios de la iglesia? si no

Appendix C. Instruction Sheet Parroquia:
Ciudad: Nombre del coordinador/a de la encuesta: Teléfono del coordinador/a: PAQUETE: Misa 1 Misa 2 Misa 3 Misa 4 50 encuestas 55 lápices Presentación Instrucciones Carta del Arzobispo Carta de Dr. Rees Resumen Ejecutivo
Número de Paquetes
Recibió por Firma Fecha
Número de Paquetes
Entregado por Firma Fecha
Observaciones:
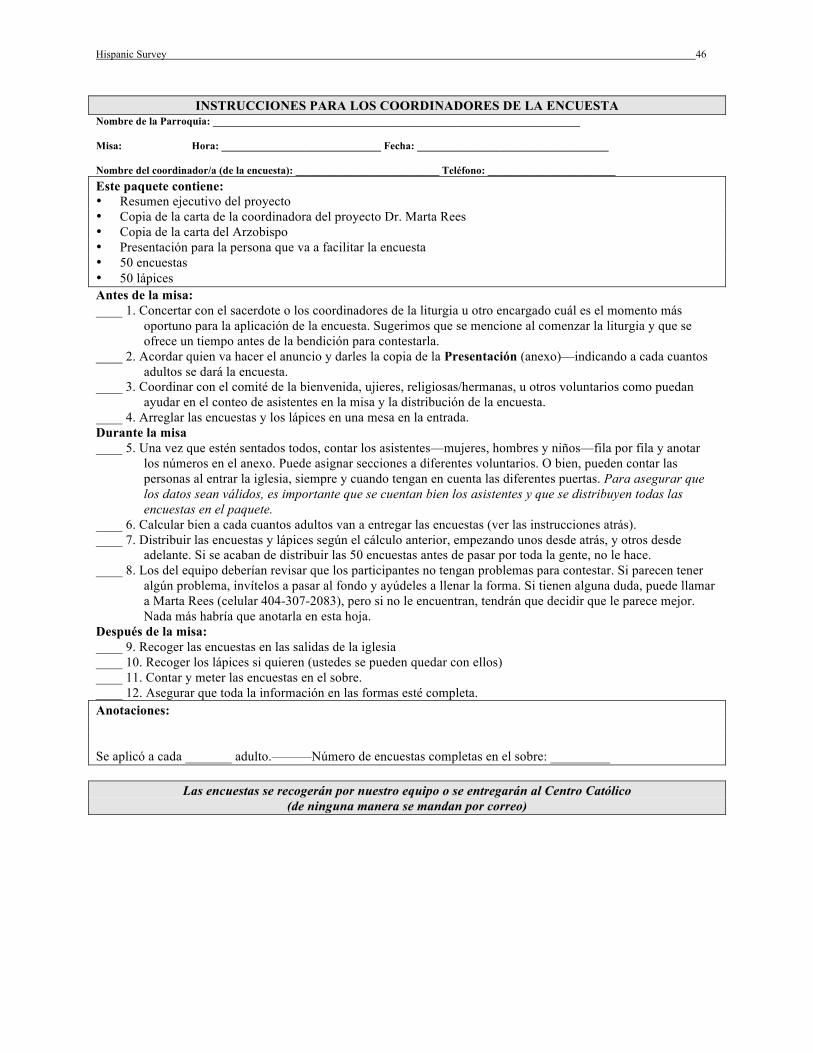
Hispanic Survey 46
INSTRUCCIONES PARA LOS COORDINADORES DE LA ENCUESTA Nombre de la Parroquia: _____________________________________________________________________ Misa: Hora: ______________________________ Fecha: ____________________________________ Nombre del coordinador/a (de la encuesta): ___________________________ Teléfono: ________________________ Este paquete contiene: • Resumen ejecutivo del proyecto • Copia de la carta de la coordinadora del proyecto Dr. Marta Rees • Copia de la carta del Arzobispo • Presentación para la persona que va a facilitar la encuesta • 50 encuestas • 50 lápices Antes de la misa: ____ 1. Concertar con el sacerdote o los coordinadores de la liturgia u otro encargado cuál es el momento más
oportuno para la aplicación de la encuesta. Sugerimos que se mencione al comenzar la liturgia y que se ofrece un tiempo antes de la bendición para contestarla.
____ 2. Acordar quien va hacer el anuncio y darles la copia de la Presentación (anexo)—indicando a cada cuantos adultos se dará la encuesta.
____ 3. Coordinar con el comité de la bienvenida, ujieres, religiosas/hermanas, u otros voluntarios como puedan ayudar en el conteo de asistentes en la misa y la distribución de la encuesta.
____ 4. Arreglar las encuestas y los lápices en una mesa en la entrada. Durante la misa ____ 5. Una vez que estén sentados todos, contar los asistentes—mujeres, hombres y niños—fila por fila y anotar
los números en el anexo. Puede asignar secciones a diferentes voluntarios. O bien, pueden contar las personas al entrar la iglesia, siempre y cuando tengan en cuenta las diferentes puertas. Para asegurar que los datos sean válidos, es importante que se cuentan bien los asistentes y que se distribuyen todas las encuestas en el paquete.
____ 6. Calcular bien a cada cuantos adultos van a entregar las encuestas (ver las instrucciones atrás). ____ 7. Distribuir las encuestas y lápices según el cálculo anterior, empezando unos desde atrás, y otros desde
adelante. Si se acaban de distribuir las 50 encuestas antes de pasar por toda la gente, no le hace. ____ 8. Los del equipo deberían revisar que los participantes no tengan problemas para contestar. Si parecen tener
algún problema, invítelos a pasar al fondo y ayúdeles a llenar la forma. Si tienen alguna duda, puede llamar a Marta Rees (celular 404-307-2083), pero si no le encuentran, tendrán que decidir que le parece mejor. Nada más habría que anotarla en esta hoja.
Después de la misa: ____ 9. Recoger las encuestas en las salidas de la iglesia ____ 10. Recoger los lápices si quieren (ustedes se pueden quedar con ellos) ____ 11. Contar y meter las encuestas en el sobre. ____ 12. Asegurar que toda la información en las formas esté completa. Anotaciones: Se aplicó a cada _______ adulto.———Número de encuestas completas en el sobre: _________
Las encuestas se recogerán por nuestro equipo o se entregarán al Centro Católico (de ninguna manera se mandan por correo)

Hispanic Survey 47
Como calcular la distribución de las encuestas
1. Contar los asistentes a misa—mujeres, hombres y niños—fila por fila o al entrar la iglesia (siempre y cuando cuentan todas las puertas) y anotar los números abajo. Para asegurar que los datos sean válidos, es importante que se cuentan bien los asistentes y que se distribuyen todas las encuestas en el paquete. Filas de la misa: Hombres = ____________ Mujeres = ______________ Niños/as = ___________ Coro: Hombres = ____________ Mujeres = ______________ Niños/as = ___________ Gente parada afuera: Hombres = ____________ Mujeres = ______________ Niños/as = ___________ Guardería o cry room: Hombres = ____________ Mujeres = ______________ Niños/as = ___________ Otras personas: Hombres = ____________ Mujeres = ______________ Niños/as = ___________ Total de
hombres = Total de mujeres =
Total de niños/as =
TOTAL de ADULTOS (hombres + mujeres) = 2. Calcular a cada cuantos adultos se da la encuesta: primero, encuentre en la lista abajo el número de asistentes adultos en esta misa. Luego indicar a cada cuantos adultos le van a aplicar la encuesta. Sí el número de asistentes adultos es entre 0 y 50, se da a cada adulto. __________ Entre 51 y 150 a cada 2 adultos __________ Entre 151 y 200 a cada 3 adultos __________ Entre 201 y 250 a cada 4 adultos __________ Entre 251 y 300 a cada 5 adultos __________ Entre 301 y 350 a cada 6 adultos __________ Entre 351 y 400 a cada 7 adultos __________ Entre 401 y 450 a cada 8 adultos __________ Entre 451 y 500 a cada 9 adultos __________ Entre 501 y 550 a cada 10 adultos __________ Entre 551 y 600 a cada 11 adultos __________ Entre 601 y 650 a cada 12 adultos __________ Entre 651 y 700 a cada 13 adultos __________ Entre 701 y 750 a cada 14 adultos __________ Entre 751 y 800 a cada 15 adultos __________ Entre 801 y 850 a cada 16 adultos __________ Entre 851 y 900 a cada 17 adultos __________ Entre 901 y 950 a cada 18 adultos __________ Entre 951 y 1000 a cada 19 adultos __________ Entre 1001 y 1050 a cada 20 adultos __________ Entre 1051 y 1100 a cada 21 adultos __________ Entre 1101 y 1150 a cada 22 adultos __________ Entre 1151 y 1200 a cada 23 adultos __________ Entre 1201 y 1250 a cada 24 adultos (Volver al paso 7).

Appendix D. Hispanic Population in Georgia County/Location July 1990 July 1999 % growth % of total Georgia 110,046 239,566 218% 100% Metro Atlanta18 62,354 145,422 233% 60.7% Appling 138 276 200% 0.1% Atkinson 154 337 219% 0.1% Bacon 83 186 224% 0.1% Baker 21 27 129% 0% Baldwin 370 643 174% 0.3% Banks 52 140 269% 0.1% Barrow 253 731 289% 0.3% Bartow 522 1,435 275% 0.6% Ben Hill 78 156 200% 0.1% Berrien 280 433 155% 0.2% Bibb 918 1,639 179% 0.7% Bleckley 43 87 202% 0% Brantley 36 95 264% 0% Brooks 255 396 155% 0.2% Bryan 148 429 290% 0.2% Bulloch 362 726 201% 0.3% Burke 67 145 216% 0.1% Butts 114 247 217% 0.1% Calhoun 6 8 133% 0% Camden 629 1,861 296% 0.8% Candler 137 306 223% 0.1% Carroll 592 1,433 242% 0.6% Catoosa 205 0 0% 0% Charlton 35 83 237% 0% Chatham 2,802 5,211 186% 2.2% Chattahoochee 1,786 3,073 172% 1.3% Chattooga 75 159 212% 0.1% Cherokee 1,083 3,633 335% 1.5% Clarke 1,501 2,765 184% 1.2% Clay 19 30 158% 0% Clayton 3,804 8,338 219% 3.5% Clinch 30 82 273% 0% Cobb 9,570 24,350 254% 10.2% Coffee 567 1,126 199% 0.5% Colquitt 1,600 2,135 133% 0.9% Columbia 975 2,739 281% 1.1% Cook 216 316 146% 0.1% Coweta 386 1,320 342% 0.6% Crawford 149 246 165% 0.1% Crisp 62 107 173% 0% Dade 62 157 253% 0.1% Dawson 39 187 479% 0.1% Decatur 481 649 135% 0.3%
18 Counties included: Bartow, Carroll, Cherokee, Clayton, Cobb, Coweta, DeKalb, Douglas, Fayette, Forsyth, Fulton, Gwinnett, Hall, Henry, Paulding and Rockdale. Not all of these counties were considered part of metro Atlanta in 1990 (see Figure 1, Figure 2), so these numbers actually overestimate the numbers of Hispanics in metro Atlanta in 1990, and thus underestimate the over all growth rate.

Hispanic Survey 49
County/Location July 1990 July 1999 % growth % of total
DeKalb 15,874 29,107 183% 12.1% Dodge 148 265 179% 0.1% Dooly 77 150 195% 0.1% Dougherty 816 1,381 169% 0.6% Douglas 750 2,017 269% 0.8% Early 45 67 149% 0% Echols 30 78 260% 0% Effingham 169 553 327% 0.2% Elbert 180 275 153% 0.1% Emanuel 82 154 188% 0.1% Evans 86 207 241% 0.1% Fannin 62 179 289% 0.1% Fayette 1,014 3,112 307% 1.3% Floyd 847 1,709 202% 0.7% Forsyth 643 2,835 441% 1.2% Franklin 77 201 261% 0.1% Fulton 13,522 25,450 188% 10.6% Gilmer 102 332 325% 0.1% Glascock 6 15 250% 0% Glynn 585 1,222 209% 0.5% Gordon 200 509 255% 0.2% Grady 261 543 208% 0.2% Greene 96 213 222% 0.1% Gwinnett 8,639 26,731 309% 11.2% Habersham 343 772 225% 0.3% Hall 4,620 10,995 238% 4.6% Hancock 63 93 148% 0% Haralson 83 220 265% 0.1% Harris 97 249 257% 0.1% Hart 75 165 220% 0.1% Heard 68 186 274% 0.1% Henry 468 1,948 416% 0.8% Houston 1,471 3,426 233% 1.4% Irwin 52 100 192% 0% Jackson 160 424 265% 0.2% Jasper 57 146 256% 0.1% JeffDavis 143 275 192% 0.1% Jefferson 40 65 163% 0% Jenkins 13 24 185% 0% Johnson 35 56 160% 0% Jones 75 168 224% 0.1% Lamar 49 115 235% 0% Lanier 67 155 231% 0.1% Laurens 198 376 190% 0.2% Lee 112 298 266% 0.1% Liberty 3,260 6,249 192% 2.6% Lincoln 56 116 207% 0% Long 189 457 242% 0.2% Lowndes 991 1,977 199% 0.8% Lumpkin 210 595 283% 0.2% Macon 57 92 161% 0% Madison 166 412 248% 0.2%

Hispanic Survey 50
County/Location July 1990 July 1999 % growth % of total
Marion 23 54 235% 0% McDuffie 84 170 202% 0.1% McIntosh 63 139 221% 0.1% Meriwether 123 196 159% 0.1% Miller 20 42 210% 0% Mitchell 261 402 154% 0.2% Monroe 96 206 215% 0.1% Montgomery 155 273 176% 0.1% Morgan 115 263 229% 0.1% Murray 136 401 295% 0.2% Muscogee 5,346 9,390 176% 3.9% Newton 390 1,062 272% 0.4% Oconee 177 508 287% 0.2% Oglethorpe 66 142 215% 0.1% Paulding 268 1,177 439% 0.5% Peach 378 662 175% 0.3% Pickens 44 150 341% 0.1% Pierce 104 272 262% 0.1% Pike 58 134 231% 0.1% Polk 483 1,013 210% 0.4% Pulaski 83 149 180% 0.1% Putnam 97 215 222% 0.1% Quitman 1 5 500% 0% Rabun 67 151 225% 0.1% Randolph 39 45 115% 0% Richmond 3,740 6,763 181% 2.8% Rockdale 599 1,541 257% 0.6% Schley 55 127 231% 0.1% Screven 51 95 186% 0% Seminole 537 573 107% 0.2% Spalding 316 669 212% 0.3% Stephens 144 307 213% 0.1% Stewart 26 43 165% 0% Sumter 190 355 187% 0.1% Talbot 51 90 176% 0% Taliaferro 21 27 129% 0% Tattnall 545 984 181% 0.4% Taylor 58 102 176% 0% Telfair 41 74 180% 0% Terrell 39 64 164% 0% Thomas 280 574 205% 0.2% Tift 1,228 1,984 162% 0.8% Toombs 813 1,657 204% 0.7% Towns 18 52 289% 0% Treutlen 15 28 187% 0% Troup 289 581 201% 0.2% Turner 35 66 189% 0% Twiggs 46 76 165% 0% Union 48 150 313% 0.1% Upson 98 211 215% 0.1% Walker 214 505 236% 0.2% Walton 338 1,017 301% 0.4%

Hispanic Survey 51
County/Location July 1990 July 1999 % growth % of total
Ware 193 350 181% 0.1% Warren 2 5 250% 0% Washington 65 119 183% 0% Wayne 177 385 218% 0.2% Webster 1 2 200% 0% Wheeler 88 161 183% 0.1% White 98 282 288% 0.1% Whitfield 2,349 5,257 224% 2.2% Wilcox 30 56 187% 0% Wilkes 43 65 151% 0% Wilkinson 30 59 197% 0% Worth 224 408 182% 0.2% Source: Analysis of U.S. Census Bureau data by David A. Milliron, Atlanta Journal and Constitution; % calculated by Rees.