Limpieza de membranas de ultrafiltración aplicadas en la ...
395
Programa de Doctorado en Ingeniería y Producción Industrial Limpieza de membranas de ultrafiltración aplicadas en la industria alimentaria por medio de técnicas no convencionales y caracterización del ensuciamiento de las membranas TESIS DOCTORAL Autora: María José Corbatón Báguena Directoras: Dra. Silvia Álvarez Blanco Dra. María Cinta Vincent Vela Valencia, Septiembre de 2015
Transcript of Limpieza de membranas de ultrafiltración aplicadas en la ...

Programa de Doctorado en Ingeniería y Producción
Industrial
Limpieza de membranas de
ultrafiltración aplicadas en la
industria alimentaria por medio
de técnicas no convencionales y
caracterización del ensuciamiento
de las membranas
TESIS DOCTORAL
Autora: María José Corbatón Báguena
Directoras: Dra. Silvia Álvarez Blanco
Dra. María Cinta Vincent Vela
Valencia, Septiembre de 2015

AGRADECIMIENTOS
Tras meses de duro trabajo y años de experimentación, esta Tesis ve
la luz. No hubiera sido posible realizarla sin la ayuda de muchas
personas a las que he encontrado en el camino y que, de una u otra
manera, muchas veces sin tan siquiera esperarlo, me han dado una
valiosa opinión con la que solucionar los contratiempos que se iban
presentando. Incapaz de nombrar en estas páginas una a una a
todas esas personas, me disculpo con ellas y destaco a continuación,
mi sincero agradecimiento a todos los que me han “guiado” hasta ver
la luz.
A mis directoras de Tesis, las Dras. Silvia Álvarez Blanco y María
Cinta Vincent Vela, por todo el tiempo, el esfuerzo y la paciencia
dedicados durante estos cuatro años y sobre todo, por los buenos
consejos que han hecho posible la presentación de esta Tesis.
A todos los profesores del Dpto. de Ingeniería Química y Nuclear, por
el cariño con el que me han tratado todos estos años desde que
empecé la titulación de Ingeniería Química. Gracias especialmente a
los Drs. Valentín Pérez Herranz y Emma Ortega Navarro, por la
ayuda prestada en los ensayos con campos eléctricos.
A todo el personal del Institute on Membrane Technology (Istituto per
la Tecnologia delle Membrane-Consiglio Nazionale delle Ricerche,
ITM-CNR) dirigido por la Dra. Lidietta Giorno, por el apoyo, no sólo
en el laboratorio sino también personal, prestado durante la estancia
realizada allí, y en especial, a los Drs. Annarosa Gugliuzza, Alfredo
Cassano, Rosalinda Mazzei y Carmela Conidi. Grazie mille!
Al Ministerio de Economía y Competitividad, por financiar
económicamente esta investigación mediante el proyecto CTM2010-
20186 y las becas BES-2011-044112 y EEBB-I-14-09011.
A la familia García Ivars, por haberme acogido como una más de la
familia desde el primer día, por los buenos momentos que hemos
pasado juntos y por los que seguro vendrán.
A toda mi familia, en especial a mis padres y mis hermanas, por
compartir mis alegrías con cada nuevo logro y mantenerme en el
camino correcto y con los pies en la tierra. Y a mis yayos, por
enseñarme a explicar qué es un proceso de membranas para “no
ingenieros”. Muchísimas gracias a todos vosotros por estar siempre a
mi lado apoyándome.
“And last but not least”, al Dr. Jorge García Ivars, por darme siempre
una opinión sincera del trabajo y aguantar al pie del cañón los
buenos, y no tan buenos, momentos de redacción de este trabajo.
Sabes que esta Tesis es tan tuya como mía porque, de otro modo,
no hubiera sido posible.
¡Muchas gracias a todos!

Índice ________________________________________________________________________________________________________________________________________________________
I
ÍNDICE
ÍNDICE DE TABLAS
Pág. VI
ÍNDICE DE FIGURAS
IX
RESÚMENES 1
Capítulo I: Introducción
1.1. Motivación
1.2. Objetivos
1.3. Contribución de la Tesis Doctoral
1.4. Estructura de la Tesis Doctoral
10
12
13
16
Capítulo II: Antecedentes
2.1. Industria alimentaria
2.1.1. Industria láctea
2.2. Procesos de separación por membranas
2.2.1. Ultrafiltración
2.3. Ensuciamiento de membranas y modelos
matemáticos
2.3.1. Tipos de ensuciamiento
2.3.2. Mecanismos de ensuciamiento y modelos
matemáticos
2.4. Técnicas de limpieza de membranas
2.4.1. Tipos de métodos de limpieza
2.4.2. Limpieza mediante disoluciones salinas
2.4.3. Limpieza mediante campos eléctricos
2.4.4. Evaluación de la eficacia del proceso de
limpieza
2.5. Bibliografía
22
23
33
36
40
42
45
51
51
59
63
65
68
Índice ________________________________________________________________________________________________________________________________________________________
II
Capítulo III: Metodología experimental
3.1. Equipos y materiales utilizados
3.1.1. Planta piloto
3.1.2. Membranas de ultrafiltración
3.1.3. Reactivos y productos químicos
3.2. Metodología
3.2.1. Caracterización de las membranas
3.2.2. Ensayos de ensuciamiento, aclarado y
limpieza
3.2.3. Determinación de la eficacia hidráulica
del proceso de limpieza
3.2.4. Determinación de la eficacia química del
proceso de limpieza
3.2.5. Técnicas analíticas utilizadas
3.2.6. Análisis computacional
3.3. Bibliografía
82
82
85
86
91
91
92
94
95
100
106
108
Capítulo IV: Modelización del ensuciamiento de las
membranas
4.1. Mecanismos de ensuciamiento de membranas
de ultrafiltración ensuciadas con disoluciones
modelo de lactosuero
Abstract
4.1.1. Introduction
4.1.2. Modelling
4.1.3. Experimental
4.1.4. Results and discussion
4.1.5. Conclusions
Acknowledgements
Nomenclature
4.2. Mecanismos de ensuciamiento de la membrana
de 50 kDa
4.3. Bibliografía
114
115
116
121
125
130
145
146
147
149
153

Índice ________________________________________________________________________________________________________________________________________________________
III
Capítulo V: Limpieza mediante disoluciones salinas de
membranas ensuciadas con proteínas
5.1. Limpieza de membranas de ultrafiltración
ensuciadas con seroalbúmina bovina
Abstract
5.1.1. Introduction
5.1.2. Response Surface Methodology
5.1.3. Experimental
5.1.4. Results and discussion
5.1.5. Conclusions
Acknowledgements
Nomenclature
5.2. Comprobación de la eficacia del proceso de
limpieza mediante métodos químicos
5.3. Bibliografía
162
163
164
167
168
177
196
197
198
200
211
Capítulo VI: Limpieza mediante disoluciones salinas de
membranas ensuciadas con proteínas y sales
6.1. Limpieza de membranas de ultrafiltración
ensuciadas con seroalbúmina bovina y CaCl2
Abstract
6.1.1. Introduction
6.1.2. Materials and methods
6.1.3. Results and discussion
6.1.4. Conclusions
Acknowledgements
Nomenclature
6.2. Bibliografía
220
221
222
225
233
248
249
250
252
Índice ________________________________________________________________________________________________________________________________________________________
IV
Capítulo VII: Limpieza mediante disoluciones salinas de
membranas ensuciadas con disoluciones de lactosuero
7.1. Limpieza de membranas de ultrafiltración
ensuciadas con concentrados de proteínas de
lactosuero
Abstract
7.1.1. Introduction
7.1.2. Materials and methods
7.1.3. Results and discussion
7.1.4. Conclusions
Acknowledgements
Nomenclature
7.2. Bibliografía
260
261
262
265
271
284
285
285
287
Capítulo VIII: Limpieza mediante disoluciones salinas
de membranas ensuciadas con enzimas
8.1. Limpieza de membranas de ultrafiltración
ensuciadas con disoluciones enzimáticas
Abstract
8.1.1. Introduction
8.1.2. Materials and methods
8.1.3. Results and discussion
8.1.4. Conclusions
Acknowledgements
8.2. Bibliografía
294
296
297
301
310
322
323
324
Índice ________________________________________________________________________________________________________________________________________________________
V
Capítulo IX: Limpieza de membranas mediante campos
eléctricos
9.1. Limpieza de membranas de ultrafiltración
ensuciadas con disoluciones modelo de
lactosuero
Abstract
9.1.1. Introduction
9.1.2. Materials and methods
9.1.3. Results and discussion
9.1.4. Conclusions
Acknowledgements
9.2. Bibliografía
332
333
334
338
344
352
353
354
Capítulo X: Conclusiones finales
10.1. Conclusiones finales
10.1.1. Modelización del ensuciamiento de las
membranas
10.1.2. Limpieza de membranas mediante
disoluciones salinas
10.1.3. Limpieza de membranas mediante
campos eléctricos
362
362
364
367
10.2. Final conclusions
10.2.1. Membrane fouling modelling
10.2.2. Membrane cleaning by means of saline
solutions
10.2.3. Membrane cleaning by means of electric
fields
369
369
370
373

Índice de Tablas ________________________________________________________________________________________________________________________________________________________
VI
ÍNDICE DE TABLAS
Tabla 1. Lista de publicaciones Pág. 15
Tabla 2. Composición típica del lactosuero dulce y
ácido
29
Tabla 3. Propiedades de las proteínas del lactosuero 31
Tabla 4. Clasificación de los procesos de membrana
según el gradiente de presión aplicado
35
Tabla 5. Características principales de las membranas
poliméricas utilizadas
86
Tabla 6. Características principales de las membranas
cerámicas utilizadas
86
Tabla 7. Composición del WPC utilizado 88
Tabla 8. Propiedades físicas y pictogramas de las sales
utilizadas
89
Tabla 9. Composition of WPC 45 % powder 126
Table 10. Models fitting accuracy for the ultrafiltration of
BSA solutions at 25 ºC, 2 bar and 2 m·s-1:
values of R2 and SD
136
Table 11. Models fitting accuracy for the ultrafiltration of
BSA and CaCl2 solutions at 25 ºC, 2 bar and
2 m·s-1: values of R2 and SD
137
Table 12. Models fitting accuracy for the ultrafiltration of
WPC 45 % solutions (22.2 g·L-1) at 25 ºC,
2 bar and 2 m·s-1: values of R2 and SD
137
Table 13. Models fitting accuracy for the ultrafiltration of
WPC 45 % solutions (33.3 g·L-1) at 25 ºC,
2 bar and 2 m·s-1: values of R2 and SD
138
Table 14. Models fitting accuracy for the ultrafiltration of
WPC 45 % solutions (44.4 g·L-1) at 25 ºC,
2 bar and 2 m·s-1: values of R2 and SD
138
Índice de Tablas ________________________________________________________________________________________________________________________________________________________
VII
Table 15. Values of model parameters for the best fitting
models
140
Tabla 16. Precisión del ajuste de los modelos para la UF
de disoluciones de BSA (10 g·L-1) a 25 ºC,
2 bar y 2 m·s-1 para la membrana de 50 kDa:
valores de R2 y desviación estándar
151
Tabla 17. Valores de los parámetros de los modelos con
mejor precisión en el ajuste para la membrana
de 50 kDa ensuciada con disoluciones de BSA
(10 g·L-1) a 2 bar y 2 m·s-1
152
Table 18. Experimental data for the statistical analysis 176
Table 19. ANOVA results for the model equations that
relate the hydraulic clceaning efficiency with
the design variables
195
Table 20. Optimal values of the design variables
obtained with a pattern-search optimization
method
196
Tabla 21. Resultados de EDX para las membranas
poliméricas nuevas, ensuciadas con BSA y
tras la limpieza con NaCl (concentración de
sal: 5 mM, temperatura: 50 ºC)
204
Tabla 22. Concentración residual de proteínas en las
membranas poliméricas tras el ensuciamiento
con BSA y la limpieza con NaCl en las
condiciones óptimas
207
Tabla 23. Rugosidad de las membranas poliméricas
utilizadas en la UF de disoluciones de BSA
210
Table 24. Main properties of the membranes used 227
Table 25. ANOVA results for the model equations that
relate HCE with the operating parameters
247
Table 26. Optimal values of the operating parameters
obtained by means of a pattern-search
algorithm
248
Índice de Tablas ________________________________________________________________________________________________________________________________________________________
VIII
Table 27. Composition of the comercial Renylat WPC
used
266
Table 28. Main properties of the membrane used 302
Table 29. Particle size measurement of pectinase
solutions by DLS at various concentration and
temperature
311
Table 30. Values of model parameters for the best fitting
models
316
Table 31. Residual protein concentration after cleaning
procedure and water permeability recovery
319
Table 32. Main components of the Renylat WPC used as
feed solution
339
Índice de Figuras ________________________________________________________________________________________________________________________________________________________
IX
ÍNDICE DE FIGURAS
Fig. 1. Esquema de la estructura de la Tesis Doctoral Pág. 18
Fig. 2. Evolución de la producción alimentaria en
Europa
22
Fig. 3. Composición típica de la leche de vaca 25
Fig. 4. Etapas de la elaboración del queso 27
Fig. 5. Usos del lactosuero 28
Fig. 6. Selectividad de los procesos de membrana
basados en gradiente de presión
35
Fig. 7. Esquema de los fenómenos de polarización
por concentración y formación de capa gel
42
Fig. 8. Representación del ensuciamiento reversible e
irreversible
45
Fig. 9. Esquema de los distintos mecanismos de
ensuciamiento
46
Fig. 10. Evolución de la densidad de flujo de permeado
con el tiempo
49
Fig. 11. Esquema del mecanismo de limpieza
mediante disoluciones salinas propuesto por
Lee y Elimelech (2007)
61
Fig. 12. Clasificación de distintos iones en función de
su carácter “salting-in” y “salting-out”
propuesto por Hofmeister (1888)
62
Fig. 13. Esquema de la planta de UF utilizada 83
Fig. 14. Esquema de la conexión de los electrodos 83
Fig. 15. Fotografías de los módulos utilizados 84
Fig. 16. Esquema del protocolo de ensuciamiento y
limpieza
92
Fig. 17. Representación de las medidas de rugosidad
Ra y Rq
99
Índice de Figuras ________________________________________________________________________________________________________________________________________________________
X
Fig. 18. Estructura de los reactivos utilizados en la
cuantificación de proteínas: (a) complejo Cu+-
proteína y (b) Coomassie Brilliant Blue G-250
(Thanhaeuser et al., 2015)
104
Fig. 19. AFM images for the membranes of (a) 5 kDa,
(b) 15 kDa and (c) 30 kDa
130
Fig. 20. Permeate flux predictions for the best fitting
models during the ultrafiltration of BSA
solutions at 2 bar, 2 m·s-1 and 25 ºC (lines:
estimated results; symbols: experimental
data). The highest fitting accuracy
corresponded to the combined model (R2 of
0.972, 0.993 and 0.976 for the 5, 15 and
30 kDa membranes, respectively)
132
Fig. 21. Permeate flux predictions for the best fitting
models during the ultrafiltration of BSA and
CaCl2 solutions at 2 bar, 2 m·s-1 and 25 ºC
(lines: estimated results; symbols:
experimental data). The highest fitting
accuracy corresponded to the combined model
(R2 of 0.983 and 0.968 for the 5 and 30 kDa
membranes, respectively) and to the
resistance-in-series model (R2 of 0.993 for the
15 kDa membrane)
132
Fig. 22. Permeate flux predictions for the best fitting
models during the ultrafiltration of WPC 45 %
(22.2 g·L-1) solutions at 2 bar, 2 m·s-1 and
25 ºC (lines: estimated results; symbols:
experimental data). The highest fitting
accuracy corresponded to the resistance-in-
series model (R2 of 0.982, 0.969 and 0.991 for
the 5, 15 and 30 kDa membranes,
respectively)
133
Índice de Figuras ________________________________________________________________________________________________________________________________________________________
XI
Fig. 23. Permeate flux predictions for the best fitting
models during the ultrafiltration of WPC 45 %
(33.3 g·L-1) solutions at 2 bar, 2 m·s-1 and
25 ºC (lines: estimated results; symbols:
experimental data). The highest fitting
accuracy corresponded to the resistance-in-
series model (R2 of 0.952, 0.971 and 0.968 for
the 5, 15 and 30 kDa membranes,
respectively)
133
Fig. 24. Permeate flux predictions for the best fitting
models during the ultrafiltration of WPC 45 %
(44.4 g·L-1) solutions at 2 bar, 2 m·s-1 and
25 ºC (lines: estimated results; symbols:
experimental data). The highest fitting
accuracy corresponded to the combined model
(R2 of 0.971 for the 5 kDa membrane) and to
the resistance-in-series model (R2 of 0.979
and 0.980 for the 15 and 30 kDa membranes,
respectively)
134
Fig. 25. Predicción de la variación de la densidad de
flujo de permeado con el tiempo para la
membrane de 50 kDa ensuciada con
disoluciones de BSA (10 g·L-1) a 2 bar, 2 m·s-1
and 25 ºC (líneas: resultados predichos;
símbolos: datos experimentales)
150
Fig. 26. Pilot plant used in the experiments (TRS:
temperature regulating system; FT: feed tank;
P: pump; M1 and M2: manometers; S: scale;
V1: regulating pressure valve)
171
Fig. 27. Evolution of permeate flux with time during
fouling experiments at 2 bar, 2 m·s-1 and 25 ºC
178
Fig. 28. Evolution of rejection with time during the
fouling step for each membrane
179

Índice de Figuras ________________________________________________________________________________________________________________________________________________________
XII
Fig. 29. Evolution of total hydraulic resistance with time
for each membrane (25 ºC, 2 bar and 2 m·s-1
in the fouling step; 25 ºC and 1 bar in the
rinsing steps and 50 ºC and 1 bar in the
cleaning step. Crossflow velocity was
2.18 m·s-1 for all the membranes)
180
Fig. 30 Influence of the type of saline solution on the
values of HCE (black bars) and comparison
with the value of HRE (grey bar) (membrane
MWCO: 15 kDa; temperature: 25 ºC;
concentration: 100 mM; crossflow velocity:
4.2 m·s-1)
182
Fig. 31. Influence of NaCl concentration on the values
of HCE for the membranes of 5 kDa (a),
15 kDa (b) and 30 kDa (c), when the cleaning
solution temperature is 25 ºC (grey bars) and
50 ºC (black bars) and the crossflow velocity is
2.18 m·s-1 for the 5 and 30 kDa membranes
and 4.2 m·s-1 for the 15 kDa membrane
185
Fig. 32 Influence of NaCl concentration on the values
of HCE for the membrane of 50 kDa, when the
cleaning solution temperature is 50 ºC and the
crossflow velocity is 4.2 m·s-1
187
Fig. 33. Influence of temperature on the values of HCE
for the membranes of 5 kDa (white bars),
15 kDa (dark grey bars) and 30 kDa (black
bars), when NaCl concentration is 5 mM and
the crossflow velocity is 2.18 m·s-1 for the 5
and 30 kDa membranes and 4.2 m·s-1 for the
15 kDa membrane
188
Fig. 34. Influence of temperature on the values of
HCE, when NaCl concentration is 7.5 mM and
crossflow velocity is 4.2 m·s-1 for the 50 kDa
membrane
190
Índice de Figuras ________________________________________________________________________________________________________________________________________________________
XIII
Fig. 35 Influence of crossflow velocity on the values of
HCE for the membranes of 15 kDa (a) and 5
and 30 kDa (b), when temperature is 50 ºC
and NaCl concentration is 2.5 mM for the
15 kDa membrane and 5 mM for the 5 and
30 kDa membranes
192
Fig. 36. Contour plot for HCE as a function of
temperature and NaCl concentration for the
membranes of 5 kDa (a), 15 kDa (b) and
30 kDa (c) at a crossflow velocity of 2.18 m·s-1
for the 5 and 30 kDa membranes and 4.2 m·s-1
for the 15 kDa membrane
194
Fig. 37. Imágenes de SEM de la membrana de 5 kDa
(a) nueva, (b) tras el ensuciamiento con BSA y
(c) tras la limpieza con NaCl en las
condiciones óptimas
201
Fig. 38. Imágenes de SEM de la membrana de 30 kDa
(a) nueva, (b) tras el ensuciamiento con BSA y
(c) tras la limpieza con NaCl en las
condiciones óptimas
202
Fig. 39. Espectros de ATR-FTIR de las membranas
nuevas, tras el ensuciamiento con BSA y tras
la limpieza con NaCl de (a) 5 kDa y (b) 30 kDa
206
Fig. 40. Imágenes de AFM de las membranas nueva
(1), tras el ensuciamiento con BSA (2) y tras la
limpieza con NaCl (3) de las membranas de
(a) 5 kDa y (b) 30 kDa
209
Fig. 41. Variation of permeate flux with time during
fouling experiments at 2 bar, 2 m·s-1 and 25 ºC
235
Fig. 42. Variation of BSA rejection with time during the
fouling step for each membrane
236
Índice de Figuras ________________________________________________________________________________________________________________________________________________________
XIV
Fig. 43. Variation of total hydraulic resistance with time
for each membrane when the experimental
conditions were: 25 ºC, 2 bar and 2 m·s-1 in
the fouling step; 25 ºC, 1 bar and 2.18 m·s-1 in
the rinsing steps; 50 ºC, 1 bar and 2.18 m·s-1
in the cleaning step. NaCl concentration in the
cleaning solution was 7.5 mM for the 5 and
30 kDa membranes and 5 mM for the 15 kDa
membrane
237
Fig. 44. Influence of NaCl concentration on the values
of HCE for the membranes of 5 kDa (a),
15 kDa (b) and 30 kDa (c), when the cleaning
solution temperature is 25 ºC (grey bars) and
50 ºC (black bars) and the crossflow velocity is
2.18 m·s-1 for the polymeric membranes and
4.2 m·s-1 for the ceramic membrane
239
Fig. 45. Influence of temperature on the values of HCE
for the membranes of: (a) 5 kDa (grey bars)
and 30 kDa (black bars) at 2.18 m·s-1 and a
NaCl concentration of 7.5 mM, and (b) 15 kDa
at 4.2 m·s-1 and a NaCl concentration of 5 mM
241
Fig. 46. Influence of crossflow velocity on the values of
HCE for the membranes of: (a) 5 kDa (grey
bars) and 30 kDa (black bars) at 50 ºC and a
NaCl concentration of 7.5 mM, and (b) 15 kDa
at 50 ºC and a NaCl concentration of 5 mM
243
Fig. 47. Contour plot for HCE as a function of
temperature and NaCl concentration for the
membranes of 5 kDa (a), 15 kDa (b) and
30 kDa (c) at a crossflow velocity of 2.18 m·s-1
for the polymeric membranes and 4.2 m·s-1 for
the ceramic membrane
246

Índice de Figuras ________________________________________________________________________________________________________________________________________________________
XV
Fig. 48. Evolution of permeate flux with time for the
5 kDa (a), 15 kDa (b) and 30 kDa (c)
membranes with WPC solutions at different
concentrations
272
Fig. 49. Evolution of rejection values with time for the
5 kDa (a), 15 kDa (b) and 30 kDa (c)
membranes with WPC solutions at different
concentrations
274
Fig. 50. Effect of NaCl concentration on HCE (WPC
concentration: 22.2 g·L-1; temperature: 50 ºC;
crossflow velocity: 2.18 m·s-1 for the 5 and
30 kDa membranes and 4.2 m·s-1 for the
15 kDa membrane)
276
Fig. 51. Effect of temperature on HCE (WPC
concentration: 22.2 g·L-1; NaCl concentration:
5 mM; crossflow velocity: 2.18 m·s-1 for the 5
and 30 kDa membranes and 4.2 m·s-1 for the
15 kDa membrane)
279
Fig. 52. Effect of crossflow velocity on HCE (WPC
concentration: 22.2 g·L-1; NaCl concentration:
5 mM; temperature: 80 ºC)
280
Fig. 53. Effect of WPC concentration during fouling
step on HCE at different crossflow velocities
(NaCl concentration: 5 mM; temperature:
80 ºC)
281
Fig. 54. AFM images of new membrane (a) and
membranes fouled with enzymatic solutions at
2 g/L (b), 7.5 g/L (c) and 15 g/L (d)
312
Fig. 55. ATR-FTIR spectra of new membrane and (a)
membranes fouled with enzymatic solutions at
2, 7.5 and 15 g/L; (b) membranes cleaned with
NaCl (enzymatic solution concentration during
fouling: 2, 7.5 and 15 g/L); (c) membranes
cleaned with NaCl and Na2SO4 (enzymatic
solution concentration during fouling: 15 g/L)
314
Índice de Figuras ________________________________________________________________________________________________________________________________________________________
XVI
Fig. 56. Permeate flux predictions for the best fitting
models using enzymatic solutions (lines:
estimated results; symbols: experimental data)
315
Fig. 57. Schematic representation of the VF-S11 UF
plant connected to a direct current (DC)
supplier (a) and electrodes connection in the
membrane module (b)
341
Fig. 58. Influence of temperature of the cleaning
solution and electric field potential on HCE for
the 15 kDa membrane using (a) deionized
water and (b) NaCl at a concentration of 5 mM
as cleaning solution (fouling solution: BSA;
operating conditions during cleaning: 1 bar and
4.2 m·s-1)
345
Fig. 59. Influence of temperature of the cleaning
solution and electric field potential on HCE for
the 50 kDa membrane using different cleaning
agents (fouling solution: BSA; operating
conditions during cleaning: 1 bar and
4.2 m·s-1)
348
Fig. 60. Influence of feed solution composition during
the fouling step on HCE for the 15 kDa
membrane (operating conditions during
cleaning: 1 bar, 4.2 m·s-1, 37.5 ºC, 30 V and
5 mM NaCl)
351
Fig. 61. Influence of temperature of the cleaning
solution on HCE for the 15 kDa membrane
(operating conditions during cleaning: 1 bar,
4.2 m·s-1, 30 V and 5 mM NaCl)
351
Resúmenes ________________________________________________________________________________________________________________________________________________________
1
RESÚMENES
Título: “Limpieza de membranas de ultrafiltración aplicadas en
la industria alimentaria por medio de técnicas no
convencionales y caracterización del ensuciamiento de las
membranas”.
Resumen
En la presente Tesis Doctoral se investigó la aplicación de dos
técnicas no convencionales (disoluciones salinas y campos
eléctricos) para limpiar membranas de ultrafiltración que previamente
habían sido ensuciadas con disoluciones modelo de lactosuero.
Además, se estudió el ensuciamiento de las membranas causado por
las diferentes disoluciones ensayadas, caracterizando el mismo
mediante el ajuste de distintos modelos matemáticos semi-empíricos
a los resultados experimentales de variación de la densidad de flujo
de permeado con el tiempo.
Los ensayos se realizaron a escala de laboratorio con cuatro
membranas de ultrafiltración de diferente material (cerámicas y
orgánicas) y umbral de corte molecular (5, 15, 30 y 50 kDa) y con
tres disoluciones modelo de lactosuero consistentes en disoluciones
acuosas de seroalbúmina bovina (BSA), BSA con CaCl2 y
concentrado de proteínas de lactosuero (WPC). Cada ensayo fue
dividido en cuatro etapas: ensuciamiento con la disolución modelo,
primer aclarado, limpieza y segundo aclarado. Las condiciones
Resúmenes ________________________________________________________________________________________________________________________________________________________
2
experimentales durante la primera etapa fueron las mismas en todos
los casos, para poder evaluar la influencia de las condiciones
experimentales durante la etapa de limpieza (tipo de disolución
salina, concentración de sal, temperatura de la disolución, velocidad
tangencial y potencial de campo eléctrico aplicado) en la eficacia del
proceso de limpieza. Los modelos matemáticos considerados fueron
los modelos de Hermia adaptados a flujo tangencial, un modelo
combinado basado en las ecuaciones de Hermia de bloqueo
completo de poros y formación de torta y un modelo de resistencias
en serie.
Los resultados obtenidos durante la etapa de ensuciamiento
demostraron que los modelos matemáticos utilizados son capaces de
predecir con una elevada exactitud el descenso de la densidad de
flujo de permeado con el tiempo, determinándose el valor de los
parámetros característicos de dichos modelos y los mecanismos de
ensuciamiento responsables principalmente de dicho descenso. En
cuanto a los ensayos de limpieza de las membranas utilizadas, los
resultados indicaron que tanto las disoluciones salinas como los
campos eléctricos son técnicas efectivas para recuperar las
propiedades permselectivas de las membranas, utilizando un
intervalo de concentración de sal óptimo.
Resúmenes ________________________________________________________________________________________________________________________________________________________
3
Títol: “Neteja de membranes d’ultrafiltració aplicades en la
indústria alimentaria per mitjà de tècniques no convencionals i
caracterització de l’embrutament de les membranes”.
Resum
En la present Tesi Doctoral es va investigar l’aplicació de dues
tècniques no convencionals (dissolucions salines i camps elèctrics)
per a netejar membranes d’ultrafiltració que prèviament havien sigut
embrutades amb dissolucions model de sèrum de llet. A més, es va
estudiar l’embrutament de les membranes causat per les diferents
dissolucions assajades, caracteritzant el mateix mitjançant l’ajust de
distints models matemàtics semi-empírics als resultats experimentals
de variació de la densitat de flux de permeat amb el temps.
Els experiments es realitzaren a escala de laboratori amb quatre
membranes d’ultrafiltració de diferent material (ceràmiques i
orgàniques) i umbral de tall molecular (5, 15, 30 i 50 kDa) i amb tres
dissolucions model de sèrum de llet consistents en dissolucions
aquoses de seroalbúmina bovina (BSA), BSA amb CaCl2 i concentrat
de proteïnes de sèrum de llet (WPC). Cada experiment fou dividit en
quatre etapes: embrutament amb la dissolució model, primer aclarat,
neteja i segon aclarat. Les condicions experimentals durant la
primera etapa van ser les mateixes en tots els casos, per a poder
evaluar la influència de les condicions experimentals durant l’etapa
de neteja (classe de dissolució salina, concentració de sal,
temperatura de la dissolució, velocitat tangencial i potencial de camp
elèctric aplicat) en l’eficàcia del procés de neteja. Els models
Resúmenes ________________________________________________________________________________________________________________________________________________________
4
matemàtics utilitzats varen ser els models d’Hermia adaptats a flux
tangencial, un model combinat basat en las equacions d’Hermia de
bloqueig complet de porus i formació de torta i un model de
resistències en serie.
Els resultats obtinguts durant l’etapa d’embrutament demostraren que
els models matemàtics utilitzats són capaços de predir amb una
elevada exactitud el descens de densitat de flux de permeat amb el
temps, determinant-se el valor dels paràmetres característics dels
citats models i els mecanismes d’embrutament responsables
principalment del citat descens. En quant als experiments de neteja
de les membranes utilitzades, els resultats indicaren que tant les
dissolucions salines com els camps elèctrics són tècniques efectives
per a recuperar les propietats permselectives de les membranes,
utilitzant un interval de concentració de sal òptim.
Resúmenes ________________________________________________________________________________________________________________________________________________________
5
Title: “Cleaning of ultrafiltration membranes used in the food
industry by means of non conventional techniques and
characterization of membrane fouling”.
Abstract
In this PhD Thesis, the application of two non conventional
techniques (saline solutions and electric fields) to clean ultrafiltration
membranes that were previously fouled with whey model solutions
was investigated. In addition, the membrane fouling caused by the
different model solutions was studied as well. This fouling was
characterised by fitting different semi-empirical mathematical models
to the experimental data of permeate flux evolution with time.
Experiments were performed at a laboratory scale with four
ultrafiltration membranes of different material (ceramic and organic)
and molecular weight cut-off (5, 15, 30 and 50 kDa) and three
different whey model solutions consisting of aqueous solutions of
bovine serum albumin (BSA), BSA with CaCl2 and whey protein
concentrate (WPC). Each experiment was divided in four steps:
fouling with the model solution, first rinsing, cleaning and second
rinsing. Experimental conditions during the first stage were the same
in all the cases, so that it could be determined the influence of the
experimental conditions during the cleaning step (type of saline
solution, salt concentration, cleaning solution temperature, crossflow
velocity and potential of the electric field) on the cleaning efficiency.
The mathematical models considered were the Hermia’s models
adapted to crossflow filtration, a combined model based on Hermia’s
Resúmenes ________________________________________________________________________________________________________________________________________________________
6
equations of complete pore blocking and cake formation and a
resistance-in-series model.
The results obtained during the fouling step demonstrated that the
mathematical models used were able to predict with high accuracy
the permeate flux decline with time. The value of the model
characteristic parameters and the fouling mechanisms mainly
responsible for that decline were determined. Regarding the cleaning
experiments for the membranes used, the results indicated that both,
saline solutions and electric fields, were effective techniques to
recover the membrane permselective properties when an optimal salt
concentration range was considered.

Introducción

Introducción ________________________________________________________________________________________________________________________________________________________
10
1.1. MOTIVACIÓN
En las últimas décadas, los procesos de separación con membranas
han sido implementados en diversas industrias, entre ellas la
industria alimentaria y, más concretamente, la industria láctea,
debido a sus numerosas ventajas frente a los métodos
convencionales de concentración, purificación y fraccionamiento.
Entre estas ventajas, cabe destacar su simplicidad, elevada
selectividad, condiciones de operación suaves, facilidad de escalado
y reducido consumo energético. Entre los procesos de separación
por membranas más utilizados en la industria láctea, destaca la
ultrafiltración (UF), utilizada para aplicaciones como concentración de
la leche o concentración de proteínas de lactosuero.
No obstante, estos procesos presentan un principal inconveniente: el
descenso de la densidad de flujo de permeado con el tiempo como
consecuencia del ensuciamiento de las membranas. Este
ensuciamiento conlleva la disminución de la producción global y de la
vida útil de las membranas, así como un aumento de los costes de
operación y del consumo de energía.
Para intentar recuperar las propiedades permselectivas de las
membranas y garantizar el funcionamiento óptimo de la instalación,
se llevan a cabo procesos de limpieza y desinfección periódicamente
en los que se eliminan los depósitos de ensuciamiento. Sin embargo,
dichas etapas de limpieza implican una interrupción de la producción,
un aumento de los costes de operación y de energía eléctrica y un
impacto negativo sobre la vida útil de las membranas. Por todo ello,
Capítulo I ________________________________________________________________________________________________________________________________________________________
11
la investigación se ha centrado en los últimos años en minimizar el
proceso de ensuciamiento, optimizar las etapas de limpieza e
implementar nuevas metodologías para eliminar la suciedad de las
membranas de manera más efectiva y menos dañina para las
membranas y el medioambiente.
La mayoría de los trabajos bibliográficos centrados en la limpieza de
membranas, utilizan métodos convencionales en los que intervienen
sustancias químicas de diferente naturaleza (ácidos, bases, agentes
tensioactivos, quelantes). Estos métodos pueden ocasionar, a largo
plazo, daños en las membranas y/o cambios en su estructura a la
vez que suponen un sobrecoste en el proceso de producción global y
generan elevados volúmenes de aguas residuales. Es por ello que,
recientemente, los investigadores han centrado sus esfuerzos en
proponer nuevas técnicas de limpieza alternativas a las
convencionales, como las disoluciones salinas o los campos
eléctricos. Con ellas, se espera alargar la vida útil de las membranas
de UF y aumentar la productividad global del proceso.
En la presente Tesis Doctoral se proponen, ensayan y optimizan
técnicas innovadoras de limpieza de membranas de UF utilizadas en
la industria alimentaria, y más concretamente, en el tratamiento de
lactosuero. Además, se llevará a cabo el estudio y caracterización del
ensuciamiento causado en las membranas utilizando disoluciones
modelo propias de dichas industrias.
Introducción ________________________________________________________________________________________________________________________________________________________
12
1.2. OBJETIVOS
El principal objetivo de esta Tesis Doctoral consiste en proponer,
ensayar y optimizar técnicas efectivas de limpieza de membranas de
ultrafiltración utilizadas en la industria alimentaria, concretamente, en
la industria láctea para el tratamiento del lactosuero. Dichas técnicas
de limpieza serán metodologías innovadoras alternativas a las
convencionales: disoluciones salinas y campos eléctricos.
Para alcanzar dicho objetivo principal, se han planteado los
siguientes objetivos específicos:
Estudiar el ensuciamiento depositado y/o adsorbido sobre
membranas de ultrafiltración utilizadas en la industria láctea.
Relacionar dicho ensuciamiento con el tipo de alimentación y
las características de las membranas.
Analizar el ajuste de distintos modelos matemáticos a los
datos experimentales obtenidos durante la etapa de
ensuciamiento.
Investigar el efecto de las condiciones de operación durante
la etapa de limpieza sobre la eficacia de ese mismo proceso,
para cada una de las técnicas ensayadas.
Relacionar el tipo de membrana y su ensuciamiento con el
método de limpieza más eficaz para su tratamiento desde el
punto de vista de recuperación de las propiedades
permselectivas de la membrana.
Capítulo I ________________________________________________________________________________________________________________________________________________________
13
1.3. CONTRIBUCIÓN DE LA TESIS DOCTORAL
Entre las principales contribuciones de esta Tesis Doctoral, pueden
destacarse las siguientes:
Realización de una revisión bibliográfica acerca de los
principales mecanismos de ensuciamiento, modelos de
ensuciamiento y métodos de limpieza, convencionales y
alternativos, de membranas aplicadas a procesos de UF.
Análisis y comparación del ajuste de distintos modelos
matemáticos aplicados al ensuciamiento causado por
disoluciones modelo de lactosuero.
Determinación de los mecanismos de ensuciamiento
responsables del mismo en función de las características de
las membranas y disoluciones utilizadas.
Propuesta de las condiciones de operación más efectivas
para limpiar cada una de las membranas utilizadas, en
función de la disolución alimento ensayada durante la etapa
de ensuciamiento y de la técnica de limpieza aplicada.
Comparación de las distintas técnicas de limpieza de
membranas.
Por otra parte, los resultados recogidos en esta Tesis han sido
presentados en distintos congresos y conferencias de ámbito tanto
nacional como internacional:
Network of Young Membrains 2011 (NYM13)
International Congress on Membranes and Membrane
Processes (ICOM 2011)

Introducción ________________________________________________________________________________________________________________________________________________________
14
2012 Conference and Exhibition Desalination for the
Environment. Clean Water and Energy
International Congress of Chemical Engineering
(ANQUEICCE 2012)
Network of Young Membrains 2012 (NYM14)
Euromembrane 2012
Workshop Membrane Processes for Industrial Control with
Water and Products Recovery
29th EMS Summer School 2013. Membranes for liquid
separations from an industrial & academic point of view.
6th Membrane Conference of Visegrad Countries (PERMEA
2013)
2014 Conference and Exhibition Desalination for the
Environment. Clean Water and Energy
IX Congreso Iberoamericano en Ciencia y Tecnología de
Membranas (CITEM 2014)
XXXI EMS Summer School 2014 on Innovative Membrane
Systems
EuroMed 2015. Desalination for Clean Water and Energy.
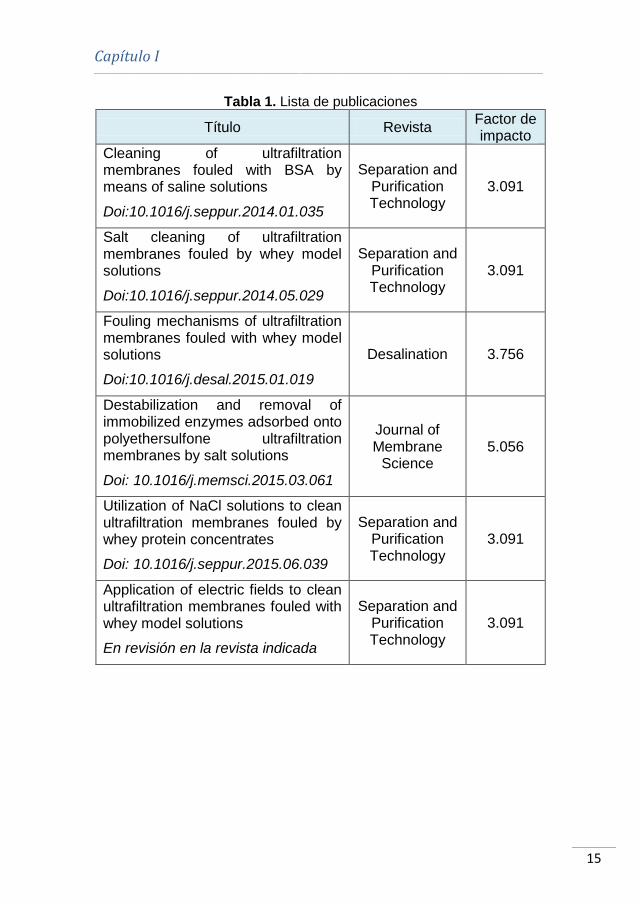
Además, y puesto que esta Tesis Doctoral se presenta como un
compendio de publicaciones, la Tabla 1 recoge la lista de artículos en
revistas científicas a los que este trabajo ha dado lugar.
Capítulo I ________________________________________________________________________________________________________________________________________________________
15
Tabla 1. Lista de publicaciones
Título Revista Factor de impacto
Cleaning of ultrafiltration membranes fouled with BSA by means of saline solutions
Doi:10.1016/j.seppur.2014.01.035
Separation and Purification Technology
3.091
Salt cleaning of ultrafiltration membranes fouled by whey model solutions
Doi:10.1016/j.seppur.2014.05.029
Separation and Purification Technology
3.091
Fouling mechanisms of ultrafiltration membranes fouled with whey model solutions
Doi:10.1016/j.desal.2015.01.019
Desalination 3.756
Destabilization and removal of immobilized enzymes adsorbed onto polyethersulfone ultrafiltration membranes by salt solutions
Doi: 10.1016/j.memsci.2015.03.061
Journal of Membrane
Science 5.056
Utilization of NaCl solutions to clean ultrafiltration membranes fouled by whey protein concentrates
Doi: 10.1016/j.seppur.2015.06.039
Separation and Purification Technology
3.091
Application of electric fields to clean ultrafiltration membranes fouled with whey model solutions
En revisión en la revista indicada
Separation and Purification Technology
3.091

Introducción ________________________________________________________________________________________________________________________________________________________
16
1.4. ESTRUCTURA DE LA TESIS DOCTORAL
Tras un primer capítulo (“Capítulo I. Introducción”) en el que se
presentan los principales objetivos, la motivación, las contribuciones
y la estructura de esta Tesis Doctoral, se expone una revisión
bibliográfica (“Capítulo II. Antecedentes”) acerca de los mecanismos
de ensuciamiento predominantes en las membranas de UF utilizadas
en la industria alimentaria y, más concretamente, en la industria
láctea, así como de los métodos de limpieza convencionales y
alternativos utilizados para este tipo de membranas.
A continuación, en el “Capítulo III. Metodología experimental” se
describirán brevemente las plantas piloto utilizadas, las membranas y
los productos químicos necesarios para llevar a cabo los ensayos y
los diferentes protocolos de ensuciamiento, limpieza y análisis
químicos realizados.
En cuanto a los resultados, éstos han sido divididos en seis
capítulos. En primer lugar, se exponen los resultados
correspondientes a los ensayos de ensuciamiento con las distintas
disoluciones modelo de lactosuero (“Capítulo IV. Modelización del
ensuciamiento de las membranas”). Seguidamente, en los Capítulos
V, VI, VII y VIII se recogen los resultados correspondientes a la
técnica de limpieza de membranas mediante disoluciones salinas
utilizando diferentes disoluciones durante la etapa de ensuciamiento:
tres disoluciones modelo de lactosuero (seroalbúmina bovina, BSA,
BSA con CaCl2 y concentrados de proteínas del lactosuero, WPC) y
una disolución propia de la industria de zumos y bebidas, que es una
Capítulo I ________________________________________________________________________________________________________________________________________________________
17
disolución enzimática de pectinasas. El Capítulo V contiene a su vez
un subapartado en el que se compara la eficacia del proceso de
limpieza de membranas ensuciadas con seroalbúmina bovina (BSA)
obtenida mediante métodos hidráulicos con la determinada mediante
métodos químicos. Finalmente, el “Capítulo IX. Limpieza de
membranas mediante campos eléctricos” incluye los resultados
correspondientes a la técnica de limpieza mediante generación de
campos eléctricos, así como una comparación entre las dos técnicas
de limpieza ensayadas.
Esta Tesis finaliza con un capítulo en el que se recogen las
conclusiones más destacadas a lo largo de todo el trabajo (“Capítulo
X. Conclusiones finales”).
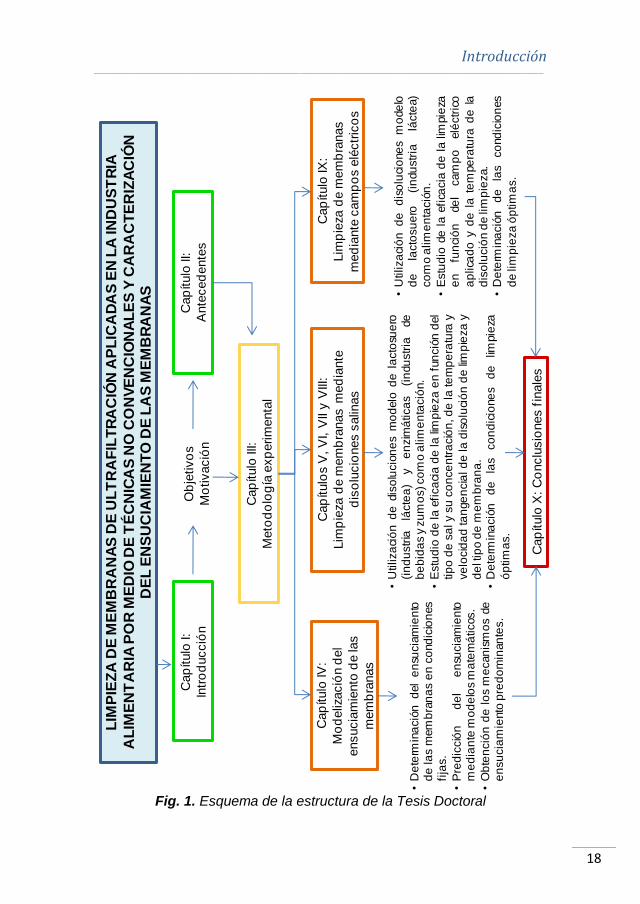
La Fig. 1 representa de manera esquemática la estructura de la Tesis
Doctoral detallada anteriormente.
Introducción ________________________________________________________________________________________________________________________________________________________
18
Fig. 1. Esquema de la estructura de la Tesis Doctoral
LIM
PIE
ZA
DE
ME
MB
RA
NA
S D
E U
LT
RA
FIL
TR
AC
IÓN
AP
LIC
AD
AS
EN
LA
IND
US
TR
IA
AL
IME
NT
AR
IA P
OR
ME
DIO
DE
TÉ
CN
ICA
S N
O C
ON
VE
NC
ION
AL
ES
Y C
AR
AC
TE
RIZ
AC
IÓN
D
EL
EN
SU
CIA
MIE
NT
O D
E L
AS
ME
MB
RA
NA
S
Cap
ítulo
I:
Intr
od
ucció
n
Cap
ítulo
II:
Ante
ced
ente
s
Cap
ítulo
III:
Meto
do
log
ía e
xp
erim
enta
l
Cap
ítulo
IV:
Mo
deliz
ació
n d
el
ensucia
mie
nto
de la
s
mem
bra
nas
Cap
ítulo
s V
, V
I, V
II y V
III:
Lim
pie
za d
e m
em
bra
nas m
ed
iante
dis
olu
cio
nes s
alin
as
Cap
ítulo
IX:
Lim
pie
za d
e m
em
bra
nas
med
iante
cam
po
s e
léctr
ico
s
Cap
ítulo
X: C
onclu
sio
nes f
inale
s
Ob
jetivo
s
Mo
tivació
n
•D
ete
rmin
ació
nd
el
en
sucia
mie
nto
de
las
mem
bra
na
se
nco
nd
icio
nes
fija
s.
•P
red
icció
nd
el
en
sucia
mie
nto
me
dia
nte
mo
de
los
ma
tem
áticos.
•O
bte
nció
nd
elo
sm
ecan
ism
os
de
en
su
cia
mie
nto
pre
do
min
an
tes.
•U
tiliza
ció
nd
edis
olu
cio
ne
sm
od
elo
de
lacto
sue
ro(i
nd
ustr
ialá
cte
a)
ye
nzim
ática
s(i
ndu
str
iade
be
bid
as
yzu
mo
s)co
mo
alim
en
tació
n.
•E
stu
dio
de
laefi
ca
cia
de
lalim
pie
za
en
fun
ció
nd
el
tip
od
esa
ly
su
co
nce
ntr
ació
n,d
ela
tem
pe
ratu
ray
ve
locid
ad
tan
ge
ncia
ld
ela
dis
olu
ció
nd
elim
pie
za
yd
elt
ipo
de
me
mb
ran
a.
•D
ete
rmin
ació
nd
ela
sco
nd
icio
ne
sd
elim
pie
za
óp
tim
as.
•U
tiliza
ció
nd
ed
iso
luci
one
sm
ode
lod
ela
cto
su
ero
(in
du
str
ialá
cte
a)
co
mo
alim
en
tació
n.
•E
stu
dio
de
laefi
cacia
de
lalim
pie
zae
nfu
nci
ón
de
lcam
po
elé
ctr
ico
ap
lica
do
yd
ela
tem
pe
ratu
rad
ela
dis
olu
ció
nd
elim
pie
za.
•D
ete
rmin
ació
nd
ela
sco
nd
icio
nes
de
lim
pie
za
óp
tim
as.

Antecedentes

Antecedentes ________________________________________________________________________________________________________________________________________________________
22
2.1. INDUSTRIA ALIMENTARIA
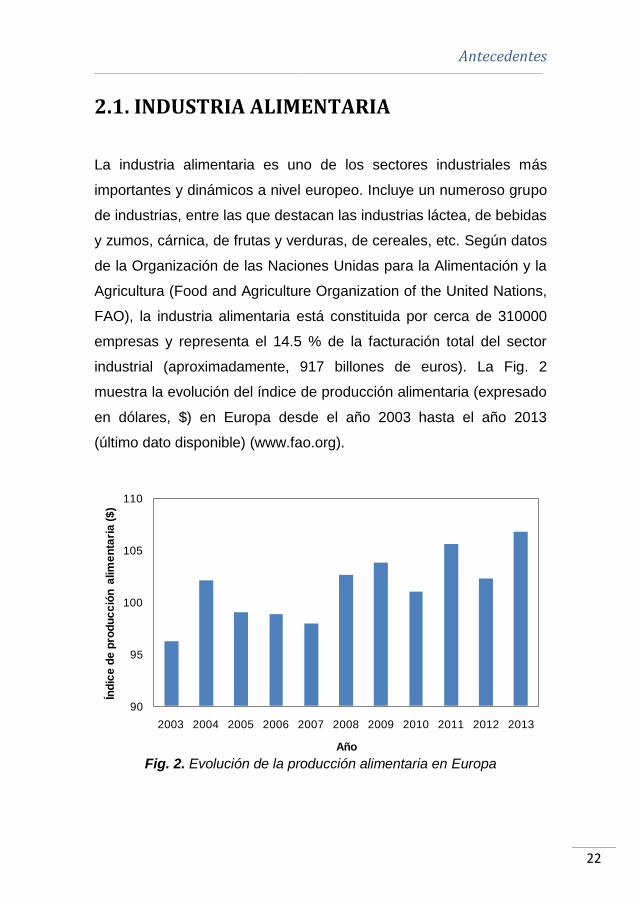
La industria alimentaria es uno de los sectores industriales más
importantes y dinámicos a nivel europeo. Incluye un numeroso grupo
de industrias, entre las que destacan las industrias láctea, de bebidas
y zumos, cárnica, de frutas y verduras, de cereales, etc. Según datos
de la Organización de las Naciones Unidas para la Alimentación y la
Agricultura (Food and Agriculture Organization of the United Nations,
FAO), la industria alimentaria está constituida por cerca de 310000
empresas y representa el 14.5 % de la facturación total del sector
industrial (aproximadamente, 917 billones de euros). La Fig. 2
muestra la evolución del índice de producción alimentaria (expresado
en dólares, $) en Europa desde el año 2003 hasta el año 2013
(último dato disponible) (www.fao.org).
Fig. 2. Evolución de la producción alimentaria en Europa
90
95
100
105
110
2003 2004 2005 2006 2007 2008 2009 2010 2011 2012 2013
Índ
ice
de
pro
du
cc
ión
alim
en
tari
a (
$)
Año
Capítulo II ________________________________________________________________________________________________________________________________________________________
23
Puesto que la presente Tesis Doctoral se centra en el estudio del
tratamiento de lactosuero, un subproducto de la industria láctea, se
describen, a continuación, las principales características de la leche,
sus productos derivados y sus principales usos.
2.1.1. Industria láctea
La leche y los productos lácteos son parte fundamental de la dieta
humana desde tiempos inmemorables. Según datos de la FAO,
durante el año 2013 se produjeron más de 746 millones de toneladas
de leche a nivel mundial. La mayor parte de dicha producción
proviene de la ganadería bovina (83%), seguida de búfalos (13%),
cabras (2%), ovejas (1%) y camellos (0.3%). Aproximadamente, el
0.7% restante proviene de otros mamíferos, como los equinos
(burras y yeguas) y los yaks (www.fao.org).
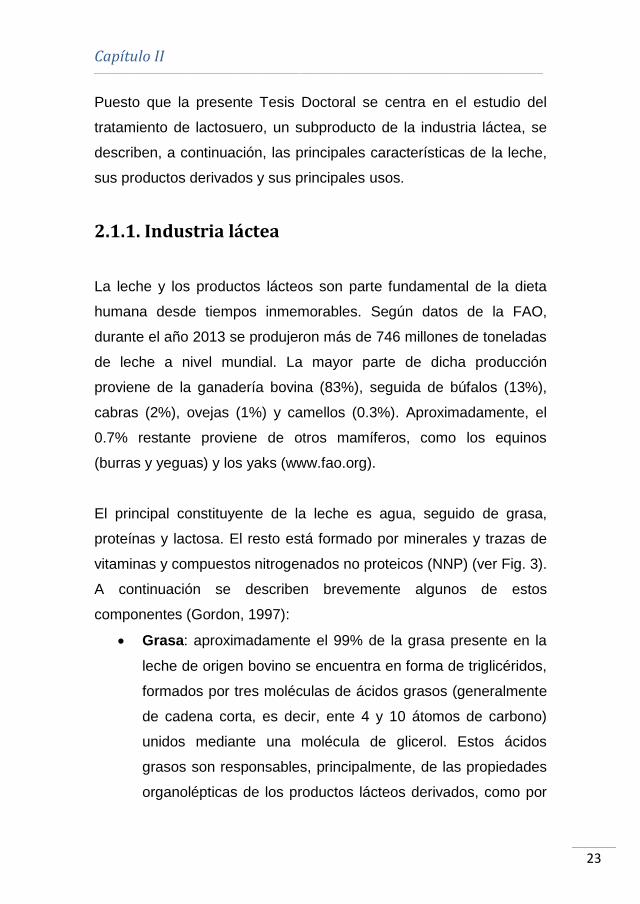
El principal constituyente de la leche es agua, seguido de grasa,
proteínas y lactosa. El resto está formado por minerales y trazas de
vitaminas y compuestos nitrogenados no proteicos (NNP) (ver Fig. 3).
A continuación se describen brevemente algunos de estos
componentes (Gordon, 1997):
Grasa: aproximadamente el 99% de la grasa presente en la
leche de origen bovino se encuentra en forma de triglicéridos,
formados por tres moléculas de ácidos grasos (generalmente
de cadena corta, es decir, ente 4 y 10 átomos de carbono)
unidos mediante una molécula de glicerol. Estos ácidos
grasos son responsables, principalmente, de las propiedades
organolépticas de los productos lácteos derivados, como por

Antecedentes ________________________________________________________________________________________________________________________________________________________
24
ejemplo, los quesos.
Lactosa: es el azúcar característico de la leche obtenida de
mamíferos. Entre las propiedades más importantes de este
disacárido de glucosa y galactosa destacan su carácter
reductor, su limitada solubilidad en agua (cerca de 21 g por
cada 100 g de agua), su transformación en ácido láctico
mediante bacterias y su hidrólisis en glucosa y galactosa
mediante enzimas.
Proteínas: las proteínas de la leche se dividen en dos
grandes tipos: caseína y proteínas del lactosuero. La principal
diferencia entre ambas reside en el pH al que precipitan:
mientras que la caseína es insoluble a un pH alrededor de
4.6, las proteínas de lactosuero permanecen en la disolución
en esas condiciones. Durante la producción de queso, la
caseína (en una proporción con respecto al resto de proteínas
del lactosuero de, aproximadamente, un 80 %) precipita,
mientras que las demás proteínas permanecen en el
lactosuero.
Minerales: las principales sales presentes en la leche están
constituidas por Ca, Mg, K, Na, Cl, PO4, bicarbonato, citrato y,
en menor medida, Cu, Zn y Fe. Además de encontrarse en
forma de sales disueltas, las sales de K y Na se pueden
presentar en forma coloidal unidas a los grupos fosfato y
carboxilo negativamente cargados de la caseína. Este
equilibrio entre las sales disueltas y las sales en forma
coloidal, conocido como equilibrio salino, puede verse
alterado por cambios de pH, temperatura y/o concentración,
Capítulo II ________________________________________________________________________________________________________________________________________________________
25
como ocurre, por ejemplo, en el tratamiento a altas
temperaturas durante el procesado de la leche.
Fig. 3. Composición típica de la leche de vaca
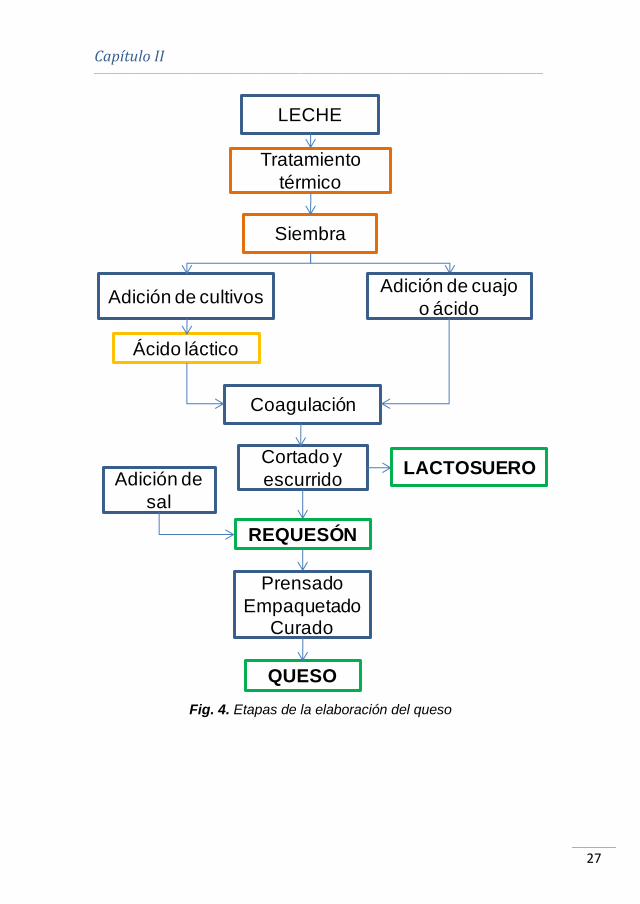
En la actualidad, la leche se somete a distintos procesos para dar
lugar a una gran variedad de productos lácteos derivados. Uno de los
más importantes, es el queso. La Fig. 4 recoge las principales etapas
del proceso de elaboración de queso a partir de los componentes de
la leche (Chandan y Kilara, 2011). Durante la producción de queso se
genera uno de los subproductos más importantes de la industria
láctea: el lactosuero. Éste puede definirse como el producto líquido
generado tras la separación de la cuajada durante la elaboración del
queso y de la caseína. Por cada kg de queso producido, se estima
que se generan 9 kg de lactosuero líquido. Éste representa
Grasa3.82%
Agua87.40%
Grasa3.82%
Proteínas3.25%
Lactosa4.80%
Minerales0.70%
VitaminasCompuestos nitrogenados
0.03%
Agua87.40%
Proteínas3.25%
Lactosa4.80%
Minerales0.70%
Vitaminas/NNP0.03%

Antecedentes ________________________________________________________________________________________________________________________________________________________
26
aproximadamente, el 85 % del volumen de la leche y contiene cerca
del 55 % de sus nutrientes, con una demanda biológica de oxígeno
(DBO) de 35000 mg O2/L y un valor de demanda química de oxígeno
(DQO) mayor de 60000 mg O2/L (Acevedo Correa, 2010). Debido al
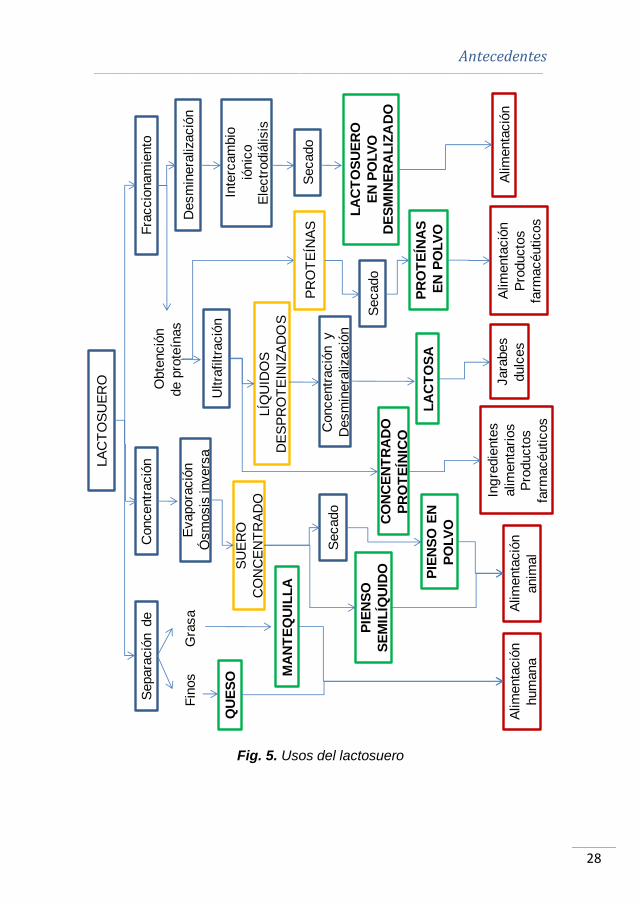
negativo impacto ambiental que puede producir su descarga y a sus
potenciales aplicaciones, el lactosuero se ha convertido en un
subproducto de alto valor añadido. La Fig. 5 recoge algunos de los
principales usos del lactosuero y de los productos que de él se
derivan (Madrid Vicente, 1981).
El aspecto general del lactosuero es un líquido de color amarillo
verdoso con un alto contenido en azúcares, proteínas, sales
minerales, vitaminas y trazas de materia grasa.
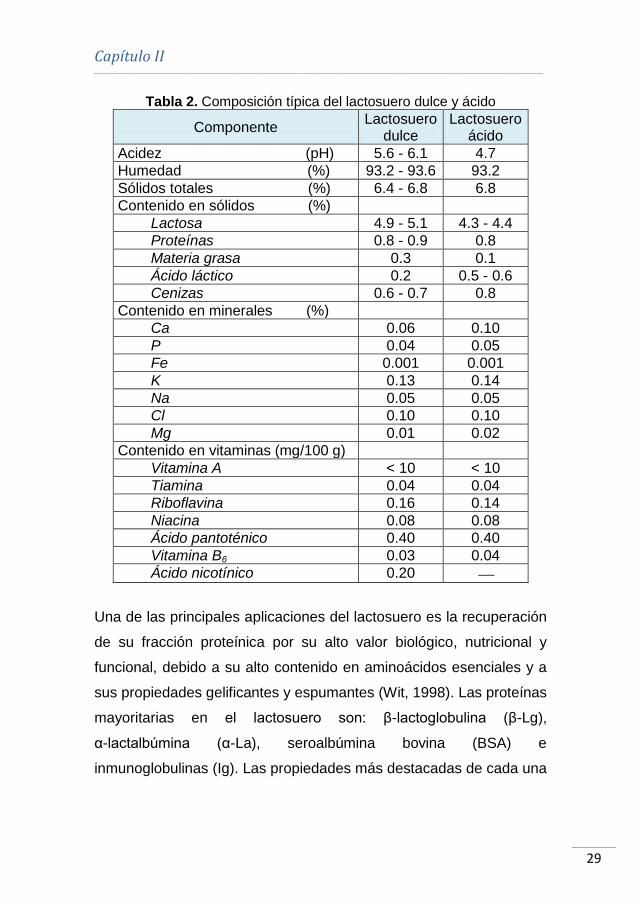
En función del proceso de obtención de la cuajada, es decir, del tipo
de coagulación que dará lugar al queso, pueden diferenciarse dos
tipos de lactosuero: dulce y ácido. La composición típica de cada uno
de ellos se muestra en la Tabla 2 (Goulas y Grandison, 2008).
Lactosuero dulce: se obtiene utilizando enzimas de tipo
cuajo para precipitar la caseína, como por ejemplo, en el
queso Cheddar. Es el más abundante a nivel industrial.
Lactosuero ácido: se produce durante la producción de
quesos de coagulación ácida (o por acidificación), como en el
caso del queso Cottage. Debido a la fermentación del ácido
láctico, éste tipo de lactosuero contiene una mayor cantidad
de sales minerales, como fósforo y calcio.
Capítulo II ________________________________________________________________________________________________________________________________________________________
27
Fig. 4. Etapas de la elaboración del queso
LECHE
Tratamiento
térmico
Adición de cultivos
Ácido láctico
Coagulación
Cortado y
escurrido
Adición de cuajo
o ácido
LACTOSUERO
REQUESÓN
Prensado
Empaquetado Curado
QUESO
Adición de
sal
Siembra
Antecedentes ________________________________________________________________________________________________________________________________________________________
28
Fig. 5. Usos del lactosuero
Separa
ció
n de
LA
CT
OS
UE
RO
Gra
sa
Concentr
ació
nF
raccio
nam
iento
Fin
os
QU
ES
O MA
NT
EQ
UIL
LA
Evapora
ció
n
Ósm
osis
invers
a
SU
ER
O
CO
NC
EN
TR
AD
O
PIE
NS
O
SE
MIL
ÍQU
IDO
Secado
PIE
NS
O E
N
PO
LV
O
Obte
nció
n
de p
rote
ínas
Desm
inera
lizació
n
Inte
rcam
bio
iónic
o
Ele
ctr
odiá
lisis
Ultra
filtra
ció
n
CO
NC
EN
TR
AD
O
PR
OT
EÍN
ICO
LÍQ
UID
OS
DE
SP
RO
TE
INIZ
AD
OS
PR
OT
EÍN
AS
LA
CT
OS
UE
RO
EN
PO
LV
O
DE
SM
INE
RA
LIZ
AD
O
PR
OT
EÍN
AS
EN
PO
LV
O
Concentr
ació
n y
Desm
inera
lizació
n
LA
CT
OS
A
Secado
Jara
bes
dulc
es
Ing
redie
nte
s
alim
enta
rios
Pro
ducto
s
farm
acéuticos
Alim
enta
ció
nA
lim
enta
ció
n
Pro
ducto
s
farm
acéuticos
Alim
enta
ció
n
hum
ana
Alim
enta
ció
n
anim
al
Secado
Capítulo II ________________________________________________________________________________________________________________________________________________________
29
Tabla 2. Composición típica del lactosuero dulce y ácido
Componente Lactosuero
dulce Lactosuero
ácido
Acidez (pH) 5.6 - 6.1 4.7
Humedad (%) 93.2 - 93.6 93.2
Sólidos totales (%) 6.4 - 6.8 6.8
Contenido en sólidos (%)
Lactosa 4.9 - 5.1 4.3 - 4.4
Proteínas 0.8 - 0.9 0.8
Materia grasa 0.3 0.1
Ácido láctico 0.2 0.5 - 0.6
Cenizas 0.6 - 0.7 0.8
Contenido en minerales (%)
Ca 0.06 0.10
P 0.04 0.05
Fe 0.001 0.001
K 0.13 0.14
Na 0.05 0.05
Cl 0.10 0.10
Mg 0.01 0.02
Contenido en vitaminas (mg/100 g)
Vitamina A < 10 < 10
Tiamina 0.04 0.04
Riboflavina 0.16 0.14
Niacina 0.08 0.08
Ácido pantoténico 0.40 0.40
Vitamina B6 0.03 0.04
Ácido nicotínico 0.20
Una de las principales aplicaciones del lactosuero es la recuperación
de su fracción proteínica por su alto valor biológico, nutricional y
funcional, debido a su alto contenido en aminoácidos esenciales y a
sus propiedades gelificantes y espumantes (Wit, 1998). Las proteínas
mayoritarias en el lactosuero son: β-lactoglobulina (β-Lg),
α-lactalbúmina (α-La), seroalbúmina bovina (BSA) e
inmunoglobulinas (Ig). Las propiedades más destacadas de cada una
Antecedentes ________________________________________________________________________________________________________________________________________________________
30
de ellas se muestran en la Tabla 3 (Cayot y Lorient, 1997; Edwards y
Jameson, 2014).
β-lactoglobulina: pertenece a la familia de las lipocalinas,
debido a la habilidad para unirse a moléculas hidrofóbicas
pequeñas. Existen diversas variantes de la β-Lg bovina,
siendo las más conocidas β-LgA y β-LgB. Dichas variantes se
diferencian en dos aminoácidos. La estructura cuaternaria de
la proteína varía entre los monómeros, dímeros y oligómeros
en función del pH, la temperatura y la fuerza iónica; aunque la
forma prevalente es la dímera. Esta diferente asociación se
debe al equilibrio entre las interacciones hidrofóbicas,
electrostáticas y por puentes de hidrógeno.
α-lactalbúmina: se encuentra en la leche de todos los
mamíferos. En el caso de la α-La bovina, la forma holo de
dicha proteína se combina con los iones Ca2+, siendo esta
forma la más abundante en la leche. Además, es uno de los
componentes reguladores del complejo lactosa sintasa,
encargado de transferir galactosa a glucosa.
Seroalbúmina bovina: es un constituyente tanto del suero
sanguíneo como de la leche de todos los mamíferos. Actúa
como transportador de moléculas hidrofóbicas. Además, la
BSA del suero sanguíneo juega un papel importante en el
control de las propiedades de reducción-oxidación de
compuestos (redox). Aunque no se ha especificado este
mismo comportamiento en el caso de la BSA de la leche, se
considera que podría afectar a las propiedades
organolépticas de la misma.
Capítulo II ________________________________________________________________________________________________________________________________________________________
31
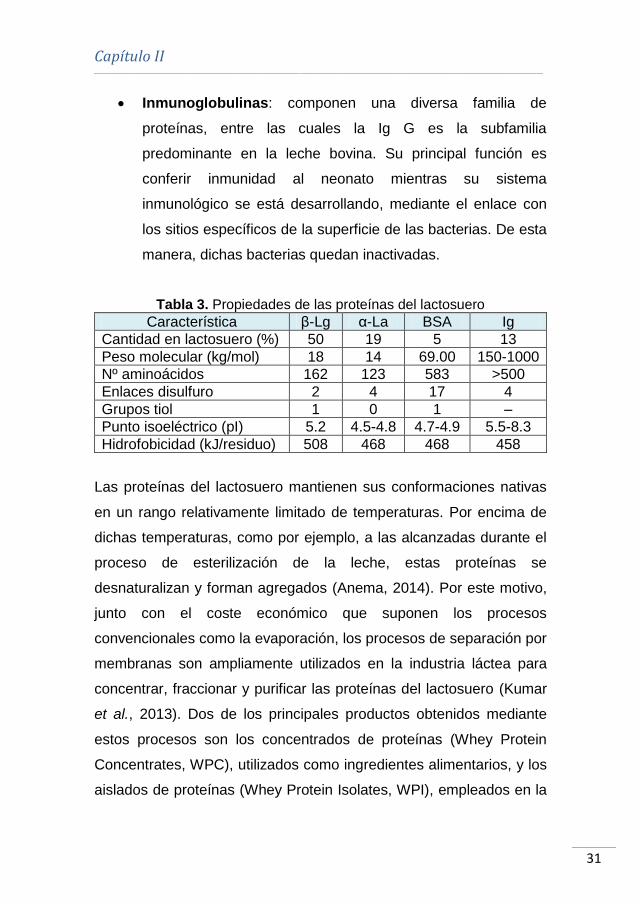
Inmunoglobulinas: componen una diversa familia de
proteínas, entre las cuales la Ig G es la subfamilia
predominante en la leche bovina. Su principal función es
conferir inmunidad al neonato mientras su sistema
inmunológico se está desarrollando, mediante el enlace con
los sitios específicos de la superficie de las bacterias. De esta
manera, dichas bacterias quedan inactivadas.
Tabla 3. Propiedades de las proteínas del lactosuero
Característica β-Lg α-La BSA Ig
Cantidad en lactosuero (%) 50 19 5 13
Peso molecular (kg/mol) 18 14 69.00 150-1000
Nº aminoácidos 162 123 583 >500
Enlaces disulfuro 2 4 17 4
Grupos tiol 1 0 1 ‒
Punto isoeléctrico (pI) 5.2 4.5-4.8 4.7-4.9 5.5-8.3
Hidrofobicidad (kJ/residuo) 508 468 468 458
Las proteínas del lactosuero mantienen sus conformaciones nativas
en un rango relativamente limitado de temperaturas. Por encima de
dichas temperaturas, como por ejemplo, a las alcanzadas durante el
proceso de esterilización de la leche, estas proteínas se
desnaturalizan y forman agregados (Anema, 2014). Por este motivo,
junto con el coste económico que suponen los procesos
convencionales como la evaporación, los procesos de separación por
membranas son ampliamente utilizados en la industria láctea para
concentrar, fraccionar y purificar las proteínas del lactosuero (Kumar
et al., 2013). Dos de los principales productos obtenidos mediante
estos procesos son los concentrados de proteínas (Whey Protein
Concentrates, WPC), utilizados como ingredientes alimentarios, y los
aislados de proteínas (Whey Protein Isolates, WPI), empleados en la
Antecedentes ________________________________________________________________________________________________________________________________________________________
32
preparación de productos de alto valor añadido, como proteínas
puras. La diferencia entre ambos productos radica en su contenido
proteico: la concentración de proteínas varía entre el 35 y el 80 % en
los WPC, mientras que en el caso de los WPI el contenido en
proteínas es mayor del 85 % en base seca (Lucena et al., 2006).
Capítulo II ________________________________________________________________________________________________________________________________________________________
33
2.2. PROCESOS DE SEPARACIÓN POR
MEMBRANAS
Una membrana es una barrera semipermeable y selectiva al paso de
distintas sustancias. De esta manera, la corriente de entrada al
proceso de separación por membranas (corriente alimento) se divide
en dos corrientes: aquella que contiene las sustancias que han
atravesado la membrana (permeado) y la corriente que contiene los
compuestos que han quedado retenidos sobre la membrana
(rechazo). Para que esta separación tenga lugar, las membranas se
ven sometidas a la acción de una fuerza impulsora: presión, presión
parcial, potencial eléctrico o concentración (Mulder, 2000; Baker,
2004).
Entre ellos, los procesos de membranas basados en un gradiente de
presión son los más utilizados a nivel industrial, por ejemplo, en las
industrias alimentaria, textil, tratamiento de agua para consumo
humano, desalación de agua del mar y salobre, etc. (Van der
Bruggen et al., 2003). En concreto en la industria alimentaria, este
tipo de procesos representan el 20-30 % de los 250 millones de
euros de facturación de membranas utilizadas a nivel industrial,
donde las mayores aplicaciones se encuentran en la industria láctea
(procesos de concentración y purificación de proteínas del
lactosuero, desmineralización de lactosuero, estandarización y
concentración de la leche), seguida de la industria de bebidas
(estabilización de la cerveza y el vino para prevenir la
descomposición microbiana, eliminación de coloides y levaduras,
Antecedentes ________________________________________________________________________________________________________________________________________________________
34
purificación y concentración de zumos) y de los productos derivados
del huevo (Daufin et al., 2001; Hinková et al., 2005).
La implantación de los procesos de separación por membranas en
las últimas décadas se ha incrementado debido, principalmente, a
dos importantes ventajas de este tipo de procesos (Daufin et al.,
2001):
Desde el punto de vista medioambiental, los procesos de
membranas se consideran “procesos limpios”, puesto que no
utilizan otros compuestos auxiliares (como por ejemplo,
disolventes). Además, permiten la recuperación de fracciones
de alto valor añadido durante el tratamiento de efluentes y
aguas residuales.
Desde el punto de vista económico, comparados con los
procesos tradicionales de concentración (procesos térmicos)
y separación (decantación, centrifugación, etc.), los procesos
de membranas destacan por su facilidad de implementación y
automatización, flexibilidad (sistemas modulares) y carácter
compacto (m2 de membrana por m3 de alimentación).
Los procesos de separación de membranas basados en un gradiente
de presión pueden clasificarse en cuatro tipos, dependiendo del
tamaño de poro de las membranas, el intervalo de presión
transmembranal aplicada y las sustancias rechazadas, de acuerdo
con la Tabla 4 y la Fig. 6: microfiltración (MF), ultrafiltración (UF),
nanofiltración (NF) y ósmosis inversa (OI) (Van der Bruggen et al.,
2003).
Capítulo II ________________________________________________________________________________________________________________________________________________________
35
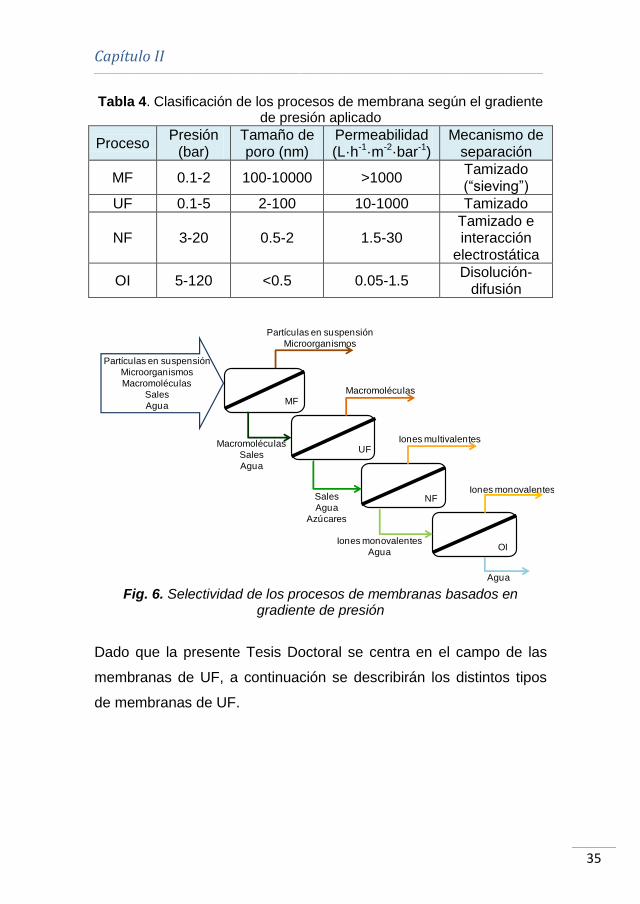
Tabla 4. Clasificación de los procesos de membrana según el gradiente de presión aplicado
Proceso Presión
(bar) Tamaño de poro (nm)
Permeabilidad (L·h-1·m-2·bar-1)
Mecanismo de separación
MF 0.1-2 100-10000 >1000 Tamizado (“sieving”)
UF 0.1-5 2-100 10-1000 Tamizado
NF 3-20 0.5-2 1.5-30 Tamizado e interacción
electrostática
OI 5-120 <0.5 0.05-1.5 Disolución-
difusión
Fig. 6. Selectividad de los procesos de membranas basados en
gradiente de presión
Dado que la presente Tesis Doctoral se centra en el campo de las
membranas de UF, a continuación se describirán los distintos tipos
de membranas de UF.
MF
NF
OI
Partículas en suspensión
Microorganismos
Macromoléculas
Sales
Agua
Partículas en suspensión
Microorganismos
Iones multivalentesUF
Macromoléculas
Agua
Macromoléculas
Sales
Agua
Sales
Agua
Azúcares
Iones monovalentes
Agua
Iones monovalentes

Antecedentes ________________________________________________________________________________________________________________________________________________________
36
2.2.1. Ultrafiltración
La UF es el proceso de membranas más ampliamente utilizado.
Originalmente, se desarrolló para tratar aguas residuales, eliminando
las partículas de mayor tamaño que contenían (Shon et al., 2004). En
la actualidad, son numerosos los ámbitos industriales en los que las
membranas de UF se aplican: tratamiento de aguas residuales
procedentes del procesado de aceitunas (El-Abassi et al., 2014),
producción de agua potable (Gao et al., 2011), clarificación de zumos
de frutas (Ruby Figueroa et al., 2011), concentración de proteínas del
lactosuero (Arunkumar y Etzel, 2015), concentración de tinta
procedente de aguas residuales de procesos de impresión (Lipnizki,
2008), etc.
Básicamente, las membranas de UF consisten en una capa fina que
permite el paso selectivo de sustancias a través de la membrana
(capa activa) unida a un soporte más grueso y de mayor porosidad
que la capa activa que favorece la permeabilidad de dichas
sustancias. Las membranas con este tipo de configuración reciben el
nombre de membranas asimétricas o anisotrópicas (Baker, 2004). En
función del material del que está constituida la membrana, éstas
pueden clasificarse en dos tipos:
Orgánicas: están formadas por polímeros, entre los que
destacan polisulfona, poliétersulfona, poliacrilonitrilo,
poliimida, poliéterimida, acetato de celulosa, etc. La elección
de este polímero dependerá de las características finales
deseadas en la membrana, como hidrofilicidad/hidrofobicidad
y resistencia química y térmica (Mulder, 2000).
Capítulo II ________________________________________________________________________________________________________________________________________________________
37
Inorgánicas: están compuestas principalmente por óxidos de
aluminio, titanio o silicio. A diferencia de las membranas
orgánicas, las membranas inorgánicas son químicamente
inertes y presentan una alta resistencia térmica, mecánica y
química. Esta elevada estabilidad favorece la utilización de
estas membranas en aplicaciones alimentarias,
biotecnológicas y farmacéuticas, donde los procesos de
limpieza y esterilización (mediante vapor o agentes agresivos,
como los compuestos clorados) se realizan repetidamente
(Baker, 2004).
Atendiendo a la configuración de las membranas en un módulo,
éstas pueden clasificarse en distintos tipos (Mulder, 2000):
Planas: en este tipo de módulos, las membranas se colocan
en una configuración tipo “sándwich”, en la cual se coloca un
espaciador entre las membranas para permitir el paso de la
corriente alimento. La densidad de empaquetamiento, es
decir, el ratio área de membrana por volumen de módulo, es
de aproximadamente 100-400 m2·m-3.
Arrollamiento en espiral: a partir de la configuración de las
membranas dentro de un módulo plano, la configuración de
arrollamiento en espiral consiste básicamente en enrollar
alrededor de un tubo colector de permeado, las membranas
planas y los correspondientes espaciadores. De esta manera,
el espaciador actúa además como un promotor de
turbulencias. La densidad de empaquetamiento en este tipo
de membranas es de 300-1000 m2·m-3, por lo que, debido a
Antecedentes ________________________________________________________________________________________________________________________________________________________
38
su carácter compacto, son uno de los tipos de módulos más
utilizados a nivel industrial.
Tubulares: generalmente, las membranas tubulares
presentan un diámetro de al menos, 10 mm. Pueden
colocarse dentro de un módulo de membranas en número
variable, desde 1 hasta 18, aproximadamente. Existen
diferentes configuraciones de membranas tubulares, en
función del número de canales en el interior del tubo. En este
caso, la corriente alimento circula por el interior de las
membranas tubulares. El principal inconveniente de este tipo
de configuración es su baja densidad de empaquetamiento,
menor de 300 m2·m-3. Sin embargo, dada su baja tendencia al
ensuciamiento y a su facilidad de limpieza, sobretodo en el
caso de las membranas tubulares cerámicas, son la
configuración más utilizada en la industria láctea.
Capilares y de fibra hueca: la configuración de estas
membranas es similar a las membranas tubulares. Sin
embargo, las principales diferencias radican en el menor
tamaño de las membranas capilares y de fibra hueca y en que
no necesitan ubicarse dentro de un módulo que actúe de
soporte. En este tipo de membranas, la alimentación puede
circular en dos sentidos diferentes: desde el interior del
capilar (“lumen side”) hacia el exterior o bien desde el exterior
del capilar (“shell side”) hacia el interior. La densidad de
empaquetamiento se encuentra, en el caso de las
membranas capilares, alrededor de 600-1200 m2·m-3;
mientras que las membranas de fibra hueca presentan la
Capítulo II ________________________________________________________________________________________________________________________________________________________
39
densidad de empaquetamiento más elevada (hasta
30000 m2·m-3).
A pesar de las numerosas ventajas que ofrece la implantación de los
procesos de separación por membranas en la industria, y en
particular de las membranas de UF en la industria alimentaria, estas
membranas presentan un principal inconveniente: la disminución de
la densidad de flujo de permeado durante el tiempo de operación
debido al ensuciamiento sufrido por las membranas. Este efecto
conlleva una reducción de la producción global del proceso, así como
un aumento de los costes de mantenimiento y limpieza (Zydney et
al., 2003). En el siguiente apartado se detallarán los tipos de
ensuciamiento que pueden producirse, sus causas y las posibles
técnicas para reducirlo y predecirlo.
Antecedentes ________________________________________________________________________________________________________________________________________________________
40
2.3. ENSUCIAMIENTO DE MEMBRANAS Y
MODELOS MATEMÁTICOS
Como se ha comentado anteriormente en este Capítulo, las
membranas de UF son muy utilizadas en la industria alimentaria en
general, y en la industria láctea en particular, en distintas
aplicaciones como la concentración de la leche y la purificación,
concentración y fraccionamiento de proteínas del lactosuero (Nigam
et al., 2008; Kazemimoghadam y Mohammadi, 2007). Durante estos
procesos, las membranas se ensucian debido, principalmente, a las
proteínas presentes en la leche y en el lactosuero, las cuales son
retenidas por la membrana.
El fenómeno de ensuciamiento viene determinado por las
interacciones entre las moléculas de suciedad y entre dichas
moléculas y la superficie de la membrana. La magnitud de estas
interacciones depende de las condiciones de operación del proceso
de UF, como la velocidad tangencial, la presión transmembranal, la
composición de la corriente alimento o la temperatura (Wang et al.,
2012). Por un lado, existe una repulsión electrostática entre las
distintas moléculas de ensuciamiento, dado que para un determinado
valor de pH, todas poseen la misma carga superficial. En el caso de
las proteínas más abundantes presentes en el lactosuero (α-La, β-Lg
y BSA), dicha carga es negativa a pH neutro. La repulsión
electrostática será menor cuanto más cercano sea el pH de la
disolución al punto isoeléctrico (pI) de las sustancias en disolución,
Capítulo II ________________________________________________________________________________________________________________________________________________________
41
valor de pH en el que la carga superficial de dichas sustancias es
cero (Huisman et al., 2000). Además, en el caso en el que las
membranas presenten la misma carga superficial que la de las
moléculas de suciedad, la repulsión electrostática también tendrá
lugar en la superficie de la membrana y dichas moléculas,
disminuyendo la adsorción de las mismas sobre la membrana. Por
otra parte, cuando la estructura química de los grupos funcionales es
similar entre la membrana y las moléculas de suciedad, puede
producirse una interacción hidrofóbica/hidrofílica, en función de la
naturaleza de dichos grupos (Liu et al., 2000). Por consiguiente, el
mayor o menor ensuciamiento producido en las membranas será
resultado de un balance de fuerzas entre la repulsión electrostática y
las interacciones hidrofóbicas/hidrofílicas.
Además del fenómeno de ensuciamiento propiamente dicho, durante
el proceso de UF tiene lugar una acumulación de las moléculas de
soluto que constituyen la corriente alimento en las proximidades de la
superficie de la membrana (capa límite). Este hecho se conoce con el
nombre de polarización por concentración y está principalmente
causado por las limitaciones inherentes al proceso de transferencia
de materia, es decir, la causa radica en fenómenos hidrodinámicos y
difusivos. El aumento de concentración de soluto en las
inmediaciones de la membrana como consecuencia de la
polarización por concentración puede dar lugar a la formación de una
capa gel sobre la superficie de la membrana (Zhao et al., 2000). La
Fig. 7 muestra una representación esquemática del proceso de
polarización por concentración y de la formación de capa gel (Baker,
2004).
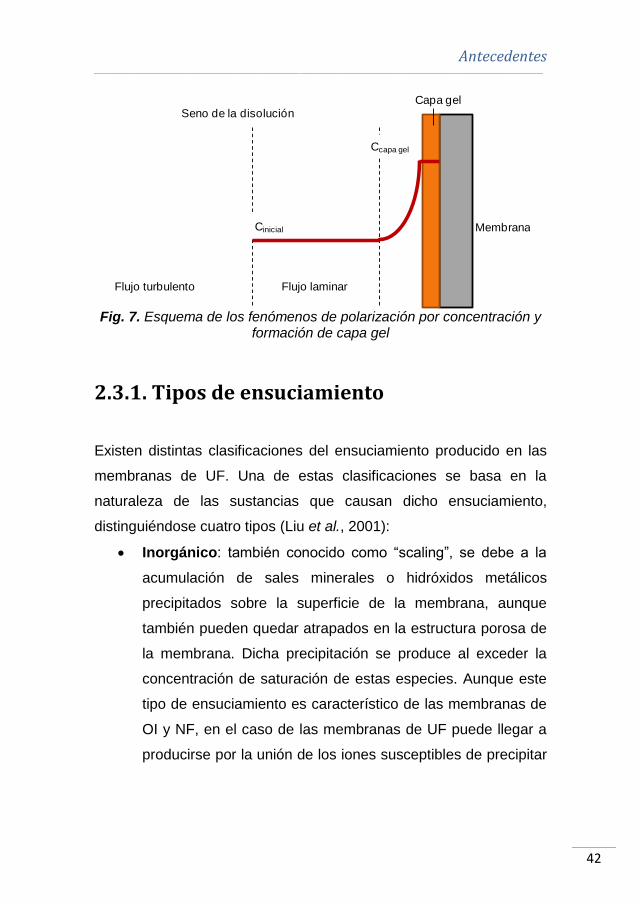
Antecedentes ________________________________________________________________________________________________________________________________________________________
42
Fig. 7. Esquema de los fenómenos de polarización por concentración y
formación de capa gel
2.3.1. Tipos de ensuciamiento
Existen distintas clasificaciones del ensuciamiento producido en las
membranas de UF. Una de estas clasificaciones se basa en la
naturaleza de las sustancias que causan dicho ensuciamiento,
distinguiéndose cuatro tipos (Liu et al., 2001):
Inorgánico: también conocido como “scaling”, se debe a la
acumulación de sales minerales o hidróxidos metálicos
precipitados sobre la superficie de la membrana, aunque
también pueden quedar atrapados en la estructura porosa de
la membrana. Dicha precipitación se produce al exceder la
concentración de saturación de estas especies. Aunque este
tipo de ensuciamiento es característico de las membranas de
OI y NF, en el caso de las membranas de UF puede llegar a
producirse por la unión de los iones susceptibles de precipitar
Flujo turbulento Flujo laminar
Seno de la disoluciónCapa gel
MembranaCinicial
Ccapa gel
Capítulo II ________________________________________________________________________________________________________________________________________________________
43
con otros agentes de ensuciamiento, lo que provoca la
precipitación y acumulación de los primeros (Shirazi et al.,
2010).
Orgánico: se produce durante el tratamiento de corrientes
con un alto contenido en materia orgánica, como por ejemplo,
en el tratamiento de disoluciones propias de la industria
láctea. En este caso, las proteínas presentes en dichas
disoluciones pueden acumularse sobre la superficie de la
membrana e incluso, penetrar en su estructura porosa. Otras
corrientes que pueden causar ensuciamiento severo de tipo
orgánico sobre las membranas son las que contienen ácido
húmico (Hong y Elimelech, 1997).
Coloidal: las partículas causantes de este tipo de
ensuciamiento pueden ser de origen orgánico, inorgánico o
mixto. Su acumulación sobre la superficie de la membrana
provoca un ensuciamiento que puede ser fácilmente
eliminado mediante procesos de limpieza hidráulicos, como
por ejemplo, “backflushing”. Sin embargo, en el caso de que
el tamaño de los coloides sea menor que el tamaño de poro
de la membrana, éstos pueden penetrar en la estructura
porosa de la misma. En este último caso, serían necesarios
protocolos de limpieza más agresivos para eliminar el
ensuciamiento coloidal (Kwon et al., 2006).
Microbiano: como su nombre indica, consiste en el
ensuciamiento producido por la acumulación de bacterias y
otros microorganismos en la superficie de la membrana.
Estos microorganismos generan diversas sustancias
extracelulares que los protegen en cierta medida de los

Antecedentes ________________________________________________________________________________________________________________________________________________________
44
compuestos químicos utilizados durante las etapas de
limpieza. Este tipo de ensuciamiento es especialmente
importante en la industria láctea, donde, para evitarlo, los
protocolos de limpieza incluyen etapas de desinfección
utilizando, por ejemplo, compuestos clorados (D’Souza y
Mawson, 2005).
Otra posible clasificación del ensuciamiento de las membranas
atiende a la facilidad con la que el mismo puede ser eliminado. En
otras palabras, está relacionado con el lugar en la que las partículas
se acumulan y los métodos para eliminarlos (Fig. 8). Así, el
ensuciamiento puede clasificarse en (Baker, 2004):
Reversible: se debe generalmente a la deposición superficial
de moléculas de suciedad sobre la superficie de la
membrana. Este tipo de ensuciamiento puede ser controlado
mediante el uso de altas velocidades tangenciales o
promotores de turbulencia y utilizando membranas con carga
contraria a la carga superficial de las moléculas de suciedad,
de manera que se minimicen las fuerzas de adhesión
molécula-membrana. Los métodos de limpieza físicos, como
la aireación o el contralavado (“backwashing”) son suficientes
para eliminar el ensuciamiento reversible.
Irreversible: aunque también puede incluir el ensuciamiento
provocado por las moléculas más fuertemente adsorbidas
sobre la superficie de la membrana, el ensuciamiento
irreversible está principalmente causado por partículas de
menor tamaño que los poros de la membrana y que penetran
en el interior de la estructura porosa de la misma. Para
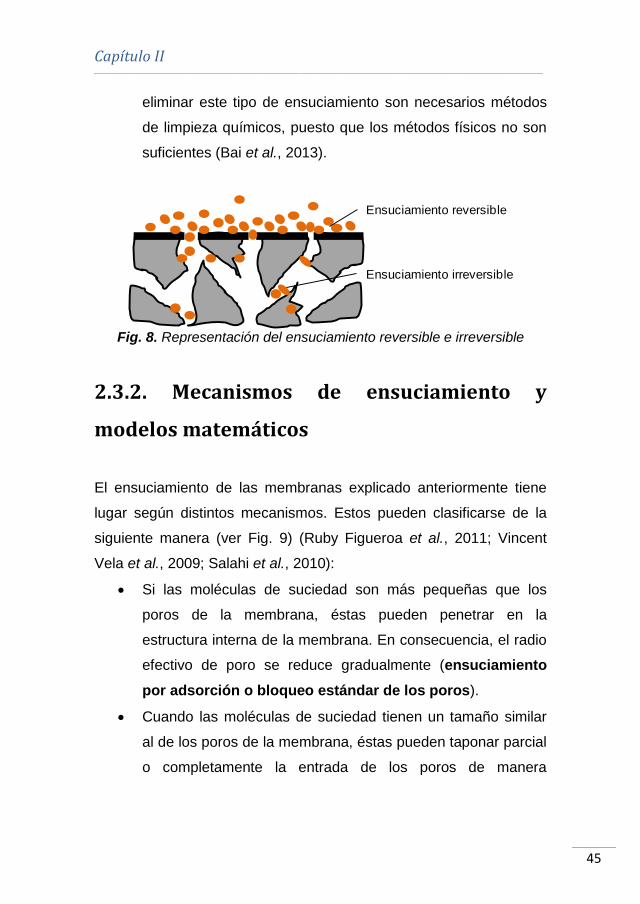
Capítulo II ________________________________________________________________________________________________________________________________________________________
45
eliminar este tipo de ensuciamiento son necesarios métodos
de limpieza químicos, puesto que los métodos físicos no son
suficientes (Bai et al., 2013).
Fig. 8. Representación del ensuciamiento reversible e irreversible
2.3.2. Mecanismos de ensuciamiento y
modelos matemáticos
El ensuciamiento de las membranas explicado anteriormente tiene
lugar según distintos mecanismos. Estos pueden clasificarse de la
siguiente manera (ver Fig. 9) (Ruby Figueroa et al., 2011; Vincent
Vela et al., 2009; Salahi et al., 2010):
Si las moléculas de suciedad son más pequeñas que los
poros de la membrana, éstas pueden penetrar en la
estructura interna de la membrana. En consecuencia, el radio
efectivo de poro se reduce gradualmente (ensuciamiento
por adsorción o bloqueo estándar de los poros).
Cuando las moléculas de suciedad tienen un tamaño similar
al de los poros de la membrana, éstas pueden taponar parcial
o completamente la entrada de los poros de manera
Ensuciamiento reversible
Ensuciamiento irreversible
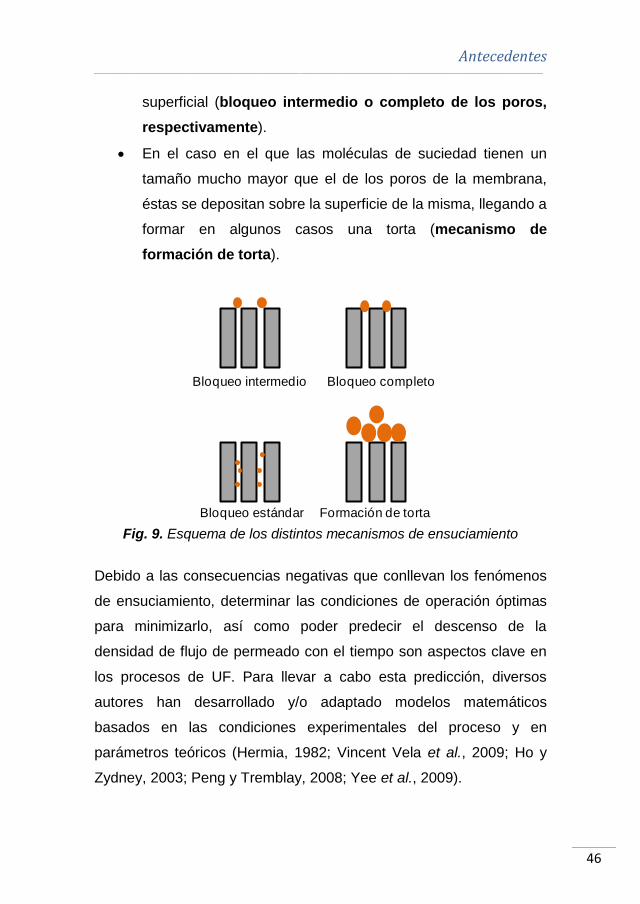
Antecedentes ________________________________________________________________________________________________________________________________________________________
46
superficial (bloqueo intermedio o completo de los poros,
respectivamente).
En el caso en el que las moléculas de suciedad tienen un
tamaño mucho mayor que el de los poros de la membrana,
éstas se depositan sobre la superficie de la misma, llegando a
formar en algunos casos una torta (mecanismo de
formación de torta).
Fig. 9. Esquema de los distintos mecanismos de ensuciamiento
Debido a las consecuencias negativas que conllevan los fenómenos
de ensuciamiento, determinar las condiciones de operación óptimas
para minimizarlo, así como poder predecir el descenso de la
densidad de flujo de permeado con el tiempo son aspectos clave en
los procesos de UF. Para llevar a cabo esta predicción, diversos
autores han desarrollado y/o adaptado modelos matemáticos
basados en las condiciones experimentales del proceso y en
parámetros teóricos (Hermia, 1982; Vincent Vela et al., 2009; Ho y
Zydney, 2003; Peng y Tremblay, 2008; Yee et al., 2009).
Bloqueo intermedio Bloqueo completo
Bloqueo estándar Formación de torta
Capítulo II ________________________________________________________________________________________________________________________________________________________
47
Entre los distintos modelos matemáticos, los modelos empíricos son
capaces de predecir los datos experimentales con una alta precisión.
Sin embargo, la ecuación general de estos modelos no considera
parámetros teóricos. Esto implica que la descripción teórica de los
fenómenos de ensuciamiento y sus mecanismos no está reflejada en
la ecuación general de estos modelos, por lo que la relación entre la
disminución de la densidad de flujo de permeado y los mecanismos
de ensuciamiento propios del proceso de UF no puede ser
completamente explicada. Un ejemplo de este tipo de modelos son
las ecuaciones obtenidas mediante análisis de regresión (Baranyi et
al., 1996). Por el contrario, los modelos completamente teóricos
contribuyen a la explicación de los fenómenos de ensuciamiento y
sus mecanismos durante el proceso de UF. Sin embargo, la precisión
del ajuste de estos modelos es menor al no considerar todas las
condiciones experimentales del propio proceso.
Por estas razones, los modelos semi-empíricos son los más
ampliamente utilizados, porque a partir de formas simplificadas de las
leyes científicas e incluyendo un cierto número de parámetros con
significado físico, son capaces de predecir con elevada precisión los
datos experimentales obtenidos y describir, simultáneamente, los
mecanismos de ensuciamiento que tienen lugar (Vincent Vela, 2009;
Mah et al., 2012).
Entre los distintos modelos matemáticos disponibles en la
bibliografía, los modelos semi-empíricos de Hermia (Hermia, 1982)
desarrollados para filtración convencional (“dead-end”) y la
adaptación de los mismo a filtración tangencial (“crossflow”) son los
Antecedentes ________________________________________________________________________________________________________________________________________________________
48
más ampliamente utilizados por distintos autores para ajustar los
datos experimentales obtenidos en diversos procesos de UF y
explicar los mecanismos de ensuciamiento producidos por diferentes
alimentaciones (Mohammadi y Esmaeelifar, 2005; Vincent Vela,
2009; Salahi et al., 2010; Kaya et al., 2010). Los modelos de Hermia
consideran cuatro mecanismos de ensuciamiento principales, que
coinciden con los mecanismos explicados anteriormente: bloqueo
completo, intermedio y estándar de poros y formación de torta. Las
hipótesis en las que se basa cada uno de estos mecanismos se
detallan en el Capítulo IV (Corbatón-Báguena et al., 2015).
A pesar de la precisión de su ajuste, los modelos de Hermia
proporcionan una ecuación matemática para cada mecanismo de
ensuciamiento diferente, sin considerar las posibles interacciones
entre distintos mecanismos. Sin embargo, de acuerdo con diversos
autores (Ho y Zydney, 2000; Nigam et al., 2008), la evolución de la
densidad de flujo de permeado con el tiempo puede dividirse en
varias etapas: durante los primeros minutos tiene lugar un descenso
rápido de la densidad de flujo de permeado causado por el fenómeno
de polarización por concentración (etapa 1); a continuación, la
densidad de flujo disminuye gradualmente debido al taponamiento
y/o bloqueo de los poros y a la aparición de una torta encima de la
superficie de la membrana (etapa 2); en la última etapa, la torta
formada aumenta su espesor, alcanzando finalmente el estado
estacionario (etapa 3) (ver Fig. 10).
Por este motivo, algunos autores combinaron ecuaciones
características de diferentes mecanismos de ensuciamiento en una
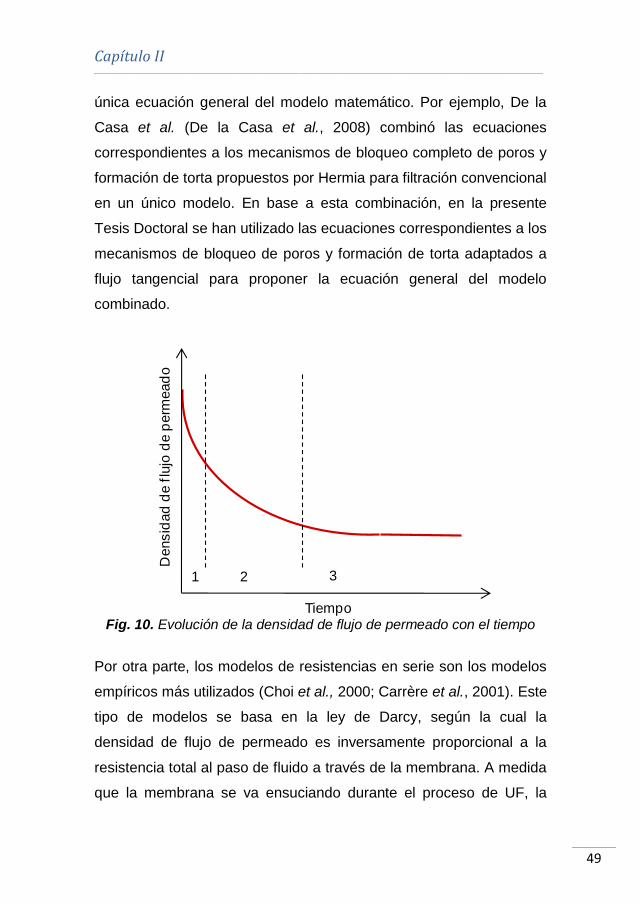
Capítulo II ________________________________________________________________________________________________________________________________________________________
49
única ecuación general del modelo matemático. Por ejemplo, De la
Casa et al. (De la Casa et al., 2008) combinó las ecuaciones
correspondientes a los mecanismos de bloqueo completo de poros y
formación de torta propuestos por Hermia para filtración convencional
en un único modelo. En base a esta combinación, en la presente
Tesis Doctoral se han utilizado las ecuaciones correspondientes a los
mecanismos de bloqueo de poros y formación de torta adaptados a
flujo tangencial para proponer la ecuación general del modelo
combinado.
Fig. 10. Evolución de la densidad de flujo de permeado con el tiempo
Por otra parte, los modelos de resistencias en serie son los modelos
empíricos más utilizados (Choi et al., 2000; Carrère et al., 2001). Este
tipo de modelos se basa en la ley de Darcy, según la cual la
densidad de flujo de permeado es inversamente proporcional a la
resistencia total al paso de fluido a través de la membrana. A medida
que la membrana se va ensuciando durante el proceso de UF, la
Tiempo
Densid
ad
de f
lujo
de p
erm
ead
o
1 2 3

Antecedentes ________________________________________________________________________________________________________________________________________________________
50
resistencia total puede expresarse como la suma de la resistencia
intrínseca de la membrana y de las diferentes resistencias asociadas
a cada uno de los mecanismos o fenómenos de ensuciamiento que
están teniendo lugar (adsorción, torta, irreversible, reversible, etc.).
La explicación detallada de cada uno de los modelos utilizados, así
como las ecuaciones generales de cada uno de ellos, se encuentra
en el Capítulo IV de esta Tesis.
Capítulo II ________________________________________________________________________________________________________________________________________________________
51
2.4. TÉCNICAS DE LIMPIEZA DE MEMBRANAS
Debido al ensuciamiento en las membranas, cada cierto tiempo éstas
deben acondicionarse para eliminar las moléculas de suciedad de la
superficie de la membrana y del interior de su estructura porosa y
recuperar las propiedades permselectivas de la misma (Blanpain-
Avet, 2009). En la industria alimentaria, los procesos de limpieza de
membranas de UF son una etapa fundamental del proceso global de
producción. En muchos casos, los protocolos de limpieza necesitan
llevarse a cabo todos los días, constituyendo más del 80 % de los
costes totales de producción (Almécija et al., 2009b). Por esta razón,
seleccionar los mejores protocolos de limpieza y las condiciones de
operación más adecuadas para optimizar el proceso de limpieza es
de gran importancia (Kazemimoghadam y Mohammadi, 2007). Sin
embargo, la elección de un protocolo de limpieza u otro viene
determinada por la localización del ensuciamiento (superficial, interno
en la estructura porosa, etc.), la composición de la alimentación, el
tipo de moléculas de suciedad depositadas sobre la superficie de la
membrana o en el interior de su estructura porosa (Cabero et al.,
1999).
2.4.1. Tipos de métodos de limpieza
Una clasificación básica de los métodos de limpieza de membranas
consiste en la división de dichos métodos en físicos y químicos. Los
métodos físicos están basados en la aplicación de esfuerzos
mecánicos para eliminar las partículas adsorbidas sobre la superficie

Antecedentes ________________________________________________________________________________________________________________________________________________________
52
de la membrana (ensuciamiento reversible) (Zhao et al., 2000). La
principal ventaja de estos métodos radica en que no utilizan reactivos
químicos, por lo que el impacto medioambiental de las aguas
residuales generadas en el proceso de limpieza es menor. Además,
son métodos más rápidos que los protocolos químicos, conllevando
una degradación menor de las membranas, aunque la eficacia de
limpieza alcanzada con este tipo de métodos es menor (Judd et al.,
2008). Algunos de los métodos físicos más importantes se describen
a continuación (Zhao et al., 2000):
Backflushing: es uno de los métodos físicos más utilizados
en la industria. Consiste en aplicar presión en el lado del
permeado, de manera que éste vuelva a atravesar la
membrana. La efectividad de este método depende no sólo
de la naturaleza del ensuciamiento, sino también de la
frecuencia e intensidad con la que se invierte el flujo de
permeado.
Aireación: como su nombre indica, este método se basa en
la introducción de aire de manera periódica, en el mismo
sentido de flujo que la corriente alimento. El aire permite el
debilitamiento de la capa de suciedad depositada sobre la
membrana. Este método se utiliza principalmente en
biorreactores de membrana (MBR) y en membranas de fibra
hueca (Wang et al., 2014).
Promotores de turbulencias: este método consiste en la
mejora de las condiciones hidrodinámicas en las
proximidades de la superficie de la membrana. De esta
manera, se incrementa el fenómeno de transferencia de

Capítulo II ________________________________________________________________________________________________________________________________________________________
53
materia a la vez que se reduce el fenómeno de polarización
por concentración. Este método físico es especialmente
importante en membranas de arrollamiento en espiral (Krstić
et al., 2002).
Ultrasonidos: este método de limpieza se fundamenta en el
fenómeno de cavitación, según el cual las burbujas de aire
formadas colapsan e implosionan. La efectividad de este
método depende de la potencia y frecuencia de los
ultrasonidos (Muthukumaran et al., 2004). Cuando los
ultrasonidos se aplican a un medio líquido (generalmente, la
corriente alimento), se producen ciclos de compresión y
expansión del medio. Durante el ciclo de compresión, las
micro burbujas colapsan, emitiendo energía, lo que permite la
limpieza de la membrana (Li et al., 2002). Otra manera de
aplicar la técnica de ultrasonidos consiste en instalar una
celda o módulo con la membrana en su interior dentro del
baño de ultrasonidos (Cai et al., 2010).
Campos eléctricos: aunque se detallará más adelante en
este mismo Capítulo, la limpieza mediante campos eléctricos
es una técnica novedosa comenzada a aplicar en los últimos
años. Se basa en la diferente carga que presentan las
proteínas y la membrana en un determinado intervalo de pH.
Al aplicar un campo eléctrico, las partículas con carga
opuesta (moléculas de suciedad) son atraídas hacia uno de
los electrodos, generalmente colocado en el seno de la
disolución alimento, pudiendo eliminarse de la superficie de la
membrana (Tarazaga et al., 2006).

Antecedentes ________________________________________________________________________________________________________________________________________________________
54
Por otra parte, los métodos químicos de limpieza de membranas son
los más utilizados a nivel industrial por su mayor eficacia respecto a
los métodos de limpieza físicos (Kazemimoghadam y Mohammadi,
2007). Los métodos químicos se basan en la acción específica de un
determinado reactivo químico sobre las partículas de suciedad
adsorbidas tanto en la superficie de la membrana como en su
estructura interna. Por tanto, este tipo de métodos resulta
especialmente eficaz para eliminar el ensuciamiento irreversible
ocasionado en las membranas. La mayoría de estos métodos
incluyen agentes químicos como ácidos, álcalis, surfactantes,
desinfectantes o combinaciones de ellos, causando reacciones de
hidrólisis, peptización, saponificación y solubilización, entre otras
(Chen et al., 2003). A continuación se detallan cada uno de estos
agentes químicos:
Álcalis: son el grupo de agentes químicos de limpieza más
ampliamente utilizados, destacando los hidróxidos, silicatos,
carbonatos, bicarbonatos, orto y metasilicatos de sodio. Son
especialmente efectivos en la eliminación de materia
orgánica, debido a las reacciones de hidrólisis y solubilización
que se producen al aumentar la carga orgánica del
compuesto a eliminar por efecto del incremento del pH de la
disolución (Ang et al., 2006).
Ácidos: utilizados principalmente cuando el ensuciamiento de
las membranas se debe a especies de naturaleza inorgánica,
entre los ácidos más utilizados destacan los ácidos nítrico,
fosfórico y cítrico (Blanpain-Avet et al., 2009; Woo et al.,
2015).
Capítulo II ________________________________________________________________________________________________________________________________________________________
55
Surfactantes o tensioactivos: son compuestos con grupos
hidrofóbicos e hidrofílicos utilizados para mejorar la
mojabilidad de especies poco solubles en agua y así, poder
eliminar estas especies de la membrana. Al ser menos
agresivos que los álcalis y los ácidos, se suelen aplicar en
membranas que presentan limitaciones de pH. Su mecanismo
de actuación se basa en la difusión desde el seno de la
disolución de limpieza hasta la capa de ensuciamiento y la
posterior solubilización de las moléculas de suciedad
adheridas a la membrana mediante la formación de micelas
alrededor de dichas moléculas (Naim et al., 2012; Suárez et
al., 2012).
Agentes complejantes: estos agentes químicos rompen la
estructura de la capa de ensuciamiento mediante su enlace
con los cationes divalentes (como el catión Ca+2) presentes
en dicha capa, que actúan como agentes de
entrecruzamiento de las moléculas orgánicas. Uno de los
agentes complejantes más utilizado es el ácido
etilendiaminotetraacético (EDTA) (Hong y Elimelech, 1997;
Ang et al., 2011).
Enzimas: estos agentes biológicos son de especial
importancia en el caso de membranas con baja resistencia
térmica, química o de pH, debido a la capacidad de las
enzimas para llevar a cabo la limpieza de las membranas en
unas condiciones de operación más suaves (Argüello et al.,
2003). Entre sus principales ventajas destacan el menor
consumo energético (por la operación a temperaturas suaves)
e impacto ambiental (puesto que son compuestos
Antecedentes ________________________________________________________________________________________________________________________________________________________
56
biodegradables). Sin embargo, presentan como principal
inconveniente el hecho de que sólo actúan sobre cierto tipos
de ensuciamiento.
Desinfectantes: en el caso en que pueda ocurrir el
crecimiento de microorganismos en la membrana, se utilizan
agentes desinfectantes, entre los que destaca el hipoclorito
de sodio (Paugam et al., 2010). Sin embargo, este tipo de
agentes no puede utilizarse en membranas sensibles a altas
concentraciones de cloro o pH.
En el caso de la industria alimentaria, en particular en la industria
láctea, diversos autores (Almécija et al., 2009a; Almécija et al.,
2009b) proponen el mismo protocolo de limpieza química de
membranas: en primer lugar, se realiza una limpieza con álcalis,
seguida de un aclarado para eliminar los restos de agente de
limpieza. A continuación, se lleva a cabo una etapa de limpieza
ácida, seguida de su correspondiente aclarado. Finalmente, si las
características permselectivas de la membrana no coinciden con las
que presentaba la membrana originalmente, se recomienda realizar
una tercera etapa de limpieza utilizando surfactantes o
desinfectantes, como hipoclorito sódico o sodio dodecil sulfato.
La efectividad de este protocolo de limpieza química depende, en
gran medida, de las condiciones de operación aplicadas durante el
mismo (Blanpain-Avet et al., 2009). Algunos de los factores más
influyentes sobre el proceso de limpieza química se destacan a
continuación:
Capítulo II ________________________________________________________________________________________________________________________________________________________
57
Temperatura: en general, en los procesos de transferencia
de materia, el coeficiente de difusión aumenta a medida que
la temperatura aumenta y, así, la velocidad con la que las
moléculas de suciedad migran desde la superficie de la
membrana hacia la disolución de limpieza aumenta. Además,
las altas temperaturas pueden debilitar la estructura de la
capa de ensuciamiento depositada sobre la membrana,
facilitando su hinchamiento y su eliminación. Por otra parte, la
temperatura aumenta la velocidad con la que las reacciones
químicas tienen lugar, por lo que la interacción entre las
moléculas de suciedad y las de agente de limpieza es mayor
a medida que se incrementa la temperatura de la disolución
de limpieza (Lee y Elimelech, 2007).
Velocidad tangencial: cuando la velocidad tangencial
aumenta, el esfuerzo cortante generado también aumenta, lo
que provoca la erosión de la capa de suciedad y su
eliminación de la superficie de la membrana. Además, el
aumento de velocidad tangencial también favorece la
generación de turbulencia cerca de la superficie de la
membrana, lo que favorece la migración de las moléculas de
suciedad desde la superficie de la membrana hasta el seno
de la disolución de limpieza (Smith et al., 2006; Mores y
Davis, 2002).
Presión transmembranal: al tratarse de la fuerza impulsora
del proceso de UF, la presión transmembranal es la causa de
que las moléculas de suciedad se muevan hacia la superficie
de la membrana. Por tanto, durante la etapa de limpieza,
cuanto menor sea la presión transmembranal aplicada menor
Antecedentes ________________________________________________________________________________________________________________________________________________________
58
será la fuerza con la que las moléculas tanto de suciedad
como de agente de limpieza se desplazan hacia la
membrana. De esta manera, se evita la compactación de la
capa de ensuciamiento ya formada sobre la membrana, así
como la acumulación de moléculas de agente de limpieza en
la misma (Zhao et al., 2000).
Concentración del agente de limpieza: además del coste
económico que supone la utilización en exceso de reactivos
químicos durante la limpieza de las membranas, otros autores
han demostrado que existe una concentración óptima de
agente de limpieza a la que llevar a cabo dicho proceso.
Hasta ese valor óptimo, un aumento de concentración
favorece la limpieza, pero por encima de dicha concentración,
los mecanismos de ensuciamiento y limpieza por parte de las
moléculas de estos agentes químicos podrían ser
competitivos (Cabero Cabero, 1997; Argüello et al., 2002).
pH y fuerza iónica del medio: cuando se ultrafiltran
disoluciones que presentan especies cargadas (como es el
caso de las proteínas durante la UF del lactosuero), las
interacciones soluto-soluto y soluto-membrana pueden variar
significativamente en función del valor de pH y de la fuerza
iónica de la disolución. Generalmente, a valores de pH
cercanos al pI de la proteína, la repulsión electrostática entre
ellas es muy pequeña, por lo que podrían precipitar sobre la
superficie de la membrana. Además, la carga superficial de
las membranas también puede verse afectada por el valor de
pH, pudiendo generarse una repulsión electrostática entre las

Capítulo II ________________________________________________________________________________________________________________________________________________________
59
moléculas de suciedad y la membrana. Este hecho facilitaría
la limpieza de las membranas (Matzinos y Álvarez, 2002).
A pesar de la mayor o menor efectividad de los métodos químicos de
limpieza, los agentes convencionales anteriormente citados pueden
ser agresivos con las membranas y dañarlas más o menos
rápidamente, reduciendo su vida útil y su selectividad, así como
aumentando los costes de producción (grandes consumos de agua y
energía y larga duración del ciclo de limpieza) (Blanpain-Avet, 2009).
Además, estos agentes de limpieza convencionales presentan un
impacto medioambiental negativo cuando son descargados como
aguas residuales después del proceso de limpieza. Para solventar
estos problemas, algunos autores han propuesto limpiezas basadas
en técnicas alternativas, como los ultrasonidos, los campos eléctricos
y las disoluciones salinas han aumentado en los últimos años
(Muthukumaran et al., 2004; Tarazaga et al., 2006; Lee y Elimelech,
2007). A continuación se describen dos de dichas técnicas
alternativas (disoluciones salinas y campos eléctricos), que
corresponden con las técnicas consideradas en la presente Tesis
Doctoral.
2.4.2. Limpieza mediante disoluciones salinas
La utilización de disoluciones salinas como técnica de limpieza es un
proceso todavía en investigación, puesto que se desconocen
exactamente los mecanismos que permiten la eliminación de la
materia orgánica adsorbida en la membrana.
Antecedentes ________________________________________________________________________________________________________________________________________________________
60
El principal trabajo en el que se han empleado disoluciones salinas
para la limpieza de membranas ha sido realizado por Lee y Elimelech
(2007). Estos autores investigaron la limpieza de membranas de OI
que habían sido previamente ensuciadas con disoluciones de materia
orgánica natural, alginatos y pectinas. Como agentes de limpieza, se
utilizaron distintos tipos de sales (NaCl, NaNO3, KCl, CaCl, NH4Cl y
Na2SO4) y muestras de agua de mar. Los resultados de los ensayos
de limpieza demostraron que, entre las sales inertes utilizadas, las
disoluciones de NaCl a bajas concentraciones (25 mM) fueron las
más efectivas para limpiar las membranas de OI. Los ensayos de
limpieza realizados con muestras de agua de mar (con una fuerza
iónica similar a la de las disoluciones de NaCl 100 mM) demostraron
que el agua de mar podía ser efectiva para eliminar los depósitos de
ensuciamiento acumulados en las membranas ensayadas. De
acuerdo con estos autores, la limpieza mediante disoluciones salinas
tiene lugar según dos mecanismos: en primer lugar, se ocasionan
cambios en la capa de ensuciamiento unida a la membrana debido a
la diferencia de concentración de sal entre el seno de la disolución y
la capa de ensuciamiento. Esta diferencia de presión osmótica tiene
como consecuencia el hinchamiento de la capa de suciedad y, por
consiguiente, el debilitamiento de la interacción capa-membrana
debido a la disminución de las fuerzas de adhesión entre las
moléculas de suciedad que forman la capa. A continuación, se
produce una reacción de intercambio iónico entre los iones de la sal y
los iones presentes en la capa de suciedad (por ejemplo, el catión
Ca+2 que une las cadenas de proteínas). Al realizarse este
intercambio iónico, la capa de ensuciamiento se rompe y puede
eliminarse de la superficie de la membrana,

Capítulo II ________________________________________________________________________________________________________________________________________________________
61
transportando dichas moléculas hacia el seno de la disolución (ver
Fig. 11).
Fig. 11. Esquema del mecanismo de limpieza mediante disoluciones
salinas propuesto por Lee y Elimelech (2007)
Por otra parte, algunos autores (Hofmeister, 1888; Curtis y Lue,
2006; Tsumoto et al., 2007; Zhang, 2012) han investigado el efecto
de distintos cationes y aniones sobre la interacción proteína-proteína.
De acuerdo con la capacidad de dichos iones para precipitar las
proteínas (efecto “salting-out”) o bien aumentar su solubilidad (efecto
“salting-in”), Hofmeister (Hofmeister, 1888) ordenó diferentes sales
en una serie (Fig. 12). En base a esta serie, otros autores (Tsumoto
et al., 2007) han demostrado que algunas de ellas, como NaCl,
producen un incremento en la solubilidad de las proteínas, mientras
Capa de ensuciamiento compacta
sobre la superf icie de la membrana
Hinchamiento de la capa de
ensuciamiento por la diferencia
de presión osmótica
Rotura de la capa de ensuciamiento
debido a la reacción de intercambio iónico
Adición de sales
1. Difusión
Adición de sales
2. Intercambio
iónico
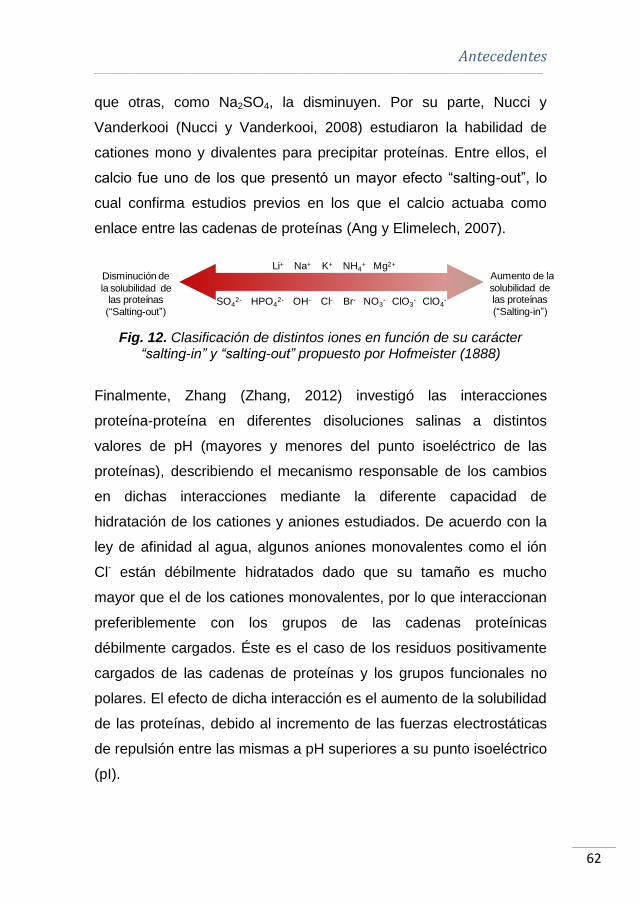
Antecedentes ________________________________________________________________________________________________________________________________________________________
62
que otras, como Na2SO4, la disminuyen. Por su parte, Nucci y
Vanderkooi (Nucci y Vanderkooi, 2008) estudiaron la habilidad de
cationes mono y divalentes para precipitar proteínas. Entre ellos, el
calcio fue uno de los que presentó un mayor efecto “salting-out”, lo
cual confirma estudios previos en los que el calcio actuaba como
enlace entre las cadenas de proteínas (Ang y Elimelech, 2007).
Fig. 12. Clasificación de distintos iones en función de su carácter “salting-in” y “salting-out” propuesto por Hofmeister (1888)
Finalmente, Zhang (Zhang, 2012) investigó las interacciones
proteína-proteína en diferentes disoluciones salinas a distintos
valores de pH (mayores y menores del punto isoeléctrico de las
proteínas), describiendo el mecanismo responsable de los cambios
en dichas interacciones mediante la diferente capacidad de
hidratación de los cationes y aniones estudiados. De acuerdo con la
ley de afinidad al agua, algunos aniones monovalentes como el ión
Cl- están débilmente hidratados dado que su tamaño es mucho
mayor que el de los cationes monovalentes, por lo que interaccionan
preferiblemente con los grupos de las cadenas proteínicas
débilmente cargados. Éste es el caso de los residuos positivamente
cargados de las cadenas de proteínas y los grupos funcionales no
polares. El efecto de dicha interacción es el aumento de la solubilidad
de las proteínas, debido al incremento de las fuerzas electrostáticas
de repulsión entre las mismas a pH superiores a su punto isoeléctrico
(pI).
Aumento de la
solubilidad de las proteínas
(“Salting-in”)
Disminución de
la solubilidad de las proteínas
(“Salting-out”)
Li+ Na+ K+ NH4+ Mg2+
SO42- HPO4
2- OH- Cl- Br- NO3- ClO3
- ClO4-
Capítulo II ________________________________________________________________________________________________________________________________________________________
63
Finalmente, Matzinos y Álvarez (Matzinos y Álvarez, 2002)
investigaron el efecto de la fuerza iónica de la disolución de limpieza
sobre la eficacia de este proceso, demostrando que un aumento de
la fuerza iónica del medio durante la etapa de aclarado incrementaba
la cantidad de calcio eliminado, debido al aumento de su solubilidad
a bajos valores de fuerza iónica y a la eliminación del calcio unido a
las proteínas. Concretamente, este estudio se realizó con
disoluciones de lactosuero en las que los iones calcio y fosfato
forman sales insolubles que pueden precipitar sobre la superficie de
la membrana. Gracias a la adición de NaCl a la disolución de
aclarado, la cantidad de calcio eliminado aumentó
considerablemente, lo que demuestra la efectividad de las
disoluciones salinas eliminando parte del ensuciamiento inorgánico.
2.4.3. Limpieza mediante campos eléctricos
La investigación de la aplicación de campos eléctricos como técnica
física de limpieza ha aumentado en los últimos años en distintos
procesos de separación por membranas, especialmente MF y UF.
Este método se fundamenta en la generación de un campo eléctrico
entre dos electrodos (ánodo y cátodo) situados a ambos lados de la
membrana o bien siendo la membrana uno de los electrodos (Huotari
et al., 1999). El mecanismo de limpieza se basa en la aparición de
una fuerza electrostática de repulsión adicional que provoca el
desplazamiento de partículas desde uno de los electrodos al otro
(Qin et al., 2011). Para que dicho desplazamiento se lleve a cabo,
resulta especialmente importante conocer la carga superficial de las
Antecedentes ________________________________________________________________________________________________________________________________________________________
64
partículas que se pretenden transferir y la carga de la membrana,
para el valor de pH de la disolución de limpieza.
La mayoría de estudios que han aplicado campos eléctricos a
procesos de UF se centran en el aumento de la densidad de flujo de
permeado durante la etapa de ensuciamiento, al disminuir la
polarización por concentración y la formación de torta (Tarazaga et
al., 2006; Song et al., 2010; Agana et al., 2012; Holder et al., 2013).
En estos casos, los campos eléctricos se aplican para mejorar el
comportamiento de membranas poliméricas e inorgánicas utilizadas
para tratar disoluciones de diferentes partículas cargadas (BSA,
hidrolizados de caseína, aguas residuales de post-electrodeposición
de pinturas). Al aplicar un determinado potencial entre ambos
electrodos, las partículas cargadas se transfieren desde la superficie
de la membrana hacia el electrodo que se encuentra en el seno de la
disolución o en el rechazo (según si la membrana es tubular o plana).
En el caso de las disoluciones proteínicas, este electrodo suele estar
cargado positivamente (ánodo) para que las proteínas, que
generalmente presentan carga negativa al pH típico de las
disoluciones tratadas, se desplacen hacia él. Así pues, la disolución
alimento quedará concentrada en las sustancias deseadas, pudiendo
impedirse el paso de estas sustancias que, de acuerdo con su
tamaño de poro y sin la aplicación de campos eléctricos, no serían
retenidas por la membrana.
Algunos autores (Holder et al., 2013) han aplicado campos eléctricos
durante la etapa de limpieza en membranas de UF de poliétersulfona
ensuciadas con disoluciones de hidrolizados de caseína. De acuerdo
Capítulo II ________________________________________________________________________________________________________________________________________________________
65
con estos autores, tras el proceso de ensuciamiento en ausencia de
campos eléctricos las membranas se limpiaron parcialmente, puesto
que determinados péptidos permanecieron depositados sobre su
superficie.
En la presente Tesis Doctoral, los campos eléctricos se aplicarán
durante la etapa de limpieza en membranas que habían sido
previamente ensuciadas con disoluciones de proteínas, por lo que el
objetivo de la aplicación de este método de limpieza consistirá en
eliminar la capa de ensuciamiento adherida sobre la superficie de la
membrana.
2.4.4. Evaluación de la eficacia del proceso de
limpieza
Al finalizar el proceso de limpieza, resulta imprescindible evaluar la
eficacia de dicho proceso para conocer si las propiedades
permselectivas de la membrana han sido recuperadas y, por tanto,
coinciden con las que presentaba inicialmente. Una clasificación
básica de los criterios de evaluación de la eficacia del proceso de
limpieza los divide en hidráulicos, químicos y microbiológicos,
aunque generalmente los dos últimos suelen englobarse en un único
tipo (Blanpain-Avet et al., 2009).
Los criterios hidráulicos se basan en la comparación de la densidad
de flujo de permeado con agua pura de la membrana original y de la
membrana tras el proceso de limpieza. Esta comparación se realiza
en las mismas condiciones experimentales de presión

Antecedentes ________________________________________________________________________________________________________________________________________________________
66
transmembranal, velocidad tangencial, temperatura, etc. En el
Capítulo III se detalla la ecuación utilizada para evaluar la eficacia del
proceso de limpieza. Aunque los métodos hidráulicos son
ampliamente utilizados por su rapidez, estas medidas de densidad de
flujo pueden no representar inequívocamente la situación real en la
membrana, como por ejemplo en los siguientes casos:
La morfología y/o las propiedades de la superficie de la
membrana se han visto alteradas por el efecto del reactivo
químico.
Existen depósitos de suciedad entre los poros o dentro del
soporte que no afectan a la densidad de flujo de permeado.
En caso de que exista materia orgánica tras el protocolo de
limpieza, puede desarrollarse un crecimiento microbiano en la
membrana.
Por su parte, los criterios químicos consisten en la determinación de
las especies químicas que conforman la morfología de la membrana
tras el proceso de limpieza. Entre las diferentes técnicas utilizadas
para evaluar la estructura y composición de la membrana, las más
destacadas son la espectroscopía de infrarrojos con transformada de
Fourier y sistema de reflectancia total atenuada (“Attenuated Total
Reflectance-Fourier Transformate Infrared Spectroscopy”, ATR-
FTIR,), la microscopía electrónica de barrido (“Scanning Electron
Microscopy”, SEM), la microscopía de energía dispersiva de rayos X
(“Energy Dispersive X-ray”, EDX) y la microscopía de fuerza atómica
(“Atomic Force Microscopy”, AFM). El empleo de estas técnicas
permite conocer de manera precisa la composición química de la
estructura de la membrana, la composición y la distribución de
Capítulo II ________________________________________________________________________________________________________________________________________________________
67
especies químicas procedentes del ensuciamiento sobre la superficie
de la membrana, la porosidad y rugosidad de la membrana y las
fuerzas de adhesión entre las moléculas de suciedad (Delaunay et
al., 2008; Kim et al., 2008). Sin embargo, el principal inconveniente
de los métodos químicos de evaluación de la eficacia del proceso de
limpieza es su carácter destructivo, es decir, es necesario romper la
membrana para poder determinar sus características, por lo que
resulta imposible reutilizarla de nuevo en el proceso.
En la presente Tesis Doctoral, la eficacia del proceso de limpieza se
ha evaluado mayoritariamente mediante criterios hidráulicos que se
describen con detalle en el Capítulo III de esta Tesis. Sin embargo,
en algunas condiciones que resultaron óptimas para las disoluciones
tratadas (ensayos con BSA y disoluciones enzimáticas utilizando
membranas poliméricas), se comprobó también la eficacia del
proceso de limpieza utilizando criterios químicos.

Antecedentes ________________________________________________________________________________________________________________________________________________________
68
2.5. BIBLIOGRAFÍA
ACEVEDO CORREA D. (2010). “Gelificación fría de las proteínas del
lactosuero” en ReCiTeIA, vol. 10, p. 1-19.
AGANA B.A., REEVE D. y ORBELL J.D. (2012). “The influence of an
applied electric field during ceramic ultrafiltration of post-
electrodeposition rinse wastewater” en Water Research, vol. 46, p.
3574-3584.
ALMÉCIJA M.C. et al. (2009a). “Analysis of cleaning protocols in
ceramic membranes by liquid-liquid displacement porosimetry” en
Desalination, vol. 245, p. 541-545.
ALMÉCIJA M.C. et al. (2009b). “Influence of the cleaning temperature
on the permeability of ceramic membranes” en Desalination, vol. 245,
p. 708-713.
ANEMA S.G. (2014). “The whey proteins in milk: thermal
denaturation, physical interactions and effects on the functional
properties of milk” en Taylor S.L. Milk Proteins: From Expression to
Food (Second Edition). Londres: Elsevier.
ANG W.S., LEE S. y ELIMELECH M. (2006). “Chemical and physical
aspects of cleaning of organic-fouled reverse osmosis membranes”
en Journal of Membrane Science, vol. 272, p. 198-210.
ANG W.S. y ELIMELECH M. (2007). “Protein (BSA) fouling of reverse
osmosis membranes: Implications for wastewater reclamation” en
Journal of Membrane Science, vol. 296, p. 83-92.
ANG W.S. et al. (2011). “Chemical cleaning of RO membranes fouled
by wastewater effluent: Achieving higher efficiency with dual-step
cleaning” en Journal of Membrane Science, vol. 382, p. 100-106.
Capítulo II ________________________________________________________________________________________________________________________________________________________
69
ARGÜELLO M.A. et al. (2002). “Enzymatic cleaning of inorganic
ultrafiltration membranes fouled by whey proteins” en Journal of
Agricultural and Food Chemistry, vol. 50, p. 1951-1958.
ARGÜELLO M.A. et al. (2003). “Enzymatic cleaning of inorganic
ultrafiltration membranes used for whey protein fractionation” en
Journal of Membrane Science, vol. 216, p. 121-134.
ARUNKUMAR A. y ETZEL M.R. (2015). “Negatively charged
tangential flow ultrafiltration membranes for whey protein
concentration” en Journal of Membrane Science, vol. 475, p. 340-
348.
BAI L. et al. (2013) “Membrane fouling during ultrafiltration (UF) of
surface water: Effects of sludge discharge interval (SDI)” en
Desalination, vol. 319, p. 18-24.
BAKER R.W. (2004). Membrane Technology and Applications
(Second edition), Reino Unido: John Wiley & Sons, Ltd.
BARANYI J. et al. (1996). “Effects of parameterization on the
performance of empirical models used in predictive microbiology” en
Food Microbiology, vol. 13, p. 83-91.
BLANPAIN-AVET P., MIGDAL J.F. y BÉNÉZECH T. (2009).
“Chemical cleaning of a tubular ceramic microfiltration membrane
fouled with a whey protein concentrate suspension – characterization
of hydraulic and chemical cleanliness” en Journal of Membrane
Science, vol. 337, p. 153-174.
CABERO CABERO M.L. (1997). Limpieza química de membranas
inorgánicas: Aplicación al tratamiento de lactosuero. Tesis Doctoral.
Oviedo: Universidad de Oviedo, <http://hdl.handle.net/10651/13566>.
Antecedentes ________________________________________________________________________________________________________________________________________________________
70
CABERO M.L. et al. (1999). “Rinsing of ultrafiltration ceramic
membranes fouled with whey proteins: effects on cleaning
procedures” en Journal of Membrane Science, vol. 154, p. 239-250.
CAI M., ZHAO S. y LIANG H. (2010). “Mechanisms for the
enhancement of ultrafiltration and membrane cleaning by different
ultrasonic frequencies” en Desalination, vol. 263, p. 133-138.
CARRÈRE H., BLASZKOW F. y ROUX DE BALMANN H. (2001).
“Modelling the clarification of lactic acid fermentation broths by cross-
flow microfiltration” en Journal of Membrane Science, vol. 186, p.
219-230.
CAYOT P. y LORIENT D. (1997). “Chapter 8. Structure-Function
Relationships of Whey Proteins” en Damodaran S. y Paraf A. Food
Proteins and their applications. Nueva York: Marcel Dekker Inc.
CHANDAN R.C. y KILARA A. (2011). Dairy Ingredients for Food
Processing. Iowa: Wiley-Blackwell.
CHEN J.P., KIM S.L. y TING Y.P. (2003). “Optimization of membrane
physical and chemical cleaning by a statistically designed approach”
en Journal of Membrane Science, vol. 219, p. 27-45.
CHOI S.-W. et al. (2000). “Modeling of the permeate flux during
microfiltration of BSA-adsorbed microspheres in a stirred cell” en
Journal of Colloid and Interface Science, vol. 228, p. 270-278.
CORBATÓN BÁGUENA M.J., ÁLVAREZ BLANCO S. y VINCENT
VELA M.C. (2011). Limpieza de membranas de ultrafiltración
aplicadas en la industria alimentaria por medio de disoluciones
salinas y caracterización del ensuciamiento de las membranas.
Trabajo Final de Máster. Valencia: Universitat Politècnica de
València, <https://riunet.upv.es/handle/10251/15691> [Consulta: 1 de
junio de 2015].
Capítulo II ________________________________________________________________________________________________________________________________________________________
71
CORBATÓN-BÁGUENA M.J., ÁLVAREZ-BLANCO S. y VINCENT-
VELA M.C. (2015). “Fouling mechanisms of ultrafiltration membranes
fouled with whey model solutions” en Desalination, vol. 360, p. 87-96.
CURTIS R.A. y LUE L. (2006). “A molecular approach to
bioseparations: protein-protein and protein-salt interactions” en
Chemical Engineering Science, vol. 61, p. 907-923.
DAUFIN G. et al. (2001). “Recent and emerging applications of
membrane processes in the food and dairy industry” en Food and
Bioproducts Processing, vol. 79, p. 89-102.
DE LA CASA E.J. et al. (2008). “A combined fouling model to
describe the influence of electrostatic environment on the cross-flow
microfiltration of BSA” en Journal of Membrane Science, vol. 318, p.
247-254.
DELAUNAY D. et al. (2008). “Mapping of protein fouling by FTIR-ATR
as experimental tool to study membrane fouling and fluid velocity
profile in various geometries and validation by CFD simulation” en
Chemical Engineering and Processing, vol. 47, p. 1106-1117.
D’SOUZA N.M. y MAWSON A.J. (2005). “Membrane cleaning in the
dairy industry: a review” en Critical Reviews in Food Science and
Nutrition, vol. 45, p. 125-134.
EDWARDS P.B. y JAMESON G.B. (2014). “Chapter 7: Structure and
stability of whey proteins” en Taylor S.L. Milk Proteins: From
Expression to Food (Second Edition), Londres: Elsevier.
EL-ABASSI A. et al. (2014). “Application of ultrafiltration for olive
processing wastewaters treatment” en Journal of Cleaner Production,
vol. 65, p. 432-438.
Antecedentes ________________________________________________________________________________________________________________________________________________________
72
GAO W. et al. (2011). “Membrane fouling control in ultrafiltration
technology for drinking water production” en Desalination, vol. 272, p.
1-8.
GORDON J. (1997). “Dairy products” en Ranken M.D., Kill R.C.,
Baker C.G.J. Food Industries Manual. Londres: Blackie Academic &
Professional.
GOULAS A. y GRANDISON A.S. (2008). “Applications of Membrane
Separations” en Britz T.J. y Robinson R.K. Advanced Dairy Science
and Technology. Reino Unido: Blackwell Publishing.
HERMIA J. (1982). “Constant pressure blocking filtration laws-
application to power-law non-Newtonian fluids” en Trans IChemE, vol.
60, p. 183-187.
HINKOVÁ A. et al. (2005). “Application of cross-flow ultrafiltration on
inorganic membranes in purification of food materials” en Czech
Journal of Food Science, vol. 23, p. 103-110.
HO C.-C. y ZYDNEY L. (2000). “A combined pore blockage and cake
filtration model for protein fouling during microfiltration” en Journal of
Colloid and Interface Science, vol. 232, p. 389-399.
HOFMEISTER F. (1888). “Zur lehre von der wirkung der salze” en
Archiv for Experimentelle Pathologie und Pharmakologie, vol. 24, p.
247.
HOLDER A., WEIK J. y HINRICHS J. (2013). “A study of fouling
during long-term fractionation of functional peptides by means of
cross-flow ultrafiltration and cross-flow electro membrane filtration” en
Journal of Membrane Science, vol. 446, p. 440-448.
HONG S. y ELIMELECH M. (1997). “Chemical and physical aspects
of natural organic matter (NOM) fouling of nanofiltration membranes”
en Journal of Membrane Science, vol. 132, p. 159-181.

Capítulo II ________________________________________________________________________________________________________________________________________________________
73
HUISMAN I.H., PRÁDANOS P. y HERNÁNDEZ A. (2000). “The effect
of protein-protein and protein-membrane interactions on membrane
fouling in ultrafiltration” en Journal of Membrane Science, vol. 179, p.
79-90.
HUOTARI H.M. TRÄGÅRDH G. y HUISMAN I.H. (1999). “Crossflow
membrane filtration enhanced by an external DC electric field: A
review” en Trans IChemE, vol. 77, p. 461-468.
JUDD S., KIM B. y AMY G. (2008). “Membrane Bio-reactors” en
HenzeM., Van Loosdrecht M., Ekama G. y Brdjanovic D. Biological
Wastewater Treatment: Principles, Modelling and Design. Londres:
IWA Publishing.
KAYA Y. et al. (2010). “The effect of transmembrane pressure and pH
on treatment of paper machine process waters by using a two-step
nanofiltration process” en Desalination, vol. 250, p. 150-157.
KAZEMIMOGHADAM M. y MOHAMMADI T. (2007). “Chemical
cleaning of ultrafiltration membranes in the milk industry” en
Desalination, vol. 204, p. 213-218.
KIM J., CAI Z. y BENJAMIN M.M. (2008). “Effects of adsorbents on
membrane fouling by natural organic matter” en Journal of Membrane
Science, vol. 310, p. 356-364.
KRSTIĆ D.M. et al. (2002). “The effect of turbulence promoter on
cross-flow microfiltration of skim milk” en Journal of Membrane
Science, vol. 208, p. 303-314.
KUMAR P. et al. (2013). “Perspective of Membrane Technology in
Dairy Industry: A Review” en Asian-Australasian Journal of Animal
Science, vol. 26, p. 1347-1358.
KWON B. et al. (2006). “Organic nanocolloid fouling in UF
membranes” en Journal of Membrane Science, vol. 279, p. 209-219.

Antecedentes ________________________________________________________________________________________________________________________________________________________
74
LEE S. y ELIMELECH M. (2007). “Salt cleaning of organic-fouled
reverse osmosis membranes” en Water Research, vol. 41, p. 1134-
1142.
LI J., SANDERSON R.D. y JACOBS E.P. (2002). “Ultrasonic cleaning
of nylon microfiltration membranes fouled by Kraft paper mil effluent”
en Journal of Membrane Science, vol. 205, p. 247-257.
LIPNIZKI F. (2008). “Opportunities and challenges of using
ultrafiltration for the concentration of diluted coating materials” en
Desalination, vol. 224, p. 98-104.
LIU C. et al. (2001). “Membrane chemical cleaning: from art to
science” en AWWA Membrane Technology Conference. San Antonio,
TX.
LUCENA M.E. et al. (2006). “Beta-lactoglobulin removal from whey
protein concentrates. Production of milk derivatives as a base for
infant formulas” en Separation and Purification Technology, vol. 52, p.
310-316.
MADRID VICENTE A. (1981). Modernas técnicas de
aprovechamiento del lactosuero. España: Almansa.
MAH S.-K. et al. (2012). “Ultrafiltration of pal oil-oleic acid-glycerin
solutions: fouling mechanism identification, fouling mechanism
analysis and membrane characterizations” en Separation and
Purification Technology, vol. 98, p. 419-431.
MATZINOS P. y ÁLVAREZ R. (2002). “Effect of ionic strength on
rinsing and alkaline cleaning of ultrafiltration inorganic membranes
fouled with whey proteins” en Journal of Membrane Science, vol. 208,
p. 23-20.
Capítulo II ________________________________________________________________________________________________________________________________________________________
75
MOHAMMADI T. y ESMAEELIFAR A. (2005). “Wastewater treatment
of a vegetable oil factory by a hybrid ultrafiltration-activated carbon
process” en Journal of Membrane Science, vol. 254, p. 129-137.
MORES W.D. y DAVIS R.H. (2002). “Yeast foulant removal by
backpulses in crossflow microfiltration” en Journal of Membrane
Science, vol. 208, p. 389-404.
MULDER, M. (2000). Basic Principles of Membrane Technology.
Holanda: Kluwer Academic Publishers.
MUTHUKUMARAN S. et al. (2004). “The use of ultrasonic cleaning
for ultrafiltration membranes in the dairy industry” en Separation and
Purification Technology, vol. 39, p. 99-107.
NAIM R., LEVITSKY I. y GITIS V. (2012). “Surfactant cleaning of UF
membranes fouled by proteins” en Separation and Purification
Technology, vol. 94, p. 39-43.
NIGAM M.O., BANSAL B. y CHEN X.D. (2008). “Fouling and cleaning
of whey protein concentrate fouled ultrafiltration membranes” en
Desalination, vol. 218, p. 313-322.
NUCCI N.V. y VANDERKOOI J.M. (2008). “Effects of salts of the
Hofmeister series on the hydrogen bond network of water” en Journal
of Molecular Liquids, vol. 143, p. 160-170.
OGUNBIYI O.O., MILES N.J. y HILAL N. (2008). “The effects of
performance and cleaning cycles of new tubular ceramic
microfiltration membrane fouled with a model yeast suspension” en
Desalination, vol. 220, p. 273-289.
ORGANIZACIÓN DE LAS NACIONES UNIDAS PARA LA
ALIMENTACIÓN Y LA AGRICULTURA.
<http://www.fao.org/home/en/> [Consulta: 1 de junio de 2015]
Antecedentes ________________________________________________________________________________________________________________________________________________________
76
PAUGAM L. DELAUNAY D. y RABILLER-BAUDRY M. (2010).
“Cleaning efficiency and impact on production fluxes of oxidising
disinfectants on a PES ultrafiltration membrane fouled with proteins”
en Food and Bioproducts Processing, vol. 88, p. 425-429.
PENG H. y TREMBLAY A.Y. (2008). “Membrane regeneration and
filtration modeling in treating oily wastewaters” en Journal of
Membrane Science, vol. 324, p. 59-66.
QIN F.G.F., MAWSON J. y ZENG X.A. (2011). “Experimental study of
fouling and cleaning of sintered stainless steel membrane in electro-
microfiltration of calcium salt particles” en Membranes, vol. 1, p. 119-
131.
RUBY FIGUEROA R.A., CASSANO A. y DRIOLI E. (2011).
“Ultrafiltration of orange press liquor: Optimization for permeate flux
and fouling index by response surface methodology” en Separation
and Purification Technology, vol. 80, p. 1-10.
SALAHI A., ABBASI M. y MOHAMMADI T. (2010). “Permeate flux
decline during UF of oily wastewater: experimental and modelling” en
Desalination, vol. 251, p. 153-160.
SHIRAZI S., LIN C.-J. y CHEN D. (2010). “Inorganic fouling of
pressure–driven membrane processes. A critical review” en
Desalination, vol. 250, p. 236-248.
SHON H.K. et al. (2004). “Effect of pretreatment on the fouling of
membranes: application in biologically treated sewage effluent” en
Journal of Membrane Science, vol. 234, p. 111-120.
SMITH P.J. et al. (2006). “Productivity enhancement in a cross-flow
ultrafiltration membrane system through automated de-clogging
operations” en Journal of Membrane Science, vol. 280, p. 82-88.
Capítulo II ________________________________________________________________________________________________________________________________________________________
77
SONG W. et al. (2010). “Rapid concentration of protein solution by a
crossflow electro-ultrafiltration process” en Separation and
Purification Technology, vol. 73, p. 310-318.
SUÁREZ L. et al. (2012). “Membrane technology for the recovery of
detergent compounds: A review” en Journal of Industrial and
Engineering Chemistry, vol. 18, p. 1859-1873.
TARAZAGA C.C., CAMPDERRÓS M.E. y PÉREZ PADILLA A.
(2006). “Physical cleaning by means of electric field in the
ultrafiltration of a biological solution” en Journal of Membrane
Science, vol. 278, p. 219-224.
TSUMOTO K. et al. (2007). “Effects of salts on protein-surface
interactions: Applications for column chromatography” en Journal of
Pharmaceutical Science, vol. 96, p. 1677-1690.
VAN DER BRUGGEN B. et al. (2003). “A review of pressure-driven
membrane processes in wastewater treatment and drinking water
production” en Environmental Progress, vol. 22, p. 46-56.
VINCENT VELA M.C. et al. (2009). “Analysis of membrane pore
blocking models adapted to crossflow ultrafiltration in the ultrafiltration
of PEG” en Chemical Engineering Journal, vol. 149, p. 232-241.
WANG C. et al. (2012). “Membrane fouling mechanisms in
ultrafiltration of succinic acid fermentation broth” en Bioresource
Technology, vol. 116, p. 366-371.
WANG Z. et al. (2014). “Membrane cleaning in membrane
bioreactors: A review" en Journal of Membrane Science, vol. 468, p.
276-307.
WIT J.N. (1998). “Nutritional and functional characteristics of whey
proteins in food products” en Journal of Dairy Science, vol. 81, p.
597-608.
Antecedentes ________________________________________________________________________________________________________________________________________________________
78
WOO Y.C. et al. (2015). “Characteristics of membrane fouling by
consecutive chemical cleaning in pressurized ultrafiltration as pre-
treatment of seawater desalination” en Desalination, vol. 269, p. 51-
61.
YEE K.W.K., WILEY D.E. y BAO J. (2009). “A unified model of the
time dependence flux decline for the ultrafiltration of whey” en Journal
of Membrane Science, vol. 332, p. 69-80.
ZHANG J. (2012). “Protein-protein interactions in salt solutions” en
Cai W. y Hong H. Protein-protein interactions – Computational and
experimental tools. Intech.
ZHAO Y.-J. et al. (2000). “Fouling and cleaning of membrane-a
literatura review” en Journal of Environmental Sciences, vol. 12, p.
241-251.
ZYDNEY A.L., HO C.-C. y YUAN W. (2003). “Fouling phenomena
during microfiltration:effects of pore blockage, cake filtration and
membrane morphology” en Bhattacharyya D. y Butterfield A. New
insights into membrane science and technology: polymeric and
biofunctional membranes (Membrane Science and Technology
Series). Amsterdam: Elsevier.

Metodología experimental

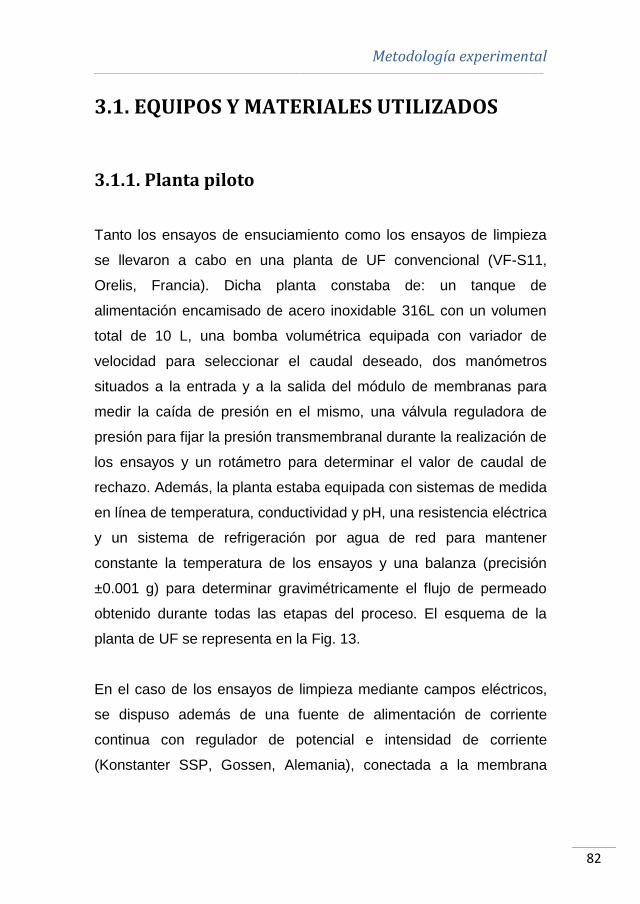
Metodología experimental ________________________________________________________________________________________________________________________________________________________
82
3.1. EQUIPOS Y MATERIALES UTILIZADOS
3.1.1. Planta piloto
Tanto los ensayos de ensuciamiento como los ensayos de limpieza
se llevaron a cabo en una planta de UF convencional (VF-S11,
Orelis, Francia). Dicha planta constaba de: un tanque de
alimentación encamisado de acero inoxidable 316L con un volumen
total de 10 L, una bomba volumétrica equipada con variador de
velocidad para seleccionar el caudal deseado, dos manómetros
situados a la entrada y a la salida del módulo de membranas para
medir la caída de presión en el mismo, una válvula reguladora de
presión para fijar la presión transmembranal durante la realización de
los ensayos y un rotámetro para determinar el valor de caudal de
rechazo. Además, la planta estaba equipada con sistemas de medida
en línea de temperatura, conductividad y pH, una resistencia eléctrica
y un sistema de refrigeración por agua de red para mantener
constante la temperatura de los ensayos y una balanza (precisión
±0.001 g) para determinar gravimétricamente el flujo de permeado
obtenido durante todas las etapas del proceso. El esquema de la
planta de UF se representa en la Fig. 13.
En el caso de los ensayos de limpieza mediante campos eléctricos,
se dispuso además de una fuente de alimentación de corriente
continua con regulador de potencial e intensidad de corriente
(Konstanter SSP, Gossen, Alemania), conectada a la membrana

Capítulo III ________________________________________________________________________________________________________________________________________________________
83
(cátodo) y a un electrodo de titanio con recubrimiento de iridio que
actuó de ánodo (MAGNETO Special Anodes B.V., Holanda). Los
ensayos presentados en esta Tesis se realizaron en modo
potenciostático, de manera que el potencial aplicado se seleccionó al
comienzo de cada ensayo de limpieza. Un esquema detallado de las
conexiones entre la fuente de alimentación y los electrodos utilizados
durante la limpieza mediante campos eléctricos se muestra en la Fig.
14.
Fig. 13. Esquema de la planta de UF utilizada
Fig. 14. Esquema de la conexión de los electrodos
Dado que durante los ensayos de ensuciamiento y limpieza se
utilizaron membranas con distintas configuraciones (plana y tubular),
Electrodo negativo ( -): cátodoElectrodo positivo (+): ánodo
Parte externa de la membrana
Electrodo de Ti-IrParte interna de la membrana
(capa activa)

Metodología experimental ________________________________________________________________________________________________________________________________________________________
84
la planta de UF se equipó con distintos módulos para poder albergar
dichas membranas. Así pues, los ensayos con membranas
cerámicas tubulares se realizaron en un módulo tubular de acero
inoxidable (Carbosep, Orelis, Francia) diseñado para albergar
membranas de 20 cm de longitud; mientras que un módulo plano de
metacrilato (Rayflow, Orelis, Francia) diseñado para membranas con
un área efectiva de 100 cm2 se utilizó para llevar a cabo los ensayos
con membranas poliméricas planas. En el caso de los ensayos de
limpieza mediante campos eléctricos con membranas cerámicas, el
módulo metálico se sustituyó por un módulo de PlexiglásGS®
(Metaval Abella S.L., España) de las mismas dimensiones. Las
fotografías de los tres módulos utilizados (Rayflow, tubular de
PlexiglásGS® y tubular de acero inoxidable) se observan en la Fig.
15.
Módulo Rayflow
Módulo tubular de
PlexiglásGS®
Módulo tubular de acero inoxidable
Fig. 15. Fotografías de los módulos utilizados
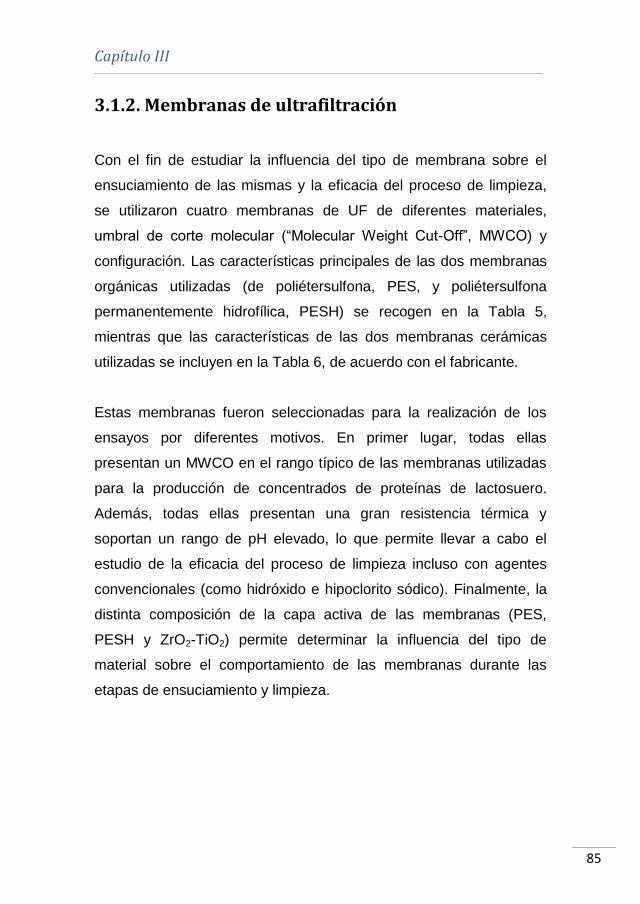
Capítulo III ________________________________________________________________________________________________________________________________________________________
85
3.1.2. Membranas de ultrafiltración
Con el fin de estudiar la influencia del tipo de membrana sobre el
ensuciamiento de las mismas y la eficacia del proceso de limpieza,
se utilizaron cuatro membranas de UF de diferentes materiales,
umbral de corte molecular (“Molecular Weight Cut-Off”, MWCO) y
configuración. Las características principales de las dos membranas
orgánicas utilizadas (de poliétersulfona, PES, y poliétersulfona
permanentemente hidrofílica, PESH) se recogen en la Tabla 5,
mientras que las características de las dos membranas cerámicas
utilizadas se incluyen en la Tabla 6, de acuerdo con el fabricante.
Estas membranas fueron seleccionadas para la realización de los
ensayos por diferentes motivos. En primer lugar, todas ellas
presentan un MWCO en el rango típico de las membranas utilizadas
para la producción de concentrados de proteínas de lactosuero.
Además, todas ellas presentan una gran resistencia térmica y
soportan un rango de pH elevado, lo que permite llevar a cabo el
estudio de la eficacia del proceso de limpieza incluso con agentes
convencionales (como hidróxido e hipoclorito sódico). Finalmente, la
distinta composición de la capa activa de las membranas (PES,
PESH y ZrO2-TiO2) permite determinar la influencia del tipo de
material sobre el comportamiento de las membranas durante las
etapas de ensuciamiento y limpieza.
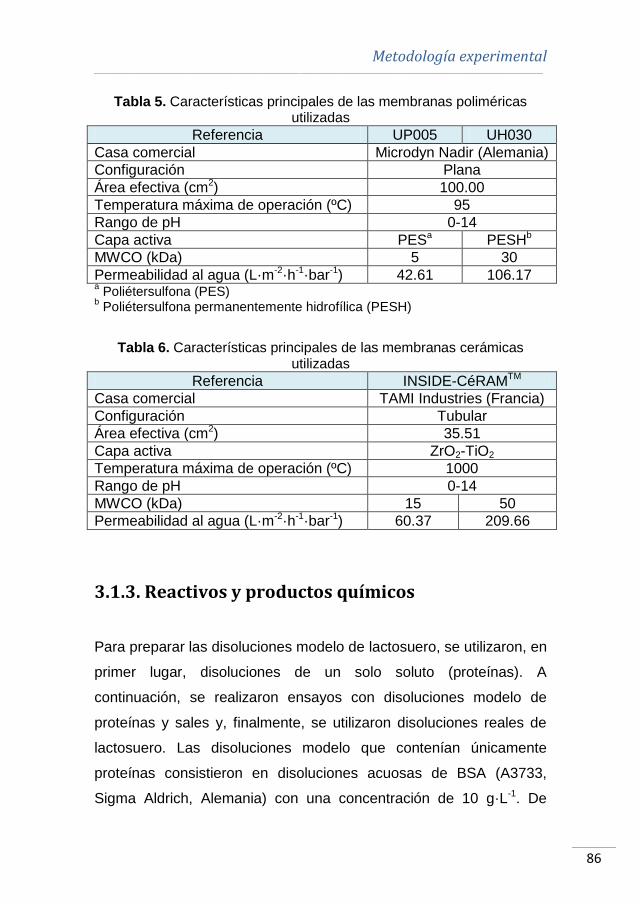
Metodología experimental ________________________________________________________________________________________________________________________________________________________
86
Tabla 5. Características principales de las membranas poliméricas utilizadas
Referencia UP005 UH030
Casa comercial Microdyn Nadir (Alemania)
Configuración Plana
Área efectiva (cm2) 100.00
Temperatura máxima de operación (ºC) 95
Rango de pH 0-14
Capa activa PESa PESHb
MWCO (kDa) 5 30
Permeabilidad al agua (L·m-2·h-1·bar-1) 42.61 106.17 a Poliétersulfona (PES)
b Poliétersulfona permanentemente hidrofílica (PESH)
Tabla 6. Características principales de las membranas cerámicas utilizadas
Referencia INSIDE-CéRAMTM
Casa comercial TAMI Industries (Francia)
Configuración Tubular
Área efectiva (cm2) 35.51
Capa activa ZrO2-TiO2
Temperatura máxima de operación (ºC) 1000
Rango de pH 0-14
MWCO (kDa) 15 50
Permeabilidad al agua (L·m-2·h-1·bar-1) 60.37 209.66
3.1.3. Reactivos y productos químicos
Para preparar las disoluciones modelo de lactosuero, se utilizaron, en
primer lugar, disoluciones de un solo soluto (proteínas). A
continuación, se realizaron ensayos con disoluciones modelo de
proteínas y sales y, finalmente, se utilizaron disoluciones reales de
lactosuero. Las disoluciones modelo que contenían únicamente
proteínas consistieron en disoluciones acuosas de BSA (A3733,
Sigma Aldrich, Alemania) con una concentración de 10 g·L-1. De

Capítulo III ________________________________________________________________________________________________________________________________________________________
87
acuerdo con el proveedor, este compuesto se suministra en forma de
polvo con un 98 % de pureza, una masa molecular de 66 kDa y un
punto isoeléctrico de 4.9. Según diversos autores (Suttiprasit et al.,
1992; Wang y Tang, 2011; Afonso et al., 2009), su configuración es
elíptica de dimensiones 11.6×2.7×2.7 nm. La proteína BSA es una de
las proteínas mayoritarias en el lactosuero y ha sido ampliamente
utilizada en disoluciones modelo para la realización de estudios
sobre la UF de proteínas (Afonso et al., 2009).
Para simular las disoluciones modelo de proteínas y sales, a la
disolución de BSA se añadió cloruro de calcio con una pureza del
95 % a una concentración de 1.65 g·L-1 (Panreac, España). Se
seleccionó como sal representativa del lactosuero CaCl2, debido a
que ambos iones presentan una alta concentración tanto en el
lactosuero dulce como en el ácido. Además, numerosos autores han
demostrado que la presencia de Ca+2 favorece el ensuciamiento de
las membranas causado por proteínas (Nucci y Vanderkooi, 2008).
Finalmente, las disoluciones reales de lactosuero se prepararon a
partir de WPC (Renylat, Industrias Lácteas Asturianas S.A., España)
con diferentes concentraciones (22.2, 33.3, 44.4 y 150 g·L-1). De
acuerdo con el fabricante, el WPC contiene una concentración total
de proteínas del 45 %p/p. La concentración de todos estos reactivos
se seleccionó en base a la concentración típica de las sustancias
utilizadas (proteínas y sales) propias del lactosuero dulce y de los
concentrados de proteínas del lactosuero elaborados por UF. La
composición del WPC utilizado, de acuerdo con los ensayos de
caracterización llevados a cabo en el Departamento de Ingeniería
Química y Nuclear, se muestra en la Tabla 7. Las técnicas analíticas

Metodología experimental ________________________________________________________________________________________________________________________________________________________
88
utilizadas para determinar cada uno de los componentes se
describen en detalle en la sección “Técnicas analíticas utilizadas”.
Tabla 7. Composición del WPC utilizado
Componente Concentración en base seca (%p/p)
Materia seca 93.66 ± 0.95
Proteínas 40.74 ± 0.79
Lactosa 38.27 ± 0.49
Grasa 8.14 ± 0.20
Cenizas 7.85 ± 0.07
Ca 0.79 ± 0.06
Na 1.21 ± 0.09
K 1.42 ± 0.02
Cl 4.07 ± 0.24
PO4-P 0.37 ± 0.03
Por otra parte, para simular una disolución típica de la industria de
bebidas y zumos, se utilizaron disoluciones enzimáticas de
pectinasas (Pectinex Smash XXL, Novozymes, Dinamarca) a
diferentes concentraciones (2, 7.5 y 15 g·L-1) con un pH entorno a
4.3. De acuerdo con el proveedor, dichas disoluciones enzimáticas
estaban compuestas principalmente por pectinliasas de Aspergillius
niger. Dichas disoluciones simulan a las empeladas en los procesos
de clarificación de zumos.
Con el fin de estudiar la influencia del tipo de sal sobre la eficacia del
proceso de limpieza, se utilizaron diferentes disoluciones salinas de
NaCl, NaNO3, Na2SO4, KCl y NH4Cl (Panreac, España). Estas
disoluciones se prepararon sin ajuste de pH, variando éste entre 6.8-
7. Las propiedades físicas de las sales utilizadas así como sus
pictogramas correspondientes se muestran en la Tabla 8
(www.panreac.es).
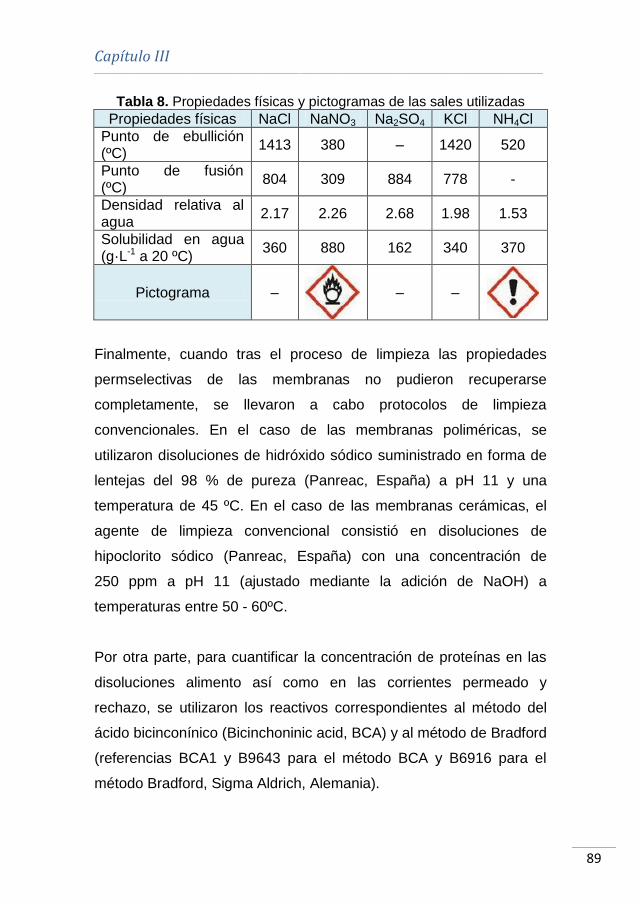
Capítulo III ________________________________________________________________________________________________________________________________________________________
89
Tabla 8. Propiedades físicas y pictogramas de las sales utilizadas
Propiedades físicas NaCl NaNO3 Na2SO4 KCl NH4Cl
Punto de ebullición (ºC)
1413 380 – 1420 520
Punto de fusión (ºC)
804 309 884 778 -
Densidad relativa al agua
2.17 2.26 2.68 1.98 1.53
Solubilidad en agua (g·L-1 a 20 ºC)
360 880 162 340 370
Pictograma –
– –
Finalmente, cuando tras el proceso de limpieza las propiedades
permselectivas de las membranas no pudieron recuperarse
completamente, se llevaron a cabo protocolos de limpieza
convencionales. En el caso de las membranas poliméricas, se
utilizaron disoluciones de hidróxido sódico suministrado en forma de
lentejas del 98 % de pureza (Panreac, España) a pH 11 y una
temperatura de 45 ºC. En el caso de las membranas cerámicas, el
agente de limpieza convencional consistió en disoluciones de
hipoclorito sódico (Panreac, España) con una concentración de
250 ppm a pH 11 (ajustado mediante la adición de NaOH) a
temperaturas entre 50 - 60ºC.
Por otra parte, para cuantificar la concentración de proteínas en las
disoluciones alimento así como en las corrientes permeado y
rechazo, se utilizaron los reactivos correspondientes al método del
ácido bicinconínico (Bicinchoninic acid, BCA) y al método de Bradford
(referencias BCA1 y B9643 para el método BCA y B6916 para el
método Bradford, Sigma Aldrich, Alemania).
Metodología experimental ________________________________________________________________________________________________________________________________________________________
90
Para preparar el reactivo utilizado en la determinación de la
concentración de lactosa en el WPC, fueron necesarios ácido 3,5-
dinitrosalicílico (Dinitrosalicylic acid, DNS, Sigma Aldrich, Alemania) y
tartrato de sodio y potasio 4-hidrato (Panreac, España). La recta de
calibrado se realizó con lactosa 1-hidrato en polvo (Panreac,
España).
La determinación de la concentración de dos aniones presentes en el
WPC utilizado se llevó a cabo mediante el uso de kits Spectroquant
de cloruros y fosfatos (referencia 114730 y 114729, respectivamente,
Merck Millipore, España).
Tanto el agua osmotizada como el agua destilada necesarias para
preparar las disoluciones de ensuciamiento, limpieza y
caracterización se produjeron en el laboratorio del Departamento de
Ingeniería Química y Nuclear, mediante un equipo de ósmosis
inversa (Osmofilter S.L., España) y una resina de intercambio iónico
Station 8000 L 5.2 (Veolia Water Systems, Francia).
Capítulo III ________________________________________________________________________________________________________________________________________________________
91
3.2. METODOLOGÍA
3.2.1. Caracterización de las membranas
Para determinar la permeabilidad hidráulica de las membranas de UF
utilizadas y la resistencia intrínseca de las mismas (Rm), se
caracterizaron dichas membranas con agua desionizada en unas
condiciones fijas de temperatura (25 ºC) y velocidad tangencial
(3 m·s-1) y a distintos valores de presión transmembranal (1, 2 y
3 bar). Para el cálculo de la resistencia hidráulica se utilizó la Ley de
Darcy (Ec.1), que relaciona la densidad de flujo de permeado con la
presión transmembranal, la viscosidad de la disolución alimento y
resistencia hidráulica total al paso de fluido. Esta caracterización se
llevó a cabo tanto con las membranas nuevas como con las
membranas limpias tras el protocolo de limpieza.
tR·
PJ
Ec. 1
Donde J es la densidad de flujo de permeado, ΔP es la presión
transmembranal, μ es la viscosidad de la disolución alimento y Rt es
la resistencia hidráulica total.
En el caso del ensayo de caracterización de las membranas nuevas,
la disolución alimento fue agua desionizada y, por tanto, la
resistencia hidráulica corresponde a la resistencia intrínseca de la
membrana (Rm).
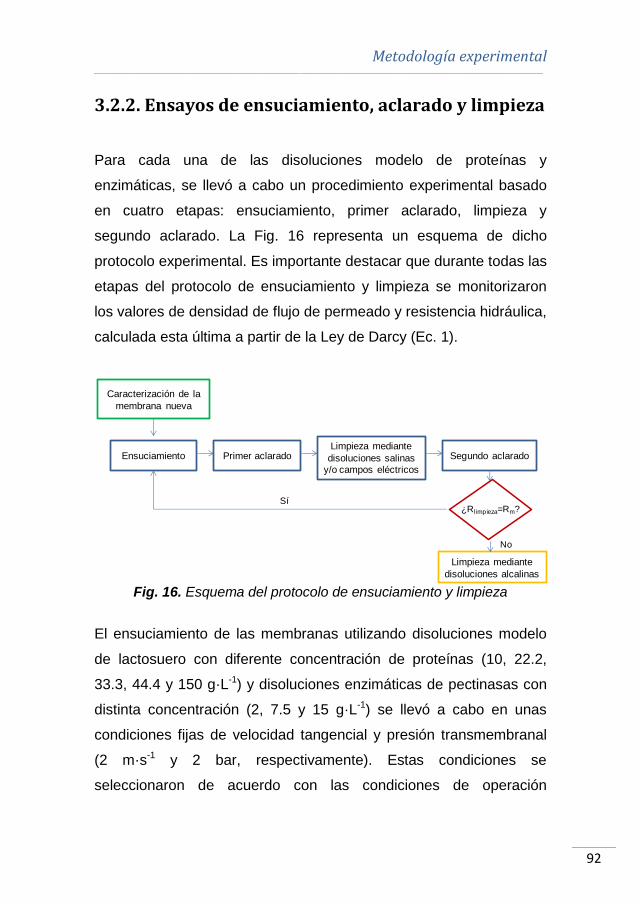
Metodología experimental ________________________________________________________________________________________________________________________________________________________
92
3.2.2. Ensayos de ensuciamiento, aclarado y limpieza
Para cada una de las disoluciones modelo de proteínas y
enzimáticas, se llevó a cabo un procedimiento experimental basado
en cuatro etapas: ensuciamiento, primer aclarado, limpieza y
segundo aclarado. La Fig. 16 representa un esquema de dicho
protocolo experimental. Es importante destacar que durante todas las
etapas del protocolo de ensuciamiento y limpieza se monitorizaron
los valores de densidad de flujo de permeado y resistencia hidráulica,
calculada esta última a partir de la Ley de Darcy (Ec. 1).
Fig. 16. Esquema del protocolo de ensuciamiento y limpieza
El ensuciamiento de las membranas utilizando disoluciones modelo
de lactosuero con diferente concentración de proteínas (10, 22.2,
33.3, 44.4 y 150 g·L-1) y disoluciones enzimáticas de pectinasas con
distinta concentración (2, 7.5 y 15 g·L-1) se llevó a cabo en unas
condiciones fijas de velocidad tangencial y presión transmembranal
(2 m·s-1 y 2 bar, respectivamente). Estas condiciones se
seleccionaron de acuerdo con las condiciones de operación
Caracterización de la
membrana nueva
Ensuciamiento Primer aclaradoLimpieza mediante
disoluciones salinas
y/o campos eléctricos
Segundo aclarado
¿Rlimpieza=Rm?Sí
Limpieza mediante
disoluciones alcalinas
No
Capítulo III ________________________________________________________________________________________________________________________________________________________
93
empleadas por otros autores en trabajos previos sobre UF de
lactosuero (Matzinos y Álvarez, 2002).
Durante esta etapa realizada con las disoluciones modelo de
lactosuero, se tomaron muestras de la corriente permeado para
determinar la concentración de proteínas presentes en la misma y, a
partir de estos resultados, calcular el valor de coeficiente de rechazo
de las membranas utilizadas, de acuerdo con la Ec. 2.
1001 ·C
C(%) chazoRe
b
p
Ec. 2
Donde Rechazo es el coeficiente de rechazo, Cp es la concentración
de proteínas en la corriente permeado y Cb es la concentración de
proteínas en el seno de la disolución alimento.
Tras esta etapa, se realizó un aclarado con agua osmotizada a una
presión transmembranal menor que la utilizada en la etapa anterior
(1 bar) y a diferentes velocidades tangenciales (entre 1.2 y 4.2 m·s-1)
para estudiar la influencia de este último parámetro sobre la eficacia
del proceso de aclarado. Algunos autores han demostrado que la
utilización de presiones transmembranales bajas durante el aclarado
y limpieza de las membranas favorecen la descompresión de la capa
de ensuciamiento formada durante la etapa de ensuciamiento y por
tanto, facilitan su eliminación desde la superficie de la membrana
hacia el seno de la disolución (Blanpain-Avet et al., 2009).
Metodología experimental ________________________________________________________________________________________________________________________________________________________
94
Después del aclarado, las membranas se limpiaron utilizando
diferentes tipos de sales y condiciones de operación: concentración
de sal (0 – 100 mM), temperatura de la disolución de limpieza (25 –
80 ºC) y velocidad tangencial (1.2 – 4.2 m·s-1). De esta manera, se
investigó la influencia de todos estos parámetros sobre el proceso de
limpieza y su eficacia. Finalmente, se procedió a un segundo
aclarado de las membranas con el objetivo de eliminar los restos de
agentes de limpieza de la superficie de la membrana.
Tal y como se ha comentado anteriormente en este Capítulo, en el
caso en el cual la resistencia de las membranas después del último
aclarado no coincidiera con la resistencia hidráulica original de las
mismas, éstas se sometieron a un proceso de limpieza convencional
con álcalis: NaOH a pH 11 y 45 ºC en el caso de las membranas
poliméricas y NaOCl a pH 11 (ajustado con NaOH) a 50 – 60 ºC en el
caso de las membranas cerámicas. Dichos protocolos son los
recomendados por los fabricantes de cada tipo de membranas.
3.2.3. Determinación de la eficacia hidráulica del
proceso de limpieza
De acuerdo con los métodos hidráulicos de evaluación de la eficacia
del proceso de limpieza, la eficacia del mismo se determinó mediante
la comparación de la resistencia intrínseca de la membrana con la
obtenida tras el segundo aclarado (R2a), de acuerdo con la Ec. 3.
Otros autores (Matzinos y Álvarez, 2002; Daufin et al., 2001;
Muthukumaran et al., 2007) habían propuesto ecuaciones similares
para calcular la eficacia del proceso de aclarado y limpieza.
Capítulo III ________________________________________________________________________________________________________________________________________________________
95
1002 ·RR
RR(%)EHL
mf
af
Ec. 3
Donde EHL es la eficacia hidráulica de limpieza y Rf es la resistencia
hidráulica tras la etapa de ensuciamiento.
Así pues, tras finalizar el protocolo de limpieza se determinó el valor
de EHL en cada una de las condiciones de operación ensayadas. En
algunos de estos casos, como por ejemplo en las condiciones
óptimas de limpieza para disoluciones de BSA y disoluciones
enzimáticas, se compararon los valores de EHL obtenidos con los
resultados de eficacia de limpieza determinados mediante métodos
químicos (AFM, SEM y ATR-FTIR). De esta forma, se confirma la
validez del método hidráulico empleado para evaluar la eficacia del
proceso de limpieza. Esta comparación y sus resultados se detallan
en el Capítulo V de esta Tesis Doctoral.
3.2.4. Determinación de la eficacia química del
proceso de limpieza
La evaluación de la eficacia del proceso de limpieza mediante
métodos químicos se basa en la determinación de la cantidad de
especies responsables del ensuciamiento que permanecen sobre la
superficie de la membrana después del proceso de limpieza. Para
llevar a cabo dicha evaluación, se utilizan diversas técnicas de
espectroscopía, algunas de las cuales permiten, además, analizar y
comparar las características morfológicas de la membrana nueva, de
la capa de ensuciamiento y de la membrana limpia.
Metodología experimental ________________________________________________________________________________________________________________________________________________________
96
En el caso de las membranas ensuciadas con disoluciones de BSA,
las imágenes y resultados obtenidos mediante las técnicas SEM,
EDX y AFM se realizaron en el Servicio de Microscopía Electrónica
de la Universitat Politècnica de València, mientras que la
determinación mediante ATR-FTIR se llevó a cabo en el Centro de
Biomateriales y Energía Tisular de la misma universidad. Por otra
parte, en el caso de las membranas ensuciadas con disoluciones
enzimáticas, las medidas de AFM y ATR-FTIR se realizaron en el
Institute on Membrane Technology (Istituto per la Tecnologia delle
Membrane-Consiglio Nazionale delle Ricerche, ITM-CNR) de la
Università della Calabria durante la estancia de investigación. En
todos los casos, se determinó la composición de las membranas
nuevas, tras la etapa de ensuciamiento y tras el segundo aclarado
una vez finalizado el protocolo de limpieza.
3.2.4.1. SEM y EDX
Estas técnicas se realizaron en un microscopio JSM6300 (Jeol Ltd.,
Japón) con detector de rayos X (Oxford Instruments, Reino Unido). El
funcionamiento del microscopio SEM se basa en el barrido de un haz
de electrones sobre un área de tamaño deseado (en función del
número de aumentos seleccionado). A continuación, el detector de
rayos X recoge dichos rayos procedentes de cada uno de los puntos
de la superficie sobre los que ha pasado previamente el haz de
electrones. Teniendo en cuenta que la energía de cada rayo X viene
determinada por el tipo de elemento químico, se puede determinar
cualitativa y cuantitativamente la concentración de dichos elementos
en el área analizada.
Capítulo III ________________________________________________________________________________________________________________________________________________________
97
Dado que las muestras precisan ser conductoras para llevar a cabo
la determinación en el microscopio SEM, éstas se recubrieron con
una capa fina de carbono tras ser secadas en aire para permitir su
análisis (García-Ivars et al., 2014).
3.2.4.2. AFM
Las medidas mediante el microscopio AFM se realizaron en las dos
Universidades (Universitat Politècnica de València y Università della
Calabria) mediante el método “tapping” en aire con un microscopio
MultiMode (Digital Instruments, VEECO Metrology Group, EE.UU.)
equipado con el software NanoScope para determinar los parámetros
característicos de la topografía de la muestra, como por ejemplo, la
rugosidad de la superficie. En este caso, una punta afilada situada en
el extremo de una palanca flexible recorre la superficie de un área de
tamaño seleccionado aplicando de manera constante una pequeña
fuerza de interacción. Dicha punta toca de manera intermitente la
superficie de la muestra, eliminado las fuerzas laterales y de presión
que podrían dañarla y reducir la resolución de la imagen. El barrido
que realiza la punta lo realiza un escáner piezo-eléctrico y la
interacción entre la punta de la palanca y la muestra se recoge en un
detector fotodiodo. A partir de la diferencia de voltaje que detectan
los diferentes segmentos del fotodiodo se pueden evaluar los
cambios de inclinación o amplitud de oscilación de la punta,
quedando representada la topografía de la muestra analizada (De
Oliveira, 2012). De las membranas utilizadas, se analizaron muestras
de dimensiones 5×5 μm.
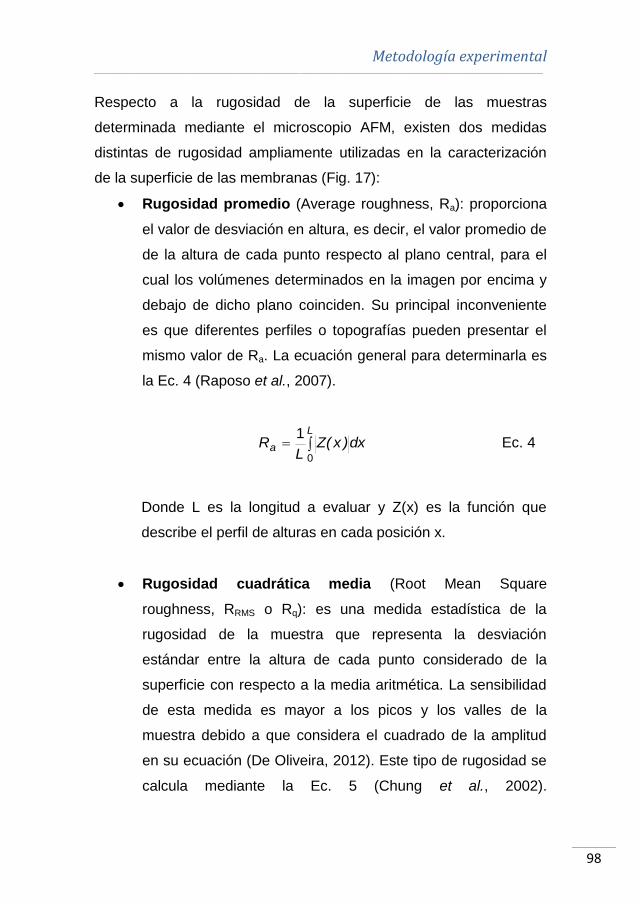
Metodología experimental ________________________________________________________________________________________________________________________________________________________
98
Respecto a la rugosidad de la superficie de las muestras
determinada mediante el microscopio AFM, existen dos medidas
distintas de rugosidad ampliamente utilizadas en la caracterización
de la superficie de las membranas (Fig. 17):
Rugosidad promedio (Average roughness, Ra): proporciona
el valor de desviación en altura, es decir, el valor promedio de
de la altura de cada punto respecto al plano central, para el
cual los volúmenes determinados en la imagen por encima y
debajo de dicho plano coinciden. Su principal inconveniente
es que diferentes perfiles o topografías pueden presentar el
mismo valor de Ra. La ecuación general para determinarla es
la Ec. 4 (Raposo et al., 2007).
L
a dx)x(ZL
R0
1
Ec. 4
Donde L es la longitud a evaluar y Z(x) es la función que
describe el perfil de alturas en cada posición x.
Rugosidad cuadrática media (Root Mean Square
roughness, RRMS o Rq): es una medida estadística de la
rugosidad de la muestra que representa la desviación
estándar entre la altura de cada punto considerado de la
superficie con respecto a la media aritmética. La sensibilidad
de esta medida es mayor a los picos y los valles de la
muestra debido a que considera el cuadrado de la amplitud
en su ecuación (De Oliveira, 2012). Este tipo de rugosidad se
calcula mediante la Ec. 5 (Chung et al., 2002).

Capítulo III ________________________________________________________________________________________________________________________________________________________
99
N
ZZR
avgiq
2
Ec. 5
Donde Zi es el valor de altura medido en cada punto, Zavg es
el promedio de valores de altura medidos en toda el área
seleccionada y N es el número de puntos considerados en el
área analizada.
Fig. 17. Representación de las medidas de rugosidad Ra y Rq
3.2.4.3. ATR-FTIR
El equipo de ATR-FTIR utilizado en la Universitat Politècnica de
València para analizar las membranas en las que se habían utilizado
disoluciones de BSA consistió en un espectrómetro Thermo Nicolet®
Nexus (Thermo Fisher Scientific, EE.UU.), mientras que el equipo
utilizado en el ITM-CNR fue un espectrómetro Spectrum One (Perkin-
Elmer, EE.UU.).
La técnica FTIR se basa en la medida de absorción en la región del
infrarrojo medio (a longitudes de onda entre 400 y 4000 cm-1) de la
muestra problema, que puede encontrarse en cualquiera de los tres
Metodología experimental ________________________________________________________________________________________________________________________________________________________
100
estados característicos (sólido, líquido y gas). Puesto que la
combinación y uniones entre los átomos que constituyen un material
son características del mismo, los picos de absorción
correspondientes a las frecuencias de vibración entre los enlaces de
los átomos de la muestra a analizar permiten determinar el espectro
de infrarrojo de la misma. Dado que dichas bandas de absorbancia
tienen lugar a longitudes de onda concretas de la región del
infrarrojo, es posible identificar cualitativamente los grupos
funcionales presentes en la muestra problema, así como cuantificar
la cantidad de material presente en la misma mediante la evaluación
de la altura de los picos de absorbancia. En la técnica ATR-FTIR, el
haz de radiación infrarroja emitido se refleja internamente en la
interfaz entre la muestra y un medio auxiliar, que debe presentar un
índice de refracción muy elevado (Linderberg et al., 2012). En el caso
de los equipos utilizados, el medio auxiliar consiste en un cristal de
ZnSe.
3.2.5. Técnicas analíticas utilizadas
3.2.5.1. Determinación de la concentración de proteínas
en las corrientes permeado y rechazo
Existen diversos métodos disponibles para determinar la
concentración de proteínas en una muestra o disolución. Estos
métodos se basan en la detección de aminoácidos característicos de
las proteínas mediante medida de absorbancia o bien, mediante
interacciones entre estos aminoácidos u otros enlaces peptídicos y
determinados elementos, como cobre o pigmentos. La elección de
Capítulo III ________________________________________________________________________________________________________________________________________________________
101
uno u otro método viene determinada por la cantidad de proteína en
la muestra a medir, el límite de detección o linealidad del método, su
facilidad de uso e, incluso, el tiempo requerido desde la preparación
de la muestra hasta la obtención del resultado final (Dean Goldring,
2012).
Uno de estos métodos es el llamado método de medida directa, que
consiste en la determinación espectrofotométrica de la absorbancia
de la muestra a una longitud de onda de 280 nm. En este valor, los
residuos de aminoácidos compuestos por anillos aromáticos en la
estructura primaria de las proteínas absorben luz. Estos aminoácidos
son, por orden de contribución al fenómeno, triptófano (con una
longitud de onda máxima de 279.8 nm), tirosina (274.6 nm) y
fenilalanina (279 nm). El método de medida directa se basa en la Ley
de Lambert-Beer, según la cual la absorbancia de un compuesto es
proporcional a su concentración. La principal ventaja de este método
radica en el amplio rango de masa de proteínas que puede ser
detectada, desde 20 hasta 3000 μg (Dean Goldring, 2012). Este
método fue utilizado para determinar la concentración de proteína
presente en la corriente permeado durante la etapa de ensuciamiento
llevada a cabo con disoluciones de BSA y BSA con CaCl2, dado que
no existían otras especies excepto la propia proteína que interfiriera
en la medida realizada. Las rectas de calibrado obtenidas mediante
un espectrofotómetro UV-visible HP 8453 (Hewlett Packard, EE.UU.)
a una longitud de onda de 278 nm (correspondiente a la absorción
máxima de las disoluciones estudiadas) que relacionan la
absorbancia de la muestra con la concentración de proteínas
Metodología experimental ________________________________________________________________________________________________________________________________________________________
102
presente en la misma presentaron un coeficiente de regresión R2
mayor de 0.99.
Otro método ampliamente empleado en la cuantificación de proteínas
es el basado en la reacción de las mismas con el ácido bicinconínico
(Morton y Evans, 1992; Smith et al., 1985; Krieg et al., 2005;
Thanhaeuser et al., 2015). Este método colorimétrico se basa en la
formación del complejo Cu+2-proteína (ver Fig. 18) en condiciones
alcalinas mediante el uso de un reactivo de trabajo, mezcla de una
disolución de ácido bicinconínico, carbonato sódico, tartrato sódico y
bicarbonato sódico en NaOH 0.1 N con una disolución de sulfato de
cobre (II) pentahidrato al 4 %p/v, en una proporción 50:1. A
continuación, tiene lugar la reducción de Cu+2 a Cu+1, siendo
proporcional esta reducción a la cantidad de proteína presente en la
muestra. De acuerdo con el protocolo del ensayo BCA estándar, se
mezclan 0.1 mL de muestra con 2 mL del reactivo de trabajo. Esta
mezcla se incuba a 37 ºC durante 30 min y, posteriormente, se enfría
a temperatura ambiente. Una vez hecho esto, la absorbancia de la
mezcla se mide en un espectrofotómetro a 562 nm y se comparan los
resultados obtenidos con la recta de calibrado previamente realizada
a diferentes concentraciones conocidas de proteína. El rango de
linealidad de este método varía entre 200 y 1000 μg·mL-1 y ente sus
ventajas destacan su facilidad de uso, la alta estabilidad del color del
complejo formado o la mayor sensibilidad respecto a otros métodos
colorimétricos como el método de Lowry, también basado en la
formación del complejo Cu+2-proteína (www.sigmaaldrich.com). Este
método fue utilizado para determinar la concentración de proteína
presente en la disolución enzimática utilizada. La recta de calibrado
Capítulo III ________________________________________________________________________________________________________________________________________________________
103
obtenida a 562 nm presentó una precisión mayor de 0.99 en términos
de R2.
Finalmente, otro de los métodos colorimétricos utilizados en la
presente Tesis Doctoral es el método Bradford (Bradford, 1976; Ku et
al., 2013; Qian et al., 2014). Dicho método se basa en la formación
de un complejo entre el reactivo Coomassie Brilliant Blue G-250 (ver
Fig. 18) y las proteínas presentes en la muestra problema, virando el
color del reactivo de marrón rojizo a azul. El complejo formado es el
responsable de un aumento de la absorbancia de la muestra a
longitudes de onda entre 465 y 595 nm, lo que permite su detección
espectrofotométrica. El rango válido de medida varía entre 0.1 y
1.4 mg·mL-1 de proteína en la muestra problema. Según el protocolo
de medida estándar, 0.1 mL de la muestra se mezclan con 3 mL de
reactivo Bradford. Una vez incubada la mezcla a temperatura
ambiente entre 5 y 45 min, se miden la misma en un
espectrofotómetro a una longitud de onda de 595 nm. Al igual que en
el método BCA, la concentración de proteína en la muestra se
determina mediante la comparación de la absorbancia medida con la
obtenida en la recta de calibrado realizada previamente. La principal
ventaja de este método radica en que no es necesario preparar
diluciones del reactivo de trabajo y que es compatible con agentes
reductores (generalmente utilizados para estabilizar proteínas en
disolución), a diferencia del método BCA (www.sigmaaldrich.com). El
método Bradford fue empleado en la cuantificación de proteínas en la
corriente permeado obtenida en la etapa de ensuciamiento con
disoluciones de WPC. Las rectas de calibrado obtenidas presentaron
un valor de R2 mayor de 0.99.
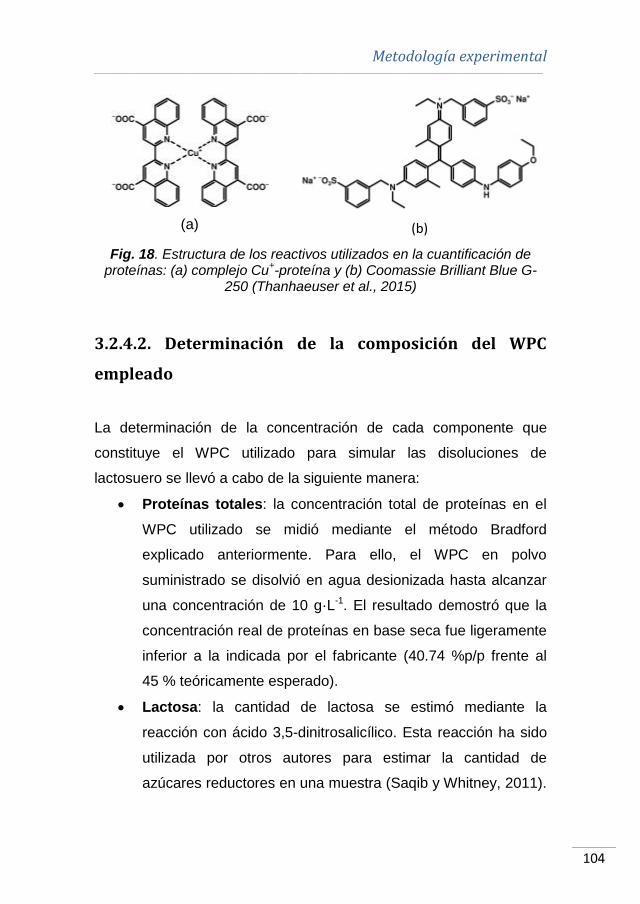
Metodología experimental ________________________________________________________________________________________________________________________________________________________
104
(a)
(b)
Fig. 18. Estructura de los reactivos utilizados en la cuantificación de proteínas: (a) complejo Cu
+-proteína y (b) Coomassie Brilliant Blue G-
250 (Thanhaeuser et al., 2015)
3.2.4.2. Determinación de la composición del WPC
empleado
La determinación de la concentración de cada componente que
constituye el WPC utilizado para simular las disoluciones de
lactosuero se llevó a cabo de la siguiente manera:
Proteínas totales: la concentración total de proteínas en el
WPC utilizado se midió mediante el método Bradford
explicado anteriormente. Para ello, el WPC en polvo
suministrado se disolvió en agua desionizada hasta alcanzar
una concentración de 10 g·L-1. El resultado demostró que la
concentración real de proteínas en base seca fue ligeramente
inferior a la indicada por el fabricante (40.74 %p/p frente al
45 % teóricamente esperado).
Lactosa: la cantidad de lactosa se estimó mediante la
reacción con ácido 3,5-dinitrosalicílico. Esta reacción ha sido
utilizada por otros autores para estimar la cantidad de
azúcares reductores en una muestra (Saqib y Whitney, 2011).

Capítulo III ________________________________________________________________________________________________________________________________________________________
105
Para la preparación del reactivo de trabajo se mezclan 10 g
de DNS y 300 g de tartrato de sodio y potasio en 800 mL de
NaOH 0.5 N, ajustando el volumen total a 1 L con agua
ultrapura. A continuación, se añadieron 4 mL del reactivo de
trabajo a 1 mL de la muestra problema. Esta mezcla se
mantuvo en un baño de agua a más de 95 ºC durante 5 min,
para ser seguidamente transferida a un baño con hielo y,
posteriormente, colocada en un baño a una temperatura de
25 ºC. La absorbancia de la muestra se midió a 540 nm
utilizando el espectrofotómetro UV-visible anteriormente
citado.
Cenizas: El contenido en cenizas se calculó incinerando 1 g
del WPC suministrado en polvo en una mufla a 540 ºC
durante 1 h (Método Oficial de Análisis 930.30) (AOAC Official
Method 930.30, 1930).
Cationes: La concentración de distintos cationes se
determinó mediante cromatografía iónica con un cromatógrafo
790 Personal IC equipado con una columna catiónica
Metrosep C 2 150 (ambos de Metrohm, Suiza) (Lim et al.,
2008).
Aniones: La concentración de aniones se obtuvo mediante
kits de medida de cloruro y fosfatos (Mak et al., 2003). En
ambos casos, a 1 mL de la muestra preparada se adicionan
0.5 mL del reactivo de trabajo Cl-1K (en el caso de la
determinación de cloruros) y 5 gotas del reactivo P-2K junto a
1 dosis del reactivo P-3K (en el caso de la determinación de
fosfatos). Una vez transcurridos 5 min, tiempo necesario para
que la reacción entre la muestra problema y los reactivos de
Metodología experimental ________________________________________________________________________________________________________________________________________________________
106
trabajo del kit de fosfatos se produjera, se midieron ambas
mezclas en un fotómetro Spectroquant® NOVA 60 (Merck
Millipore, España). El fotómetro proporciona directamente el
valor de concentración de cada uno de los aniones.
Grasa: La concentración de grasa se midió con un equipo
MilkoScan FT120 (Gerber Instruments, Suiza). Este tipo de
equipos resulta especialmente apropiado para el análisis de
productos lácteos complejos mediante la medición de la
concentración de distintos componentes, entre ellos la grasa,
utilizando la técnica FTIR (Chessa et al., 2014).
3.2.6. Análisis computacional
La caracterización de los mecanismos de ensuciamiento de las
membranas se llevó a cabo mediante el ajuste de distintos modelos
matemáticos de UF a los datos experimentales obtenidos durante la
etapa de ensuciamiento. Este ajuste se realizó mediante el algoritmo
“Genfit” del software MathCad®. Dicho algoritmo minimiza la
diferencia entre los datos experimentales y los resultados predichos
por el modelo mediante una versión optimizada del método
Levenberg-Marquadt. La precisión del ajuste de los distintos modelos
matemáticos se evaluó en función del coeficiente de regresión R2 y la
desviación estándar.
Por otra parte, el software Statgraphics® Centurion XVI fue utilizado
para determinar las ecuaciones que relacionan la eficacia del
proceso de limpieza con las variables del proceso, como la
temperatura, la concentración de NaCl y la velocidad tangencial,
Capítulo III ________________________________________________________________________________________________________________________________________________________
107
mediante análisis de regresión múltiple.
Finalmente, los algoritmos “pattern search” del software Matlab® y
“Solver” del software Microsoft Excel® permitieron obtener las
condiciones de operación óptimas durante la etapa de limpieza en
base a las ecuaciones obtenidas mediante el análisis de regresión
múltiple.
Metodología experimental ________________________________________________________________________________________________________________________________________________________
108
3.3. BIBLIOGRAFÍA
AFONSO A., MIRANDA J.M. y CAMPOS J.B.L.M. (2009). “Numerical
study of BSA ultrafiltration in the limiting flux regime – effect of
variable physical properties” en Desalination, vol. 249, p. 1139-1150.
AOAC Official Method 930.30 (1930). “Ash of Dried Milk”. First Action
1930.
BLANPAIN-AVET P., MIGDAL J.F. y BÉNÉZECH T. (2009).
“Chemical cleaning of a tubular ceramic microfiltration membrane
fouled with a whey protein concentrate suspension – characterization
of hydraulic and chemical cleanliness” en Journal of Membrane
Science, vol. 337, p. 153-174.
BRADFORD M.M. (1976). “A rapid and sensitive method for the
quantitation of microgram quantities of protein utilizing the principle of
protein-dye binding” en Analytical Biochemistry, vol. 72, p. 248-254.
CHESSA S. et al. (2014). “Selection for milk coagulation properties
predicted by Fourier transform infrared spectroscopy in the Italian
Holstein-Friesian breed” en Journal of Dairy Science, vol. 97, p. 4512-
4521.
CHUNG T.-S. et al. (2002). “Visualization of the effect of die shear
rate on the outer surface morphology of ultrafiltration membranes by
AFM” en Journal of Membrane Science, vol. 196, p. 251-266.
DAUFIN G. et al. (2001). “Recent and emerging applications of
membrane processes in the food and dairy industry” en Food
Bioproducts Processing, vol. 79, p. 89-102.
DEAN GOLDRING J.P. (2012). “Protein quantification methods to
determine protein concentration prior to electrophoresis” en Kurien
Capítulo III ________________________________________________________________________________________________________________________________________________________
109
B.T. y Scofield R.H. Protein electrophoresis. Methods and protocols.
Nueva York: Springer.
DE OLIVEIRA R.R.L. (2012). “Measurement of the nanoscale
roughness by atomic forcé microscopy: Basic principles and
applications” en Bellito V. Atomic Force Microscopy – Imaging,
Measuring and Manipulating Surfaces at the Atomic Scale. InTech.
(publicación online).
GARCÍA-IVARS J. et al. (2014). “Development of fouling-resistant
polyethersulfone ultrafiltration membranes via surface UV
photografting with polyethylene glicol/aluminum oxide nanoparticles“
en Separation and Purification Technology, vol. 135, p. 88-99.
KRIEG R.C. et al. (2005). “Protein quantification and its tolerance for
different interfering reagents using the BCA-method with regard to 2D
SDS PAGE” en Journal of Biochemical and Biophysical Methods, vol.
65, p. 13-19.
KU H.-K. et al. (2013). “Interpretation of protein quantitation using the
Bradford assay: Comparison with two calculation models” en
Analytical Biochemistry, vol. 434, p. 178-180.
LIM J. et al. (2008). “Biochemical indication of microbial mass
changes using ATP and DNA measurement in biological treatment of
thiocyanate” en Applied Microbiology and Biotechnology, vol. 80, p.
525-230.
LINDERBERG C. et al. (2012). “ATR-FTIR Spectroscopy” en
Chianese A. y Kramer H.J.M. Industrial Crystallization Process
Monitoring. Alemania: Wiley-VCH.
MAK W.C. et al. (2003). “Biosensor for rapid phosphate monitoring in
a sequencing batch reactor (SBR) system” en Biosensors and
bioelectronics, vol. 19, p. 233-237.
Metodología experimental ________________________________________________________________________________________________________________________________________________________
110
MATZINOS P. y ÁLVAREZ R. (2002). “Effect of ionic strength on
rinsing and alkaline cleaning of ultrafiltration inorganic membranes
fouled with whey proteins” en Journal of Membrane Science, vol. 208,
p. 23-20.
MERCK MILLIPORE. <http://www.merckmillipore.com/> [Consulta: 1
de junio de 2015].
MORTON R.E. y EVANS T.A. (1992). “Modification of the
bicinchoninic acid protein assay to eliminate lipid interference in
determining lipoprotein protein content” en Analytic Biochemistry, vol.
204, p. 332-334.
MUTHUKUMARAN S. et al. (2007). “The application of ultrasound to
dairy ultrafiltration: the influence of operating conditions” en Journal of
Food Engineering, vol. 81, p. 364-373.
NUCCI N.V. y VANDERKOOI J.M. (2008). “Effects of salts of the
Hofmeister series on the hydrogen bond network of water” en Journal
of Molecular Liquids, vol. 143, p. 160-170.
PANREAC QUÍMICA S.L.U. <http://www.panreac.es/es/> [Consulta:
1 de junio de 2015].
QIAN X. et al. (2014). “Analysis of the interferences in quantitation of
a site-specifically PEGylated exedin-4 analog by the Bradford
method” en Analytical Biochemistry, vol. 465, p. 50-52.
RAPOSO M., FERREIRA Q. y RIBEIRO P.A. (2007). “A guide for
atomic force microscopy analysis of soft condensed matter” en
Mendez-Vilas A. Díaz J. Modern research and educational topics in
microscopy. España: Formatex.
SAQIB A.A.N. y WHITNEY P.J. (2011). “Differential behaviour of the
dinitrosalicylic acid (DNS) reagent towards mono- and di-saccharide
sugars” en Biomass and Bioenergy, vol. 35, p. 4748-4750.
Capítulo III ________________________________________________________________________________________________________________________________________________________
111
SIGMA ALDRICH Co. LLC.
<http://www.sigmaaldrich.com/spain.html> [Consulta: 1 de junio de
2015].
SMITH P.K. et al. (1985). “Measurement of protein using
bicinchoninic acid” en Analytical Biochemistry, vol. 150, p. 76-85.
SUTTIPRASIT P., KRISDHASIMA V. y MCGUIRE J. (1992). “The
surface activity of α-lactabumin, β-lactoglobulin and bovine serum
albumin” en Journal of Colloid and Interface Science, vol. 154, p. 316-
326.
THANHAEUSER S.M., WIESER H. y KOEHLER P. (2015).
“Spectrophotometric and fluorimetric quantitation of quality-related
protein fractions of wheat flour” en Journal of Cereal Science, vol. 62,
p. 58-65.
WANG Y.-N. y TANG C.Y. (2011). “Protein fouling of nanofiltration,
reverse osmosis and ultrafiltration membranes – the role of
hydrodynamic conditions, solution chemistry and membrane
properties” en Journal of Membrane Science, vol. 376, p. 275-282.
Modelización del
ensuciamiento de
las membranas

Modelización del ensuciamiento de las membranas ________________________________________________________________________________________________________________________________________________________
114
4.1. MECANISMOS DE ENSUCIAMIENTO DE
MEMBRANAS DE ULTRAFILTRACIÓN
ENSUCIADAS CON DISOLUCIONES MODELO DE
LACTOSUERO
El presente Capítulo consiste en una adaptación al formato de la
Tesis Doctoral del artículo titulado “Fouling mechanisms of
ultrafiltration membranes fouled with whey model solutions”,
publicado en la revista Desalination. En él, tres modelos matemáticos
de UF se ajustaron a los datos experimentales obtenidos durante la
etapa de ensuciamiento con membranas de 5, 30 y 15 kDa, con el fin
de determinar los mecanismos de ensuciamiento responsables del
ensuciamiento de dichas membranas. Los datos bibliográficos del
artículo se destacan a continuación:
Autores: M.-J. Corbatón-Báguena, S. Álvarez-Blanco, M.-C.
Vincent-Vela
Título: Fouling mechanisms of ultrafiltration membranes fouled
with whey model solutions
Editorial: Elsevier
Revista: Desalination año: 2015 vol. 360 p. 87-96
Doi: http://dx.doi.org/10.1016/j.desal.2015.01.019
Capítulo IV ________________________________________________________________________________________________________________________________________________________
115
Fouling mechanisms of ultrafiltration membranes
fouled with whey model solutions
María-José Corbatón-Báguena*, Silvia Álvarez-Blanco, María-Cinta
Vincent-Vela
Department of Chemical and Nuclear Engineering, Universitat
Politècnica de València, C/Camino de Vera s/n 46022 Valencia,
Spain
*Corresponding author: [email protected]
Tel: +34963877000 (Ext.: 76383)
Fax: +34963877639 (Ext.: 77639)
Abstract
In this work, three ultrafiltration (UF) membranes with different
molecular weight cut-offs (MWCOs) and made of different materials
were fouled with several whey model solutions that consisted of
bovine serum albumin (BSA) (1 % w/w), BSA (1 % w/w) and CaCl2
(0.06 % w/w in calcium) and whey protein concentrate (WPC) with a
total protein content of 45 % w/w at three different concentrations
(22.2, 33.3 and 44.4 g·L-1). The influence of MWCO and membrane
material on the fouling mechanism dominating the UF process was
investigated. Experiments were performed using two flat-sheet
organic membranes and a ceramic monotubular membrane whose
MWCOs were 5, 30 and 15 kDa, respectively. Hermia’s models
Modelización del ensuciamiento de las membranas ________________________________________________________________________________________________________________________________________________________
116
adapted to crossflow UF, a combined model based on complete
blocking and cake formation equations and a resistance-in-series
model were fitted to permeate flux decline curves. The results
demonstrated that permeate flux decline was accurately predicted by
all the models studied. However, the models that fitted the best to
permeate flux decline experimental data were the combined model
and the resistance-in-series model. Therefore, complete blocking and
cake formation were the predominant mechanisms for all the
membranes and feed solutions tested.
Keywords: Ultrafiltration; whey model solutions; mathematical
models; fouling mechanisms.
4.1.1. Introduction
Ultrafiltration (UF) membranes have been widely used in dairy
industries for several applications such as preconcentration of milk,
milk dehydration, fractionation of whey, purification of whey proteins,
enrichment of micellar casein for the manufacture of milk, etc. (Nigam
et al., 2008; Kazemimoghadam and Mohammadi, 2007).
However, one of the major problems in the UF processes applied in
dairy industry is membrane fouling. Among the different substances
that are present in milk and whey, proteins are the main responsible
for membrane fouling (Argüello et al., 2003). The most important
consequence of fouling is the gradual permeate flux decline during
filtration time. This effect depends on different parameters, such as
operating conditions of the UF process (crossflow velocity,
Capítulo IV ________________________________________________________________________________________________________________________________________________________
117
transmembrane pressure, feed concentration and temperature),
interactions between foulants and the membrane surface or
membrane characteristics (hydrophilicity, pore size and porosity)
(Nigam et al., 2008; Wang et al., 2012).
According to the literature, membrane fouling mechanisms can be
divided in several types. When the solute molecules are smaller than
or similar to the membrane pore size, these molecules can penetrate
inside the membrane pores, reducing their effective radius gradually
(adsorptive fouling) or causing the entire pore to be completely
blocked (pore blocking mechanism) (Salahi et al., 2010; Ruby
Figueroa et al., 2011). If solute molecules are much higher than
membrane pores, they are deposited on membrane surface. In some
cases, the deposited fouling layer may form a cake layer (Tien and
Ramarao, 2006; Kim and DiGiano, 2009).
Because of the technical and economical importance of permeate flux
decline, determining the optimum operating conditions to minimize
fouling and obtaining a model to predict permeate flux decline with
time are key steps in UF processes. Previous studies found in the
literature have developed permeate flux decline models for UF
processes (Ho and Zydney, 2000; Bhattacharya et al., 2001; Duclos-
Orsello et al., 2006; Peterson et al., 2007; Yee et al., 2009). Among
them, empirical models are the most often used due to their high
prediction accuracy because they describe experimental results by
fitting a mathematical equation to the data obtained without
considering any theoretical parameter (examples of these models are
those provided by regression analysis) (Baranyi et al., 1996).
Modelización del ensuciamiento de las membranas ________________________________________________________________________________________________________________________________________________________
118
However, as the theoretical description of fouling phenomena and
mechanisms is not reflected on the mathematical equation proposed
by this type of models, the relationship between permeate flux decline
and the fouling mechanism involved in the UF process cannot be
explained with empirical models. On the other hand, theoretical
models are able to explain the fouling phenomena during membrane
filtration, although they are less accurate. For those reasons, semi-
empirical models, which use simplified forms of scientific laws and
include a certain number of parameters with physical meaning are
more appropriate to provide accurate predictions of the permeate flux
decline and also to describe the fouling mechanism at the same time
(Salahi et al., 2010; Vincent Vela et al., 2009; Mah et al., 2012).
Although several mathematical models can be found in the literature
to explain the fouling mechanisms affecting UF membranes (Ho y
Zydney, 2000; Yee et al., 2009; Bhattacharjee y Datta, 2003; Peng y
Tremblay, 2008), Hermia’s models (Hermia, 1982) applied to dead-
end filtration and their adaptations to crossflow UF are widely used to
fit the experimental data of different UF processes. Previous studies
found in the literature have demonstrated that Hermia’s models can
accurately predict permeate flux decline at different experimental
conditions. Mohammadi and Esmaeelifar (2005) analyzed the fouling
mechanisms involved in the UF of wastewaters from a vegetable oil
factory working at 3 bar and 0.5 m·s-1 with a 30 kDa polysulfone
membrane. Their results demonstrated that fouling was due to the
cake layer formation mechanism, achieving a value of R2 of 0.99.
Vincent Vela et al. (2009) investigated the fouling mechanisms
involved in PEG UF using a ceramic membrane of 15 kDa. They

Capítulo IV ________________________________________________________________________________________________________________________________________________________
119
obtained that intermediate blocking model was dominant for a
transmembrane pressure of 3 bar and a crossflow velocity of 1 m·s-1
and in the case of 4 bar and 2 m·s-1, with values of R2 of 0.980 and
0.979, respectively. Salahi et al. (2010) studied the UF of oily
wastewaters using a polyacrylonitrile membrane of 20 kDa at different
transmembrane pressures (1.5, 3 and 4.5 bar) and crossflow
velocities (0.25, 0.75 and 1.25 m·s-1). For all the experimental
conditions tested, the cake layer formation model followed by the
intermediate blocking model were the models that fitted the best, with
values of R2 ranging from 0.9852 to 0.9999 in the case of the cake
layer formation model and ranging from 0.8710 to 0.9321 for the
intermediate blocking model. Kaya et al. (2010) applied conventional
Hermia’s models to predict the fouling mechanism of two
nanofiltration membranes (0.4 and 1 kDa) using a paper machine
circulation wastewater as feed solution. The best fitting accuracy
(R2 = 0.985) was obtained for the cake layer filtration mechanism
followed by the intermediate blocking mechanism (R2 = 0.982) at a
transmembrane pressure of 8 bar.
De la Casa et al. (2008) combined two fouling mechanisms of
Hermia’s models. They proposed two different combinations: the first
one considers that only a fraction of membrane surface pores (α) is
completely blocked (complete blocking model equation) while part of
the foulant molecules may pass through the membrane and be
adsorbed on the pore walls that were previously unblocked (1-α)
(standard blocking model equation). The second combination takes
into account that a cake layer of foulant molecules (cake layer
formation model equation) can be formed on the previously deposited

Modelización del ensuciamiento de las membranas ________________________________________________________________________________________________________________________________________________________
120
molecules that have previously completely blocked the pores
(complete blocking model equation). The combined models were
fitted to the experimental data obtained during the microfiltration of
0.25 g·L-1 BSA solutions at a transmembrane pressure of 1 bar and a
crossflow velocity of 3.28 m·s-1.
On the other hand, the resistance-in-series model is one of the most
widely used empirical models due to its high accuracy. Choi et al.
(2000) applied a resistance-in-series model to batch microfiltration of
BSA. They considered that total resistance was the sum of the
membrane resistance, the cake layer resistance and the fouling
resistance. This last one represented the foulant deposits inside the
membrane pores. Flux decline predicted by the model was in a good
agreement with the experimental data obtained. Carrère et al. (2001)
used a resistance-in-series model to predict permeate flux decline of
lactic acid fermentation broths crossflow filtration at a transmembrane
pressure of 2 bar and a crossflow velocity of 4 m·s-1. Their model
considered four different resistances (the membrane resistance, the
resistance of the adsorbed molecules on the membrane surface, the
resistance due to concentration polarization and the cake layer
resistance). They obtained a good agreement between predicted and
experimental data.
The aim of this work was to investigate the fouling mechanisms that
affect different UF membranes (two polymeric membranes of 5 and
30 kDa and a ceramic monotubular membrane of 15 kDa) using
several whey model solutions (BSA (1 % w/w), BSA (1 % w/w) and
CaCl2 (0.06 % w/w in calcium) and whey protein concentrate (WPC)
Capítulo IV ________________________________________________________________________________________________________________________________________________________
121
with a protein content of 45 % at three different concentrations (22.2,
33.3 and 44.4 g·L-1)) as feed solutions during the fouling step. For this
purpose, several models were fitted to the experimental data obtained
during the UF of whey model solutions: Hermia’s models adapted to
crossflow UF, a resistance-in-series model and a combined model
based on the complete blocking and cake layer formation fouling
mechanisms. As a novelty, the last model was developed for this
work based on the Hermia’s equations adapted to crossflow for the
two fouling mechanisms considered. The influence of both membrane
MWCO and material on the dominating fouling mechanism was
investigated. The values of model parameters were estimated for the
models with the highest fitting accuracy. Different equations that
relate model parameters with operating conditions such as the
membrane roughness and the particle size and the protein
concentration of the feed solutions were developed.
4.1.2. Modelling
4.1.2.1. Hermia’s models
The models developed by Hermia (Hermia, 1982) are based on
classical constant pressure dead-end filtration equations. They
consider four main types of membrane fouling: complete blocking,
intermediate blocking, standard blocking and cake layer formation.
These models can be adapted to consider a crossflow configuration
(Vincent Vela, 2009; Field et al., 1995; de Barros et al., 2003).
Adapted models to crossflow ultrafiltration incorporate the flux
associated with the back-transport mass transfer, which is evaluated

Modelización del ensuciamiento de las membranas ________________________________________________________________________________________________________________________________________________________
122
at the steady-state (Jarusutthirak et al., 2007). The general equation
for Hermia’s models adapted to crossflow ultrafiltration is shown in
Eq. 6:
nss JJJK
dt
dJ 2 Eq. 6
where J is the permeate flux, K is a model constant and Jss is the
permeate flux when the steady-state is achieved.
According to the value of the parameter n, four different models can
be distinguished, based on four different fouling mechanisms:
complete blocking (n = 2), intermediate blocking (n = 1), standard
blocking (n = 1.5) and cake layer formation (n = 0).
In the complete blocking model, a solute molecule that settles on the
membrane surface blocks a pore entrance completely, but it cannot
penetrate inside the pores. This model assumes that a
monomolecular layer is formed on the membrane surface.
The intermediate blocking model is similar to the complete blocking
one because it considers that fouling takes place on the membrane
surface and not inside the pores. However, intermediate blocking
model allows solute molecules to deposit on previously settled ones.
The standard blocking model takes into account that all the
membrane pores have the same length and diameter and the solute
molecules are smaller than the membrane pore size. Therefore, these
molecules can penetrate inside the pores.
Capítulo IV ________________________________________________________________________________________________________________________________________________________
123
When the solute molecules are larger than the membrane pores, they
may accumulate on the membrane surface forming a permeable cake
layer. This is the basis of the cake layer formation model.
4.1.2.2. Combined model
A combined model based on the crossflow Hermia’s equations for
complete blocking and cake layer formation was used to predict the
permeate flux decline along the whole filtration curve. According to
other authors (Ho and Zydney, 2000; de la Casa et al., 2008; Field et
al., 1995), typical variation of permeate flux with time involves two
fouling mechanisms: a pore blocking during the first minutes of
operation that causes a rapid flux decline and a long term flux decline
due to the accumulation of foulant molecules on the membrane
surface that results in a cake layer formation.
Therefore, the decline in the permeate flux is the sum of the decline
due to the complete blocking model and the decline due to the cake
layer formation one. Therefore, two model constants have been taken
into account: Kc for the complete blocking model and Kg for the cake
layer formation model. The combined model also considers that only
a fraction of membrane pores are completely blocked (α). Thus, the
general equation of the combined model is Eq. 7:
model formation layer cakemodel blocking completemodel combined JJJ 1
Eq. 7
Modelización del ensuciamiento de las membranas ________________________________________________________________________________________________________________________________________________________
124
4.1.2.3. Resistance-in-series model
Resistance-in-series model is based on the Darcy’s law that relates
the permeate flux with the transmembrane pressure and the total
hydraulic resistance (Eq. 8):
R·
PJ
Eq. 8
where ΔP is the transmembrane pressure, μ is the feed solution
viscosity and R is the total hydraulic resistance.
The total hydraulic resistance can be expressed as the sum of
different resistances that take place during the UF process. In this
model, the membrane resistance, the cake layer resistance and the
adsorption and concentration polarization resistances were
considered (Eq. 9).
gam RRR·
PJ
Eq. 9
where Rm is the new membrane resistance, Ra is the resistance due
to adsorption on membrane surface and inside its pores and
concentration polarization and Rg is the cake layer resistance. In
addition, Ra can be fitted using an exponential equation (Choi et al.,
2000; Carrère et al., 2001). Therefore, the general equation for the
resistance-in-series model is Eq. 10:
Capítulo IV ________________________________________________________________________________________________________________________________________________________
125
gam Rbtexp'RR·
PJ
1 Eq. 10
where R’a is the steady-state adsorption and concentration
polarization resistance and b is the fouling rate due to adsorption.
4.1.3. Experimental
4.1.3.1. Materials
BSA, BSA and CaCl2 and WPC solutions were used as feed solutions
to perform the fouling experiments. All these products were supplied
in powder form, and were dissolved in deionized water until the
desired concentration was achieved for each feed solution. Mean
particle size of the feed solutions was determined using a Zetasizer
Nano ZS90 (Malvern Instruments Ltd., United Kingdom). BSA
(prepared by heat shock fractionation, lyophilized powder, 98 %
purity, A3733) was provided by Sigma-Aldrich (Germany), CaCl2 (95
% purity) was purchased from Panreac (Spain) and WPC with a total
protein content of 45 % was supplied by Reny Picot (Spain). The
composition of the WPC 45 % is shown in Table 9. The following
methods were used to estimate the amount of each component in the
WPC: bicinchoninic acid method (BCA, Sigma-Aldrich, Germany) for
total protein determination (Smith et al., 1985), 3,5-dinitrosalicylic acid
(DNS, Sigma-Aldrich, Germany) reaction to estimate the amount of
lactose (Miller, 1959), method of incineration in a muffle furnace at
540 ºC for ash content estimation according to the AOAC method

Modelización del ensuciamiento de las membranas ________________________________________________________________________________________________________________________________________________________
126
930.30 (AOAC Official Method 930.30, 1930) and cationic
chromatography using a “790 Personal IC” chromatograph equipped
with a Metrosep C 2 150 column (both supplied by Metrohm,
Switzerland) to determine the amount of individual cations. Fat
content was measured by a MilkoScan FT120 (Gerber Instruments,
Switzerland).
Table 9. Composition of WPC 45 % powder
Component Value
Total proteins (%) 38.16 ± 0.51
Lactose (%) 42.33 ± 0.16
Fat (%) 9.00 ± 0.45
Ash (%) 6.15 ± 0.07
Ca (%) 0.87 ± 0.08
Na (%) 1.34 ± 0.13
K (%) 1.57 ± 0.01
BSA and WPC are the most widely used compounds to prepare whey
model solutions for UF experiments (Nigam et al., 2008; Wang and
Tang, 2011; Afonso et al., 2009). In addition, CaCl2 was previously
used to study the effect of salts on protein fouling (Almécija et al.,
2009; Ang and Elimelech, 2007; Mo et al., 2008).
4.1.3.2. Membranes
Three UF membranes of different materials and MWCOs were used
in the experiments: a monotubular ZrO2-TiO2 INSIDE CéRAMTM
membrane of 15 kDa (TAMI Industries, France), a flat-sheet
polyethersulfone (PES) membrane of 5 kDa (Microdyn Nadir,
Germany) and a flat-sheet permanently hydrophilic polyethersulfone

Capítulo IV ________________________________________________________________________________________________________________________________________________________
127
(PESH) membrane of 30 kDa (Microdyn Nadir, Germany). The
ceramic membrane was 20 cm long with an internal diameter of
0.6 cm and an external diameter of 1 cm and its effective area was
35.5 cm2. Both polymeric membranes had an effective area of
100 cm2.
The membranes selected in this work were widely used for treating
wastewaters from different industrial fields, such as dye industries
(Kawiecka-Skowron and Majewska-Nowak, 2011), pulping plants
(Zhang et al., 2010), surface water (Kabsch-Korbutowicz and
Urbanowska, 2010), activated sludge plants (Karagündüz and Dizge,
2013) and dairy model solutions (Corbatón-Báguena et al., 2014a;
Corbatón-Báguena et al., 2014b), obtaining in all cases high rejection
values.
4.1.3.3. Experimental set-up
A VF-S11 UF plant (Orelis, France) was used to perform the fouling
experiments in a total recirculation mode. The main parts of the plant
are a 10 L feed tank, a temperature regulating system, a variable
speed volumetric pump to control the crossflow velocity, two
manometers at both sides of the membrane module to measure the
transmembrane pressure and a balance (0.001 g accuracy). This
experimental set-up is described in (Corbatón-Báguena et al., 2014a).
4.1.3.4. Experimental procedure
Prior to each fouling experiment, a permeability test with deionized
water was performed in order to determine the values of Rm for each
Modelización del ensuciamiento de las membranas ________________________________________________________________________________________________________________________________________________________
128
membrane used. These values were obtained from the Darcy’s law
above mentioned (Eq. 8).
Different feed solutions, which contained BSA (1 % w/w), BSA
(1 % w/w) and CaCl2 (0.06 % w/w in calcium) and WPC (22.2, 33.3
and 44.4 g·L-1), were considered in the fouling tests. Experimental
conditions during the fouling step were a transmembrane pressure of
2 bar, a crossflow velocity of 2 m·s-1 and a temperature of 25 ºC. The
pH values of the feed solutions prepared were in the range 5.97-6.5.
The duration of the fouling tests was 2 h. Those conditions were
selected according to previous studies on whey ultrafiltration
(Matzinos and Álvarez, 2002) because they are commonly used in
whey UF. Those conditions also resulted in severe membrane fouling
and thus, clear differences among model predictions can also be
achieved. During the experiments, the permeate flux was monitored.
After the fouling step, membranes were rinsed with deionized water
during 30 min at a temperature of 25 ºC, a transmembrane pressure
of 1 bar and a crossflow velocity of 2.18 m·s-1 (for the polymeric
membranes) and 4.20 m·s-1 (for the ceramic membrane). This
difference in the values of crossflow velocity was due to the higher
membrane roughness of the ceramic membrane in comparison to the
polymeric ones. NaCl solutions at a salt concentration of 5 mM, 50 ºC
and the same operating conditions of transmembrane pressure and
crossflow velocity as those used in the rinsing step were used to
clean the membranes during 60 min. After the cleaning procedure, a
last rinsing with deionized water was performed again. Further
description of the rinsing/cleaning protocols can be found in (Brião y
Tavares, 2012).

Capítulo IV ________________________________________________________________________________________________________________________________________________________
129
Finally, to recover the initial membrane permeability if the cleaning
procedure with NaCl was not completely effective, the ceramic
membrane was cleaned with NaClO aqueous solutions (10 % w/v,
Panreac, Spain) at 45 ºC and a pH of 11 and the polymeric
membranes were cleaned with NaOH aqueous solutions (98 % purity,
Panreac, Spain) at 45 ºC and a pH of 11.
Mathematical models were fitted to the experimental data using the
MathCad® Genfit algorithm. The Genfit algorithm minimizes the
overall difference between experimental results and the predicted
ones by means of an optimized version of the Levenberg-Marquadt
method. Fitting accuracy of each model was evaluated in terms of the
regression coefficient (R2) and the standard deviation (SD).
4.1.3.5. AFM measurements
Membranes roughness was measured by using a Multimode Atomic
Force Microscope with a NanoScope V controller (Veeco, Santa
Barbara, CA, USA) in a tapping mode of imaging at room conditions
and recorded images are shown in Fig. 19. Membrane roughness of
samples of 5 μm × 5 μm was measured and the results were
presented as the Root Mean Square roughness (Rq). It takes into
account the standard deviation of the surface height values in a
certain area, according to Eq. 11 (Chung et al., 2002):
p
avgiq
N
ZZR
2
Eq. 11
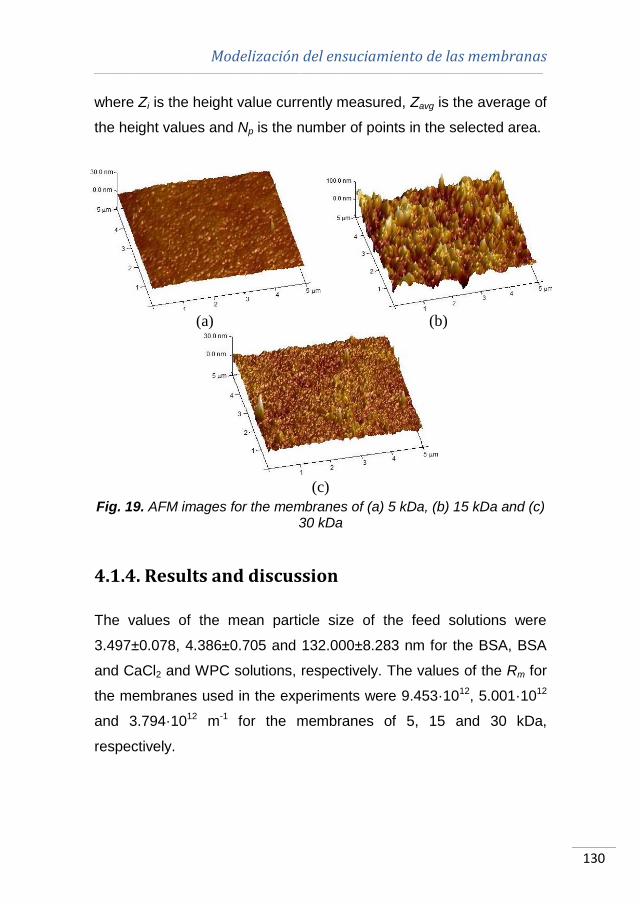
Modelización del ensuciamiento de las membranas ________________________________________________________________________________________________________________________________________________________
130
where Zi is the height value currently measured, Zavg is the average of
the height values and Np is the number of points in the selected area.
(a) (b)
(c)
Fig. 19. AFM images for the membranes of (a) 5 kDa, (b) 15 kDa and (c) 30 kDa
4.1.4. Results and discussion
The values of the mean particle size of the feed solutions were
3.497±0.078, 4.386±0.705 and 132.000±8.283 nm for the BSA, BSA
and CaCl2 and WPC solutions, respectively. The values of the Rm for
the membranes used in the experiments were 9.453·1012, 5.001·1012
and 3.794·1012 m-1 for the membranes of 5, 15 and 30 kDa,
respectively.
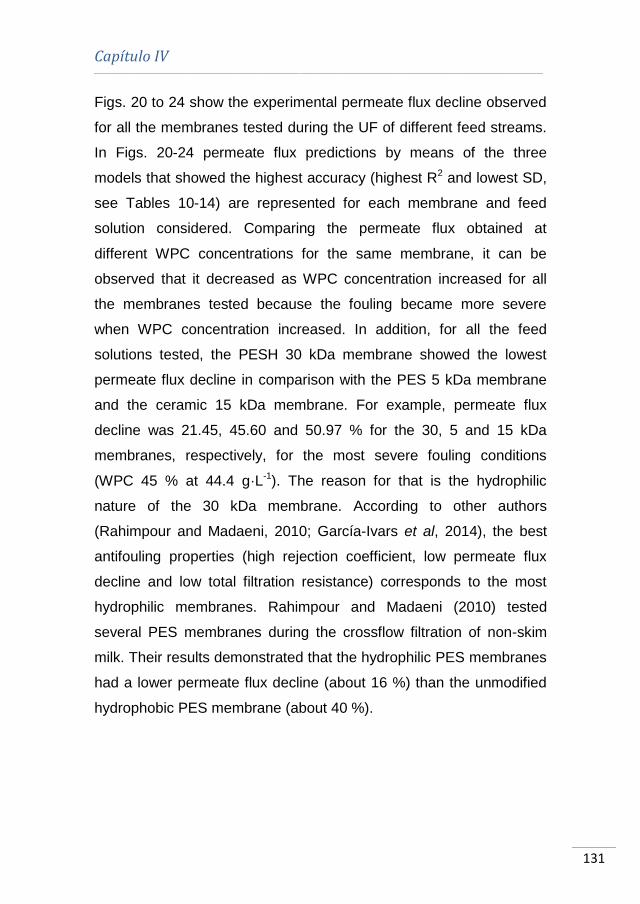
Capítulo IV ________________________________________________________________________________________________________________________________________________________
131
Figs. 20 to 24 show the experimental permeate flux decline observed
for all the membranes tested during the UF of different feed streams.
In Figs. 20-24 permeate flux predictions by means of the three
models that showed the highest accuracy (highest R2 and lowest SD,
see Tables 10-14) are represented for each membrane and feed
solution considered. Comparing the permeate flux obtained at
different WPC concentrations for the same membrane, it can be
observed that it decreased as WPC concentration increased for all
the membranes tested because the fouling became more severe
when WPC concentration increased. In addition, for all the feed
solutions tested, the PESH 30 kDa membrane showed the lowest
permeate flux decline in comparison with the PES 5 kDa membrane
and the ceramic 15 kDa membrane. For example, permeate flux
decline was 21.45, 45.60 and 50.97 % for the 30, 5 and 15 kDa
membranes, respectively, for the most severe fouling conditions
(WPC 45 % at 44.4 g·L-1). The reason for that is the hydrophilic
nature of the 30 kDa membrane. According to other authors
(Rahimpour and Madaeni, 2010; García-Ivars et al, 2014), the best
antifouling properties (high rejection coefficient, low permeate flux
decline and low total filtration resistance) corresponds to the most
hydrophilic membranes. Rahimpour and Madaeni (2010) tested
several PES membranes during the crossflow filtration of non-skim
milk. Their results demonstrated that the hydrophilic PES membranes
had a lower permeate flux decline (about 16 %) than the unmodified
hydrophobic PES membrane (about 40 %).
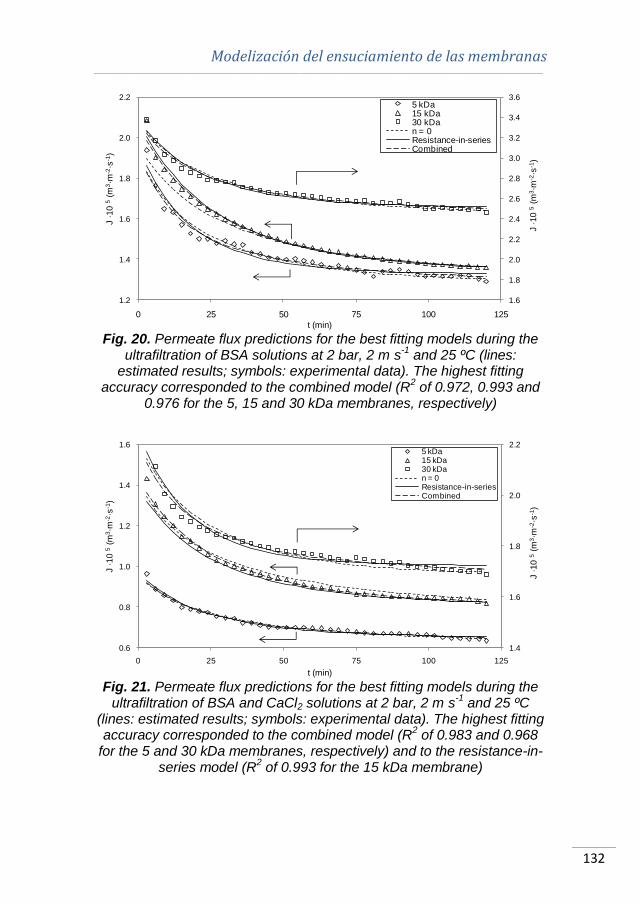
Modelización del ensuciamiento de las membranas ________________________________________________________________________________________________________________________________________________________
132
Fig. 20. Permeate flux predictions for the best fitting models during the
ultrafiltration of BSA solutions at 2 bar, 2 m·s-1
and 25 ºC (lines: estimated results; symbols: experimental data). The highest fitting
accuracy corresponded to the combined model (R2 of 0.972, 0.993 and
0.976 for the 5, 15 and 30 kDa membranes, respectively)
Fig. 21. Permeate flux predictions for the best fitting models during the
ultrafiltration of BSA and CaCl2 solutions at 2 bar, 2 m·s-1
and 25 ºC (lines: estimated results; symbols: experimental data). The highest fitting accuracy corresponded to the combined model (R
2 of 0.983 and 0.968
for the 5 and 30 kDa membranes, respectively) and to the resistance-in-series model (R
2 of 0.993 for the 15 kDa membrane)
1.6
1.8
2.0
2.2
2.4
2.6
2.8
3.0
3.2
3.4
3.6
1.2
1.4
1.6
1.8
2.0
2.2
0 25 50 75 100 125
J ·10 5
(m3·m
-2·s
-1)
J ·10 5
(m3·m
-2·s
-1)
t (min)
5 kDa15 kDa30 kDan = 0Resistance-in-seriesCombined
1.4
1.6
1.8
2.0
2.2
0.6
0.8
1.0
1.2
1.4
1.6
0 25 50 75 100 125
J ·10 5
(m3·m
-2·s
-1)
J ·10 5
(m3·m
-2·s
-1)
t (min)
5 kDa15 kDa30 kDan = 0Resistance-in-seriesCombined
Capítulo IV ________________________________________________________________________________________________________________________________________________________
133
Fig. 22. Permeate flux predictions for the best fitting models during the ultrafiltration of WPC 45 % (22.2 g·L
-1) solutions at 2 bar, 2 m·s
-1 and
25 ºC (lines: estimated results; symbols: experimental data). The highest fitting accuracy corresponded to the resistance-in-series model (R
2 of
0.982, 0.969 and 0.991 for the 5, 15 and 30 kDa membranes, respectively)
Fig. 23. Permeate flux predictions for the best fitting models during the ultrafiltration of WPC 45 % (33.3 g·L
-1) solutions at 2 bar, 2 m·s
-1 and
25 ºC (lines: estimated results; symbols: experimental data). The highest fitting accuracy corresponded to the resistance-in-series model (R
2 of
0.952, 0.971 and 0.968 for the 5, 15 and 30 kDa membranes, respectively)
0.8
1.0
1.2
1.4
0.4
0.6
0.8
1.0
1.2
0 25 50 75 100 125
J ·10 5
(m3·m
-2·s
-1)
J ·10 5
(m3·m
-2·s
-1)
t (min)
5 kDa15 kDa30 kDan = 1n = 2Resistance-in-seriesCom bined
0.6
0.8
1.0
1.2
0.2
0.4
0.6
0.8
1.0
0 25 50 75 100 125
J ·10 5
(m3·m
-2·s
-1)
J ·10 5
(m3·m
-2·s
-1)
t (min)
5 kDa15 kDa30 kDan = 1n = 2Resistance-in-seriesCom bined
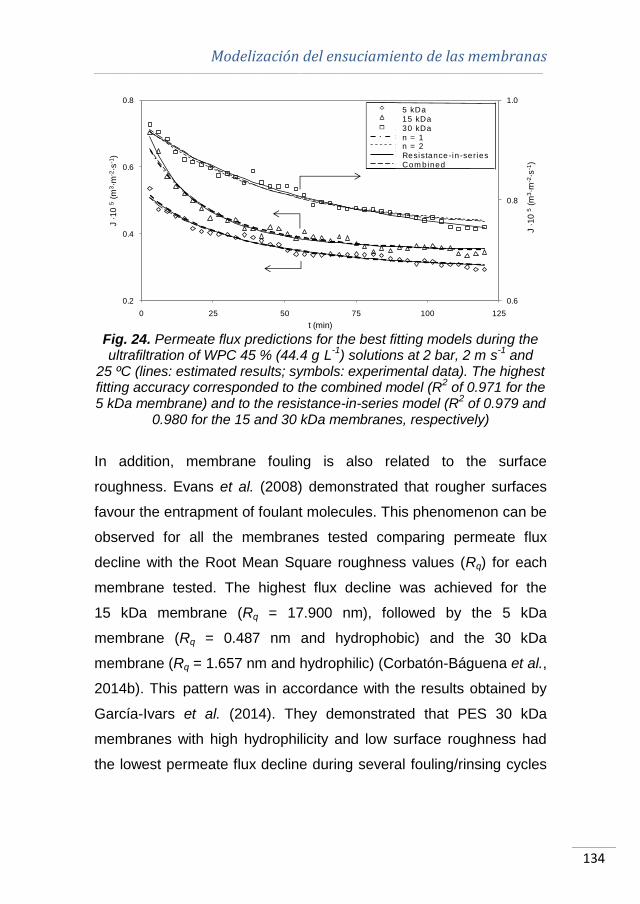
Modelización del ensuciamiento de las membranas ________________________________________________________________________________________________________________________________________________________
134
Fig. 24. Permeate flux predictions for the best fitting models during the ultrafiltration of WPC 45 % (44.4 g·L
-1) solutions at 2 bar, 2 m·s
-1 and
25 ºC (lines: estimated results; symbols: experimental data). The highest fitting accuracy corresponded to the combined model (R
2 of 0.971 for the
5 kDa membrane) and to the resistance-in-series model (R2 of 0.979 and
0.980 for the 15 and 30 kDa membranes, respectively)
In addition, membrane fouling is also related to the surface
roughness. Evans et al. (2008) demonstrated that rougher surfaces
favour the entrapment of foulant molecules. This phenomenon can be
observed for all the membranes tested comparing permeate flux
decline with the Root Mean Square roughness values (Rq) for each
membrane tested. The highest flux decline was achieved for the
15 kDa membrane (Rq = 17.900 nm), followed by the 5 kDa
membrane (Rq = 0.487 nm and hydrophobic) and the 30 kDa
membrane (Rq = 1.657 nm and hydrophilic) (Corbatón-Báguena et al.,
2014b). This pattern was in accordance with the results obtained by
García-Ivars et al. (2014). They demonstrated that PES 30 kDa
membranes with high hydrophilicity and low surface roughness had
the lowest permeate flux decline during several fouling/rinsing cycles
0.6
0.8
1.0
0.2
0.4
0.6
0.8
0 25 50 75 100 125
J ·10 5
(m3·m
-2·s
-1)
J ·10 5
(m3·m
-2·s
-1)
t (min)
5 kDa15 kDa30 kDan = 1n = 2Resistance-in-seriesCom bined

Capítulo IV ________________________________________________________________________________________________________________________________________________________
135
compared with other modified and unmodified PES membranes with
higher surface roughness and hidrophobicity.
Tables 10 to 14 show the fitting accuracy for the Hermia’s models
adapted to crossflow, the combined model and the resistance-in-
series model for all the membranes and feed solutions tested. All the
models fitted with almost the same accuracy to the experimental data,
with the only exception of the standard blocking model. The fitting
accuracy of the standard blocking model (n = 1.5) was very low for all
the experimental data considered in this work. Therefore, this model
was not considered. This can be explained by the fact that solute
molecules were larger than the membrane pores, as in the case of
the BSA and BSA and CaCl2 feed solutions (Wang et al., 2012). In
the case of WPC 45 % feed solutions, at the pH values of the
solutions prepared in this work (5.97), the lowest molecular weight
proteins tend to form dimers that are larger than the pore size of the
membranes (Fox and McSweeney, 2003; Mills and Creamer, 1975).
Therefore, they cannot penetrate inside the porous structure.
In Tables 10-14, the models with the best fitting accuracy are
highlighted in bold for each membrane and feed solution tested. As it
can be observed in Table 10, the combined model was the best for all
the membranes when BSA was used as feed solution. When BSA
and CaCl2 solutions were ultrafiltered (see Table 11), the combined
model had the highest fitting accuracy for the polymeric membranes
(5 and 30 kDa). However, the resistance-in-series model had a
slightly higher value of R2 for the 15 kDa ceramic membrane fouled
with BSA and CaCl2. In the case of WPC 45 % solutions (Tables 12-
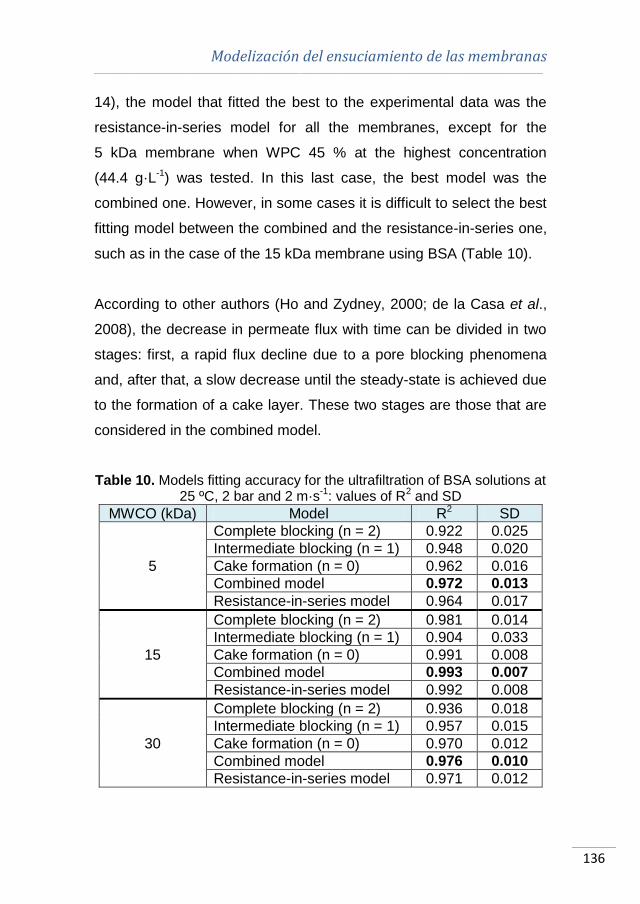
Modelización del ensuciamiento de las membranas ________________________________________________________________________________________________________________________________________________________
136
14), the model that fitted the best to the experimental data was the
resistance-in-series model for all the membranes, except for the
5 kDa membrane when WPC 45 % at the highest concentration
(44.4 g·L-1) was tested. In this last case, the best model was the
combined one. However, in some cases it is difficult to select the best
fitting model between the combined and the resistance-in-series one,
such as in the case of the 15 kDa membrane using BSA (Table 10).
According to other authors (Ho and Zydney, 2000; de la Casa et al.,
2008), the decrease in permeate flux with time can be divided in two
stages: first, a rapid flux decline due to a pore blocking phenomena
and, after that, a slow decrease until the steady-state is achieved due
to the formation of a cake layer. These two stages are those that are
considered in the combined model.
Table 10. Models fitting accuracy for the ultrafiltration of BSA solutions at 25 ºC, 2 bar and 2 m·s
-1: values of R
2 and SD
MWCO (kDa) Model R2 SD
5
Complete blocking (n = 2) 0.922 0.025
Intermediate blocking (n = 1) 0.948 0.020
Cake formation (n = 0) 0.962 0.016
Combined model 0.972 0.013
Resistance-in-series model 0.964 0.017
15
Complete blocking (n = 2) 0.981 0.014
Intermediate blocking (n = 1) 0.904 0.033
Cake formation (n = 0) 0.991 0.008
Combined model 0.993 0.007
Resistance-in-series model 0.992 0.008
30
Complete blocking (n = 2) 0.936 0.018
Intermediate blocking (n = 1) 0.957 0.015
Cake formation (n = 0) 0.970 0.012
Combined model 0.976 0.010
Resistance-in-series model 0.971 0.012

Capítulo IV ________________________________________________________________________________________________________________________________________________________
137
Table 11. Models fitting accuracy for the ultrafiltration of BSA and CaCl2 solutions at 25 ºC, 2 bar and 2 m·s
-1: values of R
2 and SD
MWCO (kDa) Model R2 SD
5
Complete blocking (n = 2) 0.950 0.022
Intermediate blocking (n = 1) 0.971 0.016
Cake formation (n = 0) 0.980 0.013
Combined model 0.983 0.012
Resistance-in-series model 0.980 0.013
15
Complete blocking (n = 2) 0.975 0.024
Intermediate blocking (n = 1) 0.969 0.026
Cake formation (n = 0) 0.977 0.022
Combined model 0.991 0.012
Resistance-in-series model 0.993 0.012
30
Complete blocking (n = 2) 0.922 0.017
Intermediate blocking (n = 1) 0.941 0.015
Cake formation (n = 0) 0.953 0.013
Combined model 0.968 0.010
Resistance-in-series model 0.965 0.011
Table 12. Models fitting accuracy for the ultrafiltration of WPC 45 % solutions (22.2 g·L
-1) at 25 ºC, 2 bar and 2 m·s
-1: values of R
2 and SD
MWCO (kDa) Model R2 SD
5
Complete blocking (n = 2) 0.976 0.014
Intermediate blocking (n = 1) 0.975 0.014
Cake formation (n = 0) 0.966 0.017
Combined model 0.980 0.014
Resistance-in-series model 0.982 0.013
15
Complete blocking (n = 2) 0.954 0.032
Intermediate blocking (n = 1) 0.967 0.028
Cake formation (n = 0) 0.958 0.031
Combined model 0.966 0.028
Resistance-in-series model 0.969 0.028
30
Complete blocking (n = 2) 0.973 0.010
Intermediate blocking (n = 1) 0.965 0.012
Cake formation (n = 0) 0.962 0.012
Combined model 0.982 0.008
Resistance-in-series model 0.991 0.006

Modelización del ensuciamiento de las membranas ________________________________________________________________________________________________________________________________________________________
138
Table 13. Models fitting accuracy for the ultrafiltration of WPC 45 % solutions (33.3 g·L
-1) at 25 ºC, 2 bar and 2 m·s
-1: values of R
2 and SD
MWCO (kDa) Model R2 SD
5
Complete blocking (n = 2) 0.936 0.022
Intermediate blocking (n = 1) 0.941 0.021
Cake formation (n = 0) 0.938 0.021
Combined model 0.943 0.032
Resistance-in-series model 0.952 0.020
15
Complete blocking (n = 2) 0.957 0.036
Intermediate blocking (n = 1) 0.967 0.032
Cake formation (n = 0) 0.949 0.039
Combined model 0.965 0.032
Resistance-in-series model 0.971 0.031
30
Complete blocking (n = 2) 0.962 0.015
Intermediate blocking (n = 1) 0.958 0.016
Cake formation (n = 0) 0.948 0.017
Combined model 0.962 0.015
Resistance-in-series model 0.968 0.014
Table 14. Models fitting accuracy for the ultrafiltration of WPC 45 % solutions (44.4 g·L
-1) at 25 ºC, 2 bar and 2 m·s
-1: values of R
2 and SD
MWCO (kDa) Model R2 SD
5
Complete blocking (n = 2) 0.952 0.032
Intermediate blocking (n = 1) 0.969 0.027
Cake formation (n = 0) 0.964 0.029
Combined model 0.971 0.025
Resistance-in-series model 0.969 0.026
15
Complete blocking (n = 2) 0.962 0.036
Intermediate blocking (n = 1) 0.969 0.031
Cake formation (n = 0) 0.943 0.040
Combined model 0.969 0.032
Resistance-in-series model 0.979 0.030
30
Complete blocking (n = 2) 0.965 0.013
Intermediate blocking (n = 1) 0.959 0.014
Cake formation (n = 0) 0.950 0.016
Combined model 0.968 0.012
Resistance-in-series model 0.980 0.009
Capítulo IV ________________________________________________________________________________________________________________________________________________________
139
The resistance-in-series model takes into account both fouling
mechanisms as well as it considers the resistance due to adsorption
of solute molecules on the membrane surface and inside its pores
and the resistance caused by the cake layer. Therefore, according to
both models, both mechanisms (pore blocking and cake layer
formation) must be considered to explain membrane fouling when
whey model solutions (BSA, BSA and CaCl2 and WPC solutions) are
ultrafiltered.
The values of model parameters for the best fitting models are shown
in Table 15. When BSA was used as feed solution, the values of the
pore blocking parameter, α, indicate that cake layer formation was the
predominant fouling mechanism for all the membranes tested. This
result is also in agreement with the individual analysis of Hermia’s
models adapted to crossflow in the case of BSA solutions (see Table
10). The reason can be that solute molecules (67 kDa) are much
larger than the pores of the 5, 15 and 30 kDa membranes, thus solute
molecules are accumulated on the membrane surface, forming a
layer on it. Regarding the values of the cake layer formation model
parameter, Kg, and the complete blocking model parameter, Kc, for
the 5, 15 and 30 kDa membranes and BSA solutions (Table 15), both
parameters decreased when the MWCO increased. It is important to
note that one of the hypotheses of the Hermia’s complete blocking
model is that the pore entrance is completely blocked or sealed when
one solute molecule arrives at the membrane surface. Therefore,
both models (complete blocking and cake layer formation) consider
membrane fouling mechanisms that are external and occur on the
membrane surface (Brião and Tavares, 2012).
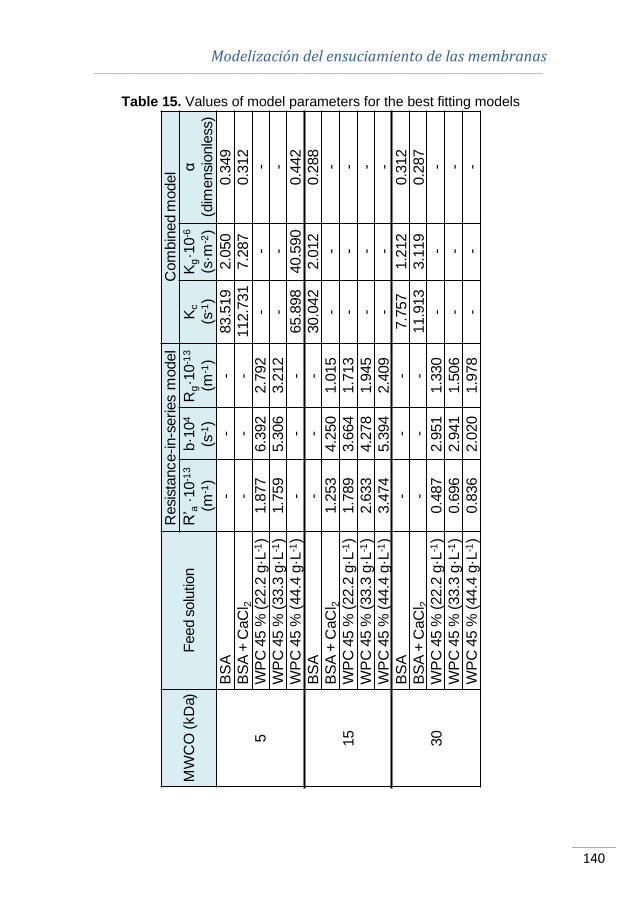
Modelización del ensuciamiento de las membranas ________________________________________________________________________________________________________________________________________________________
140
Table 15. Values of model parameters for the best fitting models
MW
CO
(kD
a)
Feed s
olu
tion
Resi
stance-in-s
eries
model
Com
bin
ed m
odel
R’ a
·10
-13
(m-1
)
b·1
04
(s-1
)
Rg·1
0-1
3
(m-1
)
Kc
(s-1
)
Kg·1
0-6
(s·m
-2)
α
(dim
ensi
onle
ss)
5
BS
A-
--
83.5
19
2.0
50
0.3
49
BS
A+
CaC
l 2-
--
112.7
31
7.2
87
0.3
12
WP
C45
%(2
2.2
g·L
-1)
1.8
77
6.3
92
2.7
92
--
-
WP
C45
%(3
3.3
g·L
-1)
1.7
59
5.3
06
3.2
12
--
-W
PC
45
%(4
4.4
g·L
-1)
--
-65.8
98
40.5
90
0.4
42
15
BS
A-
--
30.0
42
2.0
12
0.2
88
BS
A+
CaC
l 21.2
53
4.2
50
1.0
15
--
-
WP
C45
%(2
2.2
g·L
-1)
1.7
89
3.6
64
1.7
13
--
-
WP
C45
%(3
3.3
g·L
-1)
2.6
33
4.2
78
1.9
45
--
-
WP
C45
%(4
4.4
g·L
-1)
3.4
74
5.3
94
2.4
09
--
-
30
BS
A-
--
7.7
57
1.2
12
0.3
12
BS
A+
CaC
l 2-
--
11.9
13
3.1
19
0.2
87
WP
C45
%(2
2.2
g·L
-1)
0.4
87
2.9
51
1.3
30
--
-
WP
C45
%(3
3.3
g·L
-1)
0.6
96
2.9
41
1.5
06
--
-
WP
C45
%(4
4.4
g·L
-1)
0.8
36
2.0
20
1.9
78
--
-
Capítulo IV ________________________________________________________________________________________________________________________________________________________
141
According to Brião and Tavares (2012), these external membrane
fouling mechanisms are related to the difference between the solute
molecule size and the membrane pore size. This difference is higher
as the MWCO decreases. Thus, a greater amount of particles can be
deposited on the membrane surface and a tighter bound cake layer
may be formed on the membrane with the lowest MWCO (5 kDa). On
the other hand, according to the membrane material, hydrophilic
membranes usually have better antifouling properties than those
made of hydrophobic materials (Rahimpour and Madaeni, 2010;
García-Ivars et al., 2014; Evans et al., 2008). As the 30 kDa
membrane was a PESH membrane, the fouling was less severe
using the same feed solution and experimental conditions as in the
case of the 5 kDa PES membrane. In addition, as it was above
mentioned, the lower the membrane roughness is, the less severe the
membrane fouling is. For the membranes tested in this work, the
roughness of the PESH 30 kDa membrane is very low and similar to
that of the hydrophobic PES 5 kDa membrane. However, the surface
roughness of the ceramic 15 kDa membrane is much greater.
Therefore, the combination of high hydrophilicity and low surface
roughness favour the low permeate flux decline observed for the
30 kDa membrane.
When BSA and CaCl2 solutions were used as feed solutions, the best
fitting accuracy was obtained with the combined model for the
polymeric membranes (5 and 30 kDa). In this case, comparing the
values of the parameters when BSA solutions were used and those
calculated for BSA and CaCl2 solutions, it can be observed that the
values of both parameters considered in this model (Kc and Kg)
Modelización del ensuciamiento de las membranas ________________________________________________________________________________________________________________________________________________________
142
increased to a large extent when BSA and CaCl2 were fed
simultaneously. Therefore, fouling was more severe when CaCl2 was
added to the feed solutions. Calcium salts have been demonstrated
to act as bridging agents between proteins, agglomerating them
(Almécija et al., 2009; Ang and Elimelech, 2007). Almécija et al.
(2009) investigated the effect of calcium salts on the UF of whey
solutions. They reported that the percentage of membrane blocked
pores during UF increased as the concentration of calcium salts
increased in the feed solution. Ang and Elimelech (2007) studied the
fouling of reverse osmosis membranes using BSA and calcium
solutions. They demonstrated that, when calcium concentration
increased, permeate flux decline was greater because the
electrostatic repulsion among BSA molecules is diminished. De la
Casa et al. demonstrated that Hermia’s models parameters increased
as the membrane fouling was more severe during the microfiltration
of BSA (de la Casa et al., 2008). According to their work, permeate
flux reduction and thus, membrane fouling, was greater at values of
pH near the isoelectric point of the protein, when protein
agglomeration occurs as well. Comparing the values of the Hermia’s
cake layer formation parameter, they observed that these values
increased as membrane fouling was more severe (at pH 7). On the
other hand, comparing the values of the model parameters Kc and Kg
for the 5 and 30 kDa when BSA and CaCl2 solutions were fed, it can
be observed that both parameters decreased as membrane MWCO
increased. It indicates a lower permeate flux decline and thus, less
severe membrane fouling in the case of the 30 kDa membrane. This
pattern is in agreement with that obtained for BSA solutions.
Capítulo IV ________________________________________________________________________________________________________________________________________________________
143
The resistance-in-series model was the model with the highest fitting
accuracy when WPC 45 % solutions at a concentration of 22.2 and
33.3 g·L-1 were used as feed for all the membranes tested and also
for the 15 and 30 kDa membranes using WPC 45 % solutions at
44.4 g·L-1. Comparing the values for the model parameters R’a and
Rg, it can be observed that they increased as the MWCO decreased
for all the membranes tested. The increase in model parameters with
the membrane MWCO is in agreement with the results previously
commented for the other feed solutions. In addition, for the 15 and
30 kDa membranes, the values of R’a and Rg increased when WPC
concentration increased from 22.2 to 44.4 g·L-1, indicating greater
membrane fouling as feed concentration increased. For the 5 kDa
membrane, Rg also increased when WPC concentration increased
from 22.2 to 33.3 g·L-1. However, the value of R’a was similar for both
WPC concentrations. This can be due to the fact that, because of the
great difference between the proteins size and the membrane pore
size, the possibility of adsorption inside the pores is lower in the case
of the membrane with the lowest MWCO (5 kDa) in comparison with
the other membranes. Thus, the value of R’a is similar independently
of the WPC concentration.
In order to generalize the values of the model parameters for different
membranes, feed solutions and protein concentrations in the feed
solution; the model parameters for the two best fitting models
(resistance-in-series and combined models) were correlated to three
independent variables (membrane surface roughness, mean particle
size of the feed solution and protein concentration in the feed
solutions) using a multiple regression analysis from Statgraphics®.
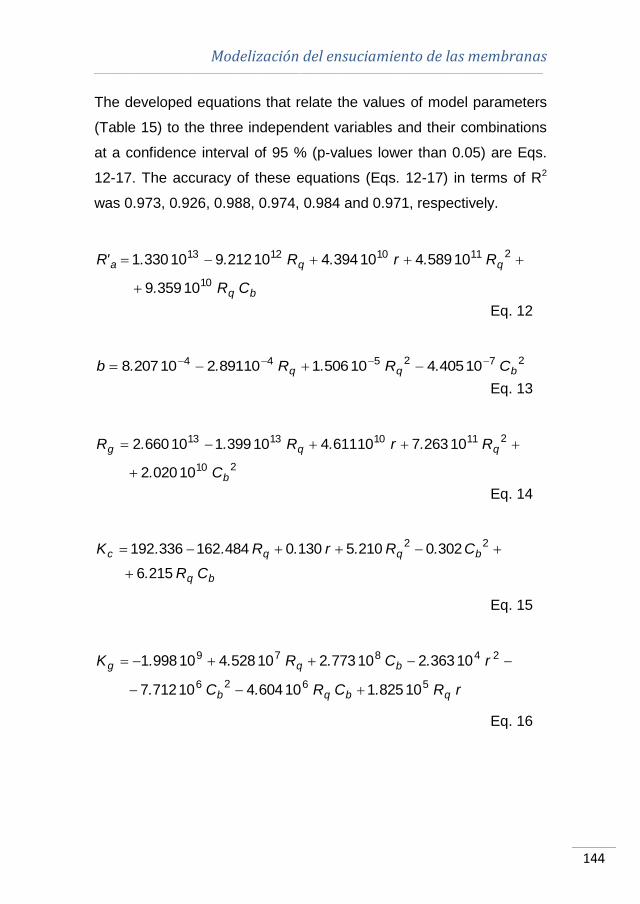
Modelización del ensuciamiento de las membranas ________________________________________________________________________________________________________________________________________________________
144
The developed equations that relate the values of model parameters
(Table 15) to the three independent variables and their combinations
at a confidence interval of 95 % (p-values lower than 0.05) are Eqs.
12-17. The accuracy of these equations (Eqs. 12-17) in terms of R2
was 0.973, 0.926, 0.988, 0.974, 0.984 and 0.971, respectively.
bq
qqa
C·R··.
R··.r··.R··.·.'R
10
211101213
103599
105894103944102129103301
Eq. 12
272544 104054105061108912102078 bqq C··.R··.R··.·.b
Eq. 13
210
211101313
100202
102637106114103991106602
b
qqg
C··.
R··.r··.R··.·.R
Eq. 14
bq
bqqc
C·R·.
C·.R·.r·.R·..K
2156
30202105130048416233619222
Eq. 15
r·R··.C·R··.C··.
r··.C··.R··.·.K
qbqb
bqg
5626
24879
108251106044107127
103632107732105284109981
Eq. 16

Capítulo IV ________________________________________________________________________________________________________________________________________________________
145
r·R··.C·R··.
r··.R··.C··.·.a
qbq
qb
43
252321
100892105044
106083104252107834104907
Eq. 17
These equations can be used to predict the best conditions resulting
in the lowest possible fouling and thus, in the highest steady-state
permeate flux. In the case of the resistance-in-series model, which
was one of the most accurate for the experimental data obtained for
all the membranes and feed solutions tested, the general model
equation (Eq. 10) indicated that the highest steady-state permeate
flux was obtained when R’a and Rg had a value of 0. Therefore, an
optimization analysis was performed by means of the Microsoft Excel
Solver tool in order to determine the values of the independent
variables in Eqs. 7-9 that made R’a and Rg equal to 0. These values
were a membrane surface roughness of 1.605 nm, a particle size of
1.374 nm and a protein concentration in the feed solution of
1.647 g·L-1. As it was above mentioned, the lower the protein
concentration in the feed solution and its particle size are, the less
aggregates are formed and thus, the lower the membrane fouling is.
In addition, rougher surfaces allow solute molecules to deposit on
them, favouring membrane fouling (García-Ivars et al, 2014; Evans et
al, 2008).
4.1.5. Conclusions
The models studied in this work can predict with high accuracy the
experimental permeate flux for all the membranes tested when

Modelización del ensuciamiento de las membranas ________________________________________________________________________________________________________________________________________________________
146
different whey model solutions that contained BSA (1 % w/w), BSA
(1 % w/w) and CaCl2 (0.06 % w/w in calcium) and WPC with a total
protein concentration of 45 % w/w (22.2, 33.3 and 44.4 g·L-1) were
ultrafiltered at 2 bar and 2 m·s-1. By fitting experimental data to all
these models, the predominant fouling mechanisms were confirmed
for all the membranes and feed solutions tested. Only the Hermia’s
standard blocking model did not show a very accurate fitting to the
experimental data, because solute molecules were much higher than
membrane pore size, thus they cannot penetrate inside the
membrane porous structure.
According to the accuracy of models fitting, the resistance-in-series
model and the combined model achieved the highest R2 and lowest
SD for all the feed solutions and membranes tested. This indicates
that both cake layer formation and pore blocking contributed to
membrane fouling.
The combination of high hydrophilicity and low surface roughness
resulted in a membrane with better antifouling behaviour. Thus, the
30 kDa membrane showed the lowest permeate flux decline and the
lowest values of model parameters for all the feed solutions tested.
Acknowledgements
The authors of this work wish to gratefully acknowledge the financial
support of the Spanish Ministry of Science and Innovation through the
project CTM2010-20186.
Capítulo IV ________________________________________________________________________________________________________________________________________________________
147
Nomenclature
List of symbols
b Fouling rate due to adsorption (s-1)
Cb Protein concentration in the feed solution (g·L-1)
K Hermia’s model constant (units depending on n)
Kc Complete blocking model constant (s-1)
Kg Cake layer formation model constant (s·m-2)
J Permeate flux (m3·m-2·s-1)
Jmodel Permeate flux predicted by each model (m3·m-2·s-1)
Jss Steady-state permeate flux (m3·m-2·s-1)
n Hermia’s model parameter (dimensionless)
Np Number of points within the selected area
(dimensionless)
ΔP Transmembrane pressure (bar)
r Mean particle size (nm)
R Total hydraulic resistance (m-1)
Ra Resistance due to adsorption on membrane surface
and inside its pores and concentration polarization (m-1)
R’a Steady-state adsorption resistance
Rg Cake layer resistance (m-1)
Rm New membrane resistance (m-1)
Rq Root Mean Square Roughness (nm)
t Filtration time (s)
Zavg Average of the height values of the sample (nm)
Zi Value of height currently measured (nm)
Modelización del ensuciamiento de las membranas ________________________________________________________________________________________________________________________________________________________
148
Greek letters
α Fraction of membrane pores completely blocked
(dimensionless)
μ Feed solution viscosity (kg·m-1·s-1)
Abbreviations
BSA Bovine serum albumin
MWCO Molecular weight cut off
PES Polyethersulfone
PESH Permanently hydrophilic polyethersulfone
UF Ultrafiltration
WPC Whey protein concentrate

Capítulo IV ________________________________________________________________________________________________________________________________________________________
149
4.2. MECANISMOS DE ENSUCIAMIENTO DE LA
MEMBRANA DE 50 kDa
Tal y como se detalla en los Capítulos V y IX de esta Tesis Doctoral,
la membrana de 50 kDa fue ensuciada únicamente con disoluciones
de BSA. Por este motivo, y dado que los datos referidos a la
modelización del ensuciamiento de dicha membrana no se incluyen
en la sección 4.1, se describen a continuación los mecanismos
principalmente responsables del ensuciamiento de la membrana
cerámica de 50 kDa con disoluciones de BSA de 10 g·L-1.
La Fig. 25 muestra la evolución de la densidad de flujo de permeado
con el tiempo para la membrana de 50 kDa ensuciada con
disoluciones de BSA en las mismas condiciones experimentales que
el resto de membranas consideradas en la sección 4.1 (2 bar, 2 m·s-1
y 25 ºC). Además, en dicha figura también se representan los
modelos matemáticos que presentan mejor grado de ajuste (mayores
valores de R2 y menores valores de desviación estándar), de acuerdo
con la Tabla 16. Como puede observarse en la Fig. 25, la densidad
de flujo de permeado experimentó un descenso considerable (60 %,
aproximadamente) durante los 120 min de duración del ensayo de
UF. Esta disminución es mayor que la observada para el resto de
membranas consideradas (5, 15 y 30 kDa) ensuciadas con BSA en
las mismas condiciones experimentales, lo cual indica el
ensuciamiento más severo producido en la membrana de mayor
MWCO.
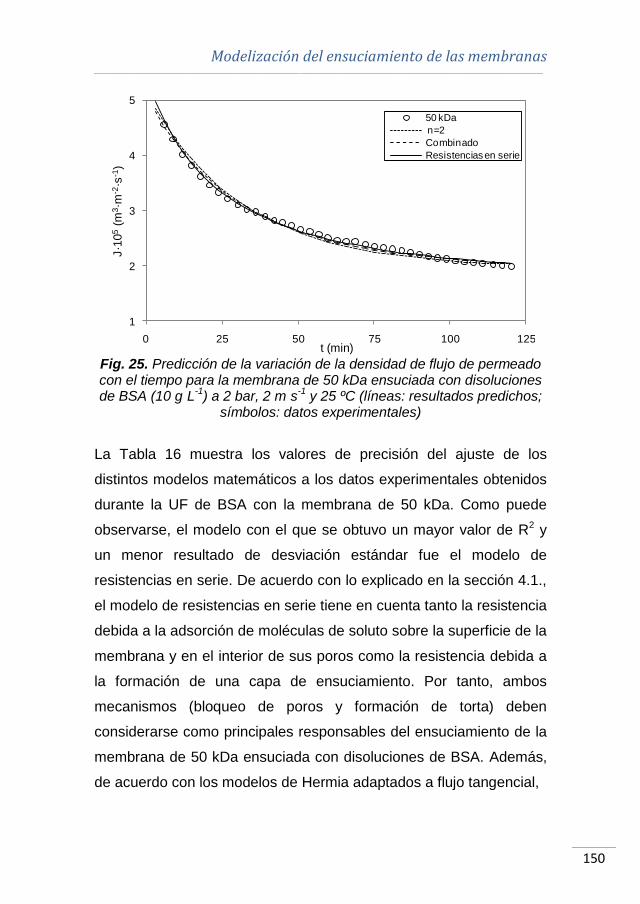
Modelización del ensuciamiento de las membranas ________________________________________________________________________________________________________________________________________________________
150
Fig. 25. Predicción de la variación de la densidad de flujo de permeado con el tiempo para la membrana de 50 kDa ensuciada con disoluciones de BSA (10 g·L
-1) a 2 bar, 2 m·s
-1 y 25 ºC (líneas: resultados predichos;
símbolos: datos experimentales)
La Tabla 16 muestra los valores de precisión del ajuste de los
distintos modelos matemáticos a los datos experimentales obtenidos
durante la UF de BSA con la membrana de 50 kDa. Como puede
observarse, el modelo con el que se obtuvo un mayor valor de R2 y
un menor resultado de desviación estándar fue el modelo de
resistencias en serie. De acuerdo con lo explicado en la sección 4.1.,
el modelo de resistencias en serie tiene en cuenta tanto la resistencia
debida a la adsorción de moléculas de soluto sobre la superficie de la
membrana y en el interior de sus poros como la resistencia debida a
la formación de una capa de ensuciamiento. Por tanto, ambos
mecanismos (bloqueo de poros y formación de torta) deben
considerarse como principales responsables del ensuciamiento de la
membrana de 50 kDa ensuciada con disoluciones de BSA. Además,
de acuerdo con los modelos de Hermia adaptados a flujo tangencial,
1
2
3
4
5
0 25 50 75 100 125
J·1
05
(m3·m
-2·s
-1)
t (min)
50 kDa
n=2
Combinado
Resistencias en serie
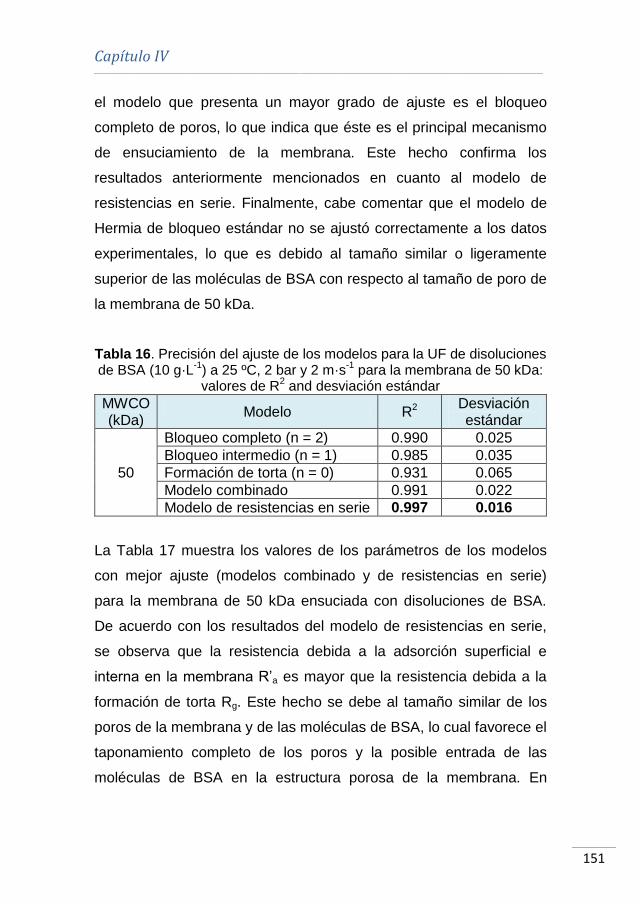
Capítulo IV ________________________________________________________________________________________________________________________________________________________
151
el modelo que presenta un mayor grado de ajuste es el bloqueo
completo de poros, lo que indica que éste es el principal mecanismo
de ensuciamiento de la membrana. Este hecho confirma los
resultados anteriormente mencionados en cuanto al modelo de
resistencias en serie. Finalmente, cabe comentar que el modelo de
Hermia de bloqueo estándar no se ajustó correctamente a los datos
experimentales, lo que es debido al tamaño similar o ligeramente
superior de las moléculas de BSA con respecto al tamaño de poro de
la membrana de 50 kDa.
Tabla 16. Precisión del ajuste de los modelos para la UF de disoluciones de BSA (10 g·L
-1) a 25 ºC, 2 bar y 2 m·s
-1 para la membrana de 50 kDa:
valores de R2 and desviación estándar
MWCO (kDa)
Modelo R2 Desviación estándar
50
Bloqueo completo (n = 2) 0.990 0.025
Bloqueo intermedio (n = 1) 0.985 0.035
Formación de torta (n = 0) 0.931 0.065
Modelo combinado 0.991 0.022
Modelo de resistencias en serie 0.997 0.016
La Tabla 17 muestra los valores de los parámetros de los modelos
con mejor ajuste (modelos combinado y de resistencias en serie)
para la membrana de 50 kDa ensuciada con disoluciones de BSA.
De acuerdo con los resultados del modelo de resistencias en serie,
se observa que la resistencia debida a la adsorción superficial e
interna en la membrana R’a es mayor que la resistencia debida a la
formación de torta Rg. Este hecho se debe al tamaño similar de los
poros de la membrana y de las moléculas de BSA, lo cual favorece el
taponamiento completo de los poros y la posible entrada de las
moléculas de BSA en la estructura porosa de la membrana. En
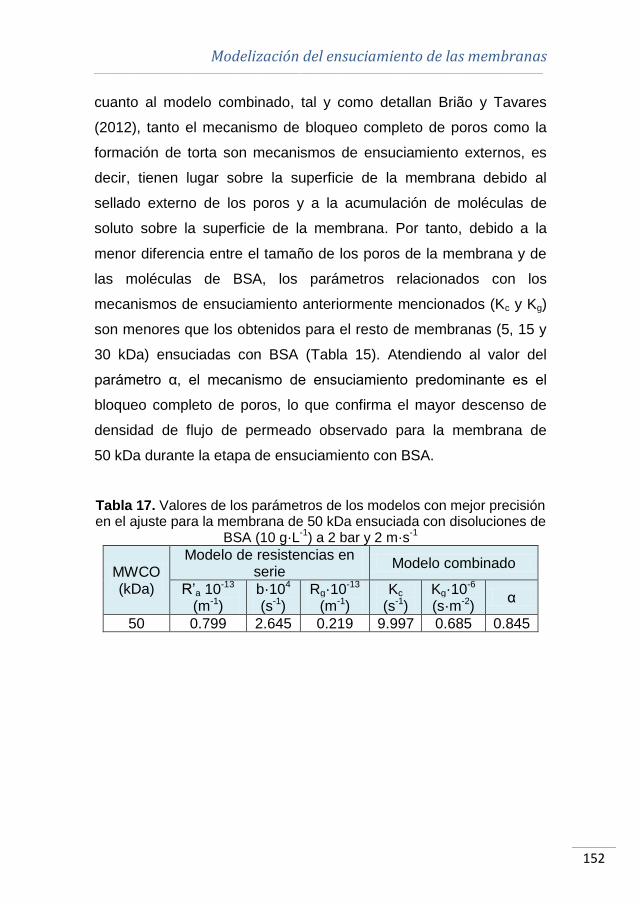
Modelización del ensuciamiento de las membranas ________________________________________________________________________________________________________________________________________________________
152
cuanto al modelo combinado, tal y como detallan Brião y Tavares
(2012), tanto el mecanismo de bloqueo completo de poros como la
formación de torta son mecanismos de ensuciamiento externos, es
decir, tienen lugar sobre la superficie de la membrana debido al
sellado externo de los poros y a la acumulación de moléculas de
soluto sobre la superficie de la membrana. Por tanto, debido a la
menor diferencia entre el tamaño de los poros de la membrana y de
las moléculas de BSA, los parámetros relacionados con los
mecanismos de ensuciamiento anteriormente mencionados (Kc y Kg)
son menores que los obtenidos para el resto de membranas (5, 15 y
30 kDa) ensuciadas con BSA (Tabla 15). Atendiendo al valor del
parámetro α, el mecanismo de ensuciamiento predominante es el
bloqueo completo de poros, lo que confirma el mayor descenso de
densidad de flujo de permeado observado para la membrana de
50 kDa durante la etapa de ensuciamiento con BSA.
Tabla 17. Valores de los parámetros de los modelos con mejor precisión en el ajuste para la membrana de 50 kDa ensuciada con disoluciones de
BSA (10 g·L-1
) a 2 bar y 2 m·s-1
MWCO (kDa)
Modelo de resistencias en serie
Modelo combinado
R’a 10-13 (m-1)
b·104 (s-1)
Rg·10-13 (m-1)
Kc
(s-1) Kg·10-6 (s·m-2)
α
50 0.799 2.645 0.219 9.997 0.685 0.845
Capítulo IV ________________________________________________________________________________________________________________________________________________________
153
4.3. BIBLIOGRAFÍA
AFONSO A., MIRANDA J.M. y CAMPOS J.B.L.M. (2009). “Numerical
study of BSA ultrafiltration in the limiting flux regime – effect of
variable physical properties” en Desalination, vol. 249, p. 1139-1150.
ALMÉCIJA M.C. et al. (2009). “Influence of the cleaning temperature
on the permeability of ceramic membranes” en Desalination, vol. 245,
p. 708-713.
ANG W.S. y ELIMELECH M. (2007). “Protein (BSA) fouling of reverse
osmosis membranes: Implications for wastewater reclamation” en
Journal of Membrane Science, vol. 296, p. 83-92.
ARGÜELLO M.A. et al. (2003). “Enzymatic cleaning of inorganic
ultrafiltration membranes used for whey protein fractionation” en
Journal of Membrane Science, vol. 216, p. 121-134.
AOAC Official Method 930.30. (1930). “Ash of Dried Milk”. First action
1930.
BARANYI J. et al. (1996). “Effects of parameterization on the
performance of empirical models used in “predictive microbiology”” en
Food Microbiology, vol. 13, p. 83-91.
BHATTACHARJEE C. y DATTA S. (2003). “Analysis of polarized
layer resistance during ultrafiltration of PEG-6000: an approach
based on filtration theory” en Separation and Purification Technology,
vol. 33, p. 115-126.
BHATTACHARYA P.K. et al. (2001). “Ultrafiltration of sugar cane
juice for recovery of sugar: analysis of flux and retention” en
Separation and Purification Technology, vol. 21, p. 247-259.
Modelización del ensuciamiento de las membranas ________________________________________________________________________________________________________________________________________________________
154
BRIÃO V.B. y TAVARES C.R.G. (2012). “Pore blocking mechanism
for the recovery of milk solids from dairy wastewater by ultrafiltration”
en Brazilian Journal of Chemical Engineering, vol. 29, p. 393-407.
CARRÈRE H., BLASZKOW F. y ROUX DE BALMANN H. (2001).
“Modelling the clarification of lactic acid fermentation broths by cross-
flow microfiltration” en Journal of Membrane Science, vol. 186, p.
219-230.
CHOI S-W. et al. (2000). “Modeling of the permeate flux during
microfiltration of BSA-adsorbed microspheres in a stirred cell” en
Journal of Colloid and Interface Science, vol. 228, p. 270-278.
CHUNG T.-S. et al. (2002). “Visualization of the effect of die shear
rate on the outer surface morphology of ultrafiltration membranes by
AFM” en Journal of Membrane Science, vol. 196, p. 251-266.
CORBATÓN-BÁGUENA M.J., ÁLVAREZ-BLANCO S. y VINCENT-
VELA M.C. (2014a). “Cleaning of ultrafiltration membranes fouled
with BSA by means of saline solutions” en Separation and Purification
Technology, vol. 125, p. 1-10.
CORBATÓN-BÁGUENA M.J., ÁLVAREZ-BLANCO S. y VINCENT-
VELA M.C. (2014b). “Salt cleaning of ultrafiltration membranes fouled
by whey model solutions” en Separation and Purification Technology,
vol. 132, p. 226-233.
DE BARROS S.T.D. et al. (2003). “Study of fouling mechanism in
pineapple juice clarification by ultrafiltration” en Journal of Membrane
Science, vol. 215, p. 213-224.
DE LA CASA E.J. et al. (2008). “A combined fouling model to
describe the influence of the electrostatic environment on the cross-
flow microfiltration of BSA” en Journal of Membrane Science, vol.
318, p. 247-254.

Capítulo IV ________________________________________________________________________________________________________________________________________________________
155
DUCLOS-ORSELLO C., LI W. y HO C-C. (2006). “A three
mechanism model to describe fouling of microfiltration membranes”
en Journal of Membrane Science, vol. 280, p. 856-866.
EVANS P.J. et al. (2008). “The influence of hydrophobicity,
roughness and charge upon ultrafiltration membranes for black tea
liquor clarification” en Journal of Membrane Science, vol. 313, p. 250-
262.
FIELD R.W. et al. (1995). “Critical flux concept for microfiltration
fouling” en Journal of Membrane Science, vol. 100, p. 259–272.
FOX P.F. y MCSWEENEY P.L.H. (2003). Advanced Dairy Chemistry:
Vol. 1: Proteins, third edition, Nueva York: Kluwer Academic/Plenum
Publishers.
GARCÍA-IVARS J. et al. (2014). “Enhancement in hydrophilicity of
different polymer phase-inversion ultrafiltration membranes by
introducing PEG/Al2O3 nanoparticles” en Separation and Purification
Technology, vol. 128, p. 45-57.
HERMIA J. (1982). “Constant pressure blocking filtration laws –
application to power law non-newtonian fluids” en Trans IChemE, vol.
60, p. 183-187.
HO C-C. y ZYDNEY L. (2000). “A combined pore blockage and cake
filtration model for protein fouling during microfiltration” en Journal of
Colloid and Interface Science, vol. 232, p. 389-399.
JARUSUTTHIRAK C., MATTARAJ S. y JIRARATANANON R. (2007).
“Influence of inorganic scalants and natural organic matter on
nanofiltration membrane fouling” en Journal of Membrane Science,
vol. 287, p. 138-145.

Modelización del ensuciamiento de las membranas ________________________________________________________________________________________________________________________________________________________
156
KABSCH-KORBUTOWICZ M. y URBANOWSKA A. (2010). “Water
treatment in integrated process using ceramic membranes” en Polish
Journal of Environmental Studies, vol. 19, p. 731-737.
KARAGÜNDÜZ A. y DIZGE N. (2013). “Investigation of membrane
biofouling in cross-flow ultrafiltration of biological suspension” en
Journal of Membrane Science and Technology, vol. 3, p. 1-5.
KAWIECKA-SKOWRON J. y MAJEWSKA-NOWAK K. (2011). “Effect
of dye content in a treated solution on performance of the UF ceramic
membrane” en Environmental Protection Engineering, vol. 37, p. 5-
12.
KAYA Y. et al. (2010). “The effect of transmembrane pressure and pH
on treatment of paper machine process waters by using a two-step
nanofiltration process” en Desalination, vol. 250, p. 150-157.
KAZEMIMOGHADAM M. y MOHAMMADI T. (2007). “Chemical
cleaning of ultrafiltration membranes in the milk industry” en
Desalination, vol. 204, p. 213-218.
KIM J. y DIGIANO F.A. (2009). “Fouling models for low-pressure
membrane systems” en Separation and Purification Technology, vol.
68, p. 293-304.
MAH S-K. et al. (2012). “Ultrafiltration of palm oil-oleic acid-glycerin
solutions: Fouling mechanism identification, fouling mechanism
analysis and membrane characterizations” en Separation and
Purification Technology, vol. 98, p. 419-431.
MATZINOS P. y ÁLVAREZ R. (2002). “Effect of ionic strength on
rinsing and alkaline cleaning of ultrafiltration inorganic membranes
fouled with whey proteins” en Journal of Membrane Science, vol. 208,
p. 23-20.
Capítulo IV ________________________________________________________________________________________________________________________________________________________
157
MILLER G.L. (1959). “Use of dinitrosalicylic acid reagent for
determination of reducing sugar” en Analytical Chemistry, vol. 31, p.
426-428.
MILLS O.E. y CREAMER L.K.A. (1975). “Conformational change in
bovine β-lactoglobulin at low pH” en Biochimica et Biophysica Acta,
vol. 379 p. 618-626.
MO H., TAY K.G. y NG H.Y. (2008). “Fouling of reverse osmosis
membrane by protein (BSA): Effects of pH, calcium, magnesium,
ionic strength and temperature” en Journal of Membrane Science,
vol. 315, p. 28-35.
MOHAMMADI T. y ESMAEELIFAR A. (2005). “Wastewater treatment
of a vegetable oil factory by a hybrid ultrafiltration-activated carbon
process” en Journal of Membrane Science, vol. 254, p. 129-137.
NIGAM M.O., BANSAL B. y CHEN X.D. (2008). “Fouling and cleaning
of whey protein concentrate fouled ultrafiltration membranes” en
Desalination, vol. 218, p. 313-322.
PENG H. y TREMBLAY A.Y. (2008). “Membrane regeneration and
filtration modeling in treating oily wastewaters” en Journal of
Membrane Science, vol. 324, p. 59-66.
PETERSON R., GEETING J. y DANIEL R. (2007). “Estimation of
ultrafilter performance based on characterization data” en Chemical
Engineering Technology, vol. 30, p. 1050-1054.
RAHIMPOUR A. y MADAENI S.S. (2010). “Improvement of
performance and surface properties of nano-porous polyethersulfone
(PES) membrane using hydrophilic monomers as additives in the
casting solution” en Journal of Membrane Science, vol. 360, p. 371-
379.
Modelización del ensuciamiento de las membranas ________________________________________________________________________________________________________________________________________________________
158
RUBY FIGUEROA, R.A., CASSANO A. y DRIOLI E. (2011).
“Ultrafiltration of orange press liquor: Optimization for permeate flux
and fouling index by response surface methodology” en Separation
and Purification Technology, vol. 80, p. 1-10.
SALAHI A., ABBASI M. y MOHAMMADI T. (2010). “Permeate flux
decline during UF of oily wastewater: experimental and modeling” en
Desalination, vol. 251, p. 153-160.
SMITH P.K. et al. (1985). “Measurement of protein using
bicinchoninic acid” en Analytical Biochemistry, vol. 150, p. 76-85.
TIEN C. y RAMARAO B.V. (2006). “On analysis of cake formation
and growth in cake filtration” en Journal of the Chinese Institute of
Chemical Engineers, vol. 37, p. 81-94.
VINCENT VELA M.C. et al. (2009). “Analysis of membrane pore
blocking models adapted to crossflow ultrafiltration in the ultrafiltration
of PEG” en Chemical Engineering Journal, vol. 149, p. 232-241.
WANG C. et al. (2012). “Membrane fouling mechanism in
ultrafiltration of succinic acid fermentation broth” en Bioresource
Technolology, vol. 116, p. 366-371.
WANG Y-N. y TANG C.Y. (2011). “Protein fouling of nanofiltration,
reverse osmosis, and ultrafiltration membranes-The role of
hydrodynamic conditions, solution chemistry and membrane
properties” en Journal of Membrane Science, vol. 376, p. 275-282.
YEE K.W.K., WILEY D.E. y BAO J. (2009). “A unified model of the
time dependence flux decline for the ultrafiltration of whey” en Journal
of Membrane Science, vol. 332, p. 69-80.
ZHANG Y. et al. (2010). “Using a membrane filtration process to
concentrate the effluent from alkaline peroxide mechanical pulping
plants” en Bioresources, vol. 5, p. 780-795.


Limpieza mediante
disoluciones salinas de
membranas ensuciadas
con proteínas

Limpieza mediante disoluciones salinas de membranas ensuciadas con proteínas
________________________________________________________________________________________________________________________________________________________
162
5.1. LIMPIEZA DE MEMBRANAS DE
ULTRAFILTRACIÓN ENSUCIADAS CON
SEROALBÚMINA BOVINA
A continuación se presenta una adaptación al formato de la Tesis
Doctoral del artículo titulado “Cleaning of ultrafiltration membranes
fouled with BSA by means of saline solutions”, publicado en la revista
Separation and Purification Technology. En él se investiga la
influencia de distintas condiciones de operación durante la etapa de
limpieza de las membranas de UF con disoluciones salinas (tipo de
sal, concentración de la misma, temperatura y velocidad tangencial
de la disolución de limpieza), sobre la eficacia hidráulica del proceso
de limpieza (EHL). Este estudio se llevó a cabo con las membranas
de 5, 15, 30 y 50 kDa previamente ensuciadas con disoluciones de
BSA. Los datos bibliográficos del artículo se destacan a continuación:
Autores: M.-J. Corbatón-Báguena, S. Álvarez-Blanco, M.-C.
Vincent-Vela
Título: Cleaning of ultrafiltration membranes fouled with BSA by
means of saline solutions
Editorial: Elsevier
Revista: Separation and Purification Technology
año: 2014 vol. 125 p. 1-10
Doi: http://dx.doi.org/10.1016/j.seppur.2014.01.035
Capítulo V ________________________________________________________________________________________________________________________________________________________
163
Cleaning of ultrafiltration membranes fouled with
BSA by means of saline solutions
María-José Corbatón-Báguena, Silvia Álvarez-Blanco*, María-Cinta
Vincent-Vela
Department of Chemical and Nuclear Engineering, Universitat
Politècnica de València, C/Camino de Vera s/n 46022 Valencia,
Spain
*Corresponding author: [email protected]
Tel: +34963879630 (Ext.: 79630)
Fax: +34963877639 (Ext.: 77639)
Abstract
In this work, four ultrafiltration (UF) membranes with molecular weight
cut-offs (MWCOs) of 5, 15, 30 and 50 kDa, respectively, were fouled
with 1 % BSA aqueous solutions and cleaned with different saline
solutions. The influence of MWCO, membrane material and operating
conditions on the cleaning efficiency was investigated. Saline
solutions were able to clean the 5, 15 and 30 kDa membranes, but
not the 50 kDa membrane. NaCl, NaNO3, NH4Cl and KCl were the
most effective salts. The cleaning tests demonstrated that the higher
the temperature of the saline solution was, the higher the cleaning
efficiency was also. In addition, an increase in the crossflow velocity
resulted in an increase in the hydraulic cleaning efficiency (HCE).
Limpieza mediante disoluciones salinas de membranas ensuciadas con proteínas
________________________________________________________________________________________________________________________________________________________
164
However, there was an optimum value of salt concentration to clean
the membrane effectively. Response Surface Methodology was used
to investigate the relationship between salt concentration and
temperature in the cleaning process.
Keywords: Ultrafiltration; BSA; saline solutions; cleaning; hydraulic
efficiency
5.1.1. Introduction
In the last years, the purification and fractionation of whey proteins
has grown in interest due to their nutritional, functional and biological
characteristics and their therapeutic and food applications. The major
whey proteins are β-lactoglobulin (β-LG), α-lactalbumin (α-LA),
bovine serum albumin (BSA) and immunoglobulin (Ig) (Almécija et al.,
2009a). Membrane separation technologies are being increasingly
used in the food industry to fractionate and purify these proteins as an
alternative to the conventional concentration and purification methods
(Ogunbiyi et al., 2008). Among all the separation processes,
ultrafiltration (UF) is one of the most used in the dairy industry. Its
most well-known applications are milk dehydration and whey
concentration (Kazemimoghadam and Mohammadi, 2007).
Cleaning of UF membranes in the food industry is a key step of the
global process. In most cases, cleaning needs to be carried out up to
once a day to remove fouling from the membrane surface and to
recover the permeability and selectivity of the membrane (Blanpain-

Capítulo V ________________________________________________________________________________________________________________________________________________________
165
Avet et al., 2009). Some authors reported that more than 80 % of the
total production costs in the dairy industry are attributed to the
cleaning of the equipments (Almécija et al., 2009a). For that reason,
choosing the best cleaning agents and operating conditions to
optimize the cleaning processes is necessary (Kazemimoghadam
and Mohammadi, 2007).
Membrane cleaning can be performed by means of physical,
chemical and biological cleaning procedures. However, chemical
methods are the most often used in the food industry
(Kazemimoghadam and Mohammadi, 2007). Some of these chemical
agents are acids, alkalis, surfactants, disinfectants or combinations of
them. Choosing one or another depends on the feed composition, the
type of foulants deposited on the membrane surface and the structure
of the membranes (Cabero et al., 1999). However, in order to clean
the membranes fouled with milk and whey, most of the studies in the
literature recommend the same cleaning protocol: one alkali washing
step followed by an acid washing step (Ogunbiyi et al, 2008;
Kazemimoghadam and Mohammadi, 2007; Almécija et al., 2009b). If
the membrane separation characteristics are not the initial ones after
this protocol, another washing stage based on disinfectants or
surfactants, such as sodium hypochloride or sodium dodecyl
sulphate, can be performed (Almécija et al., 2009a).
Nevertheless, these conventional cleaning operations may be
aggressive for the membranes and may damage them more or less
quickly, reducing the membrane lifetime and selectivity and
increasing the productions costs (large energy and water
Limpieza mediante disoluciones salinas de membranas ensuciadas con proteínas
________________________________________________________________________________________________________________________________________________________
166
consumption and long duration of the cleaning cycle) (Blanpain-Avet
et al, 2009). In addition, conventional cleaning agents have a
negative impact on the environment when they are discharged as
waste streams after the cleaning process. To overcome these
problems, cleaning based on alternative techniques such as
ultrasounds, saline solutions or electromagnetic fields are growing in
interest in the last years (Muthukumaran et al., 2004; Tarazaga et al.,
2006). However, only a few papers are related to the cleaning of
membranes by means of saline solutions (Lee and Elimelech, 2007).
In this case, previous studies (Lee and Elimelech, 2007)
demonstrated that inert salts or even seawater can be effective for
removing the natural organic matter deposited on a reverse osmosis
membrane. Saline solutions cause changes on the cross-linked
fouling layer due to the different concentration in the bulk solution and
in the gel layer, breaking the integrity of the gel layer. Then, an ion-
exchange reaction between salt ions and foulant molecules occurs,
which results in the complete breakup of the gel layer. On the other
hand, several authors (Hofmeister, 1888; Curits and Lue, 2006;
Zhang, 2012) reported the salting-out and salting-in capability of
several anions and cations to decrease or increase protein solubility,
respectively. They investigated the protein-protein interactions in
different salt solutions at pH values above and below the isoelectric
point (pI) of the proteins.
The aim of this work is to evaluate the ability of saline solutions to
clean two flat-sheet polymeric UF membranes with molecular weight
cut-offs (MWCOs) of 5 and 30 kDa and two monotubular ceramic UF
membranes with MWCOs of 15 and 50 kDa fouled by BSA 1 % (w/w).
Capítulo V ________________________________________________________________________________________________________________________________________________________
167
The influence of MWCO, membrane material and operating
conditions of the cleaning process (temperature, crossflow velocity
and salt concentration of the cleaning solution) on the efficiency of the
cleaning process was investigated. The optimal values of these
operating conditions to achieve the highest cleaning efficiency were
determined by means of a Response Surface Methodology (RSM)
analysis.
5.1.2. Response Surface Methodology
A common method to study the performance of membrane processes
is the “one-factor-at-a time” approach, which is based in the variation
of one factor while the other factors are kept constant (Ruby Figueroa
et al., 2011). In some experimental set-ups, the number of factors to
study is large. In the case of membrane technologies these factors
usually are transmembrane pressure, crossflow velocity, time,
temperature, solute concentration and pH. In this case, a traditional
approach may result in a lot of experimental runs that require high
energy, chemicals and time consumption. In addition, this approach
ignores interaction effects between the considered factors and it is
not appropriate to optimize the process (Cojocaru and Zakrzewska-
Trznadel, 2007). To overcome these limitations, the RSM analysis
can be used.
RSM is a combination of statistical and mathematical techniques
widely used in the development, improvement and optimization of
processes that contain a variable of interest (response variable)

Limpieza mediante disoluciones salinas de membranas ensuciadas con proteínas
________________________________________________________________________________________________________________________________________________________
168
influenced by several variables, and it is used to evaluate the relative
significance of these variables even in the presence of complex
interactions. The objective of RSM is the investigation of the response
variable over the entire factor space, determining the optimum
operating conditions or a region where the response variable satisfies
the operating specifications (near to its optimal value) (Ruby Figueroa
et al., 2011; Cojocaru and Zakrzewska-Trznadel, 2007; Garg et al.,
2008).
5.1.3. Experimental
5.1.3.1. Materials
Fouling experiments were performed using a BSA aqueous solution
with a concentration of 1 % (w/w) as a feed solution. BSA was
supplied in powder (98% purity, A3733, Sigma-Aldrich) and feed
solutions were prepared by dissolving BSA in deionized water until
the desired concentration was achieved. BSA has a molecular weight
of approximately 66 kDa and its isoelectric point is 4.9, according to
the manufacturer. Feed solutions had a pH of about 7, thus BSA has
mainly negative net charge on its surface. Its configuration is elliptic
(11.6x2.7x2.7 nm) and it is one of the most widely used whey proteins
to prepare model solutions for UF experiments (Suttiprasit et al.,
1992; Wang and Tang, 2011; Afonso et al., 2009). According to the
information provided by the manufacturer, BSA used in the
experiments was prepared using a heat shock fractionation method
followed by a lyophilization process to obtain BSA in a powder form.
Capítulo V ________________________________________________________________________________________________________________________________________________________
169
After the fouling step, membranes were rinsed with deionized water to
remove the loose protein deposit on the membrane surface. Then,
the membranes were cleaned with several saline solutions (NaCl,
NaNO3, Na2SO4, KCl, and NH4Cl). The chemicals were supplied by
Panreac (Spain). The solutions were prepared dissolving the salts in
deionized water with no pH adjustment. Different salt concentrations
were used to study the influence of salt type and concentration on
HCE.
Finally, the membranes were cleaned to recover their initial
permeability conditions if it was necessary. In the case of the
polymeric membranes, NaOH (Panreac, Spain) aqueous solutions
with a pH of 11 at 45 ºC were used, while NaClO (Panreac, Spain)
aqueous solutions with a concentration of 250 ppm (adjusting the pH
at 11 with NaOH supplied by Panreac, Spain) were used to clean the
ceramic membranes.
5.1.3.2. Membranes
Two monotubular ceramic membranes INSIDE CéRAMTM (TAMI
Industries, France) and two flat sheet polymeric membranes
(Microdyn-Nadir, Germany) were used in the experiments. The
ceramic membranes were 200 mm long with an internal diameter of
6 mm and an external diameter of 10 mm. They consisted of a TiO2
support layer and a ZrO2-TiO2 active layer. The molecular weight cut-
offs (MWCOs) of these membranes were 15 and 50 kDa,
respectively. Polymeric membranes were polyethersulfone (PES)
Limpieza mediante disoluciones salinas de membranas ensuciadas con proteínas
________________________________________________________________________________________________________________________________________________________
170
membranes with an effective area of 100 cm2 and two different
MWCOs (5 and 30 kDa).
5.1.3.3. Experimental set-up
All fouling and cleaning experiments were performed in a VF-S11 UF
plant (Orelis, France). The main parts of the plant are (Fig. 26): a feed
tank, a temperature regulating system, a variable speed volumetric
pump, two manometers placed at both sides of the membrane
module and a scale. The feed tank consists of a 10 L stainless steel
tank with a double jacket, which contained the BSA or the cleaning
solution. The temperature was kept constant during the experiments
by means of the temperature regulating system. Crossflow velocity
was controlled with a variable speed volumetric pump. The maximum
operating pressure was 4 bar. Pressure drop across the membrane
module was measured with two manometers. Finally, a scale (0.001 g
accuracy) was used to gravimetrically determine the permeate flux.
Both the retentate and the permeate were recirculated back to the
feed tank in order to keep the concentration of the feed solution
constant, except in the case of the rinsing step.
5.1.3.4. Experimental procedure
Fouling experiments
Fouling tests were carried out with a 1 % (w/w) BSA aqueous solution
at a transmembrane pressure of 2 bar and a crossflow velocity of
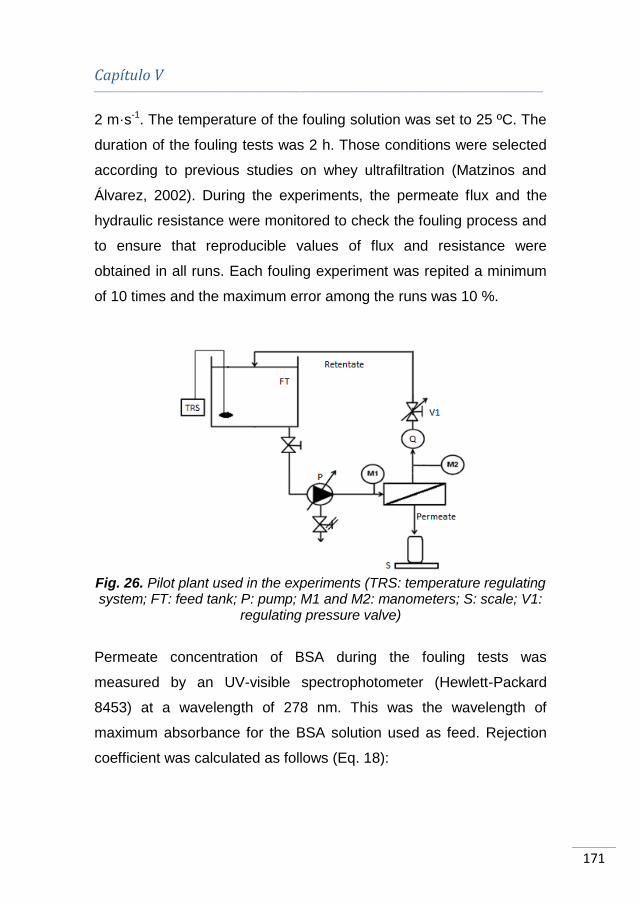
Capítulo V ________________________________________________________________________________________________________________________________________________________
171
2 m·s-1. The temperature of the fouling solution was set to 25 ºC. The
duration of the fouling tests was 2 h. Those conditions were selected
according to previous studies on whey ultrafiltration (Matzinos and
Álvarez, 2002). During the experiments, the permeate flux and the
hydraulic resistance were monitored to check the fouling process and
to ensure that reproducible values of flux and resistance were
obtained in all runs. Each fouling experiment was repited a minimum
of 10 times and the maximum error among the runs was 10 %.
Fig. 26. Pilot plant used in the experiments (TRS: temperature regulating system; FT: feed tank; P: pump; M1 and M2: manometers; S: scale; V1:
regulating pressure valve)
Permeate concentration of BSA during the fouling tests was
measured by an UV-visible spectrophotometer (Hewlett-Packard
8453) at a wavelength of 278 nm. This was the wavelength of
maximum absorbance for the BSA solution used as feed. Rejection
coefficient was calculated as follows (Eq. 18):
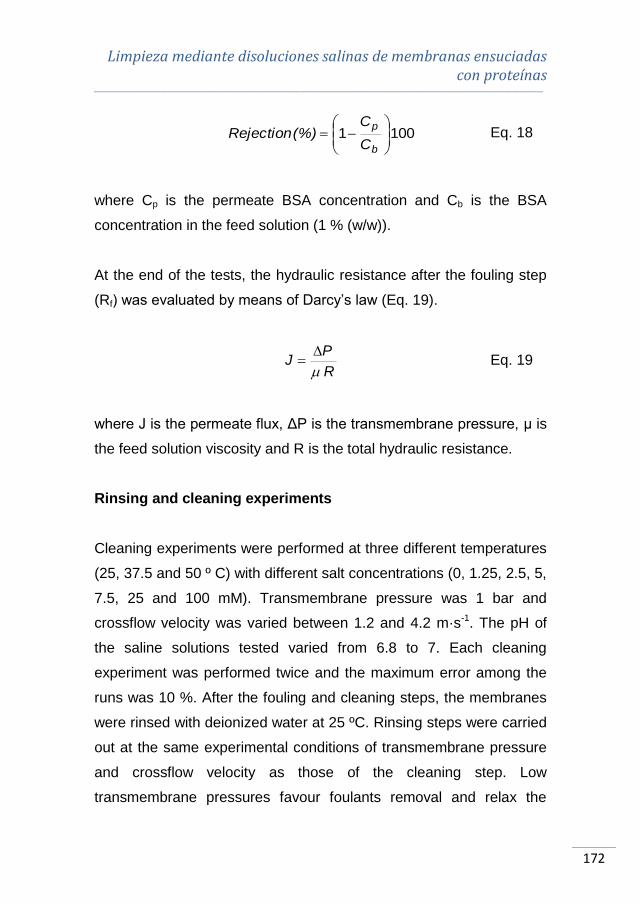
Limpieza mediante disoluciones salinas de membranas ensuciadas con proteínas
________________________________________________________________________________________________________________________________________________________
172
1001 ·C
C(%) Rejection
b
p
Eq. 18
where Cp is the permeate BSA concentration and Cb is the BSA
concentration in the feed solution (1 % (w/w)).
At the end of the tests, the hydraulic resistance after the fouling step
(Rf) was evaluated by means of Darcy’s law (Eq. 19).
R·
PJ
Eq. 19
where J is the permeate flux, ΔP is the transmembrane pressure, μ is
the feed solution viscosity and R is the total hydraulic resistance.
Rinsing and cleaning experiments
Cleaning experiments were performed at three different temperatures
(25, 37.5 and 50 º C) with different salt concentrations (0, 1.25, 2.5, 5,
7.5, 25 and 100 mM). Transmembrane pressure was 1 bar and
crossflow velocity was varied between 1.2 and 4.2 m·s-1. The pH of
the saline solutions tested varied from 6.8 to 7. Each cleaning
experiment was performed twice and the maximum error among the
runs was 10 %. After the fouling and cleaning steps, the membranes
were rinsed with deionized water at 25 ºC. Rinsing steps were carried
out at the same experimental conditions of transmembrane pressure
and crossflow velocity as those of the cleaning step. Low
transmembrane pressures favour foulants removal and relax the
Capítulo V ________________________________________________________________________________________________________________________________________________________
173
compressible fouling layer formed in the fouling step (Blanpain-Avet
et al., 2009).
Finally, if the initial permeability of the membranes was not recovered
after the cleaning process, the ceramic membranes were cleaned
with a NaClO aqueous solution at pH 11 and the polymeric
membranes were cleaned with NaOH aqueous solutions at pH 11, as
it was indicated in section 5.1.3.1 and it was recommended by the
manufacturer.
5.1.3.5. Evaluation of membrane cleanliness
The efficiency of the cleaning protocol was determined following the
method developed by Daufin et al. (2001) and Matzinos and Álvarez
(2002). These authors determined the hydraulic resistance of the
membrane after each step (fouling, first rinsing, cleaning and second
rinsing) when it was cleaned with sodium hydroxide solutions. They
proposed the term “hydraulic rinsing efficiency” (HRE) to evaluate the
efficiency of the first rinsing to restore the membrane permeability.
The HRE is calculated as follows:
1001·RR
RRHRE
mf
rf
Eq. 20
where Rf is the hydraulic resistance after the fouling step, Rr1 is the
hydraulic resistance after the first rinsing step and Rm is the hydraulic
resistance of the new membrane.
Limpieza mediante disoluciones salinas de membranas ensuciadas con proteínas
________________________________________________________________________________________________________________________________________________________
174
These authors (Daufin et al., 2001; Matzinos and Álvarez, 2002;
Muthukumaran et al., 2007), used a similar equation (Eq. 21) to
evaluate the efficiency of the entire cleaning process (after the
second rinsing) to restore the initial membrane permeability:
1002 ·RR
RRHCE
mf
rf
Eq. 21
where HCE is the hydraulic cleaning efficiency and Rr2 is the
hydraulic resistance after the second rinsing.
5.1.3.6. AFM measurements
The roughness of the membranes studied was measured by atomic
force microscopy (AFM) using a Multimode atomic force microscope
(Veeco, Santa Barbara, CA, USA) equipped with a NanoScope V
controller. Measurements were performed at ambient conditions
using the tapping mode of imaging. Roughness values were obtained
from 5 μm x 5 μm samples and considering the average value of five
areas of 1 μm x 1 μm. Among the different parameters to evaluate the
membrane roughness, the Root Mean Square roughness (Rq) was
selected. This is one of the most often used parameters to study
membrane roughness. It represents the standard deviation of the
height values (Z) of the surface within a specific area, according to
the Eq. 22 (Chung et al., 2002):
p
avgiq
N
ZZR
2
Eq. 22
Capítulo V ________________________________________________________________________________________________________________________________________________________
175
where Zi is the Z value currently measured, Zavg is the average of the
Z values and Np is the number of points within the given area.
5.1.3.7. RSM analysis
After the cleaning processes, a RSM analysis was carried out to
evaluate which values of the operating conditions resulted in the
highest HCE. The RSM analysis was performed with the
Statgraphics® software using a factorial design. The experimental
data used for the statistical analysis is shown in Table 18. A
relationship between the response variable (HCE) and the design
variables (temperature, Tc, NaCl concentration, C, and crossflow
velocity, v) was obtained. A Multiple Linear Regression analysis was
applied to search for a model equation for HCE as a function of the
operating conditions studied. Firstly, all the independent variables and
their interactions were taken into account. Then, the coefficients of
the regression model with p-values higher than 0.05 were neglected
because they were not significant and a new regression analysis was
performed.
5.1.3.8. Optimization method
After the RSM analysis, an optimization algorithm based on a pattern
search was used to evaluate the values of temperature, NaCl
concentration and crossflow velocity that maximize the HCE for each
membrane. The optimization method was performed using the
“patternsearch” function of Matlab® software.

Limpieza mediante disoluciones salinas de membranas ensuciadas con proteínas
________________________________________________________________________________________________________________________________________________________
176
Table 18. Experimental data for the statistical analysis
MWCO (kDa) Tc (ºC) C (mM) v (m·s-1) HCE (%)
5
25 0 2.18 41.10
25 2.5 2.18 59.20
25 5 2.18 60.17
37.5 0 2.18 57.49
37.5 2.5 2.18 80.21
37.5 5 2.18 89.59
50 0 2.18 75.49
50 2.5 2.18 94.36
50 5 2.18 99.58
50 5 1.69 67.00
50 5 1.20 45.74
15
25 0 4.20 45.77
25 2.5 4.20 56.49
25 5 4.20 49.03
37.5 0 4.20 59.99
37.5 2.5 4.20 80.68
37.5 5 4.20 91.49
50 0 4.20 58.99
50 2.5 4.20 100.00
50 5 4.20 100.00
50 2.5 3.19 90.07
50 2.5 2.18 58.93
30
25 0 2.18 35.94
25 2.5 2.18 58.31
25 5 2.18 53.32
37.5 0 2.18 54.24
37.5 2.5 2.18 77.71
37.5 5 2.18 87.55
50 0 2.18 72.67
50 2.5 2.18 91.23
50 5 2.18 100.00
50 5 1.69 85.11
50 5 1.20 69.27
Capítulo V ________________________________________________________________________________________________________________________________________________________
177
“Patternsearch” finds the minimum of an objective function by means
of a pattern search. As the aim of this work is to achieve the
maximum of the model equations HCE5, HCE15 and HCE30, the
objective functions selected for the “patternsearch” algorithm were the
negative form of these equations (-HCE5, -HCE15 and -HCE30). In
addition, the maximum value of temperature was limited to 50 ºC and
the maximum value of crossflow velocity was limited to 2.18 m·s-1 for
the 5 and 30 kDa membranes and 4.2 m·s-1 for the 15 kDa
membrane, as these were the higher values tested for these design
variables.
5.1.4. Results and discussion
The values of Rm for the membranes used in the experiments were:
9.453·1012, 5.001·1012, 3.794·1012 and 1.921·1012 m-1, for the
membranes of 5, 15, 30 and 50 kDa, respectively. These values were
taken as a reference to calculate HCE.
5.1.4.1. Fouling experiments
Fig. 27 shows the evolution of permeate flux with time for all the
membranes tested at a transmembrane pressure of 2 bar, a crossflow
velocity of 2 m·s-1 and a temperature of 25 ºC. The experimental data
that corresponds to the membrane of 50 kDa show a sharp flux
decline in the first minutes of operation. This is not observed for the
membranes of 5, 15 and 30 kDa, which show a much lower flux
decline rate. This can be attributed to the fact that the 50 kDa

Limpieza mediante disoluciones salinas de membranas ensuciadas con proteínas
________________________________________________________________________________________________________________________________________________________
178
membrane shows a MWCO much closer to the molecular weight of
BSA molecules (66 kDa) than the rest of the membranes.
Fig. 27. Evolution of permeate flux with time during fouling experiments
at 2 bar, 2 m·s-1
and 25 ºC
These results are in accordance with previous works. For example,
Qu et al. (2014) fouled three PES membranes of 10, 30 and 100 kDa
with extracellular organic matter (EOM). The molecular weight
distribution was divided into two fractions, a high molecular weight
fraction (greater than 100 kDa) and a low molecular weight fraction
(lower than 100 kDa). They observed that the membranes of 10 and
30 kDa showed the most severe fouling in terms of high relative flux
reduction and the worse fouling reversibility. This was due to the fact
that the MWCOs of these membranes and the molecular weight of
low molecular weight EOM were more similar than in the case of the
100 kDa membrane. Therefore, low molecular weight EOM can
penetrate inside the pores of the 10 and 30 kDa membranes and
cause pore constriction. As a consequence, these membranes
0
1
2
3
4
5
0 25 50 75 100 125 150 175 200
J·1
05
(m3·m
-2·s
-1)
t (min)
5 kDa
15 kDa
30 kDa
50 kDa

Capítulo V ________________________________________________________________________________________________________________________________________________________
179
showed more severe fouling. These authors demonstrated that
fouling is more severe when the difference between the membrane
MWCO and the molecular weight of solute molecules is lower.
Fig. 28 shows the evolution of the rejection coefficient with time
during the fouling step for all the membranes tested. As it can be
observed, the rejection coefficient achieved steady-state values after
about 100 min of operation for all the membranes tested. Although all
the membranes had a rejection coefficient higher than 99 % at the
end of the step, the 50 kDa membrane showed the lowest rejection
coefficient. This can be explained taking into account the difference
between the size of BSA molecules and the membrane pore size.
That difference is larger for the low MWCO membranes (5 and
15 kDa) and thus, the values of rejection are higher than in the case
of the 30 and 50 kDa membranes. This is in agreement with other
authors (Schäfer et al., 2000; Adikane et al., 2004).
Fig. 28. Evolution of rejection with time during the fouling step for each
membrane
98
98.5
99
99.5
100
0 20 40 60 80 100 120 140 160 180 200
Reje
ctio
n (%
)
t (min)
5 kDa
15 kDa
30 kDa
50 kDa
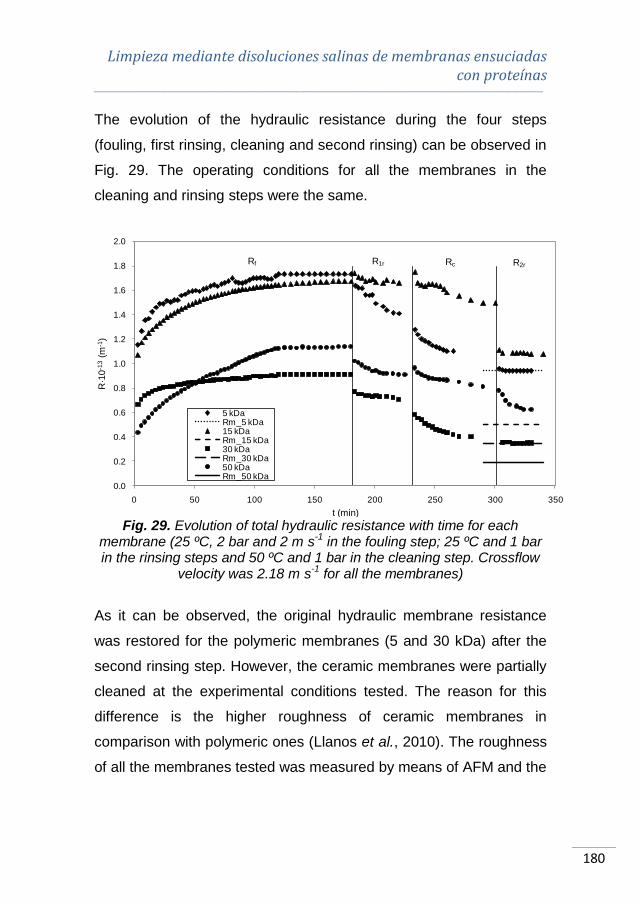
Limpieza mediante disoluciones salinas de membranas ensuciadas con proteínas
________________________________________________________________________________________________________________________________________________________
180
The evolution of the hydraulic resistance during the four steps
(fouling, first rinsing, cleaning and second rinsing) can be observed in
Fig. 29. The operating conditions for all the membranes in the
cleaning and rinsing steps were the same.
Fig. 29. Evolution of total hydraulic resistance with time for each
membrane (25 ºC, 2 bar and 2 m·s-1
in the fouling step; 25 ºC and 1 bar in the rinsing steps and 50 ºC and 1 bar in the cleaning step. Crossflow
velocity was 2.18 m·s-1
for all the membranes)
As it can be observed, the original hydraulic membrane resistance
was restored for the polymeric membranes (5 and 30 kDa) after the
second rinsing step. However, the ceramic membranes were partially
cleaned at the experimental conditions tested. The reason for this
difference is the higher roughness of ceramic membranes in
comparison with polymeric ones (Llanos et al., 2010). The roughness
of all the membranes tested was measured by means of AFM and the
0.0
0.2
0.4
0.6
0.8
1.0
1.2
1.4
1.6
1.8
2.0
0 50 100 150 200 250 300 350
R·1
0-1
3(m
-1)
t (min)
5 kDaRm_5 kDa15 kDaRm_15 kDa30 kDaRm_30 kDa50 kDaRm_50 kDa
Rf R1r Rc R2r

Capítulo V ________________________________________________________________________________________________________________________________________________________
181
values of Rq obtained were 0.487, 17.900, 1.657 and 27.133 nm for
the membranes of 5, 15, 30 and 50 kDa, respectively. In order to
increase the cleaning efficiency, higher crossflow velocities were
considered to clean the ceramic membranes.
5.1.4.2. Cleaning experiments
Effect of the salt type
The 15 kDa membrane was used to investigate the effect of the salt
type on the HCE. Fig. 30 shows the values of the HCE obtained when
different saline solutions were used to clean this membrane at 25 ºC.
The values of the HCE were also compared with the values of the
HRE. As it can be observed, the highest values of HCE were
obtained for chloride salts and NaNO3. For these saline solutions the
HCE was very similar, varying from 45.9 to 55.3 %. These values
were considerably higher than the HRE (22.8 %). Therefore, these
salts were able to remove part of the fouling layer at the operating
conditions considered.
Among all the salts tested, Na2SO4 showed the lowest value of HCE
(23.4 %) at the experimental conditions tested. This value is very
similar to the value of HRE (22.8 %). Therefore, at 25 ºC and 100 mM
no improvement on the cleaning efficiency was observed when a
Na2SO4 solution was used to clean the membrane fouled with a BSA
aqueous solution of 1 % (w/w).
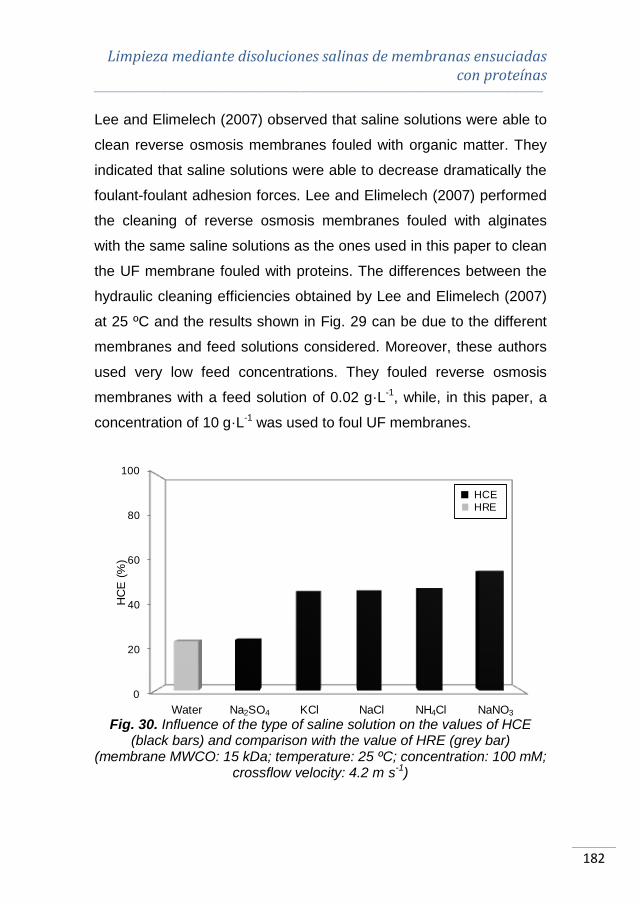
Limpieza mediante disoluciones salinas de membranas ensuciadas con proteínas
________________________________________________________________________________________________________________________________________________________
182
Lee and Elimelech (2007) observed that saline solutions were able to
clean reverse osmosis membranes fouled with organic matter. They
indicated that saline solutions were able to decrease dramatically the
foulant-foulant adhesion forces. Lee and Elimelech (2007) performed
the cleaning of reverse osmosis membranes fouled with alginates
with the same saline solutions as the ones used in this paper to clean
the UF membrane fouled with proteins. The differences between the
hydraulic cleaning efficiencies obtained by Lee and Elimelech (2007)
at 25 ºC and the results shown in Fig. 29 can be due to the different
membranes and feed solutions considered. Moreover, these authors
used very low feed concentrations. They fouled reverse osmosis
membranes with a feed solution of 0.02 g·L-1, while, in this paper, a
concentration of 10 g·L-1 was used to foul UF membranes.
Fig. 30. Influence of the type of saline solution on the values of HCE
(black bars) and comparison with the value of HRE (grey bar) (membrane MWCO: 15 kDa; temperature: 25 ºC; concentration: 100 mM;
crossflow velocity: 4.2 m·s-1
)
0
20
40
60
80
100
HC
E (
%)
Water Na2SO4 KCl NaCl NH4Cl NaNO3
HCEHRE
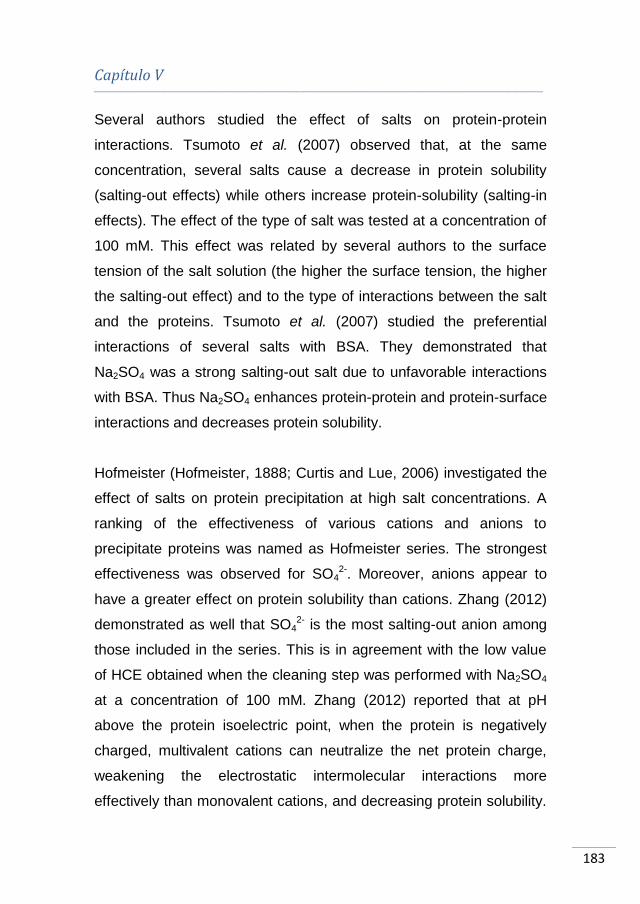
Capítulo V ________________________________________________________________________________________________________________________________________________________
183
Several authors studied the effect of salts on protein-protein
interactions. Tsumoto et al. (2007) observed that, at the same
concentration, several salts cause a decrease in protein solubility
(salting-out effects) while others increase protein-solubility (salting-in
effects). The effect of the type of salt was tested at a concentration of
100 mM. This effect was related by several authors to the surface
tension of the salt solution (the higher the surface tension, the higher
the salting-out effect) and to the type of interactions between the salt
and the proteins. Tsumoto et al. (2007) studied the preferential
interactions of several salts with BSA. They demonstrated that
Na2SO4 was a strong salting-out salt due to unfavorable interactions
with BSA. Thus Na2SO4 enhances protein-protein and protein-surface
interactions and decreases protein solubility.
Hofmeister (Hofmeister, 1888; Curtis and Lue, 2006) investigated the
effect of salts on protein precipitation at high salt concentrations. A
ranking of the effectiveness of various cations and anions to
precipitate proteins was named as Hofmeister series. The strongest
effectiveness was observed for SO42-. Moreover, anions appear to
have a greater effect on protein solubility than cations. Zhang (2012)
demonstrated as well that SO42- is the most salting-out anion among
those included in the series. This is in agreement with the low value
of HCE obtained when the cleaning step was performed with Na2SO4
at a concentration of 100 mM. Zhang (2012) reported that at pH
above the protein isoelectric point, when the protein is negatively
charged, multivalent cations can neutralize the net protein charge,
weakening the electrostatic intermolecular interactions more
effectively than monovalent cations, and decreasing protein solubility.
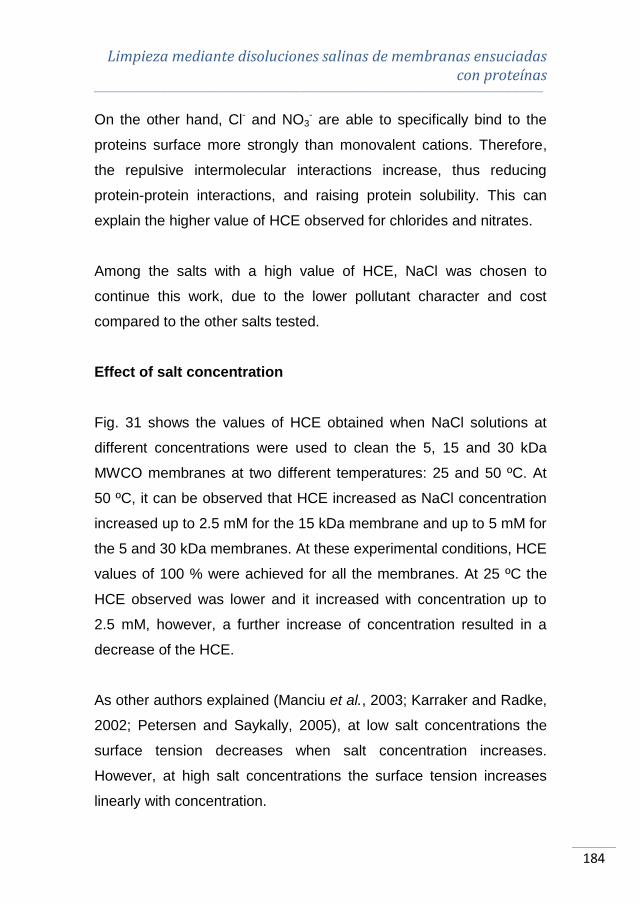
Limpieza mediante disoluciones salinas de membranas ensuciadas con proteínas
________________________________________________________________________________________________________________________________________________________
184
On the other hand, Cl- and NO3- are able to specifically bind to the
proteins surface more strongly than monovalent cations. Therefore,
the repulsive intermolecular interactions increase, thus reducing
protein-protein interactions, and raising protein solubility. This can
explain the higher value of HCE observed for chlorides and nitrates.
Among the salts with a high value of HCE, NaCl was chosen to
continue this work, due to the lower pollutant character and cost
compared to the other salts tested.
Effect of salt concentration
Fig. 31 shows the values of HCE obtained when NaCl solutions at
different concentrations were used to clean the 5, 15 and 30 kDa
MWCO membranes at two different temperatures: 25 and 50 ºC. At
50 ºC, it can be observed that HCE increased as NaCl concentration
increased up to 2.5 mM for the 15 kDa membrane and up to 5 mM for
the 5 and 30 kDa membranes. At these experimental conditions, HCE
values of 100 % were achieved for all the membranes. At 25 ºC the
HCE observed was lower and it increased with concentration up to
2.5 mM, however, a further increase of concentration resulted in a
decrease of the HCE.
As other authors explained (Manciu et al., 2003; Karraker and Radke,
2002; Petersen and Saykally, 2005), at low salt concentrations the
surface tension decreases when salt concentration increases.
However, at high salt concentrations the surface tension increases
linearly with concentration.
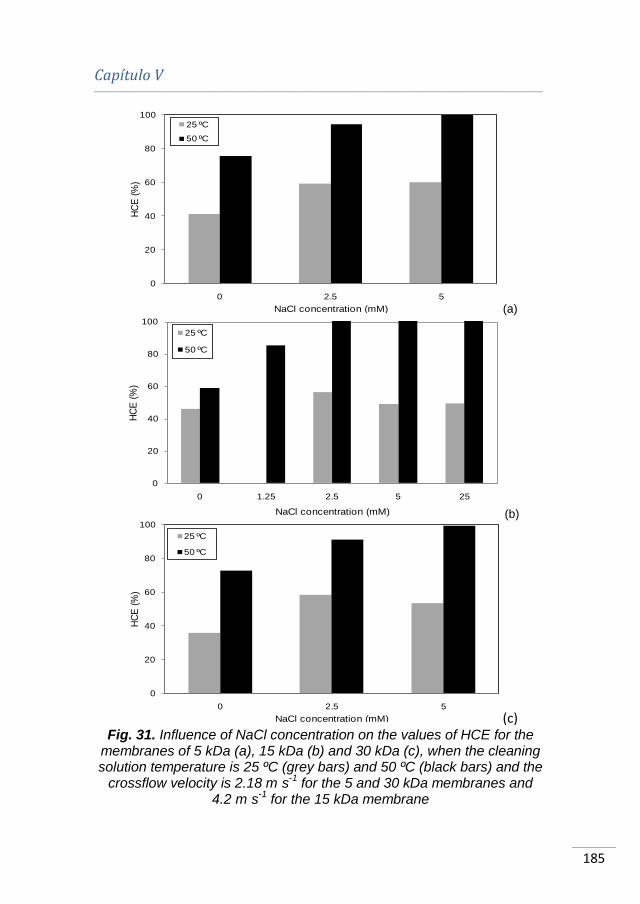
Capítulo V ________________________________________________________________________________________________________________________________________________________
185
(a)
(b)
(c) Fig. 31. Influence of NaCl concentration on the values of HCE for the
membranes of 5 kDa (a), 15 kDa (b) and 30 kDa (c), when the cleaning solution temperature is 25 ºC (grey bars) and 50 ºC (black bars) and the
crossflow velocity is 2.18 m·s-1
for the 5 and 30 kDa membranes and 4.2 m·s
-1 for the 15 kDa membrane
0
20
40
60
80
100
0 2.5 5
HC
E (
%)
NaCl concentration (mM)
25 ºC
50 ºC
0
20
40
60
80
100
0 1.25 2.5 5 25
HC
E (
%)
NaCl concentration (mM)
25 ºC
50 ºC
0
20
40
60
80
100
0 2.5 5
HC
E (
%)
NaCl concentration (mM)
25 ºC
50 ºC

Limpieza mediante disoluciones salinas de membranas ensuciadas con proteínas
________________________________________________________________________________________________________________________________________________________
186
According to Tsumoto et al. (2007), a decrease in the surface tension
results in an enhancement of the salting-in effects of the saline
solutions. Therefore, the salting-in effects are better observed at low
salt concentrations. On the other hand, HCE cannot increase with salt
concentration if the physical conditions for the mass transport of the
protein deposits removed from the gel layer to the bulk solution are
not the optimal. There is an optimal salt concentration to carry out the
cleaning process. Up to this concentration, when salt concentration
increases, HCE increases. But above this concentration HCE does
not increase with salt concentration or it can even decrease. This may
be due to the fact that membrane fouling due to the accumulation of
salt molecules on the membrane surface or inside its pores may also
occur. In this case, fouling and cleaning mechanisms become
competitive. This is in agreement with the results reported by Lee and
Elimelech (2007) and Cabero Cabero (1997). The increase in HCE
with an increase of salt concentration is greater at high temperatures.
This is due to the effect of temperature on protein deposits. This
effect is commented in section “Effect of cleaning solution
temperature”.
Fig. 32 shows the values of the HCE when the 50 kDa membrane
was cleaned with NaCl solutions at different concentrations at 50 ºC.
As it can be observed, HCE increased as NaCl concentration
increased up to a certain value (7.5 mM) and afterwards it decreased.
However, the maximum value of HCE for the 50 kDa membrane was
79.19 %, while in the case of the 15, 5 and 30 kDa membranes (Fig.
31), a 100 % HCE was achieved at low salt concentrations (2.5 and
5 mM, respectively). Therefore, the 50 kDa membrane was not

Capítulo V ________________________________________________________________________________________________________________________________________________________
187
completely cleaned with NaCl solutions at the experimental conditions
tested. This can be due to the more severe fouling that was observed
for this membrane as it was commented in section 5.1.4.1. In this
case, the temperature of 25 ºC was not considered as even lower
HCE could be expected.
Fig. 32. Influence of NaCl concentration on the values of HCE for the
membrane of 50 kDa, when the cleaning solution temperature is 50 ºC and the crossflow velocity is 4.2 m·s
-1
Effect of cleaning solution temperature
Fig. 33 shows the values of HCE for the 5, 15 and 30 kDa
membranes when the cleaning step was performed at different
temperatures and a NaCl concentration of 5 mM. According to Fig.
31, 100 % of HCE was achieved for all the membranes at 50 ºC, but
not in the case of 25 ºC. Thus, an intermediate temperature (37.5 ºC)
was considered as well to investigate the effect of the cleaning
solution temperature on the HCE. As it can be observed, the higher
0
20
40
60
80
100
0 2.5 5 7.5 10 15 20
HC
E (
%)
NaCl concentration (mM)
50 ºC
Limpieza mediante disoluciones salinas de membranas ensuciadas con proteínas
________________________________________________________________________________________________________________________________________________________
188
the temperature of the cleaning solution is, the higher the HCE is,
achieving an efficiency of 100 % when the cleaning was carried out at
50 ºC for the 5, 15 and 30 kDa membranes.
Fig. 33. Influence of temperature on the values of HCE for the
membranes of 5 kDa (white bars), 15 kDa (dark grey bars) and 30 kDa (black bars), when NaCl concentration is 5 mM and the crossflow
velocity is 2.18 m·s-1
for the 5 and 30 kDa membranes and 4.2 m·s-1
for the 15 kDa membrane
The increase of HCE when temperature varies from 25 to 37.5 ºC is
higher than the increase of HCE when temperature increases from
37.5 to 50 ºC (about 85 % in the first case and 9 % in the second
case). This effect can also be observed in Fig. 31. In this case, HCE
was plotted as a function of concentration for two different
temperatures (25 and 50 ºC, respectively). As it can be observed, for
each concentration HCE increases with temperature.
0
20
40
60
80
100
25 37.5 50
HC
E (
%)
Temperature (ºC)
5 kDa
15 kDa
30 kDa

Capítulo V ________________________________________________________________________________________________________________________________________________________
189
When the temperature of the saline solution increases, the surface
tension decreases (Ali et al., 2008; Shah et al., 2013). The decrease
in the surface tension is caused by the adsorption of hydrophilic ions
from the air/water surface (Matubayasi and Yoshikawa, 2007).
According to several authors, surface tension decreases linearly with
temperature. As it was reported by Tsumoto et al. (2007), the higher
the surface tension, the stronger the salting-out effects of the salt.
Temperature has also an effect on protein solubility. In general,
protein solubility increases with temperature up to 50 ºC. However,
when the temperature of the solution is high enough during a certain
time, the protein is denatured. Proteins are denatured due to the
effect of temperature on the non-covalent bonds involved in the
stabilization of secondary and tertiary structure. Denaturation
decreases protein solubility compared to the native protein (Pelegrine
and Gasparetto, 2005). In addition, in mass transfer processes, the
diffusivity coefficient increases as temperature rises. Therefore, the
rate of transfer of solute molecules from the membrane surface
towards the bulk solution is greater. Moreover, high temperatures can
weaken the structural stability of the fouling layer, swelling it and
facilitating its removal from the membrane surface. An increase in
temperature may also increase the rate of the interaction between the
salt and the deposited proteins (Lee and Elimelech, 2007).
For all these reasons, the most convenient temperature to carry out
the cleaning of the 5, 15 and 30 kDa membranes fouled with BSA
solutions is about 50 ºC (the highest temperature tested).
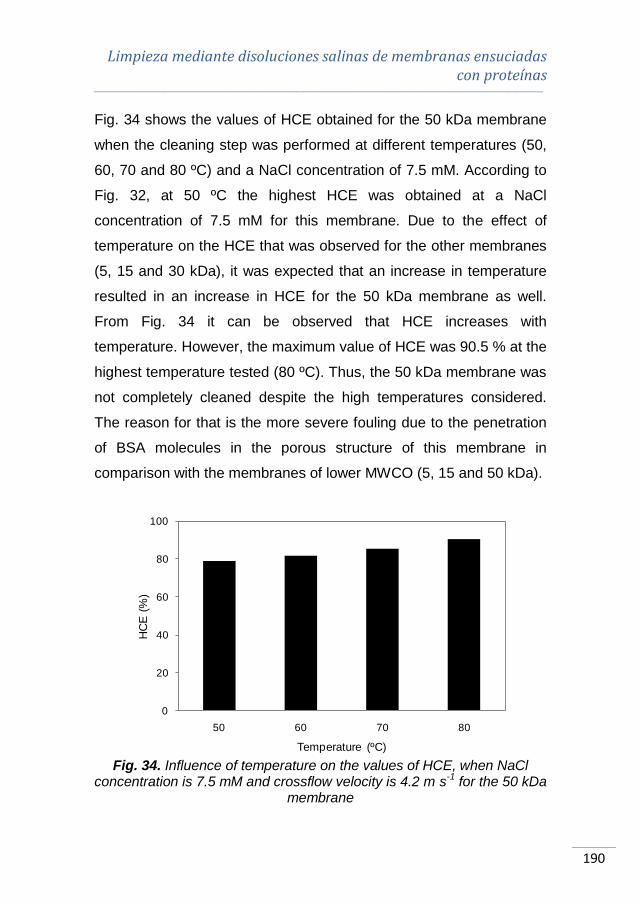
Limpieza mediante disoluciones salinas de membranas ensuciadas con proteínas
________________________________________________________________________________________________________________________________________________________
190
Fig. 34 shows the values of HCE obtained for the 50 kDa membrane
when the cleaning step was performed at different temperatures (50,
60, 70 and 80 ºC) and a NaCl concentration of 7.5 mM. According to
Fig. 32, at 50 ºC the highest HCE was obtained at a NaCl
concentration of 7.5 mM for this membrane. Due to the effect of
temperature on the HCE that was observed for the other membranes
(5, 15 and 30 kDa), it was expected that an increase in temperature
resulted in an increase in HCE for the 50 kDa membrane as well.
From Fig. 34 it can be observed that HCE increases with
temperature. However, the maximum value of HCE was 90.5 % at the
highest temperature tested (80 ºC). Thus, the 50 kDa membrane was
not completely cleaned despite the high temperatures considered.
The reason for that is the more severe fouling due to the penetration
of BSA molecules in the porous structure of this membrane in
comparison with the membranes of lower MWCO (5, 15 and 50 kDa).
Fig. 34. Influence of temperature on the values of HCE, when NaCl
concentration is 7.5 mM and crossflow velocity is 4.2 m·s-1
for the 50 kDa membrane
0
20
40
60
80
100
50 60 70 80
HC
E (
%)
Temperature (ºC)

Capítulo V ________________________________________________________________________________________________________________________________________________________
191
Effect of crossflow velocity
Fig. 35 shows the results of HCE for the 5, 15 and 30 kDa
membranes when different crossflow velocities were tested at the
optimal conditions of NaCl concentration (2.5 mM for the 15 kDa
membrane and 5 mM for the 5 and 30 kDa membranes) and
temperature (50 ºC). In the case of the ceramic membrane (15 kDa),
higher crossflow velocities were tested due to the higher roughness of
this membrane in comparison with the polymeric ones.
As it can be observed, when crossflow velocity increases HCE
increases for all the membranes tested, achieving a HCE of 100 % at
the highest crossflow velocity tested (4.2 m·s-1 for the 15 kDa
membrane and 2.18 m·s-1 for the 5 and 30 kDa membranes). When
crossflow velocity increases, the shear stress generated also
increases and it can cause the erosion and removal of the protein
deposit from the membrane surface (Daniş and Keskinler, 2009;
Smith et al., 2006).
The effect of the crossflow velocity on the HCE was not tested for the
50 kDa membrane. The reason is that 4.2 m·s-1 is the highest
crossflow velocity that can be reached in the UF plant. As it was
previously shown, the HCE for this membrane was lower than 100 %
at this crossflow velocity. Taking into account the results shown in this
section, even lower values of HCE were expected if the crossflow
velocity is decreased.
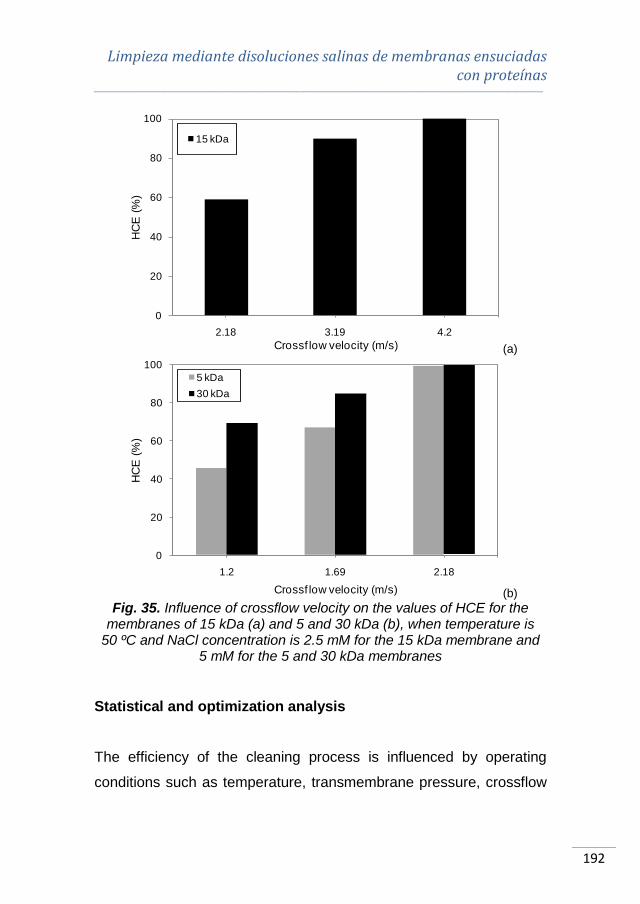
Limpieza mediante disoluciones salinas de membranas ensuciadas con proteínas
________________________________________________________________________________________________________________________________________________________
192
(a)
(b)
Fig. 35. Influence of crossflow velocity on the values of HCE for the membranes of 15 kDa (a) and 5 and 30 kDa (b), when temperature is
50 ºC and NaCl concentration is 2.5 mM for the 15 kDa membrane and 5 mM for the 5 and 30 kDa membranes
Statistical and optimization analysis
The efficiency of the cleaning process is influenced by operating
conditions such as temperature, transmembrane pressure, crossflow
0
20
40
60
80
100
2.18 3.19 4.2
HC
E (
%)
Crossf low velocity (m/s)
15 kDa
0
20
40
60
80
100
1.2 1.69 2.18
HC
E (
%)
Crossf low velocity (m/s)
5 kDa
30 kDa
Capítulo V ________________________________________________________________________________________________________________________________________________________
193
velocity, the nature of the cleaning agent and its concentration, pH
and ionic strength (Blanpain-Avet et al., 2009). In this work, three of
these operating conditions (temperature, NaCl solution and crossflow
velocity) were varied.
Fig. 36 shows the surface contours for the response variable (HCE)
as a function of the operating conditions of temperature and NaCl
concentration for the membranes of 5, 15 and 30 kDa studied.
Crossflow velocity was set at 2.18 m·s-1 for the 5 and 30 kDa
membranes and at 4.2 m·s-1 for the 15 kDa membrane. The grey
colour in the lower left corner shows the most unfavourable
conditions, because lower values of HCE were obtained (about
40 %). On the other hand, the black colour in the upper right corner
represents the highest values of HCE achieved (greater than 95 %).
At temperatures higher than 42-45 ºC and NaCl concentrations higher
than 2.6-3 mM, the HCE was observed to be higher than 95 % for the
three membranes considered. It is important to note that the higher
the temperature of the cleaning solution was, the higher the HCE was
for all the membranes tested. However, there was an optimal value of
NaCl concentration to maximize the value of HCE, because further
increases in salt concentration did not result in higher values of HCE.
In addition, mathematical relationships between the values of HCE
and the operating conditions were obtained for the 5, 15 and 30 kDa
membranes (Eqs. 23, 24 and 25, respectively). The statistically
significant factors were the same for the 5 and 30 kDa membranes.
The regression coefficients for each equation were 0.979, 0.893 and
0.962, respectively. Table 19 shows the results of the ANOVA.
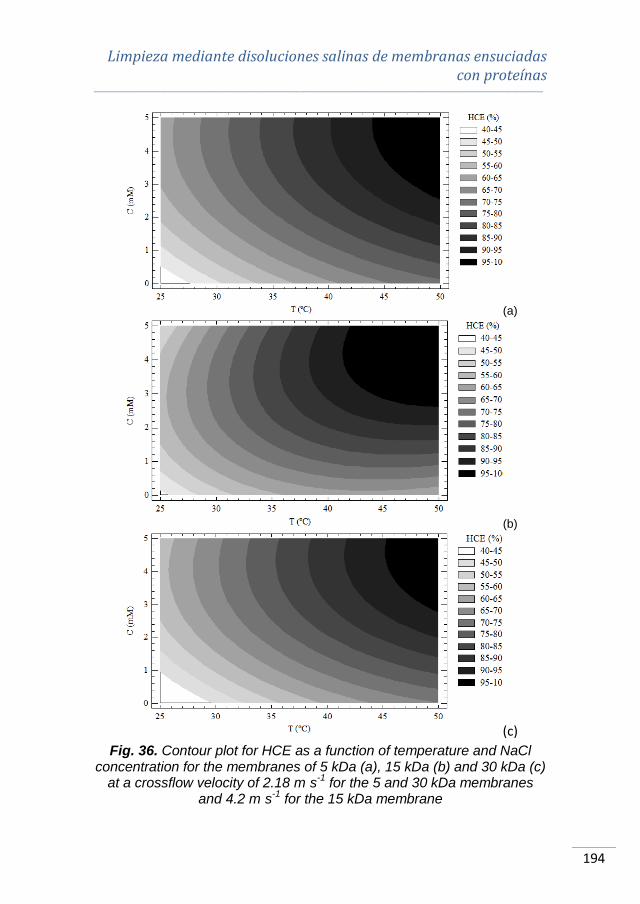
Limpieza mediante disoluciones salinas de membranas ensuciadas con proteínas
________________________________________________________________________________________________________________________________________________________
194
(a)
(b)
(c)
Fig. 36. Contour plot for HCE as a function of temperature and NaCl concentration for the membranes of 5 kDa (a), 15 kDa (b) and 30 kDa (c)
at a crossflow velocity of 2.18 m·s-1
for the 5 and 30 kDa membranes and 4.2 m·s
-1 for the 15 kDa membrane

Capítulo V ________________________________________________________________________________________________________________________________________________________
195
HCE5 (%) = a + b·Tc + c·C – d·C2 + e·v2 Eq. 23
HCE15 (%) = a + f·Tc·C – d·C2 + g·v Eq. 24
HCE30 (%) = a + b·Tc + c·C – d·C2 + e·v2 Eq. 25
where HCE5, HCE15 and HCE30 are the hydraulic cleaning efficiencies
for the membranes of 5, 15 and 30 kDa, respectively, Tc is the
temperature of the cleaning solution (ºC), C is the NaCl concentration
(mM), v is the crossflow velocity (m·s-1) and a, b, c, d, e, f and g are
the estimated coefficients for each statistically significant parameter.
Table 19. ANOVA results for the model equations that relate the hydraulic cleaning efficiency with the design variables
MWCO (kDa)
Parameter Coefficient Estimated value p-value
5
Constant a (%) -77.179 0.0002
Tc b (ºC-1) 1.448 0.0000
C c (mM-1) 10.922 0.0024
C2 d (mM-2) -1.186 0.0292
v2 e (m-2·s2) 17.024 0.0000
15
Constant a (%) -40.939 0.1015
Tc·C f (ºC-1·mM-1) 0.590 0.0001
C2 d (mM-2) -3.207 0.0006
v g (m-1·s) 22.468 0.0026
30
Constant a (%) -46.222 0.0090
Tc b (ºC-1) 1.556 0.0001
C c (mM-1) 11.948 0.0058
C2 d (mM-2) -1.345 0.0493
v2 e (m-2·s2) 8.873 0.0022
The results of the pattern-search optimization method are shown in
Table 20. According to them, the optimal values of the design
variables were: a cleaning solution temperature of 50 ºC for all the
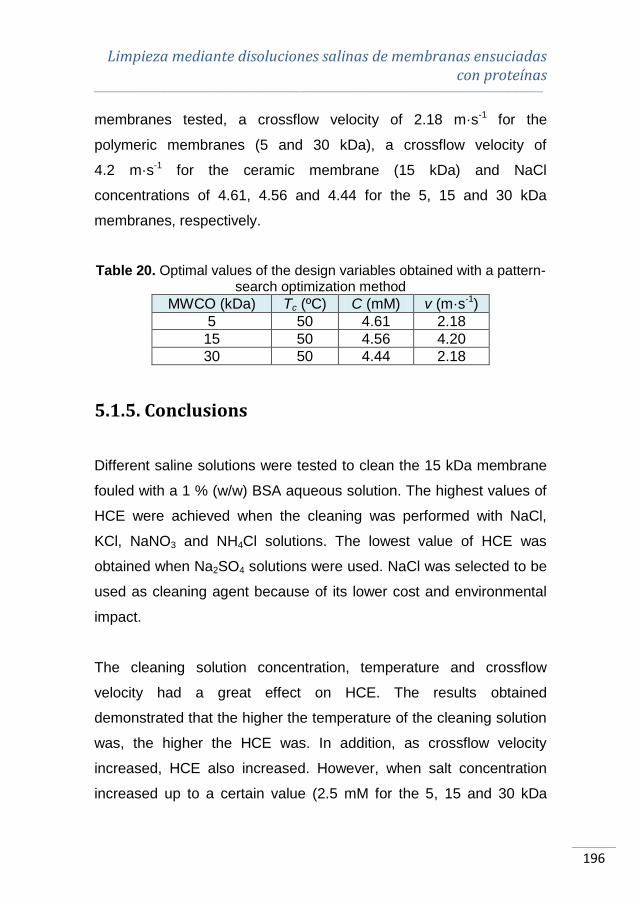
Limpieza mediante disoluciones salinas de membranas ensuciadas con proteínas
________________________________________________________________________________________________________________________________________________________
196
membranes tested, a crossflow velocity of 2.18 m·s-1 for the
polymeric membranes (5 and 30 kDa), a crossflow velocity of
4.2 m·s-1 for the ceramic membrane (15 kDa) and NaCl
concentrations of 4.61, 4.56 and 4.44 for the 5, 15 and 30 kDa
membranes, respectively.
Table 20. Optimal values of the design variables obtained with a pattern-search optimization method
MWCO (kDa) Tc (ºC) C (mM) v (m·s-1)
5 50 4.61 2.18
15 50 4.56 4.20
30 50 4.44 2.18
5.1.5. Conclusions
Different saline solutions were tested to clean the 15 kDa membrane
fouled with a 1 % (w/w) BSA aqueous solution. The highest values of
HCE were achieved when the cleaning was performed with NaCl,
KCl, NaNO3 and NH4Cl solutions. The lowest value of HCE was
obtained when Na2SO4 solutions were used. NaCl was selected to be
used as cleaning agent because of its lower cost and environmental
impact.
The cleaning solution concentration, temperature and crossflow
velocity had a great effect on HCE. The results obtained
demonstrated that the higher the temperature of the cleaning solution
was, the higher the HCE was. In addition, as crossflow velocity
increased, HCE also increased. However, when salt concentration
increased up to a certain value (2.5 mM for the 5, 15 and 30 kDa
Capítulo V ________________________________________________________________________________________________________________________________________________________
197
membranes) HCE increased as well, but a further increase in NaCl
concentration did not result in higher values of HCE or could even
cause their decrease. Saline solutions were able to clean the 5, 15
and 30 kDa membranes. However, they were not effective to
completely clean the 50 kDa membrane. This can be attributed to the
more intense fouling observed for this membrane.
According to the results of the RSM analysis and the results of the
pattern-search optimization method, the best operating conditions to
clean the 5, 15 and 30 kDa membranes were a cleaning solution
temperature of 50 ºC, crossflow velocities of 2.18 m·s-1 for the 5 and
30 kDa membranes and 4.2 m·s-1 for the 15 kDa membrane and NaCl
concentrations of 4.61, 4.56 and 4.44 for the 5, 15 and 30 kDa
membranes, respectively. The selected experimental conditions
resulted in the maximum values of HCE5, HCE15 and HCE30 (about
100 %).
An equation to relate HCE with the operating conditions was obtained
by means of a Multiple Regression Analysis for the low MWCO
membranes. For the polymeric membranes, the statistically significant
factors were the same for both membranes.
Acknowledgements
The authors of this work wish to gratefully acknowledge the financial
support from the Spanish Ministry of Science and Innovation through
the project CTM2010-20186 and the Generalitat Valenciana through
Limpieza mediante disoluciones salinas de membranas ensuciadas con proteínas
________________________________________________________________________________________________________________________________________________________
198
the program “Ayudas para la realización de proyectos I+D para
grupos de investigación emergentes GV/2013”.
Nomenclature
List of symbols
a Model equation coefficient (%)
b Model equation coefficient (ºC-1)
c Model equation coefficient (mM-1)
C NaCl concentration (mM)
Cb BSA concentration in the feed solution (g·L-1)
Cp Permeate BSA concentration (g·L-1)
d Model equation coefficient (mM-2)
e Model equation coefficient (m-2·s2)
f Model equation coefficient (ºC-1·mM-1)
g Model equation coefficient (m-1·s)
J Permeate flux (m3·m-2·s-1)
Np Number of points within the given area (dimensionless)
ΔP Transmembrane pressure (bar)
R Total hydraulic resistance (m-1)
Rm Resistance of the new membrane (m-1)
Rf Resistance after the fouling step (m-1)
Rr1 Resistance after the first rinsing step (m-1)
Rc Resistance after the cleaning step (m-1)
Rr2 Resistance after the second rinsing step (m-1)
Rq Root mean square roughness (nm)
Capítulo V ________________________________________________________________________________________________________________________________________________________
199
t Filtration time (s)
Tc Temperature of the cleaning solution (ºC)
v Crossflow velocity (m·s-1)
Z Height values of the surface sample (nm)
Zi Z value currently measured (nm)
Zavg Average of the Z values of the sample (nm)
Greek letters
μ Feed solution viscosity (kg·m-1·s-1)
Abbreviations
AFM Atomic force microscopy
BSA Bovine serum albumin
EOM Extracellular organic matter
HCE Hydraulic cleaning efficiency
HRE Hydraulic rinsing efficiency
MWCO Molecular weight cut off
PES Polyethersulfone
pI Isoelectric point
RSM Response surface methodology
UF Ultrafiltration
Limpieza mediante disoluciones salinas de membranas ensuciadas con proteínas
________________________________________________________________________________________________________________________________________________________
200
5.2. COMPROBACIÓN DE LA EFICACIA DEL
PROCESO DE LIMPIEZA MEDIANTE MÉTODOS
QUÍMICOS
Tal y como se ha explicado en el Capítulo II, además de los métodos
hidráulicos utilizados para evaluar la eficacia del proceso de limpieza,
existen métodos químicos basados en técnicas espectrofotométricas
(SEM, EDX, AFM y ATR-FTIR). Por tanto, en este apartado se
compara el valor de eficacia de limpieza obtenido mediante el
método hidráulico (comparación de las resistencias hidráulicas en
diferentes etapas del proceso) con el valor de eficacia obtenido
mediante las técnicas anteriormente mencionadas. Para ello, se
comparan entre sí los resultados obtenidos por medio de cada una
de estas técnicas para las membranas nueva, sucia y limpia. Es
importante destacar que, dada la naturaleza destructiva de los
métodos químicos de determinación de la eficacia del proceso de
limpieza y el elevado coste de las membranas cerámicas, esta
comprobación sólo se ha llevado a cabo con las membranas
poliméricas ensuciadas con disoluciones de BSA y tras el protocolo
de limpieza con NaCl en las condiciones de operación que resultaron
óptimas (concentración de NaCl de 5 mM, 50 ºC y 2.18 m·s-1).
En primer lugar, se muestran las imágenes obtenidas mediante el
microscopio SEM de las membranas de 5 (Fig. 37) y 30 kDa (Fig.
38). Como puede observarse en ambas figuras, las imágenes
correspondientes a las membranas nueva y limpia son muy similares,
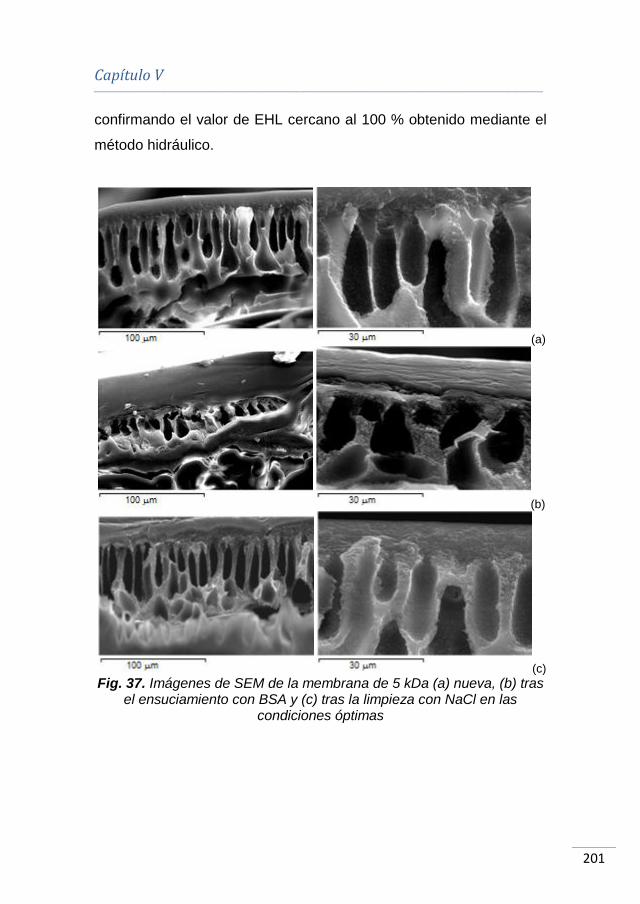
Capítulo V ________________________________________________________________________________________________________________________________________________________
201
confirmando el valor de EHL cercano al 100 % obtenido mediante el
método hidráulico.
(a)
(b)
(c) Fig. 37. Imágenes de SEM de la membrana de 5 kDa (a) nueva, (b) tras
el ensuciamiento con BSA y (c) tras la limpieza con NaCl en las condiciones óptimas

Limpieza mediante disoluciones salinas de membranas ensuciadas con proteínas
________________________________________________________________________________________________________________________________________________________
202
(a)
(b)
(c) Fig. 38. Imágenes de SEM de la membrana de 30 kDa (a) nueva, (b) tras el ensuciamiento con BSA y (c) tras la limpieza con NaCl en las
condiciones óptimas
Sin embargo, en el caso de las membranas sucias, se observan
varios agregados sobre la superficie de las mismas, indicando la
presencia de proteínas procedentes de la etapa de ensuciamiento.
La densidad de agregados de proteínas por área de membrana es
más elevada en el caso de la membrana de 5 kDa. Esto puede
Capítulo V ________________________________________________________________________________________________________________________________________________________
203
deberse a la diferencia de material del que están fabricadas ambas
membranas. Mientras que la membrana de 5 kDa es de PES, la
membrana de 30 kDa es de PESH. Este hecho implica que la
membrana de mayor MWCO es más hidrofílica y presenta mejores
propiedades antiensuciamiento que la membrana de 5 kDa, por lo
que la acumulación de agregados de proteínas sobre su superficie es
menor. Además, puede distinguirse en ambas membranas una capa
más densa formada sobre la superficie de la misma tras su
ensuciamiento, especialmente en el caso de la membrana de 5 kDa.
Este hecho es también un indicador de la formación de una capa de
ensuciamiento debido a la acumulación de proteínas sobre la
superficie de ambas membranas. Otros autores también demostraron
la aparición de una capa de mayor grosor sobre la capa activa de la
membrana (Rabiller-Baudry et al., 2012). Estos autores ensuciaron
membranas de PES con leche desnatada e indicaron la presencia de
una capa de ensuciamiento sobre la superficie de las membranas
utilizadas, debida a la acumulación de proteínas presentes en la
disolución alimento.
A partir de estas imágenes se obtuvieron diferentes espectros de
EDX, que permiten cuantificar la concentración de cada elemento
químico presente en la estructura de cada una de las membranas. La
Tabla 21 muestra el contenido en cada elemento químico para las
membranas de 5 y 30 kDa nueva, tras el ensuciamiento (sucia) y tras
el protocolo de limpieza (limpia). En el caso de las membranas sucias
se detectó una pequeña concentración de nitrógeno, elemento
característico de las proteínas. Esta concentración fue mayor en el
caso de la membrana de 5 kDa, puesto que la mayor hidrofobicidad
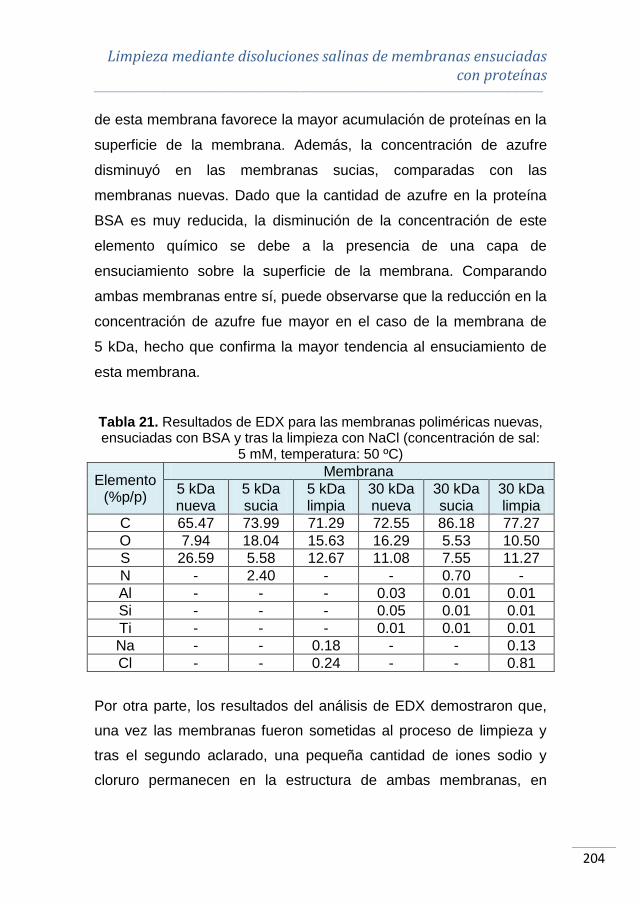
Limpieza mediante disoluciones salinas de membranas ensuciadas con proteínas
________________________________________________________________________________________________________________________________________________________
204
de esta membrana favorece la mayor acumulación de proteínas en la
superficie de la membrana. Además, la concentración de azufre
disminuyó en las membranas sucias, comparadas con las
membranas nuevas. Dado que la cantidad de azufre en la proteína
BSA es muy reducida, la disminución de la concentración de este
elemento químico se debe a la presencia de una capa de
ensuciamiento sobre la superficie de la membrana. Comparando
ambas membranas entre sí, puede observarse que la reducción en la
concentración de azufre fue mayor en el caso de la membrana de
5 kDa, hecho que confirma la mayor tendencia al ensuciamiento de
esta membrana.
Tabla 21. Resultados de EDX para las membranas poliméricas nuevas, ensuciadas con BSA y tras la limpieza con NaCl (concentración de sal:
5 mM, temperatura: 50 ºC)
Elemento (%p/p)
Membrana
5 kDa nueva
5 kDa sucia
5 kDa limpia
30 kDa nueva
30 kDa sucia
30 kDa limpia
C 65.47 73.99 71.29 72.55 86.18 77.27
O 7.94 18.04 15.63 16.29 5.53 10.50
S 26.59 5.58 12.67 11.08 7.55 11.27
N - 2.40 - - 0.70 -
Al - - - 0.03 0.01 0.01
Si - - - 0.05 0.01 0.01
Ti - - - 0.01 0.01 0.01
Na - - 0.18 - - 0.13
Cl - - 0.24 - - 0.81
Por otra parte, los resultados del análisis de EDX demostraron que,
una vez las membranas fueron sometidas al proceso de limpieza y
tras el segundo aclarado, una pequeña cantidad de iones sodio y
cloruro permanecen en la estructura de ambas membranas, en
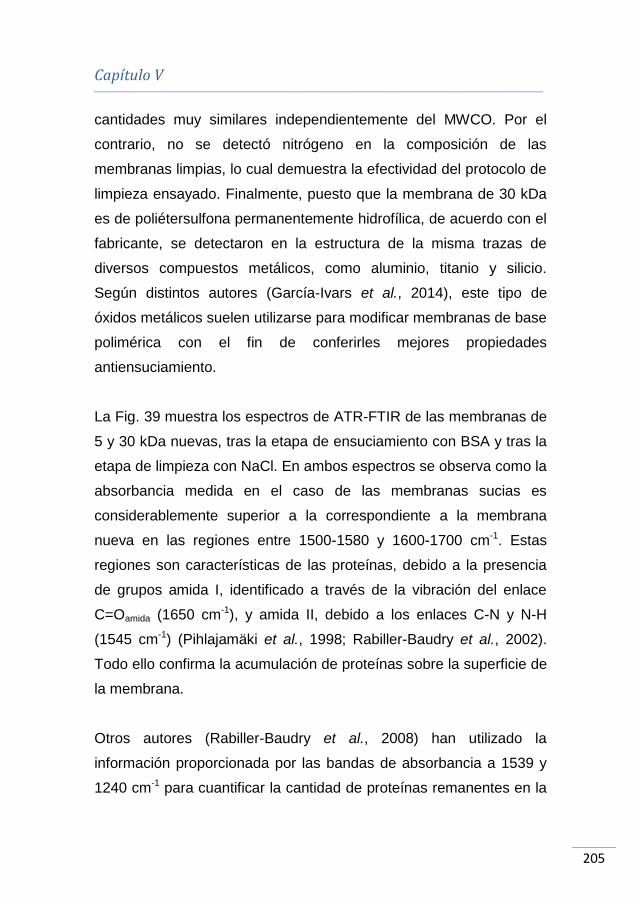
Capítulo V ________________________________________________________________________________________________________________________________________________________
205
cantidades muy similares independientemente del MWCO. Por el
contrario, no se detectó nitrógeno en la composición de las
membranas limpias, lo cual demuestra la efectividad del protocolo de
limpieza ensayado. Finalmente, puesto que la membrana de 30 kDa
es de poliétersulfona permanentemente hidrofílica, de acuerdo con el
fabricante, se detectaron en la estructura de la misma trazas de
diversos compuestos metálicos, como aluminio, titanio y silicio.
Según distintos autores (García-Ivars et al., 2014), este tipo de
óxidos metálicos suelen utilizarse para modificar membranas de base
polimérica con el fin de conferirles mejores propiedades
antiensuciamiento.
La Fig. 39 muestra los espectros de ATR-FTIR de las membranas de
5 y 30 kDa nuevas, tras la etapa de ensuciamiento con BSA y tras la
etapa de limpieza con NaCl. En ambos espectros se observa como la
absorbancia medida en el caso de las membranas sucias es
considerablemente superior a la correspondiente a la membrana
nueva en las regiones entre 1500-1580 y 1600-1700 cm-1. Estas
regiones son características de las proteínas, debido a la presencia
de grupos amida I, identificado a través de la vibración del enlace
C=Oamida (1650 cm-1), y amida II, debido a los enlaces C-N y N-H
(1545 cm-1) (Pihlajamäki et al., 1998; Rabiller-Baudry et al., 2002).
Todo ello confirma la acumulación de proteínas sobre la superficie de
la membrana.
Otros autores (Rabiller-Baudry et al., 2008) han utilizado la
información proporcionada por las bandas de absorbancia a 1539 y
1240 cm-1 para cuantificar la cantidad de proteínas remanentes en la
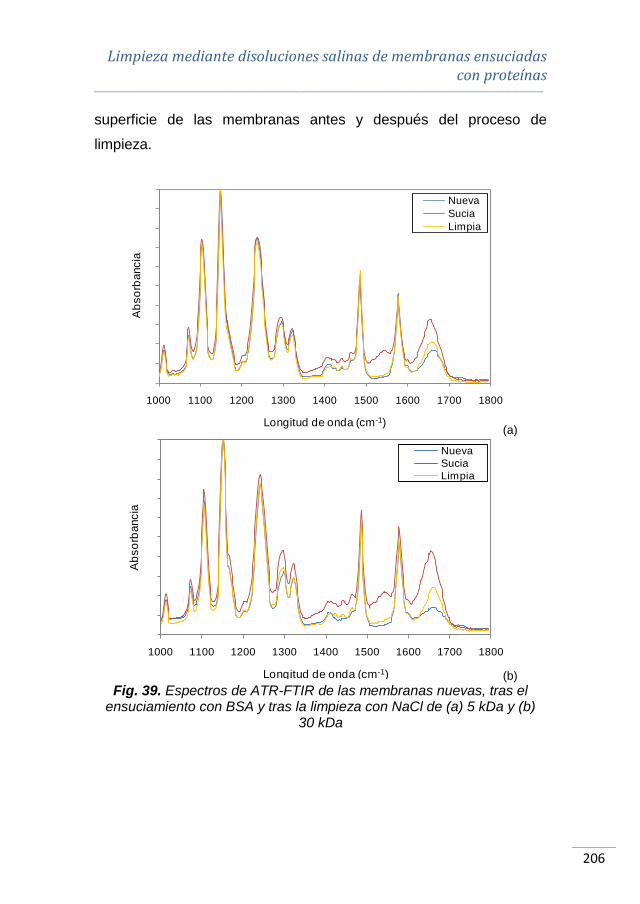
Limpieza mediante disoluciones salinas de membranas ensuciadas con proteínas
________________________________________________________________________________________________________________________________________________________
206
superficie de las membranas antes y después del proceso de
limpieza.
(a)
(b)
Fig. 39. Espectros de ATR-FTIR de las membranas nuevas, tras el ensuciamiento con BSA y tras la limpieza con NaCl de (a) 5 kDa y (b)
30 kDa
1000 1100 1200 1300 1400 1500 1600 1700 1800
Ab
so
rbancia
Longitud de onda (cm-1)
Nueva
Sucia
Limpia
1000 1100 1200 1300 1400 1500 1600 1700 1800
Ab
so
rbancia
Longitud de onda (cm-1)
Nueva
Sucia
Limpia
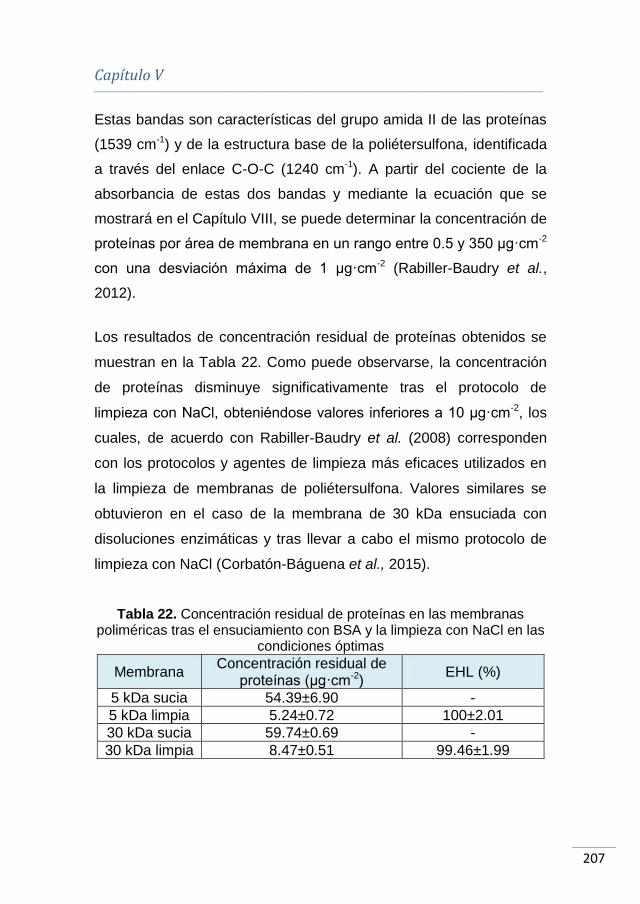
Capítulo V ________________________________________________________________________________________________________________________________________________________
207
Estas bandas son características del grupo amida II de las proteínas
(1539 cm-1) y de la estructura base de la poliétersulfona, identificada
a través del enlace C-O-C (1240 cm-1). A partir del cociente de la
absorbancia de estas dos bandas y mediante la ecuación que se
mostrará en el Capítulo VIII, se puede determinar la concentración de
proteínas por área de membrana en un rango entre 0.5 y 350 μg·cm-2
con una desviación máxima de 1 μg·cm-2 (Rabiller-Baudry et al.,
2012).
Los resultados de concentración residual de proteínas obtenidos se
muestran en la Tabla 22. Como puede observarse, la concentración
de proteínas disminuye significativamente tras el protocolo de
limpieza con NaCl, obteniéndose valores inferiores a 10 μg·cm-2, los
cuales, de acuerdo con Rabiller-Baudry et al. (2008) corresponden
con los protocolos y agentes de limpieza más eficaces utilizados en
la limpieza de membranas de poliétersulfona. Valores similares se
obtuvieron en el caso de la membrana de 30 kDa ensuciada con
disoluciones enzimáticas y tras llevar a cabo el mismo protocolo de
limpieza con NaCl (Corbatón-Báguena et al., 2015).
Tabla 22. Concentración residual de proteínas en las membranas poliméricas tras el ensuciamiento con BSA y la limpieza con NaCl en las
condiciones óptimas
Membrana Concentración residual de
proteínas (μg·cm-2) EHL (%)
5 kDa sucia 54.39±6.90 -
5 kDa limpia 5.24±0.72 100±2.01
30 kDa sucia 59.74±0.69 -
30 kDa limpia 8.47±0.51 99.46±1.99
Limpieza mediante disoluciones salinas de membranas ensuciadas con proteínas
________________________________________________________________________________________________________________________________________________________
208
Además, esta pequeña concentración de proteínas que permanece
en la superficie de las membranas tras su limpieza no afecta a las
propiedades permselectivas de las mismas, puesto que los valores
de eficacia hidráulica obtenidos son aproximadamente del 100 %.
Por tanto, queda demostrada la validez de los métodos hidráulicos
utilizados para evaluar la eficacia del proceso de limpieza en este
tipo de membranas.
La Fig. 40 muestra las imágenes obtenidas mediante el microscopio
AFM de las membranas de 5 y 30 kDa nuevas, tras la etapa de
ensuciamiento con BSA y tras la etapa de limpieza con NaCl en las
condiciones óptimas. Además, la Tabla 23 recoge los valores de
rugosidad promedio (Ra) y rugosidad cuadrática media (Rq) de todas
las imágenes analizadas. De acuerdo con las imágenes
proporcionadas por el microscopio SEM (Fig. 37 y Fig. 38), en el
caso de la membrana de menor tamaño de poro se formaron más
agregados sobre la superficie de la misma, hecho que queda
confirmado por la Fig. 40a2. En el caso de la membrana de 30 kDa
sucia, el número de agregados no fue tan elevado, aunque
presentaban un tamaño mayor (Fig. 40b2). En esta última figura
también se aprecia claramente la formación de una capa de
ensuciamiento sobre la superficie de la membrana, que cubre
completamente la rugosidad inicial de la membrana (Fig. 40b1).
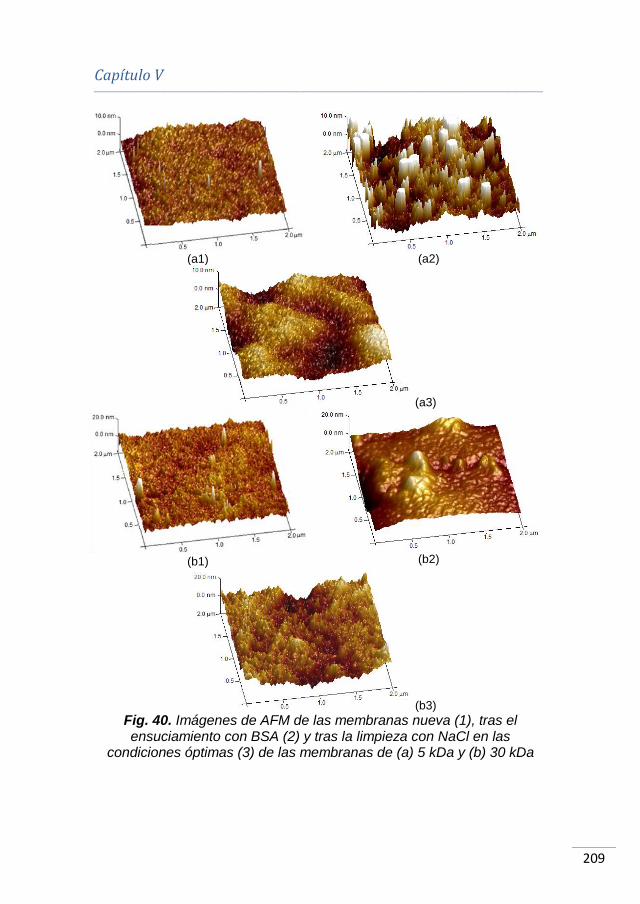
Capítulo V ________________________________________________________________________________________________________________________________________________________
209
(a1) (a2)
(a3)
(b1)
(b2)
(b3)
Fig. 40. Imágenes de AFM de las membranas nueva (1), tras el ensuciamiento con BSA (2) y tras la limpieza con NaCl en las
condiciones óptimas (3) de las membranas de (a) 5 kDa y (b) 30 kDa
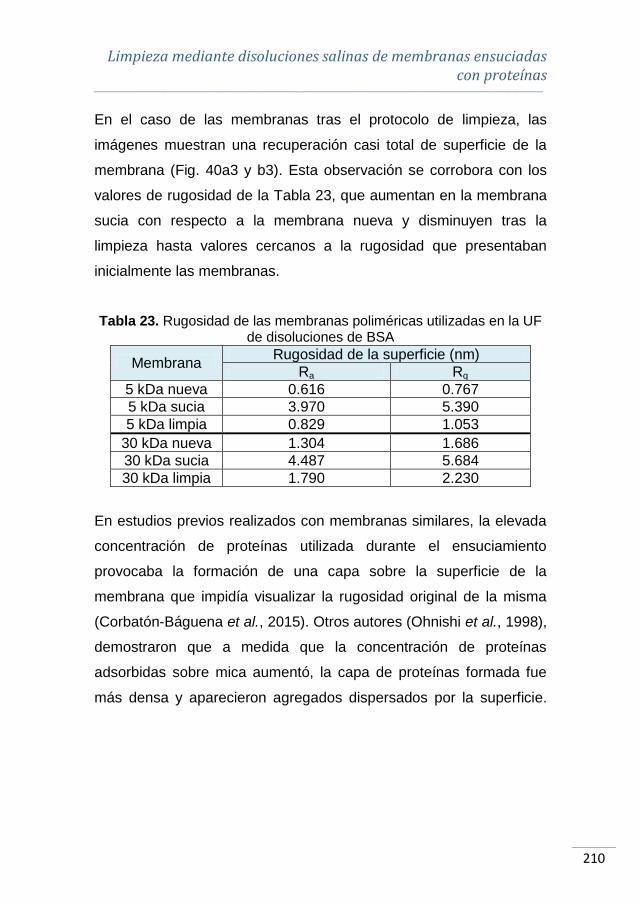
Limpieza mediante disoluciones salinas de membranas ensuciadas con proteínas
________________________________________________________________________________________________________________________________________________________
210
En el caso de las membranas tras el protocolo de limpieza, las
imágenes muestran una recuperación casi total de superficie de la
membrana (Fig. 40a3 y b3). Esta observación se corrobora con los
valores de rugosidad de la Tabla 23, que aumentan en la membrana
sucia con respecto a la membrana nueva y disminuyen tras la
limpieza hasta valores cercanos a la rugosidad que presentaban
inicialmente las membranas.
Tabla 23. Rugosidad de las membranas poliméricas utilizadas en la UF de disoluciones de BSA
Membrana Rugosidad de la superficie (nm)
Ra Rq
5 kDa nueva 0.616 0.767
5 kDa sucia 3.970 5.390
5 kDa limpia 0.829 1.053
30 kDa nueva 1.304 1.686
30 kDa sucia 4.487 5.684
30 kDa limpia 1.790 2.230
En estudios previos realizados con membranas similares, la elevada
concentración de proteínas utilizada durante el ensuciamiento
provocaba la formación de una capa sobre la superficie de la
membrana que impidía visualizar la rugosidad original de la misma
(Corbatón-Báguena et al., 2015). Otros autores (Ohnishi et al., 1998),
demostraron que a medida que la concentración de proteínas
adsorbidas sobre mica aumentó, la capa de proteínas formada fue
más densa y aparecieron agregados dispersados por la superficie.
Capítulo V ________________________________________________________________________________________________________________________________________________________
211
5.3. BIBLIOGRAFÍA
ADIKANE H.V., THAKAR D.M. y NENE S.N. (2004). “Optimisation of
colour and sugar rejection of black liquor using membranes” en
Separation and Purification Technology, vol. 36, p. 229-234.
AFONSO A., MIRANDA J.M. y CAMPOS J.B.L.M. (2009). “Numerical
study of BSA ultrafiltration in the limiting flux regime – effect of
variable physical properties” en Desalination, vol. 249, p. 1139-1150.
ALI K., SHAH A-u-H.A. y BILAL S. (2008). “Thermodynamic
parameters of surface formation of some aqueous salt solutions” en
Colloids and Surfaces A: Physicochemical Engineering Aspects, vol.
330, p. 28-34.
ALMÉCIJA M.C. et al. (2009a). “Influence of the cleaning temperature
on the permeability of ceramic membranes” en Desalination, vol. 245,
p. 708-713.
ALMÉCIJA M.C. et al. (2009b). “Analysis of cleaning protocols in
ceramic membranes by liquid-liquid displacement porosimetry” en
Desalination, vol. 245, p. 541-545.
BLANPAIN-AVET P., MIGDAL J.F. y BÉNÉZECH T. (2009).
“Chemical cleaning of a tubular ceramic microfiltration membrane
fouled with a whey protein concentrate suspension – characterization
of hydraulic and chemical cleanliness” en Journal of Membrane
Science, vol. 337, p. 153-174.
CABERO CABERO M.L. (1997). Limpieza química de membranas
inorgánicas: Aplicación al tratamiento de lactosuero. Tesis Doctoral.
Oviedo: Universidad de Oviedo, <http://hdl.handle.net/10651/13566>.
Limpieza mediante disoluciones salinas de membranas ensuciadas con proteínas
________________________________________________________________________________________________________________________________________________________
212
CABERO M.L. et al. (1999). “Rinsing of ultrafiltration ceramic
membranes fouled with whey proteins: effects on cleaning
procedures” en Journal of Membrane Science, vol. 154, p. 239-250.
CHUNG T.-S. et al. (2002). “Visualization of the effect of die shear
rate on the outer surface morphology of ultrafiltration membranes by
AFM” en Journal of Membrane Science, vol. 196, p. 251-266.
COJOCARU C. y ZAKRZEWSKA-TRZNADEL G. (2007). “Response
surface modeling and optimization of copper removal from aqua
solutions using polymer assisted ultrafiltration” en Journal of
Membrane Science, vol. 298, p. 56-70.
CORBATÓN-BÁGUENA M.J. et al. (2015). “Destabilization and
removal of immobilized enzymes adsorbed onto polyethersulfone
ultrafiltration membranes by salt solutions” en Journal of Membrane
Science, vol. 486, p. 207-214.
CURTIS R.A. y LUE L. “A molecular approach to bioseparations:
protein-protein and protein-salt interactions” en Chemical Engineering
Science, vol. 61, p. 907-923.
DANIŞ Ü. y KESKINLER B. (2009). “Chromate removal from
wastewater using micellar enhanced crossflow filtration: Effect of
transmembrane pressure and crossflow velocity” en Desalination, vol.
249, p. 1356-1364.
DAUFIN G. et al. (2001). “Recent and emerging applications of
membrane processes in the food and dairy industry” en Food and
Bioproducts Processing, vol. 79, p. 89-102.
GARCÍA-IVARS J. et al. (2014). “Development of fouling-resistant
polyethersulfone ultrafiltration membranes via surface UV
photografting with polyethylene glicol/aluminum oxide nanoparticles“
en Separation and Purification Technology, vol. 135, p. 88-99.
Capítulo V ________________________________________________________________________________________________________________________________________________________
213
GARG U.K. et al. (2008). “Removal of nickel (II) from aqueous
solution by adsorption on agricultural waste biomass using a
response surface methodological approach” en Bioresource
Technology, vol. 99, p. 1325-1331.
HOFMEISTER F. (1888). “Zur lehre von der wirkung der salze” en
Archiv for Experimentelle Pathologie und Pharmakologie, vol. 24, p.
247.
KARRAKER K.A. y RADKE R.J. (2002). “Disjoining pressures, zeta
potentials and surface tensions of aqueous non-ionic
surfactant/electrolyte solutions: theory and comparison to experiment”
en Advances in Colloid Interface Sciences, vol. 96, p. 231-264.
KAZEMIMOGHADAM M. y MOHAMMADI T. (2007). “Chemical
cleaning of ultrafiltration membranes in the milk industry” en
Desalination, vol. 204, p. 213-218.
LEE S. y ELIMELECH M. (2007). “Salt cleaning of organic-fouled
reverse osmosis membranes” en Water Research, vol. 41, p. 1134-
1142.
LLANOS J. et al. (2010). “Characterization of a ceramic ultrafiltration
membranes in different operational states after its used in a heavy-
metal ion removal process” en Water Research, vol. 44, p. 3522-
3530.
MANCIU M. y RUCKENSTEIN E. (2003). “Specific ion effects via ion
hydration: I. Surface tension” en Advances in Colloid and Interface
Science, vol. 105, p. 63-101.
MATUBAYASI N. y YOSHIKAWA R. (2007). “Thermodynamic
quantities of surface formation of aqueous electrolyte solutions VII.
Aqueous solution of alkali metal nitrates LiNO3, NaNO3 and KNO3” en
Journal of Colloid Interface Science, vol. 315, p. 597-600.
Limpieza mediante disoluciones salinas de membranas ensuciadas con proteínas
________________________________________________________________________________________________________________________________________________________
214
MATZINOS P. y ÁLVAREZ R. (2002). “Effect of ionic strength on
rinsing and alkaline cleaning of ultrafiltration inorganic membranes
fouled with whey proteins” en Journal of Membrane Science, vol. 208,
p. 23-20.
MUTHUKUMARAN S. et al. (2004). “The use of ultrasonic cleaning
for ultrafiltration membranes in the dairy industry” en Separation and
Purification Technology, vol. 39, p. 99-107.
MUTHUKUMARAN S. et al. (2007). “The application of ultrasound to
dairy ultrafiltration: the influence of operating conditions” en Journal of
Food Engineering, vol. 81, p. 364-373.
OGUNBIYI O.O., MILES N.J. y HILAL N. (2008). “The effects of
performance and cleaning cycles of new tubular ceramic
microfiltration membrane fouled with a model yeast suspension” en
Desalination, vol. 220, p. 273-289.
OHNISHI S., MURATA M. y HATO M. (1998). “Correlation between
surface morphology and surface forces of protein A adsorbed on
mica” en Biophysical Journal, vol. 74, p. 455-465.
PELEGRINE D.H.G. y GASPARETTO C.A. (2005). “Whey proteins
solubility as function of temperature and pH” en Lebensmittel-
Wissenschaft und-Technologie, vol. 38, p. 77-80.
PETERSEN P.B. y SAYKALLY R.J. (2005). “Adsorption of ions to the
surface of dilute electrolyte solutions: the Jones-Ray effect revisited”
en Journal of the American Chemical Society, vol. 127, p. 15446-
15452.
PIHLAJAMÄKI A., VÄISÄNEN P. y NYSTRÖM M. (1998).
“Characterization of clean and fouled polymeric ultrafiltration
membranes by Fourier transform IR spectroscopy-attenuated total
Capítulo V ________________________________________________________________________________________________________________________________________________________
215
reflection” en Colloids Surfaces A: Physicochemical Engineering
Aspects, vol. 138, p. 323-333.
QU F. et al. (2014). “Ultrafiltration membrane fouling caused by
extracellular organic matter (EOM) from Microcystis aeruginosa:
Effects of membrane pore size and surface hydrophobicity” en
Journal of Membrane Science, vol. 449, p. 58-66.
RABILLER-BAUDRY M. et al. (2002). “Characterisation of cleaned
and fouled membrane by ATR-FTIR and EDX analysis coupled with
SEM: application to UF of skimmed milk with a PES membrane” en
Desalination, vol. 146, p. 123-128.
RABILLER-BAUDRY M. et al. (2008). “A dual approach of membrane
cleaning based on physic-chemistry and hydrodynamics. Application
to PES membrane of dairy industry” en Chemical Engineering and
Processing, vol. 47, p. 267-275.
RABILLER-BAUDRY M. et al. (2012). “Coupling of SEM-EDX and
FTIR-ATR to (quantitatively) investigate organic fouling on porous
organic and composite membranes” en Méndez-Vilas A. Current
Microscopy Contributions to Advances in Science and Technology.
Badajoz: Formatex.
RUBY FIGUEROA R.A., CASSANO A. y DRIOLI E. (2011).
“Ultrafiltration of orange press liquor: Optimization for permeate flux
and fouling index by response surface methodology” en Separation
and Purification Technology, vol. 80, p. 1-10.
SCHÄFER A.I., FANE A.G. y WAITE T.D. (2000). “Fouling effects on
rejection in the membrane filtration of natural waters” en Desalination,
vol. 131, p. 215-224.
SHAH A-u-H.A., ALI K. y BILAL S. (2013). “Surface tension, surface
excess concentration, enthalpy and entropy of surface formation of

Limpieza mediante disoluciones salinas de membranas ensuciadas con proteínas
________________________________________________________________________________________________________________________________________________________
216
aqueous salt solutions” en Colloids and Surfaces A: Physicochemical
Engineering Aspects, vol. 417, p. 183-190.
SMITH P.J. et al. (2006). “Productivity enhancement in a cross-flow
ultrafiltration membrane system through automated de-clogging
operations” en Journal of Membrane Science, vol. 280, p. 82-88.
SUTTIPRASIT P., KRISDHASIMA V. y MCGUIRE J. (1992). “The
surface activity of α-lactabumin, β-lactoglobulin and bovine serum
albumin” en Journal of Colloid and Interface Science, vol. 154, p. 316-
326.
TARAZAGA C.C., CAMPDERRÓS M.E. y PÉREZ-PADILLA A.
(2006). “Physical cleaning by means of electric field in the
ultrafiltration of a biological solution” en Journal of Membrane
Science, vol. 278-p. 219-224.
TSUMOTO K. et al. (2007). “Effects of salts on protein-surface
interactions: Applications for column chromatography” en Journal of
Pharmaceutical Science, vol. 96, p. 1677-1690.
WANG Y-N. y TANG C.Y. (2011). “Protein fouling of nanofiltration,
reverse osmosis, and ultrafiltration membranes-The role of
hydrodynamic conditions, solution chemistry and membrane
properties” en Journal of Membrane Science, vol. 376, p. 275-282.
ZHANG J. (2012). “Protein-protein interactions in salt solutions” en
Cai W. y Hong H. Protein-protein interactions – Computational and
experimental tools. Intech.


Limpieza mediante
disoluciones salinas de
membranas ensuciadas
con proteínas y sales

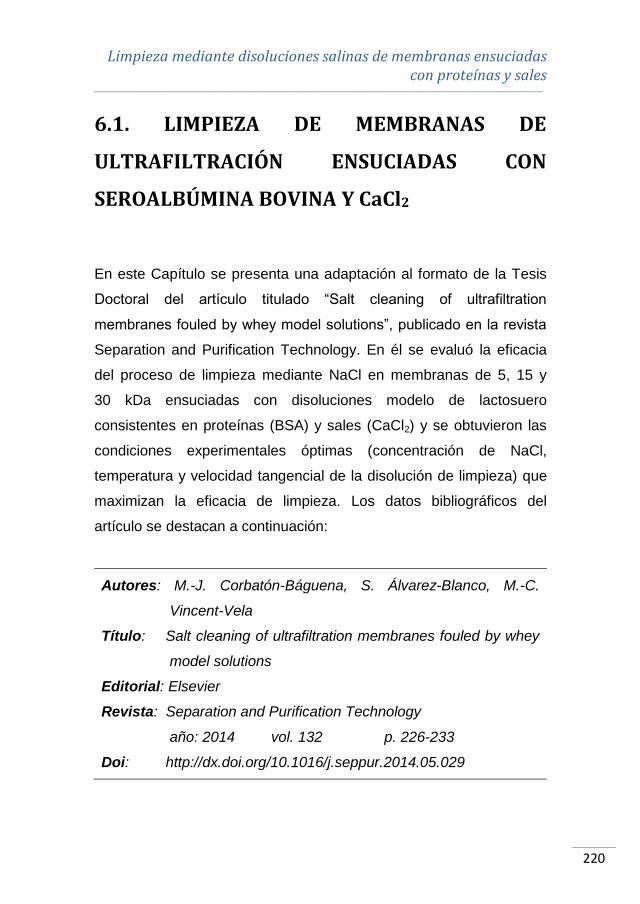
Limpieza mediante disoluciones salinas de membranas ensuciadas con proteínas y sales
________________________________________________________________________________________________________________________________________________________
220
6.1. LIMPIEZA DE MEMBRANAS DE
ULTRAFILTRACIÓN ENSUCIADAS CON
SEROALBÚMINA BOVINA Y CaCl2
En este Capítulo se presenta una adaptación al formato de la Tesis
Doctoral del artículo titulado “Salt cleaning of ultrafiltration
membranes fouled by whey model solutions”, publicado en la revista
Separation and Purification Technology. En él se evaluó la eficacia
del proceso de limpieza mediante NaCl en membranas de 5, 15 y
30 kDa ensuciadas con disoluciones modelo de lactosuero
consistentes en proteínas (BSA) y sales (CaCl2) y se obtuvieron las
condiciones experimentales óptimas (concentración de NaCl,
temperatura y velocidad tangencial de la disolución de limpieza) que
maximizan la eficacia de limpieza. Los datos bibliográficos del
artículo se destacan a continuación:
Autores: M.-J. Corbatón-Báguena, S. Álvarez-Blanco, M.-C.
Vincent-Vela
Título: Salt cleaning of ultrafiltration membranes fouled by whey
model solutions
Editorial: Elsevier
Revista: Separation and Purification Technology
año: 2014 vol. 132 p. 226-233
Doi: http://dx.doi.org/10.1016/j.seppur.2014.05.029
Capítulo VI ________________________________________________________________________________________________________________________________________________________
221
Salt cleaning of ultrafiltration membranes fouled
by whey model solutions
María-José Corbatón-Báguena, Silvia Álvarez-Blanco*, María-Cinta
Vincent-Vela
Department of Chemical and Nuclear Engineering, Universitat
Politècnica de València, C/Camino de Vera s/n 46022 Valencia,
Spain
*Corresponding author: [email protected]
Tel: +34963879630 (Ext.: 796383)
Fax: +34963877639 (Ext.: 77639)
Abstract
In this work, three ultrafiltration (UF) membranes were fouled with
whey model solutions that contained BSA (1 % w/w) and CaCl2 (0.06
% w/w). These membranes were cleaned with NaCl solutions.
Temperature, crossflow velocity and concentration were varied. The
membranes considered were a polyethersulfone (PES) membrane, a
ceramic ZrO2-TiO2 membrane and a permanently hydrophilic
polyethersulfone (PESH) membrane. Their molecular weight cut-offs
(MWCOs) are 5, 15 and 30 kDa, respectively. The cleaning efficiency
was related to the MWCO, membrane material and operating
conditions. The results obtained demonstrated that NaCl solutions
were able to clean the membranes tested. In addition, the higher the
Limpieza mediante disoluciones salinas de membranas ensuciadas con proteínas y sales
________________________________________________________________________________________________________________________________________________________
222
temperature and the crossflow velocity of the cleaning solution, the
higher the cleaning efficiency was. However, there was an optimum
value of NaCl concentration to clean the membranes effectively.
When concentration was higher than the optimum, the cleaning
efficiency decreased. The relationship between the cleaning
efficiency and the operating conditions was obtained with statistical
and optimization analysis.
Keywords: Ultrafiltration; whey model solutions; NaCl solutions;
membrane cleaning
6.1.1. Introduction
In dairy industries, ultrafiltration (UF) is one of the most widely used
membrane separation processes. Its most important applications are
milk dehydration, whey concentration and protein fractionation or
purification (Ogunbiyi et al., 2008; Kazemimoghadam and
Mohammadi, 2007). However, the major drawback in the application
of UF processes is the progressive flux decline due to the fouling
phenomena. In the dairy industry, membrane fouling is mainly caused
by protein deposition on the membrane surface and adsorption inside
its porous structure (Almécija et al, 2009a). To minimize membrane
fouling, several authors have investigated protein-protein, protein-
membrane and also, protein-inorganic compounds interactions
(Almécija et al., 2009a; Ang and Elimelech, 2007; Mo et al, 2008).
Almécija et al. (2009a) studied the influence of calcium salts on the
UF of whey using a 50 kDa ceramic membrane. They demonstrated
Capítulo VI ________________________________________________________________________________________________________________________________________________________
223
that these salts can act as binding agents between proteins. When
the concentration of calcium salts increased, the percentage of
membrane blocked pores during UF increased while the permeate
flux through the membrane decreased. Ang and Elimelech (2007)
studied the effect of calcium concentration on the bovine serum
albumin (BSA) fouling of reverse osmosis membranes. They reported
that permeate flux decline was greater when calcium concentration
increased, due to the reduction of the electrostatic repulsion among
BSA molecules. Mo et al. (2008) studied the effect of several cations
and ionic strength on BSA fouling on reverse osmosis membranes.
Calcium cations acted as crosslinking agents with BSA molecules.
Fouling experiments demonstrated that BSA fouling rate increased
when calcium was present in the feed solution. Fouling rate also
increased as ionic strength of the feed solution increased.
To overcome membrane fouling, membranes have to be cleaned to
remove the deposits. In dairy industries, chemical cleaning
procedures are carried out even twice a day (Blanpain-Avet et al.,
2009). The conventional procedure to clean membranes fouled with
whey solutions consists of several steps of alkali, acid and
disinfectant washings (Ogunbiyi et al., 2008; Kazemimoghadam and
Mohammadi, 2007; Almécija et al, 2009a; Almécija et al, 2009b).
However, membranes may be damaged by these cleaning agents,
reducing the membrane lifetime and causing a negative impact on the
environment when they are discharged as wastewaters. Therefore,
alternative cleaning techniques have been developed in the last years
such as electromagnetic fields (Tarazaga et al, 2006), ultrasounds
(Muthukumaran et al, 2004) and saline solutions. Several authors
Limpieza mediante disoluciones salinas de membranas ensuciadas con proteínas y sales
________________________________________________________________________________________________________________________________________________________
224
(Tsumoto et al., 2007; Zhang, 2012; Hofmeister, 1888) have
investigated the effect of salts on protein-protein interactions.
Tsumoto et al. (2007) studied the effect of several salts on protein-
protein interactions. They observed that, at the same concentration,
some salts (such as Na2SO4) caused a decline in protein solubility
while other salts (such as NaCl) increased the solubility of proteins.
The effect of salts that decreased protein solubility is known as
salting-out effect. On the other hand, the effect of increasing protein
solubility is known as salting-in effect. Zhang (2012) reported that Cl-
was able to specifically bind to the proteins surface more strongly
than other cations and anions. Thus, the repulsive intermolecular
interactions increase and protein solubility also increases. Hofmeister
(1888) proposed a ranking of the capability of several cations and
anions to salt-out or salt-in proteins. Based on the Hofmeister series,
Nucci and Vanderkooi (2008) reported a series of divalent and
monovalent cations and classified them in order of their ability to
precipitate proteins. According to these series, calcium cation is one
of the most salting-out ions, which is in agreement with other works
about the effect of calcium on protein fouling (Almécija et al, 2009a;
Ang and Elimelech, 2007).
However, only a few papers investigated membrane cleaning by
means of saline solutions (Lee and Elimelech, 2007; Corbatón-
Báguena et al., 2014). Lee and Elimelech (2007) cleaned reverse
osmosis membranes fouled with alginate and calcium solutions with
NaCl aqueous solutions at different concentrations. Their results
showed that cleaning efficiencies of about 90 % were achieved with
NaCl solutions of 50 mM. However, increasing NaCl concentration

Capítulo VI ________________________________________________________________________________________________________________________________________________________
225
from 50 to 300 mM did not cause an increase in the cleaning
efficiency. In a previous work, Corbatón-Báguena et al. (2014)
cleaned a 15 kDa MWCO UF membrane fouled with BSA solutions
with different saline solutions (Na2SO4, NaCl, NaNO3, NH4Cl and
KCl). The highest values of hydraulic cleaning efficiency (HCE) were
obtained with NaCl, NaNO3, NH4Cl and KCl solutions.
The aim of this work is to evaluate the ability of NaCl solutions to
clean a monotubular ceramic UF membrane of 15 kDa and two flat-
sheet polymeric UF membranes of 5 and 30 kDa fouled by whey
model solutions. The solutions consisted of BSA 1 % (w/w) and CaCl2
(0.06 % (w/w) in calcium). The influence of the operating conditions
(temperature, crossflow velocity and NaCl concentration of the
cleaning solution), membrane material and molecular weight cut-off
(MWCO) on the membrane cleaning efficiency was investigated. In
order to determine the optimal values of the cleaning operating
conditions to achieve the highest cleaning efficiency, statistical and
optimization analyses were performed.
6.1.2. Materials and methods
6.1.2.1. Materials
Fouling experiments were performed using aqueous solutions that
contained BSA (1 % (w/w)) and CaCl2 (0.06 % (w/w) in calcium) as
feed solutions. BSA (prepared by heat shock fractionation, lyophilized
powder, 98 % purity, A3733, Sigma-Aldrich, Germany) and CaCl2
Limpieza mediante disoluciones salinas de membranas ensuciadas con proteínas y sales
________________________________________________________________________________________________________________________________________________________
226
(95 % purity, Panreac, Spain) were dissolved in deionized water until
the above mentioned concentration was achieved. Isoelectric point of
BSA is 4.9, according to the manufacturer. Feed solutions had a pH
of about 7, thus BSA has mainly negative net charge on its surface.
Its configuration is elliptic (11.6x2.7x2.7 nm) and it is one of the most
widely used whey proteins to prepare model solutions for UF
experiments (Corbatón-Báguena et al., 2014; Suttiprasit et al., 1992;
Wang and Tang, 2011; Afonso et al., 2009). CaCl2 is one of the most
often used salts to study the interactions between whey proteins and
salts (Almécija et al., 2009a; Ang and Elimelech, 2007; Mo et al.,
2008).
Membranes were cleaned with NaCl aqueous solutions (121659,
Panreac, Spain) at a pH ranging from 6.8 to 7. NaOH aqueous
solutions (211687, Panreac, Spain) and NaClO aqueous solutions
(211921, Panreac, Spain) at a pH 11 were used as alkaline cleaning
agents.
6.1.2.2. Membranes
The membranes used in the experiments were: a flat sheet
polyethersulfone (PES) membrane of 5 kDa (reference UP005), a flat
sheet permanentely hydrophilic polyethersulfone (PESH) membrane
of 30 kDa (reference UH030) and a monotubular ceramic membrane
of 15 kDa. The polymeric membranes were supplied by Microdyn-
Nadir, Germany. They had an effective area of 100 cm2. The ceramic
membrane was supplied by TAMI Industries, France. It consisted of a
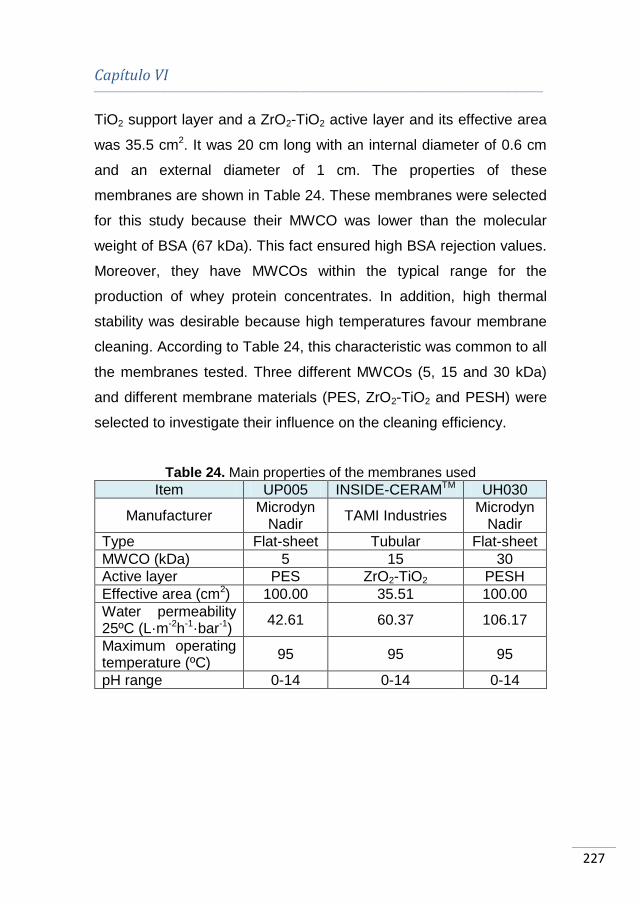
Capítulo VI ________________________________________________________________________________________________________________________________________________________
227
TiO2 support layer and a ZrO2-TiO2 active layer and its effective area
was 35.5 cm2. It was 20 cm long with an internal diameter of 0.6 cm
and an external diameter of 1 cm. The properties of these
membranes are shown in Table 24. These membranes were selected
for this study because their MWCO was lower than the molecular
weight of BSA (67 kDa). This fact ensured high BSA rejection values.
Moreover, they have MWCOs within the typical range for the
production of whey protein concentrates. In addition, high thermal
stability was desirable because high temperatures favour membrane
cleaning. According to Table 24, this characteristic was common to all
the membranes tested. Three different MWCOs (5, 15 and 30 kDa)
and different membrane materials (PES, ZrO2-TiO2 and PESH) were
selected to investigate their influence on the cleaning efficiency.
Table 24. Main properties of the membranes used
Item UP005 INSIDE-CERAMTM UH030
Manufacturer Microdyn
Nadir TAMI Industries
Microdyn Nadir
Type Flat-sheet Tubular Flat-sheet
MWCO (kDa) 5 15 30
Active layer PES ZrO2-TiO2 PESH
Effective area (cm2) 100.00 35.51 100.00
Water permeability 25ºC (L·m-2h-1·bar-1)
42.61 60.37 106.17
Maximum operating temperature (ºC)
95 95 95
pH range 0-14 0-14 0-14

Limpieza mediante disoluciones salinas de membranas ensuciadas con proteínas y sales
________________________________________________________________________________________________________________________________________________________
228
6.1.2.3. Experimental set-up
A VF-S11 UF plant (supplied by Orelis, France) was used to perform
the fouling and cleaning experiments. It consisted of a 10 L stainless
steel feed tank, a variable speed volumetric pump to control de
crossflow velocity of each step, two manometers to measure the
pressure drop across the membrane module, a temperature
regulating system and a scale (0.001 g accuracy) to gravimetrically
determine the permeate flux. This experimental set-up was described
elsewhere (Corbatón-Báguena et al., 2014).
All the experiments were performed in total recirculation mode,
except in the case of the rinsing step. Operating conditions during the
fouling experiments were a transmembrane pressure of 2 bar, a
crossflow velocity of 2 m·s-1 and a temperature of 25 ºC. The duration
of the tests was 3 h. These experimental conditions were selected
according to previous studies on whey and protein ultrafiltration
(Corbatón-Báguena et al., 2014; Matzinos and Álvarez, 2002).
6.1.2.4. Experimental procedure
Fouling experiments
Permeate flux, hydraulic resistance and rejection were measured
during the fouling process to ensure that the values obtained were
reproducible in all runs. Each fouling experiment was repeated a
minimum of 10 times.
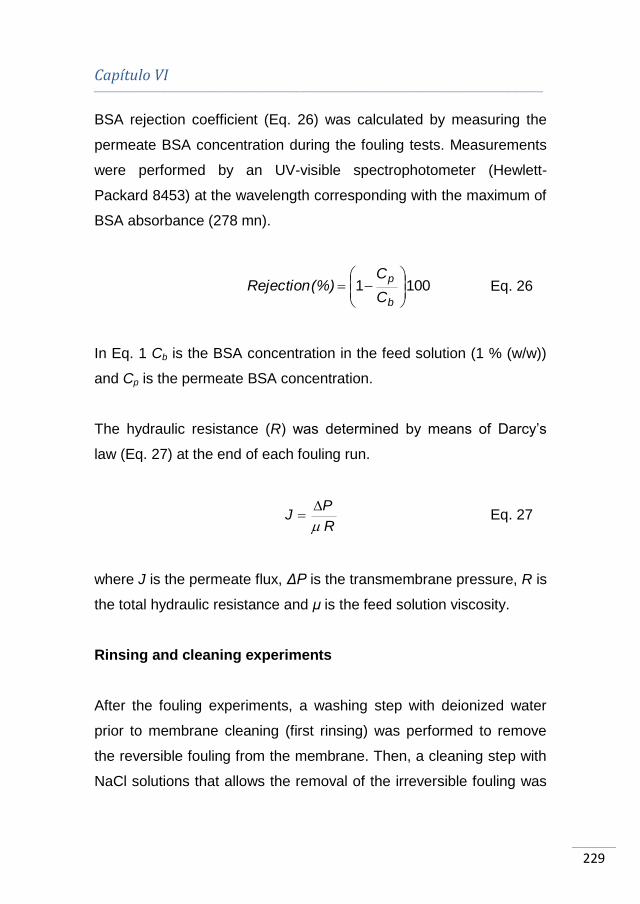
Capítulo VI ________________________________________________________________________________________________________________________________________________________
229
BSA rejection coefficient (Eq. 26) was calculated by measuring the
permeate BSA concentration during the fouling tests. Measurements
were performed by an UV-visible spectrophotometer (Hewlett-
Packard 8453) at the wavelength corresponding with the maximum of
BSA absorbance (278 mn).
1001 ·C
C(%) Rejection
b
p
Eq. 26
In Eq. 1 Cb is the BSA concentration in the feed solution (1 % (w/w))
and Cp is the permeate BSA concentration.
The hydraulic resistance (R) was determined by means of Darcy’s
law (Eq. 27) at the end of each fouling run.
R·
PJ
Eq. 27
where J is the permeate flux, ΔP is the transmembrane pressure, R is
the total hydraulic resistance and μ is the feed solution viscosity.
Rinsing and cleaning experiments
After the fouling experiments, a washing step with deionized water
prior to membrane cleaning (first rinsing) was performed to remove
the reversible fouling from the membrane. Then, a cleaning step with
NaCl solutions that allows the removal of the irreversible fouling was
Limpieza mediante disoluciones salinas de membranas ensuciadas con proteínas y sales
________________________________________________________________________________________________________________________________________________________
230
carried out. After the cleaning procedure, another rinsing step
(second rinsing) with deionized water can be performed in order to
remove the remaining loose foulant matter from the membrane
surface and the cleaning agent molecules.
Cleaning experiments were performed at a transmembrane pressure
of 1 bar, different crossflow velocities (1.2, 1.69, 2.18, 2.68, 3.19 and
4.2 m·s-1), five NaCl concentrations (0, 2.5, 5, 7.5 and 10 mM) and
three temperatures (25, 37.5 and 50 º C). The pH of all the NaCl
solutions ranged from 6.8 to 7. Each cleaning procedure was
performed in duplicate. Before and after the cleaning step the
membranes were rinsed at 25 ºC and the same transmembrane
pressure and crossflow velocity as the cleaning step. During the
rinsing and cleaning steps, low transmembrane pressure (1 bar)
favours the relaxation of the compressible fouling layer formed in the
fouling step and its removal (Blanpain-Avet et al., 2009).
The steps of cleaning and rinsing ended when the permeate flux and
the hydraulic resistance of each step remained constant with time.
The duration of the rinsing steps was 45 minutes, while the duration
of the cleaning step ranged from 70 to 80 minutes.
After the last rinsing step, if the initial permeability conditions of the
membranes were not recovered, membranes were cleaned with
alkaline solutions. Polymeric membranes (5 and 30 kDa) were
cleaned with NaOH aqueous solutions at 45 ºC and a pH of 11. The
15 kDa membrane was cleaned with 250 ppm NaClO aqueous
solutions at a pH of 11. These cleaning procedures were
Capítulo VI ________________________________________________________________________________________________________________________________________________________
231
recommended by the manufacturers to restore the membrane
permselectivity properties.
6.1.2.5. Evaluation of membrane cleanliness
Daufin et al. (2001) and Matzinos and Álvarez (2002) developed a
method to calculate the efficiency of rinsing and cleaning protocols. In
these works, membranes were cleaned with NaOH solutions and the
hydraulic resistance of the membrane after each step (fouling, first
rinsing, cleaning and second rinsing) was determined by means of
Darcy’s law. These authors proposed an equation to evaluate the
efficiency of the first rinsing to restore the membrane permeability. To
evaluate the cleaning efficiency of the entire cleaning protocol to
restore the initial membrane permeability, a similar equation (Eq. 28)
was used (Daufin et al., 2001; Matzinos and Álvarez, 2002;
Muthukumaran et al., 2007):
1002·RR
RRHCE
mf
rf
Eq. 28
where HCE is the hydraulic cleaning efficiency, Rf is the fouling
resistance, Rm is the resistance of the new membrane and Rr2 is the
hydraulic resistance after the second rinsing.
Limpieza mediante disoluciones salinas de membranas ensuciadas con proteínas y sales
________________________________________________________________________________________________________________________________________________________
232
6.1.2.6. Statistical and optimization analysis
Results of the cleaning experiments were used to determine the
relationship between the values of the cleaning operating conditions
(temperature, Tc, NaCl concentration, C, and crossflow velocity, v)
and the HCE by means of a Response Surface Methodology (RSM)
analysis. This analysis was performed with the Statgraphics®
software using a factorial design. After that, a Multiple Linear
Regression analysis was carried out to obtain a model equation for
HCE as a function of the operating conditions studied. In a first step,
Tc, C, v and their interactions were considered. If a regression model
coefficient had a p-value higher than 0.05, it was neglected because it
was not statistically significant. Thus, a new regression analysis was
performed until all the coefficients were statistically significant.
To determine the values of temperature, NaCl concentration and
crossflow velocity that maximize the value of HCE for each
membrane tested, an optimization method was performed with the
model equations obtained in the RSM analysis. The optimization
algorithm was based on the “patternsearch” function of Matlab®
software, which finds the minimum of an objective function by means
of a pattern search. Therefore, in this work the objective functions are
the opposite functions of the model equations of HCE for each
membrane. Additional parameters were included in the
“patternsearch” function as the maximum value of temperature
(50 ºC) and the maximum value of crossflow velocity (3.19 m·s-1 for
the 5 and 30 kDa membranes and 4.2 m·s-1 for the 15 kDa
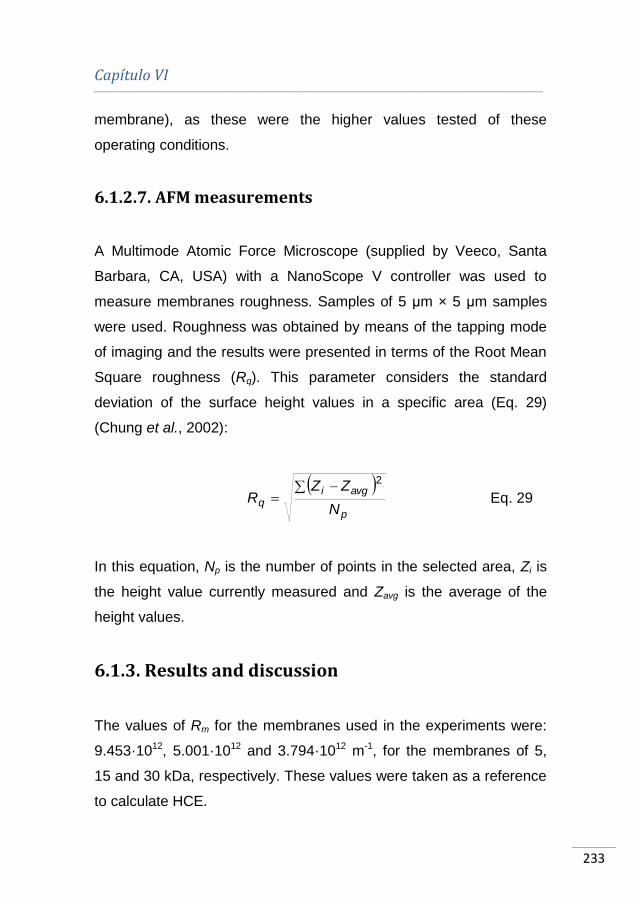
Capítulo VI ________________________________________________________________________________________________________________________________________________________
233
membrane), as these were the higher values tested of these
operating conditions.
6.1.2.7. AFM measurements
A Multimode Atomic Force Microscope (supplied by Veeco, Santa
Barbara, CA, USA) with a NanoScope V controller was used to
measure membranes roughness. Samples of 5 μm × 5 μm samples
were used. Roughness was obtained by means of the tapping mode
of imaging and the results were presented in terms of the Root Mean
Square roughness (Rq). This parameter considers the standard
deviation of the surface height values in a specific area (Eq. 29)
(Chung et al., 2002):
p
avgiq
N
ZZR
2
Eq. 29
In this equation, Np is the number of points in the selected area, Zi is
the height value currently measured and Zavg is the average of the
height values.
6.1.3. Results and discussion
The values of Rm for the membranes used in the experiments were:
9.453·1012, 5.001·1012 and 3.794·1012 m-1, for the membranes of 5,
15 and 30 kDa, respectively. These values were taken as a reference
to calculate HCE.
Limpieza mediante disoluciones salinas de membranas ensuciadas con proteínas y sales
________________________________________________________________________________________________________________________________________________________
234
6.1.3.1. Fouling experiments
Evolution of permeate flux with time during the fouling step for the 5,
15 and 30 kDa membranes is shown in Fig. 41. Among all the
membranes tested, the PESH 30 kDa membrane showed the lowest
flux decline (19.96 %) during the fouling step in comparison with the
PES 5 kDa membrane (34.62 %) and the ceramic 15 kDa membrane
(39.82 %). The reason for that is the hydrophilic nature of the 30 kDa
membrane. According to Rahimpour and Madaeni (2010), the higher
the hydrophilicity of the membrane surface is, the better the
antifouling properties (high rejection coefficient, low permeate flux
decline and low total filtration resistance) are. These authors tested
the behavior of several PES membranes during the crossflow filtration
of non-skim milk. Their results demonstrated that the hydrophilic PES
membranes had a lower permeate flux decline (about 16 %) than the
unmodified hydrophobic PES membrane (about 40 %). In addition,
protein rejection was higher for the hydrophilic membranes than for
the hydrophobic one. On the other hand, membrane fouling is also
related to the surface roughness. When membrane roughness
increases, fouling becomes more severe, because rougher surfaces
favour the entrapment of foulant molecules (Evans et al., 2008). This
phenomenon can be observed for the membranes tested comparing
permeate flux decline with the values of roughness (Rq) for each
membrane tested. The highest flux decline was achieved for the
15 kDa membrane (Rq = 17.900 nm), followed by the 5 kDa
membrane (Rq = 0.487 nm and hydrophobic) and the 30 kDa
membrane (Rq = 1.657 nm and hydrophilic).

Capítulo VI ________________________________________________________________________________________________________________________________________________________
235
Fig. 41. Variation of permeate flux with time during fouling experiments
at 2 bar, 2 m·s-1
and 25 ºC
The variation of the rejection coefficient with time for the 5, 15 and
30 kDa membranes during the fouling step can be observed in Fig.
42. After 120 min of UF, BSA rejection was very similar for all the
membranes tested (99.55 %, 99.64 % and 99.61% for the 5, 15 and
30 kDa membrane, respectively). These high rejection coefficients
may be due to the great difference between the size of BSA
molecules and the membrane pore size. When the foulant molecule
size is much higher than the membrane pore size, these molecules
can be retained on the membrane surface (Schäfer et al., 2000;
Adikane et al., 2004).
Fig. 43 shows the evolution of the hydraulic resistance during the
fouling, first rinsing, cleaning and second rinsing steps. The
0
0.5
1
1.5
2
2.5
0 20 40 60 80 100 120 140 160 180 200
J ·10
5(m
3·m
-2·s
-1)
t (min)
5 kDa
15 kDa
30 kDa
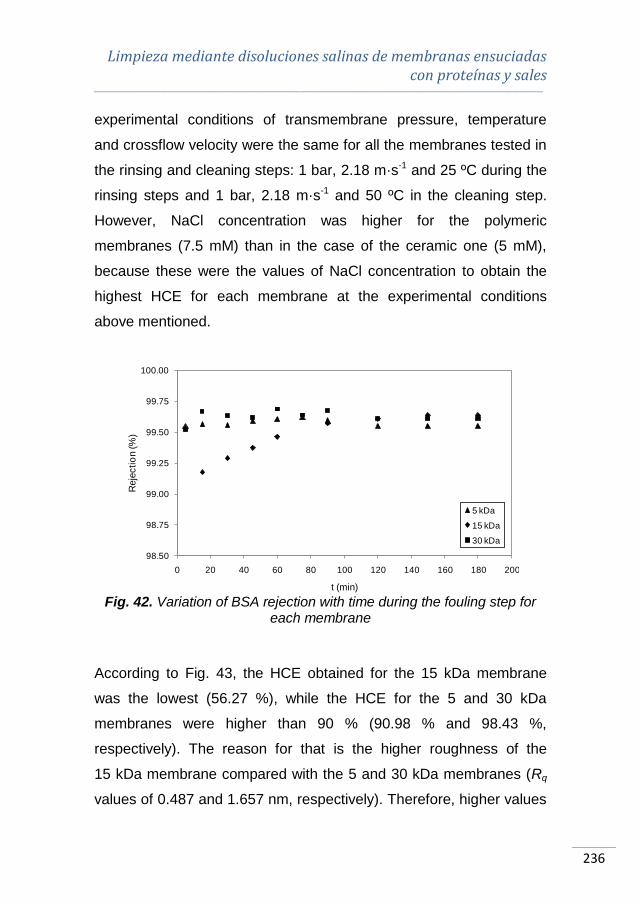
Limpieza mediante disoluciones salinas de membranas ensuciadas con proteínas y sales
________________________________________________________________________________________________________________________________________________________
236
experimental conditions of transmembrane pressure, temperature
and crossflow velocity were the same for all the membranes tested in
the rinsing and cleaning steps: 1 bar, 2.18 m·s-1 and 25 ºC during the
rinsing steps and 1 bar, 2.18 m·s-1 and 50 ºC in the cleaning step.
However, NaCl concentration was higher for the polymeric
membranes (7.5 mM) than in the case of the ceramic one (5 mM),
because these were the values of NaCl concentration to obtain the
highest HCE for each membrane at the experimental conditions
above mentioned.
Fig. 42. Variation of BSA rejection with time during the fouling step for
each membrane
According to Fig. 43, the HCE obtained for the 15 kDa membrane
was the lowest (56.27 %), while the HCE for the 5 and 30 kDa
membranes were higher than 90 % (90.98 % and 98.43 %,
respectively). The reason for that is the higher roughness of the
15 kDa membrane compared with the 5 and 30 kDa membranes (Rq
values of 0.487 and 1.657 nm, respectively). Therefore, higher values
98.50
98.75
99.00
99.25
99.50
99.75
100.00
0 20 40 60 80 100 120 140 160 180 200
Reje
ctio
n (%
)
t (min)
5 kDa
15 kDa
30 kDa
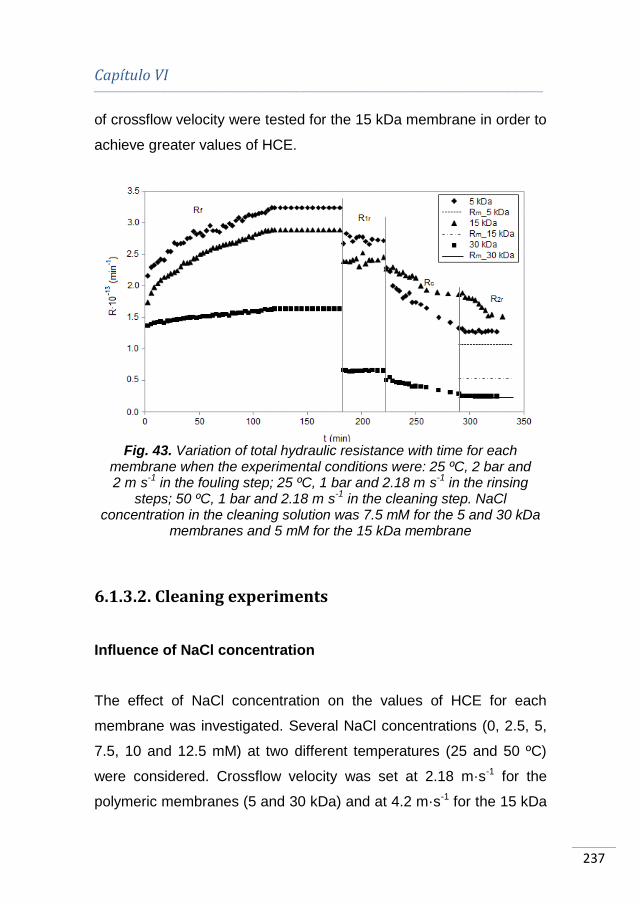
Capítulo VI ________________________________________________________________________________________________________________________________________________________
237
of crossflow velocity were tested for the 15 kDa membrane in order to
achieve greater values of HCE.
Fig. 43. Variation of total hydraulic resistance with time for each
membrane when the experimental conditions were: 25 ºC, 2 bar and 2 m·s
-1 in the fouling step; 25 ºC, 1 bar and 2.18 m·s
-1 in the rinsing
steps; 50 ºC, 1 bar and 2.18 m·s-1
in the cleaning step. NaCl concentration in the cleaning solution was 7.5 mM for the 5 and 30 kDa
membranes and 5 mM for the 15 kDa membrane
6.1.3.2. Cleaning experiments
Influence of NaCl concentration
The effect of NaCl concentration on the values of HCE for each
membrane was investigated. Several NaCl concentrations (0, 2.5, 5,
7.5, 10 and 12.5 mM) at two different temperatures (25 and 50 ºC)
were considered. Crossflow velocity was set at 2.18 m·s-1 for the
polymeric membranes (5 and 30 kDa) and at 4.2 m·s-1 for the 15 kDa
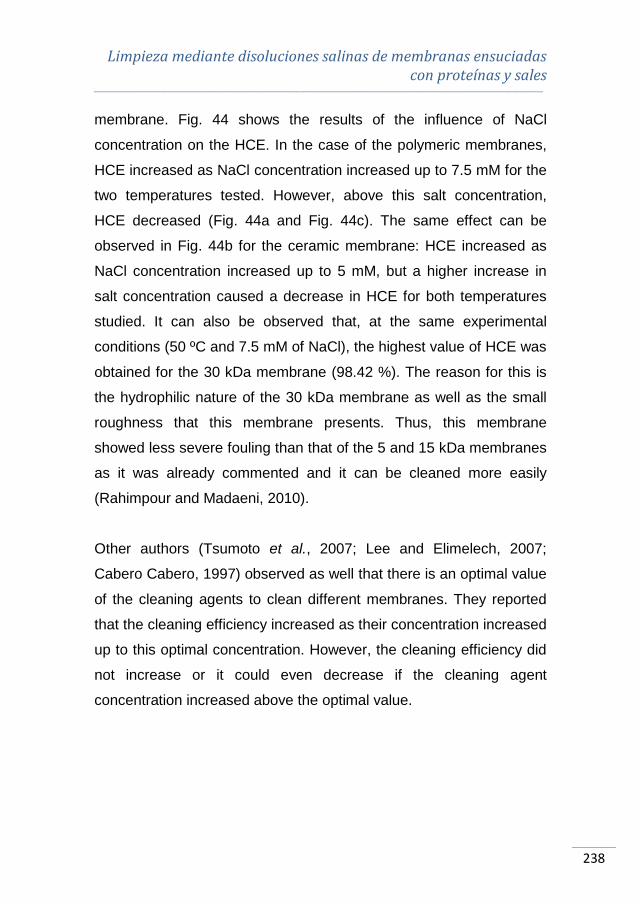
Limpieza mediante disoluciones salinas de membranas ensuciadas con proteínas y sales
________________________________________________________________________________________________________________________________________________________
238
membrane. Fig. 44 shows the results of the influence of NaCl
concentration on the HCE. In the case of the polymeric membranes,
HCE increased as NaCl concentration increased up to 7.5 mM for the
two temperatures tested. However, above this salt concentration,
HCE decreased (Fig. 44a and Fig. 44c). The same effect can be
observed in Fig. 44b for the ceramic membrane: HCE increased as
NaCl concentration increased up to 5 mM, but a higher increase in
salt concentration caused a decrease in HCE for both temperatures
studied. It can also be observed that, at the same experimental
conditions (50 ºC and 7.5 mM of NaCl), the highest value of HCE was
obtained for the 30 kDa membrane (98.42 %). The reason for this is
the hydrophilic nature of the 30 kDa membrane as well as the small
roughness that this membrane presents. Thus, this membrane
showed less severe fouling than that of the 5 and 15 kDa membranes
as it was already commented and it can be cleaned more easily
(Rahimpour and Madaeni, 2010).
Other authors (Tsumoto et al., 2007; Lee and Elimelech, 2007;
Cabero Cabero, 1997) observed as well that there is an optimal value
of the cleaning agents to clean different membranes. They reported
that the cleaning efficiency increased as their concentration increased
up to this optimal concentration. However, the cleaning efficiency did
not increase or it could even decrease if the cleaning agent
concentration increased above the optimal value.

Capítulo VI ________________________________________________________________________________________________________________________________________________________
239
(a)
(b)
(c)
Fig. 44. Influence of NaCl concentration on the values of HCE for the membranes of 5 kDa (a), 15 kDa (b) and 30 kDa (c), when the cleaning solution temperature is 25 ºC (grey bars) and 50 ºC (black bars) and the
crossflow velocity is 2.18 m·s-1
for the polymeric membranes and 4.2 m·s
-1 for the ceramic membrane
0
20
40
60
80
100
0 2.5 5 7.5 10 12.5
HC
E (
%)
NaCl concentration (mM)
25 ºC
50 ºC
0
20
40
60
80
100
0 2.5 5 7.5
HC
E (
%)
NaCl concentration (mM)
25 ºC
50 ºC
0
20
40
60
80
100
0 2.5 5 7.5 10 12.5
HC
E (
%)
NaCl concentration (mM)
25 ºC
50 ºC
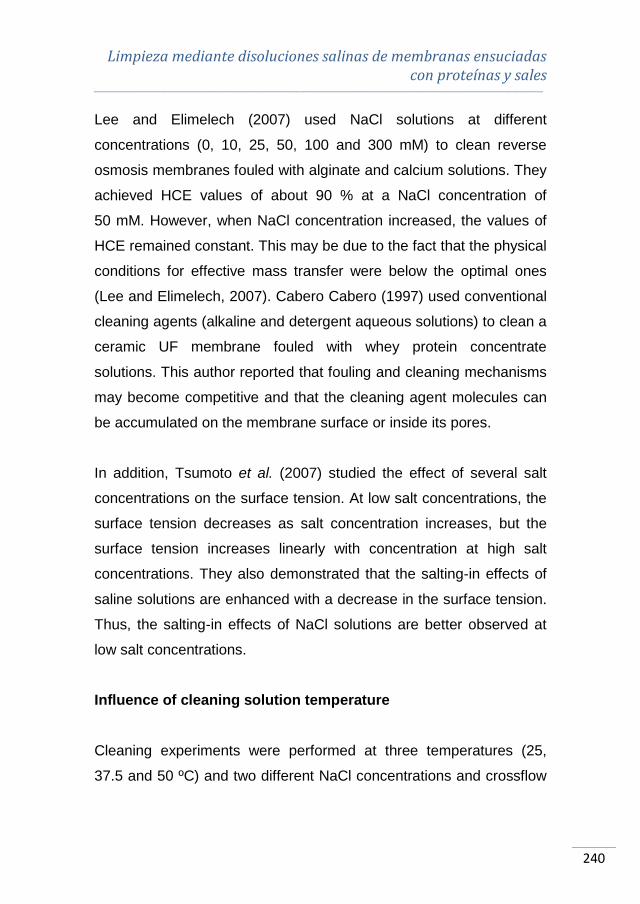
Limpieza mediante disoluciones salinas de membranas ensuciadas con proteínas y sales
________________________________________________________________________________________________________________________________________________________
240
Lee and Elimelech (2007) used NaCl solutions at different
concentrations (0, 10, 25, 50, 100 and 300 mM) to clean reverse
osmosis membranes fouled with alginate and calcium solutions. They
achieved HCE values of about 90 % at a NaCl concentration of
50 mM. However, when NaCl concentration increased, the values of
HCE remained constant. This may be due to the fact that the physical
conditions for effective mass transfer were below the optimal ones
(Lee and Elimelech, 2007). Cabero Cabero (1997) used conventional
cleaning agents (alkaline and detergent aqueous solutions) to clean a
ceramic UF membrane fouled with whey protein concentrate
solutions. This author reported that fouling and cleaning mechanisms
may become competitive and that the cleaning agent molecules can
be accumulated on the membrane surface or inside its pores.
In addition, Tsumoto et al. (2007) studied the effect of several salt
concentrations on the surface tension. At low salt concentrations, the
surface tension decreases as salt concentration increases, but the
surface tension increases linearly with concentration at high salt
concentrations. They also demonstrated that the salting-in effects of
saline solutions are enhanced with a decrease in the surface tension.
Thus, the salting-in effects of NaCl solutions are better observed at
low salt concentrations.
Influence of cleaning solution temperature
Cleaning experiments were performed at three temperatures (25,
37.5 and 50 ºC) and two different NaCl concentrations and crossflow
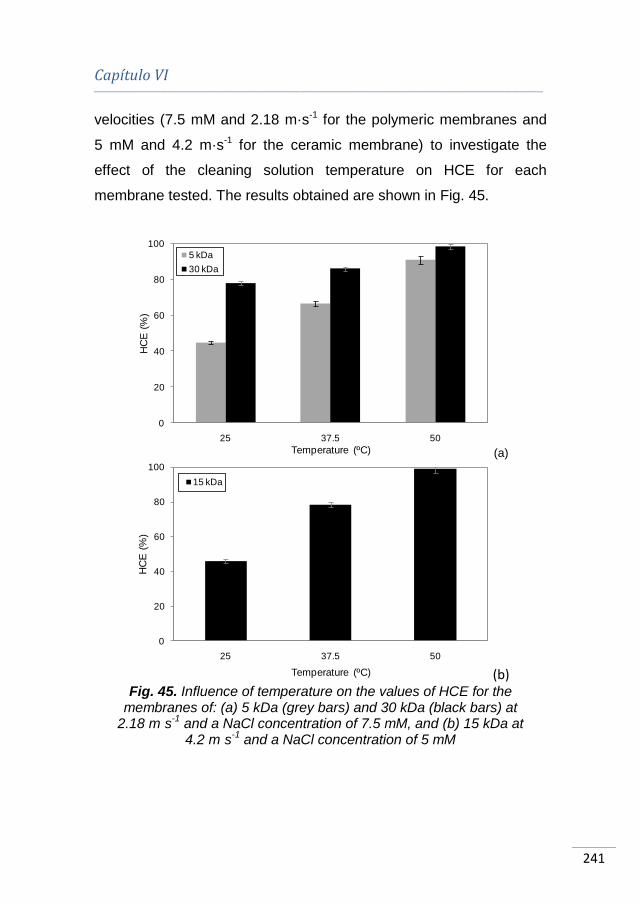
Capítulo VI ________________________________________________________________________________________________________________________________________________________
241
velocities (7.5 mM and 2.18 m·s-1 for the polymeric membranes and
5 mM and 4.2 m·s-1 for the ceramic membrane) to investigate the
effect of the cleaning solution temperature on HCE for each
membrane tested. The results obtained are shown in Fig. 45.
(a)
(b) Fig. 45. Influence of temperature on the values of HCE for the
membranes of: (a) 5 kDa (grey bars) and 30 kDa (black bars) at 2.18 m·s
-1 and a NaCl concentration of 7.5 mM, and (b) 15 kDa at 4.2 m·s
-1 and a NaCl concentration of 5 mM
0
20
40
60
80
100
25 37.5 50
HC
E (
%)
Temperature (ºC)
5 kDa
30 kDa
0
20
40
60
80
100
25 37.5 50
HC
E (
%)
Temperature (ºC)
15 kDa
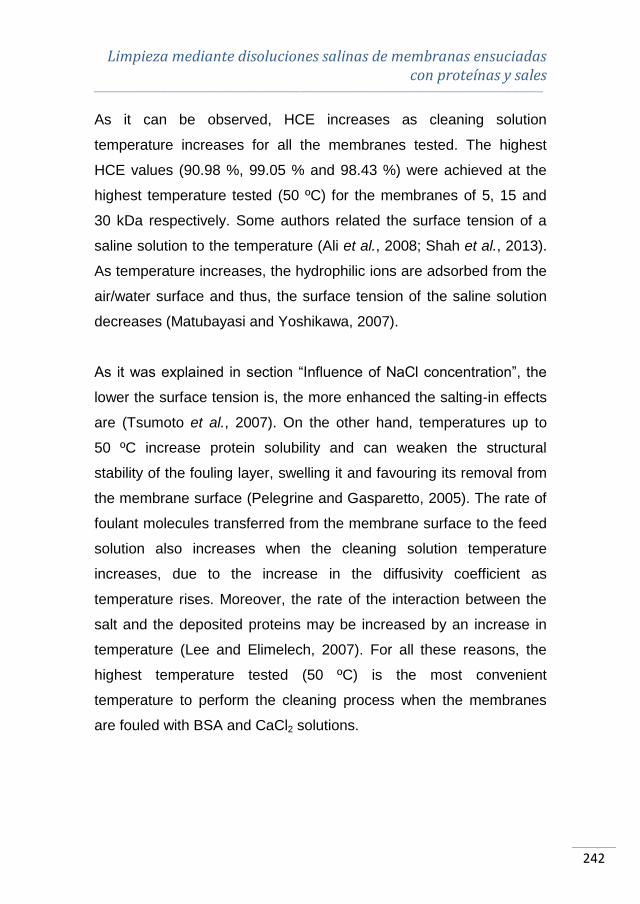
Limpieza mediante disoluciones salinas de membranas ensuciadas con proteínas y sales
________________________________________________________________________________________________________________________________________________________
242
As it can be observed, HCE increases as cleaning solution
temperature increases for all the membranes tested. The highest
HCE values (90.98 %, 99.05 % and 98.43 %) were achieved at the
highest temperature tested (50 ºC) for the membranes of 5, 15 and
30 kDa respectively. Some authors related the surface tension of a
saline solution to the temperature (Ali et al., 2008; Shah et al., 2013).
As temperature increases, the hydrophilic ions are adsorbed from the
air/water surface and thus, the surface tension of the saline solution
decreases (Matubayasi and Yoshikawa, 2007).
As it was explained in section “Influence of NaCl concentration”, the
lower the surface tension is, the more enhanced the salting-in effects
are (Tsumoto et al., 2007). On the other hand, temperatures up to
50 ºC increase protein solubility and can weaken the structural
stability of the fouling layer, swelling it and favouring its removal from
the membrane surface (Pelegrine and Gasparetto, 2005). The rate of
foulant molecules transferred from the membrane surface to the feed
solution also increases when the cleaning solution temperature
increases, due to the increase in the diffusivity coefficient as
temperature rises. Moreover, the rate of the interaction between the
salt and the deposited proteins may be increased by an increase in
temperature (Lee and Elimelech, 2007). For all these reasons, the
highest temperature tested (50 ºC) is the most convenient
temperature to perform the cleaning process when the membranes
are fouled with BSA and CaCl2 solutions.
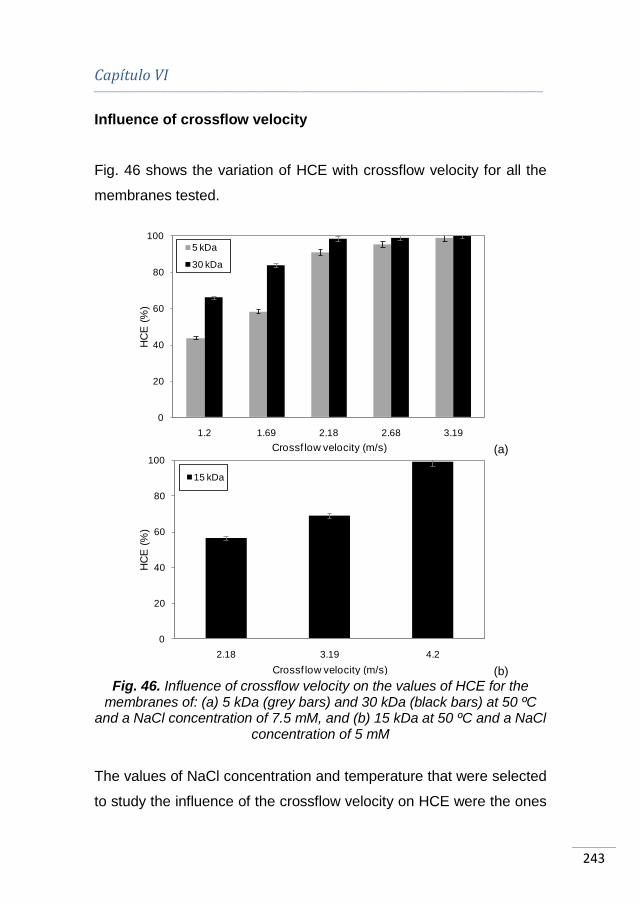
Capítulo VI ________________________________________________________________________________________________________________________________________________________
243
Influence of crossflow velocity
Fig. 46 shows the variation of HCE with crossflow velocity for all the
membranes tested.
(a)
(b)
Fig. 46. Influence of crossflow velocity on the values of HCE for the membranes of: (a) 5 kDa (grey bars) and 30 kDa (black bars) at 50 ºC
and a NaCl concentration of 7.5 mM, and (b) 15 kDa at 50 ºC and a NaCl concentration of 5 mM
The values of NaCl concentration and temperature that were selected
to study the influence of the crossflow velocity on HCE were the ones
0
20
40
60
80
100
1.2 1.69 2.18 2.68 3.19
HC
E (
%)
Crossf low velocity (m/s)
5 kDa
30 kDa
0
20
40
60
80
100
2.18 3.19 4.2
HC
E (
%)
Crossf low velocity (m/s)
15 kDa
Limpieza mediante disoluciones salinas de membranas ensuciadas con proteínas y sales
________________________________________________________________________________________________________________________________________________________
244
at which the highest values of HCE were obtained. These conditions
were a NaCl concentration of 7.5 mM and 50 ºC for the polymeric
membranes and a NaCl concentration of 5 mM and 50 ºC for the
ceramic membrane. In the case of the 5 and 30 kDa membranes (Fig.
46a), lower values of crossflow velocity were tested (1.2 and
1.69 m·s-1), due to the lower roughness of these membranes
compared with the ceramic one.
Fig. 46 shows that when crossflow velocity increases, HCE increases.
For all the membranes tested, values of HCE near 100 % were
achieved at the highest crossflow velocity tested (3.19 m·s-1 for the 5
and 30 kDa membranes and 4.2 m·s-1 for the 15 kDa membrane). As
the crossflow velocity increases, the shear force increases as well
favouring the removal of foulant molecules from the membrane
surface (Daniş and Keskinler, 2009; Smith et al., 2006; Choi et al.,
2005).
6.1.3.3. Statistical and optimization analysis
The influence of the operating conditions (temperature, NaCl
concentration and crossflow velocity) on the values of HCE was
evaluated by means of statistical (RSM and Multiple Linear
Regression) and optimization (pattern search algorithm) analysis.
The effect of temperature and NaCl concentration on HCE for the 5,
15 and 30 kDa membranes is shown in Fig. 47. Light grey and white
colours in the lower left corner of the surface contours represented
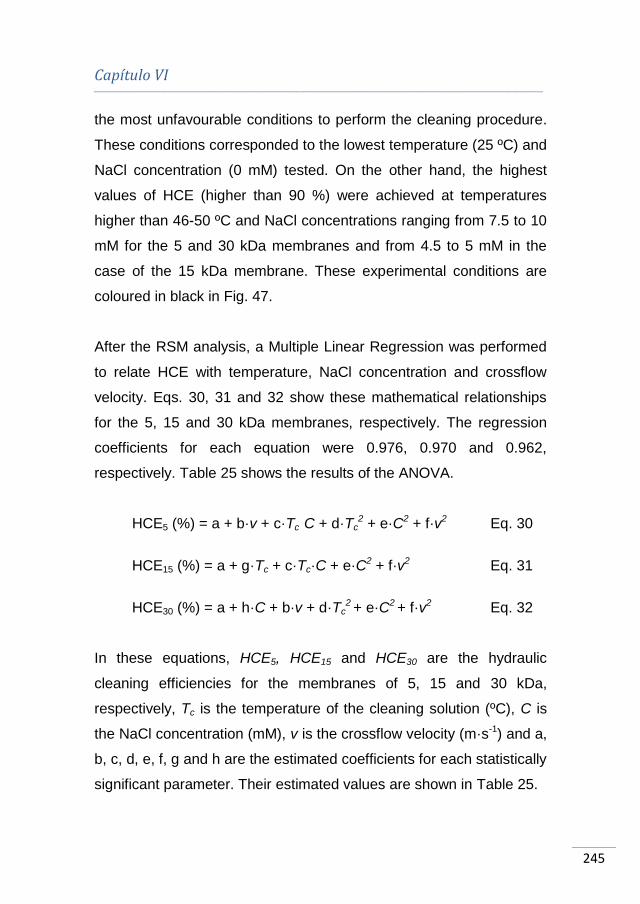
Capítulo VI ________________________________________________________________________________________________________________________________________________________
245
the most unfavourable conditions to perform the cleaning procedure.
These conditions corresponded to the lowest temperature (25 ºC) and
NaCl concentration (0 mM) tested. On the other hand, the highest
values of HCE (higher than 90 %) were achieved at temperatures
higher than 46-50 ºC and NaCl concentrations ranging from 7.5 to 10
mM for the 5 and 30 kDa membranes and from 4.5 to 5 mM in the
case of the 15 kDa membrane. These experimental conditions are
coloured in black in Fig. 47.
After the RSM analysis, a Multiple Linear Regression was performed
to relate HCE with temperature, NaCl concentration and crossflow
velocity. Eqs. 30, 31 and 32 show these mathematical relationships
for the 5, 15 and 30 kDa membranes, respectively. The regression
coefficients for each equation were 0.976, 0.970 and 0.962,
respectively. Table 25 shows the results of the ANOVA.
HCE5 (%) = a + b·v + c·Tc·C + d·Tc2 + e·C2 + f·v2 Eq. 30
HCE15 (%) = a + g·Tc + c·Tc·C + e·C2 + f·v2 Eq. 31
HCE30 (%) = a + h·C + b·v + d·Tc
2 + e·C2 + f·v2 Eq. 32
In these equations, HCE5, HCE15 and HCE30 are the hydraulic
cleaning efficiencies for the membranes of 5, 15 and 30 kDa,
respectively, Tc is the temperature of the cleaning solution (ºC), C is
the NaCl concentration (mM), v is the crossflow velocity (m·s-1) and a,
b, c, d, e, f, g and h are the estimated coefficients for each statistically
significant parameter. Their estimated values are shown in Table 25.

Limpieza mediante disoluciones salinas de membranas ensuciadas con proteínas y sales
________________________________________________________________________________________________________________________________________________________
246
(a)
(b)
(c) Fig. 47. Contour plot for HCE as a function of temperature and NaCl
concentration for the membranes of 5 kDa (a), 15 kDa (b) and 30 kDa (c) at a crossflow velocity of 2.18 m·s
-1 for the polymeric membranes and
4.2 m·s-1
for the ceramic membrane

Capítulo VI ________________________________________________________________________________________________________________________________________________________
247
Table 25. ANOVA results for the model equations that relate HCE with the operating parameters
MWCO (kDa)
Parameter Coefficient Estimated
value p-value
5
Constant a (%) -112.043 0.0000
v b (m-1·s) 97.093 0.0000
Tc·C c (ºC-1·mM-1) 0.134 0.0000
Tc2 d (ºC-2) 0.010 0.0001
C2 e (mM-2) -0.299 0.0010
v2 f (m-2·s2) -15.391 0.0007
15
Constant a (%) -43.946 0.0024
Tc g (ºC-1) 1.088 0.0006
Tc·C c (ºC-1·mM-1) 0.187 0.0010
C2 e (mM-2) -0.653 0.0054
v2 f (m-2·s2) 2.968 0.0001
30
Constant a (%) -50.809 0.0029
C h (mM-1) 4.322 0.0001
v b (m-1·s) 75.194 0.0000
Tc2 d (ºC-2) 0.011 0.0000
C2 e (mM-2) -0.221 0.0095
v2 f (m-2·s2) -13.333 0.0002
The values of the coefficients of the significant parameters are in
agreement with the experimental observations. Within the range of
values of the operating parameters considered in this work, the
equations for the polymeric membranes predicted that HCE increases
with v and decreases with v2. The values of the coefficients indicate
that the increase in HCE with this variable was much more significant
at low values of v, while at the largest values of v the increase in HCE
was much lower. However, in the case of the ceramic membrane
HCE was highly affected by v and linearly increased with this variable
for all the operating conditions tested, probably due to the greater
roughness of this membrane. The model equations predicted as well
that HCE was highly affected by Tc and it significantly increased with
Limpieza mediante disoluciones salinas de membranas ensuciadas con proteínas y sales
________________________________________________________________________________________________________________________________________________________
248
this variable for all the membranes. Regarding the effect of NaCl
concentration on HCE, the model equations predicted that HCE
increased with C and decreased with C2. This indicates that at low
values of NaCl concentration HCE increases with this variable up to
an optimum concentration and a further increase in NaCl
concentration caused a decrease in HCE. For some of the
membranes there was an interaction between concentration and
temperature, which indicates that the effect of concentration on HCE
is greater at higher NaCl concentrations and vice versa.
Results of the optimization analysis based on the “patternsearch”
function of Matlab® are shown in Table 26. According to them, the
optimal cleaning solution temperature was 50 ºC for all the
membranes tested. Optimal values of crossflow velocity and NaCl
concentration were: 3.15 m·s-1 and 10 mM for the 5 kDa membrane,
4.2 m·s-1 and 7.17 mM for the 15 kDa membrane and 2.82 m·s-1 and
9.76 mM for the 30 kDa membrane.
Table 26. Optimal values of the operating parameters obtained by means of a pattern-search algorithm
MWCO (kDa) Tc (ºC) C (mM) v (m·s-1)
5 50 10.00 3.15
15 50 7.17 4.20
30 50 9.76 2.82
6.1.4. Conclusions
Three different ultrafiltration membranes of 5, 15 and 30 kDa
that had been previously fouled with whey model solutions

Capítulo VI ________________________________________________________________________________________________________________________________________________________
249
consisting of BSA (1 % w/w) and CaCl2 (0.06 % w/w in
calcium) were effectively cleaned with NaCl solutions. NaCl
was effective as a cleaning agent at the experimental
conditions tested due to the salting-in effect of this salt.
An increase in temperature and crossflow velocity resulted in
an increase in HCE.
There was an optimal value of NaCl concentration to clean the
membranes. If NaCl concentration increased up to this optimal
value, HCE increased; but a further increase in NaCl
concentration caused a decrease in the values of HCE.
The optimal operating conditions that resulted in the maximum
values of HCE (about 100 %) were: a temperature of 50 ºC for
all the membranes, a crossflow velocity of 3.15 m·s-1 and a
NaCl concentration of 10 mM for the 5 kDa membrane, a
crossflow velocity of 4.2 m·s-1 and NaCl concentration of
7.17 mM for the 15 kDa membrane and a crossflow velocity of
2.82 m·s-1 and a NaCl concentration of 9.76 mM for the
30 kDa membrane.
Mathematical relationships between HCE and the operating
conditions were determined for all the membranes considered
using a multiple linear regression analysis.
Acknowledgements
The authors of this work wish to gratefully acknowledge the financial
support from the Spanish Ministry of Science and Innovation through
the project CTM2010-20186 and the Generalitat Valenciana through
Limpieza mediante disoluciones salinas de membranas ensuciadas con proteínas y sales
________________________________________________________________________________________________________________________________________________________
250
the program “Ayudas para la realización de proyectos I+D para
grupos de investigación emergentes GV/2013”.
Nomenclature
List of symbols
a Model equation coefficient (%)
b Model equation coefficient (m-1·s)
c Model equation coefficient (ºC-1·mM-1)
C NaCl concentration (mM)
Cb BSA concentration in the feed solution (g·L-1)
Cp BSA concentration in the permeate (g·L-1)
d Model equation coefficient (ºC-2)
e Model equation coefficient (mM-2)
f Model equation coefficient (m-2·s2)
g Model equation coefficient (ºC-1)
h Model equation coefficient (mM-1)
J Permeate flux (m3·m-2·s-1)
Np Number of points within the given area (dimensionless)
ΔP Transmembrane pressure (bar)
R Total hydraulic resistance (m-1)
Rm Resistance of the new membrane (m-1)
Rf Resistance after the fouling step (m-1)
Rr1 Resistance after the first rinsing step (m-1)
Rc Resistance after the cleaning step (m-1)
Rr2 Resistance after the second rinsing step (m-1)
Capítulo VI ________________________________________________________________________________________________________________________________________________________
251
t Filtration time (s)
Tc Temperature of the cleaning solution (ºC)
v Crossflow velocity (m·s-1)
Zi Value of height currently measured (nm)
Zavg Average of the height values of the sample (nm)
Greek letters
μ Feed solution viscosity (kg·m-1·s-1)
Abbreviations
AFM Atomic force microscopy
BSA Bovine serum albumin
HCE Hydraulic cleaning efficiency
HRE Hydraulic rinsing efficiency
MWCO Molecular weight cut off
PES Polyethersulfone
pI Isoelectric point
RSM Response surface methodology
UF Ultrafiltration
Limpieza mediante disoluciones salinas de membranas ensuciadas con proteínas y sales
________________________________________________________________________________________________________________________________________________________
252
6.2. BIBLIOGRAFÍA
ADAMS M.C., ZULEWSKA J. y BARBANO D.M. (2013). “Effect of
annatto addition and bleaching treatments on ultrafiltration flux during
production of 80 % whey protein concentrate and 80 % serum protein
concentrate” en Journal of Dairy Science, vol. 96, p. 2035-2047.
ADIKANE H.V., THAKAR D.M. y NENE S.N. (2004). “Optimisation of
colour and sugar rejection of black liquor using membranes” en
Separation and Purification Technology, vol. 36, p. 229-234.
AFONSO A., MIRANDA J.M. y CAMPOS J.B.L.M. (2009). “Numerical
study of BSA ultrafiltration in the limiting flux regime – effect of
variable physical properties” en Desalination, vol. 249, p. 1139-1150.
ALI K., SHAH A-u-H.A. y BILAL S. (2008). “Thermodynamic
parameters of surface formation of some aqueous salt solutions” en
Colloids and Surfaces A: Physicochemical Engineering Aspects, vol.
330, p. 28-34.
ALMÉCIJA M.C. et al. (2009a). “Influence of the cleaning temperature
on the permeability of ceramic membranes” en Desalination, vol. 245,
p. 708-713.
ALMÉCIJA M.C. et al. (2009b). “Analysis of cleaning protocols in
ceramic membranes by liquid-liquid displacement porosimetry” en
Desalination, vol. 245, p. 541-545.
ANG W.S. y ELIMELECH M. (2007). “Protein (BSA) fouling of reverse
osmosis membranes: Implications for wastewater reclamation” en
Journal of Membrane Science, vol. 296, p. 83-92.
BLANPAIN-AVET P., MIGDAL J.F. y BÉNÉZECH T. (2009).
“Chemical cleaning of a tubular ceramic microfiltration membrane

Capítulo VI ________________________________________________________________________________________________________________________________________________________
253
fouled with a whey protein concentrate suspension – characterization
of hydraulic and chemical cleanliness” en Journal of Membrane
Science, vol. 337, p. 153-174.
CABERO CABERO M.L. (1997). Limpieza química de membranas
inorgánicas: Aplicación al tratamiento de lactosuero. Tesis Doctoral.
Oviedo: Universidad de Oviedo, <http://hdl.handle.net/10651/13566>.
CHOI H. et al. (2005). “Influence of cross-flow velocity on membrane
performance during filtration of biological suspension” en Journal of
Membrane Science, vol. 248, p. 189-199.
CHUNG T.-S. et al. (2002). “Visualization of the effect of die shear
rate on the outer surface morphology of ultrafiltration membranes by
AFM” en Journal of Membrane Science, vol. 196, p. 251-266.
CORBATÓN-BÁGUENA M.J., ÁLVAREZ-BLANCO S. y VINCENT-
VELA M.C. (2014). “Cleaning of ultrafiltration membranes fouled with
BSA by means of saline solutions” en Separation and Purification
Technology, vol. 125, p. 1-10.
DANIŞ Ü. y KESKINLER B. (2009). “Chromate removal from
wastewater using micellar enhanced crossflow filtration: Effect of
transmembrane pressure and crossflow velocity” en Desalination, vol.
249, p. 1356-1364.
DAUFIN G. et al. (2001). “Recent and emerging applications of
membrane processes in the food and dairy industry” en Food and
Bioproducts Processing, vol. 79, p. 89-102.
EVANS P.J. et al. (2008). “The influence of hydrophobicity,
roughness and charge upon ultrafiltration membranes for black tea
liquor clarification” en Journal of Membrane Science, vol. 313, p. 250-
262.
Limpieza mediante disoluciones salinas de membranas ensuciadas con proteínas y sales
________________________________________________________________________________________________________________________________________________________
254
HOFMEISTER F. (1888). “Zur lehre von der wirkung der salze” en
Archiv for Experimentelle Pathologie und Pharmakologie, vol. 24, p.
247.
KAZEMIMOGHADAM M. y MOHAMMADI T. (2007). “Chemical
cleaning of ultrafiltration membranes in the milk industry” en
Desalination, vol. 204, p. 213-218.
LEE S. y ELIMELECH M. (2007). “Salt cleaning of organic-fouled
reverse osmosis membranes” en Water Research, vol. 41, p. 1134-
1142.
MATUBAYASI N. y YOSHIKAWA R. (2007). “Thermodynamic
quantities of surface formation of aqueous electrolyte solutions VII.
Aqueous solution of alkali metal nitrates LiNO3, NaNO3 and KNO3” en
Journal of Colloid Interface Science, vol. 315, p. 597-600.
MATZINOS P. y ÁLVAREZ R. (2002). “Effect of ionic strength on
rinsing and alkaline cleaning of ultrafiltration inorganic membranes
fouled with whey proteins” en Journal of Membrane Science, vol. 208,
p. 23-20.
MO H., TAY K.G. y NG H.Y. (2008). “Fouling of reverse osmosis
membrane by protein (BSA): Effects of pH, calcium, magnesium,
ionic strength and temperature” en Journal of Membrane Science,
vol. 315, p. 28-35.
MUTHUKUMARAN S. et al. (2004). “The use of ultrasonic cleaning
for ultrafiltration membranes in the dairy industry” en Separation and
Purification Technology, vol. 39, p. 99-107.
MUTHUKUMARAN S. et al. (2007). “The application of ultrasound to
dairy ultrafiltration: the influence of operating conditions” en Journal of
Food Engineering, vol. 81, p. 364-373.
Capítulo VI ________________________________________________________________________________________________________________________________________________________
255
NUCCI N.V. y VANDERKOOI J.M. (2008). “Effects of salts of the
Hofmeister series on the hydrogen bond network of water” en Journal
of Molecular Liquids, vol. 143, p. 160-170.
OGUNBIYI O.O., MILES N.J. y HILAL N. (2008). “The effects of
performance and cleaning cycles of new tubular ceramic
microfiltration membrane fouled with a model yeast suspension” en
Desalination, vol. 220, p. 273-289.
PELEGRINE D.H.G. y GASPARETTO C.A. (2005). “Whey proteins
solubility as function of temperature and pH” en Lebensmittel-
Wissenschaft und-Technologie, vol. 38, p. 77-80.
RAHIMPOUR A. y MADAENI S.S. (2010). “Improvement of
performance and surface properties of nano-porous polyethersulfone
(PES) membrane using hydrophilic monomers as additives in the
casting solution” en Journal of Membrane Science, vol. 360, p. 371-
379.
SCHÄFER A.I., FANE A.G. y WAITE T.D. (2000). “Fouling effects on
rejection in the membrane filtration of natural waters” en Desalination,
vol. 131, p. 215-224.
SHAH A-u-H.A., ALI K. y BILAL S. (2013). “Surface tension, surface
excess concentration, enthalpy and entropy of surface formation of
aqueous salt solutions” en Colloids and Surfaces A: Physicochemical
Engineering Aspects, vol. 417, p. 183-190.
SMITH P.J. et al. (2006). “Productivity enhancement in a cross-flow
ultrafiltration membrane system through automated de-clogging
operations” en Journal of Membrane Science, vol. 280, p. 82-88.
SUTTIPRASIT P., KRISDHASIMA V. y MCGUIRE J. (1992). “The
surface activity of α-lactabumin, β-lactoglobulin and bovine serum
Limpieza mediante disoluciones salinas de membranas ensuciadas con proteínas y sales
________________________________________________________________________________________________________________________________________________________
256
albumin” en Journal of Colloid and Interface Science, vol. 154, p. 316-
326.
TARAZAGA C.C., CAMPDERRÓS M.E. y PÉREZ-PADILLA A.
(2006). “Physical cleaning by means of electric field in the
ultrafiltration of a biological solution” en Journal of Membrane
Science, vol. 278-p. 219-224.
TSUMOTO K. et al. (2007). “Effects of salts on protein-surface
interactions: Applications for column chromatography” en Journal of
Pharmaceutical Science, vol. 96, p. 1677-1690.
WANG Y-N. y TANG C.Y. (2011). “Protein fouling of nanofiltration,
reverse osmosis, and ultrafiltration membranes-The role of
hydrodynamic conditions, solution chemistry and membrane
properties” en Journal of Membrane Science, vol. 376, p. 275-282.
ZHANG J. (2012). “Protein-protein interactions in salt solutions” en
Cai W. y Hong H. Protein-protein interactions – Computational and
experimental tools. Intech.

Limpieza mediante
disoluciones salinas de
membranas ensuciadas
con disoluciones de
lactosuero


Limpieza mediante disoluciones salinas de membranas ensuciadas con disoluciones de lactosuero
________________________________________________________________________________________________________________________________________________________
260
7.1. LIMPIEZA DE MEMBRANAS DE
ULTRAFILTRACIÓN ENSUCIADAS CON
CONCENTRADOS DE PROTEÍNAS DE
LACTOSUERO
A continuación se presenta una adaptación al formato de la Tesis
Doctoral del artículo titulado “Utilization of NaCl solutions to clean
ultrafiltration membranes fouled by whey protein concentrates”,
publicado en la revista Separation and Purification Technology. En él
se ensuciaron tres membranas de UF de diferentes materiales y
MWCO (5, 15 y 30 kDa) con disoluciones de WPC a diferentes
concentraciones (22.2, 33.3 y 150.0 g·L-1). Además, se investigó la
influencia de las condiciones de operación durante la etapa de
limpieza sobre la eficacia de dicho proceso. Estas condiciones fueron
la concentración de NaCl, la temperatura y la velocidad tangencial de
la disolución de limpieza. Los datos bibliográficos del artículo se
destacan a continuación:
Autores: M.-J. Corbatón-Báguena, S. Álvarez-Blanco, M.-C.
Vincent-Vela, J. Lora-García
Título: Utilization of NaCl solutions to clean ultrafiltration
membranes fouled by whey protein concentrates
Editorial: Elsevier
Revista: Separation and Purification Technology
año: 2015 vol. 150 p. 95-101
Doi: http://dx.doi.org/10.1016/j.seppur.2015.06.039
Capítulo VII ________________________________________________________________________________________________________________________________________________________
261
Utilization of NaCl solutions to clean ultrafiltration
membranes fouled by whey protein concentrates
María-José Corbatón-Báguena, Silvia Álvarez-Blanco*, María-Cinta
Vincent-Vela, Jaime Lora-García
Department of Chemical and Nuclear Engineering, Universitat
Politècnica de València, C/Camino de Vera s/n 46022 Valencia,
Spain
*Corresponding author: [email protected]
Tel: +34963879630 (Ext.: 796383)
Fax: +34963877639 (Ext.: 77639)
Abstract
In this work, whey protein concentrate (WPC) solutions at different
concentrations (22.2, 33.3 and 150 g·L-1) were used to foul three
ultrafiltration (UF) membranes of different materials and molecular
weight cut-offs (MWCOs): a polyethersulfone (PES) membrane of
5 kDa, a ceramic ZrO2-TiO2 membrane of 15 kDa and a permanently
hydrophilic polyethersulfone (PESH) membrane of 30 kDa. NaCl
solutions at different salt concentrations, temperatures and crossflow
velocities were used to clean the UF membranes tested. The cleaning
efficiency was related to the MWCO, membrane material and
operating conditions during fouling and cleaning steps. NaCl solutions
were able to completely clean the membranes fouled with the WPC

Limpieza mediante disoluciones salinas de membranas ensuciadas con disoluciones de lactosuero
________________________________________________________________________________________________________________________________________________________
262
solutions at the lowest concentration tested. As WPC concentration
increased, the hydraulic cleaning efficiency (HCE) decreased. The
results demonstrated that an increase in temperature and crossflow
velocity of the cleaning solution caused an increase in the HCE.
Regarding NaCl concentration, the HCE increased up to an optimal
value. As the concentration was greater than this value, the cleaning
efficiency decreased. In addition, an equation that correlates the
cleaning efficiency to the operating parameters studied in this work
(temperature, NaCl concentration, crossflow velocity in the cleaning
procedure and WPC concentration during the fouling step) was
developed and then, an optimization analysis was performed to
determine the values of the parameters that lead to a 100 % cleaning
efficiency.
Keywords: Ultrafiltration; membrane cleaning; whey protein
concentrate; NaCl solutions
7.1.1. Introduction
Nowadays, whey is one of the most important by-products in dairy
industries during cheese and casein production: 8-9 kg of whey are
produced per each 1-2 kg of cheese (Baldasso et al., 2011). Whey is
rich in proteins, lactose, minerals and water-soluble vitamins. Thus, it
is considered a valuable product for applications in food and
pharmaceutical industries rather than a wastewater (Sanmartín et al.,
2012). Among whey components, proteins have a high nutritional and
functional value due to their high content of essential amino acids and
Capítulo VII ________________________________________________________________________________________________________________________________________________________
263
their gelatinization and emulsifying properties (Wit, 1998). Because of
the interest of its protein fraction, whey is usually transformed to
obtain whey protein concentrates (WPC) with a protein content of 35-
80 % w/w in dry basis (31.23 – 234.3 g·L-1) and whey protein isolates
(WPI) with more than 85 % w/w in dry basis (237.1 g·L-1) of protein
content (Sanmartín et al., 2012). The manufacture of these products
involves different processes: ultrafiltration (UF), diafiltration,
concentration by evaporation under reduced pressure and spray
drying (Hussain et al, 2012). However, during the UF process, the
production efficiency is limited because of membrane fouling, which
results in a decline in permeate flux. As proteins and minerals are the
main foulants in whey and WPC solutions, several pretreatments can
be performed in order to increase protein solubility and limit calcium
phosphate precipitation and calcium bridging during the UF process
(Adams et al., 2013).
As pretreatments are not enough to avoid membrane fouling,
membranes have to be cleaned with conventional and non
conventional techniques. In dairy industries, conventional cleaning
agents as alkalis, acids and disinfectants are used in several washing
steps (Ogunbiyi et al., 2008; Kazemimoghadam and Mohammadi,
2007; Almécija et al., 2009a; Almécija et al., 2009b). However, in
some cases, membrane lifetime may be reduced and a negative
impact on the environment may be caused when these aggressive
agents are used. To overcome these problems, some non
conventional cleaning techniques have been developed in the last
years (Tarazaga et al., 2006; Muthukumaran et al., 2004; Argüello et
al., 2003). For instance, the use of enzymes as cleaning agents has
Limpieza mediante disoluciones salinas de membranas ensuciadas con disoluciones de lactosuero
________________________________________________________________________________________________________________________________________________________
264
been reported by other authors as an effective alternative technique
on membranes used for whey treatment (Argüello et al., 2003;
Argüello et al., 2005). The main advantage of this technique is the
utilization of mild pH values, so that the membranes may not be
affected by acids and/or alkalis. Another innovative cleaning protocol
is based on the utilization of saline solutions. Some authors
(Hofmeister, 1888; Tsumoto et al., 2007; Nucci and Vanderkooi,
2008) have reported the effect of cations and anions on the
interactions among proteins. According to their capability to increase
or decrease protein solubility, Hofmeister (1888) proposed a ranking
of salts. Based on the Hofmeister series, Tsumoto et al. (2007)
reported that some salts (such as NaCl) caused an increase in
protein solubility (salting-in effect) while other salts (such as Na2SO4)
decreased it (salting-out effect). Nucci and Vanderkooi (2008) studied
the ability of divalent and monovalent cations to precipitate proteins.
They demonstrated that calcium is one of the most salting-out
cations. This is in a good agreement with other works about the
influence of calcium on protein bridging and membrane fouling
(Almécija et al., 2009; Ang and Elimelech, 2007).
However, only a few papers are focused on the utilization of salts as
membrane cleaning agents. Lee and Elimelech (2007) tested NaCl
solutions at different concentrations to clean reverse osmosis
membranes fouled with alginate and calcium solutions. They
achieved values of cleaning efficiency of about 90 % when a salt
concentration of 50 mM was used. In a previous work, Corbatón-
Báguena et al. (2014a) studied the influence of several salts (Na2SO4,
NaCl, NaNO3, NH4Cl and KCl) on the cleaning efficiency of a 15 kDa
Capítulo VII ________________________________________________________________________________________________________________________________________________________
265
ceramic UF membrane fouled with protein solutions. They
demonstrated that chloride and nitrate salts were the most effective.
The aim of this work was to investigate the effectiveness of NaCl
solutions to clean three different UF membranes fouled with WPC
solutions at different concentrations. The effect of membrane material
and MWCO on the effectiveness of the cleaning protocol was studied
by testing a 15 kDa monotubular ceramic membrane, a 5 kDa
flat- sheet polyethersulfone (PES) membrane and a 30 kDa flat-sheet
permanently hydrophilic polyethersulfone (PESH) membrane. The
influence of the operating conditions during the cleaning procedure
(temperature, NaCl concentration and crossflow velocity) was also
investigated. The best experimental cleaning conditions to achieve
the highest cleaning efficiency were estimated by a statistical
analysis.
7.1.2. Materials and methods
7.1.2.1. Materials
Renylat WPC solutions (Industrias Lácteas Asturianas S.A., Spain) at
different concentrations (22.2, 33.3 and 150 g·L-1) were used as feed
solutions during the fouling steps. WPC was supplied in powder form
and it was dissolved in deionized water until the final concentration
was achieved. Table 27 shows the composition of the WPC.
Determination of each component in the WPC was performed as
follows: total protein concentration was determined by means of the
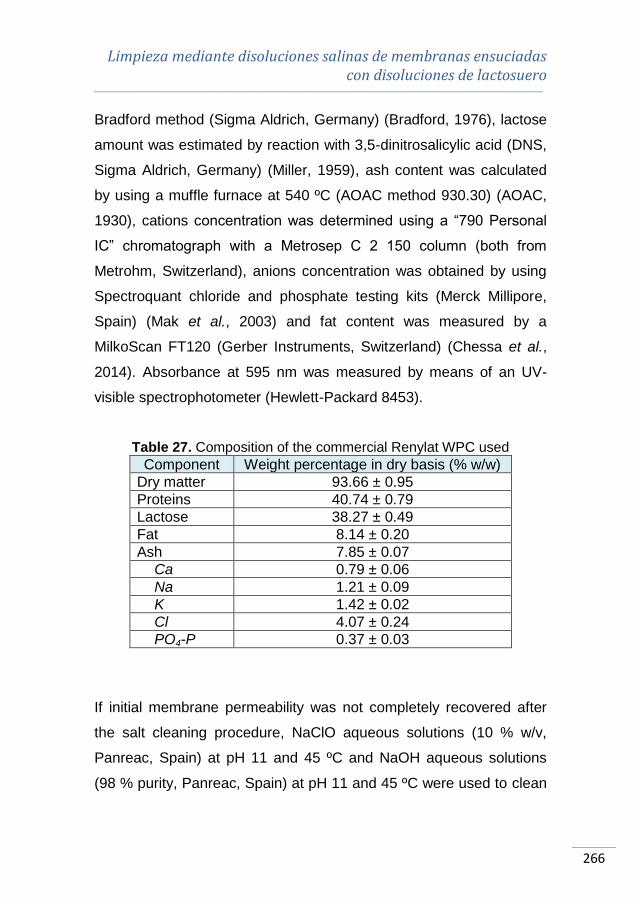
Limpieza mediante disoluciones salinas de membranas ensuciadas con disoluciones de lactosuero
________________________________________________________________________________________________________________________________________________________
266
Bradford method (Sigma Aldrich, Germany) (Bradford, 1976), lactose
amount was estimated by reaction with 3,5-dinitrosalicylic acid (DNS,
Sigma Aldrich, Germany) (Miller, 1959), ash content was calculated
by using a muffle furnace at 540 ºC (AOAC method 930.30) (AOAC,
1930), cations concentration was determined using a “790 Personal
IC” chromatograph with a Metrosep C 2 150 column (both from
Metrohm, Switzerland), anions concentration was obtained by using
Spectroquant chloride and phosphate testing kits (Merck Millipore,
Spain) (Mak et al., 2003) and fat content was measured by a
MilkoScan FT120 (Gerber Instruments, Switzerland) (Chessa et al.,
2014). Absorbance at 595 nm was measured by means of an UV-
visible spectrophotometer (Hewlett-Packard 8453).
Table 27. Composition of the commercial Renylat WPC used
Component Weight percentage in dry basis (% w/w)
Dry matter 93.66 ± 0.95
Proteins 40.74 ± 0.79
Lactose 38.27 ± 0.49
Fat 8.14 ± 0.20
Ash 7.85 ± 0.07
Ca 0.79 ± 0.06
Na 1.21 ± 0.09
K 1.42 ± 0.02
Cl 4.07 ± 0.24
PO4-P 0.37 ± 0.03
If initial membrane permeability was not completely recovered after
the salt cleaning procedure, NaClO aqueous solutions (10 % w/v,
Panreac, Spain) at pH 11 and 45 ºC and NaOH aqueous solutions
(98 % purity, Panreac, Spain) at pH 11 and 45 ºC were used to clean
Capítulo VII ________________________________________________________________________________________________________________________________________________________
267
the ceramic and polymeric membranes, respectively. These
conventional cleaning protocols are in accordance with those
suggested by the manufacturers.
7.1.2.2. Membranes
Three different UF membranes were used to perform the
experiments: a monotubular ZrO2-TiO2 membrane of 15 kDa (TAMI
Industries, France), a flat-sheet PES membrane of 5 kDa (UP005,
Microdyn Nadir, Germany) and a flat-sheet PESH membrane of
30 kDa (UH030, Microdyn Nadir, Germany). The effective area of
these membranes was 35.5 cm2 for the ceramic membrane and
100 cm2 for the polymeric membranes. These materials and MWCOs
were selected in order to study their influence on the membrane
cleaning efficiency. In addition, the MWCOs selected in this work are
in the range of the typical MWCOs used in the manufacture and
treatment of whey and WPC (Hobman, 1992; Marella et al., 2011).
7.1.2.3. Experimental set-up
Fouling and cleaning experiments were carried out in a VF-S11 UF
plant (Orelis, France) with a stainless steel feed tank of 10 L.
Crossflow velocity and pressure drop across the module were
controlled by a variable speed volumetric pump and two manometers
placed at the inlet and outlet sides of the module. Permeate flux was
measured gravimetrically using a scale (0.001 g accuracy). All the
experiments were performed in total recirculation mode, except the
Limpieza mediante disoluciones salinas de membranas ensuciadas con disoluciones de lactosuero
________________________________________________________________________________________________________________________________________________________
268
rinsing steps. The experimental set-up was described elsewhere
(Corbatón-Báguena et al., 2014a).
7.1.2.4. Experimental procedure
Fouling experiments
Fouling experiments were performed in total recirculation mode at a
transmembrane pressure of 2 bar, a crossflow velocity of 2 m·s-1 and
a temperature of 25 ºC. In addition, different WPC concentrations
were used to simulate the effect of the increase in protein
concentration during the UF process. These operating conditions
were selected according to the literature about whey protein UF
(Corbatón-Báguena et al., 2014a; Matzinos and Álvarez, 2002).
Permeate flux and rejection values were measured during the fouling
step to ensure the reproducibility of all the runs with each feed
solution. Each fouling test was repeated a minimum of 10 times.
Protein rejection was determined by Eq. 33 for all the membranes
tested.
1001 ·C
C(%) Rejection
b
p
Eq. 33
Where Cb is protein concentration in the WPC feed solution and Cp is
protein concentration in the permeate.

Capítulo VII ________________________________________________________________________________________________________________________________________________________
269
Rinsing and cleaning experiments
Reversible fouling was removed from the membrane surface by
rinsing the membranes with deionized water after the fouling step at a
transmembrane pressure of 1 bar, different crossflow velocities (1.2-
4.2 m·s-1) and 25 ºC with the permeate valve opened. Then, NaCl
cleaning step was carried out to allow the removal of the irreversible
fouling. Operating conditions during the cleaning step were the
following: four different NaCl concentrations (0-7.5 mM), four
temperatures (50-80 ºC) and the same transmembrane pressure and
crossflow velocity as those considered for the rinsing step. The pH
values of all the saline solutions ranged from 6.8 to 7. After the saline
cleaning procedure, another washing step with deionized water was
performed to completely remove the loose foulant molecules as well
as the cleaning agent molecules from the membrane surface. When
permeate flux achieved the steady-state value, cleaning and rinsing
steps ended. Duration of these steps was 45 min for the rinsing steps
and 70-80 min for the cleaning step. After the last rinsing step, a
conventional chemical cleaning with alkaline solutions was performed
if the initial permeability conditions were not achieved, as it was
mentioned and described in the “Materials” section.
7.1.2.5. Evaluation of membrane cleanliness
The hydraulic efficiencies of the first rinsing step (HRE) and of the
complete cleaning procedure (HCE), i.e. after the second rinsing step,
were calculated by Eq. 34 and 35. Other authors (Daufin et al., 2001;
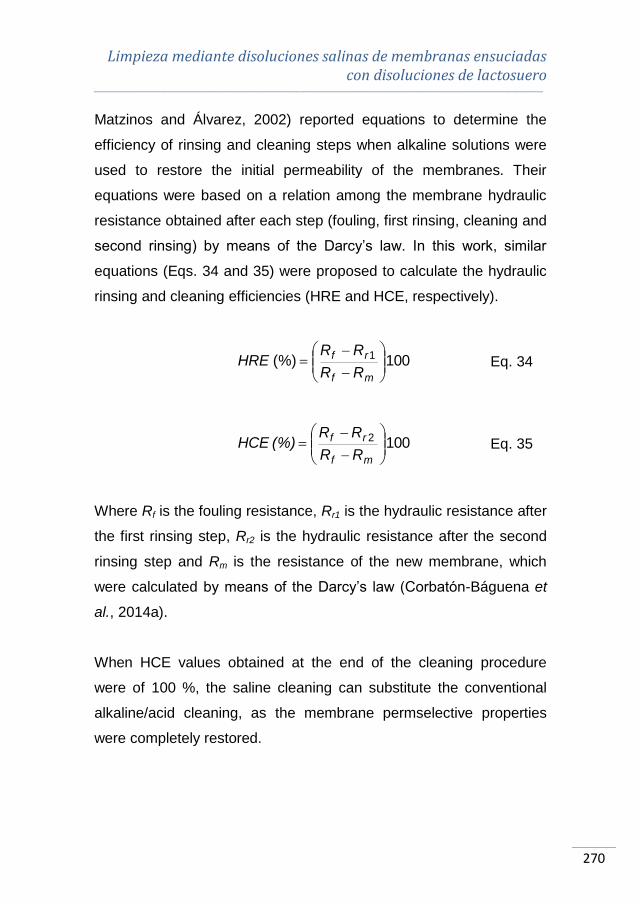
Limpieza mediante disoluciones salinas de membranas ensuciadas con disoluciones de lactosuero
________________________________________________________________________________________________________________________________________________________
270
Matzinos and Álvarez, 2002) reported equations to determine the
efficiency of rinsing and cleaning steps when alkaline solutions were
used to restore the initial permeability of the membranes. Their
equations were based on a relation among the membrane hydraulic
resistance obtained after each step (fouling, first rinsing, cleaning and
second rinsing) by means of the Darcy’s law. In this work, similar
equations (Eqs. 34 and 35) were proposed to calculate the hydraulic
rinsing and cleaning efficiencies (HRE and HCE, respectively).
100(%) 1 ·RR
RRHRE
mf
rf
Eq. 34
1002 ·RR
RR(%) HCE
mf
rf
Eq. 35
Where Rf is the fouling resistance, Rr1 is the hydraulic resistance after
the first rinsing step, Rr2 is the hydraulic resistance after the second
rinsing step and Rm is the resistance of the new membrane, which
were calculated by means of the Darcy’s law (Corbatón-Báguena et
al., 2014a).
When HCE values obtained at the end of the cleaning procedure
were of 100 %, the saline cleaning can substitute the conventional
alkaline/acid cleaning, as the membrane permselective properties
were completely restored.
Capítulo VII ________________________________________________________________________________________________________________________________________________________
271
7.1.3. Results and discussion
In order to calculate HCE for each membrane tested, the values of Rm
were necessary. These values were: 9.453·1012, 5.001·1012 and
3.794·1012 m-1, for the membranes of 5, 15 and 30 kDa, respectively.
7.1.3.1. Fouling experiments
Fig. 48 shows the evolution of permeate flux with time for each
membrane and feed solution tested. As it was expected, the higher
the WPC concentration in the feed solution was, the lower the steady-
state permeate flux was. This is due to the fact that an increase in
protein concentration results in a more severe membrane fouling due
to an increase in concentration polarization and adsorption
phenomena as protein concentration increases. Regarding the
permeate flux decline, the PESH 30 kDa membrane showed the
lowest one for all the feed solutions tested compared with the other
membranes. For instance, for the most severe fouling conditions
(WPC concentration of 150 g·L-1), the percentage of permeate flux
decline was 44.73, 56.64 and 26.84 % for the 5, 15 and 30 kDa
membranes, respectively. The reason for that is the combination of
low membrane surface roughness and high hydrophilicity of the
PESH membrane in comparison with the PES and the ceramic
membrane (Corbatón-Báguena et al., 2015). According to other
authors (Rahimpour and Madaeni, 2010; Evans et al., 2008; García-
Ivars et al., 2014), both high hydrophilicity and low surface roughness
result in membranes with better antifouling properties.

Limpieza mediante disoluciones salinas de membranas ensuciadas con disoluciones de lactosuero
________________________________________________________________________________________________________________________________________________________
272
(a)
(b)
(c) Fig. 48. Evolution of permeate flux with time for the 5 kDa (a), 15 kDa (b)
and 30 kDa (c) membranes with WPC solutions at different concentrations
0
1
2
3
4
5
6
7
0 25 50 75 100 125
J (10
-6m
3·m
-2·s
-1)
time (min)
22.2 g·L
33.3 g·L
150 g·L-1
-1
-1
0
2
4
6
8
10
0 25 50 75 100 125
J (10
-6m
3·m
-2·s
-1)
time (min)
22.2 g·L
33.3 g·L
150 g·L-1
-1
-1
0
2
4
6
8
10
12
14
16
0 25 50 75 100 125
J (10
-6m
3·m
-2·s
-1)
time (min)
22.2 g·L
33.3 g·L
150 g·L-1
-1
-1
Capítulo VII ________________________________________________________________________________________________________________________________________________________
273
Evans et al. (2008) studied the influence of surface roughness and
membrane hydrophobicity on the UF of black tea using membranes
made of different materials. They found that fouling was more severe
in the case of the rougher and more hydrophobic membranes.
Rahimpour and Madaeni (2010) investigated the effect of the
modification of the membrane with different hydrophilic monomers on
the performance of several PES membranes during the filtration of
non-skim milk. They demonstrated that, among all the modified and
unmodified membranes tested, the highest protein rejection and
lowest fouling resistances were obtained with the membranes that
showed the most hydrophilic and smooth surfaces. García-Ivars et al.
(2014) also tested modified and unmodified PES membranes with
different hydrophilicity and surface roughness in several
fouling/rinsing cycles. They obtained better performances for the
more hydrophilic and less rougher membranes. All these results are
in good agreement with the results obtained in this work. According to
the AFM measurements for the new membranes described by the
authors elsewhere (Corbatón-Báguena et al., 2014a), the values of
Root Mean Square roughness (Rq) were 0.487, 17.900 and 1.657 nm
for the 5, 15 and 30 kDa membranes, respectively. On the other
hand, while the 5 kDa membrane was hydrophobic, the 15 and
30 kDa membranes were hydrophilic. Therefore, the lowest permeate
flux decline was obtained for the 30 kDa membrane, followed by the 5
and 15 kDa membranes for all the feed solutions tested.
Fig. 49 shows the changes on protein rejection values with time for all
the membranes and feed solutions considered.
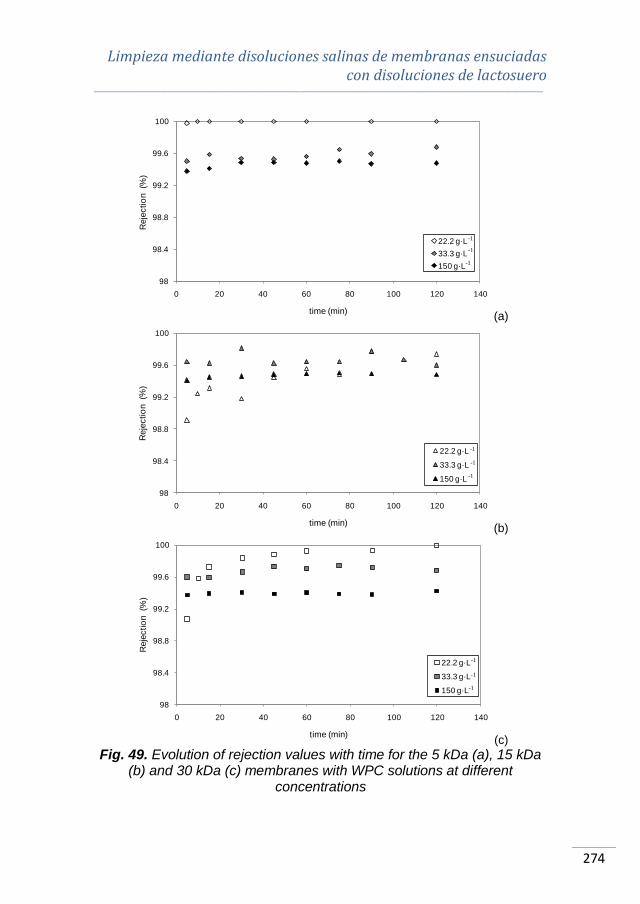
Limpieza mediante disoluciones salinas de membranas ensuciadas con disoluciones de lactosuero
________________________________________________________________________________________________________________________________________________________
274
(a)
(b)
(c)
Fig. 49. Evolution of rejection values with time for the 5 kDa (a), 15 kDa (b) and 30 kDa (c) membranes with WPC solutions at different
concentrations
98
98.4
98.8
99.2
99.6
100
0 20 40 60 80 100 120 140
Reje
ctio
n (%
)
time (min)
22.2 g·L
33.3 g·L
150 g·L-1
-1
-1
98
98.4
98.8
99.2
99.6
100
0 20 40 60 80 100 120 140
Reje
ctio
n (%
)
time (min)
22.2 g·L
33.3 g·L
150 g·L-1
-1
-1
98
98.4
98.8
99.2
99.6
100
0 20 40 60 80 100 120 140
Reje
ctio
n (%
)
time (min)
22.2 g·L
33.3 g·L
150 g·L-1
-1
-1

Capítulo VII ________________________________________________________________________________________________________________________________________________________
275
As WPC concentration increased, the steady-state rejection values
slightly decreased for all the membranes tested. Mathew et al. (2008)
also studied the influence of protein concentration on the percentage
of rejection. They demonstrated that an increase in protein
concentration resulted in a decrease in the rejection values using
multilayer membranes with the same number of bilayers.
7.1.3.2. Cleaning experiments
Effect of NaCl concentration on HCE
The influence of NaCl concentration on the effectiveness of the
cleaning protocol is shown in Fig. 50. The rest of experimental
conditions were set at 50 ºC and 2.18 m·s-1 (for the 5 and 30 kDa
membranes) and 4.2 m·s-1 (for the 15 kDa membrane). These
different crossflow velocities were selected due to the higher surface
roughness of the ceramic membrane in comparison with the
polymeric ones. The rougher the membrane surface was, the more
severe the fouling was and thus, the highest crossflow velocity that
can be achieved in the experimental set-up was selected in order to
remove the foulant deposits.
As it can be observed in Fig. 50, an increase in salt concentration
resulted in an increase in the values of HCE for each membrane
tested when a WPC concentration of 22.2 g·L-1 was used. NaCl
concentration ranged from 0 (deionized water) to 7.5 mM, according
to previous studies about salt cleaning of protein fouled membranes
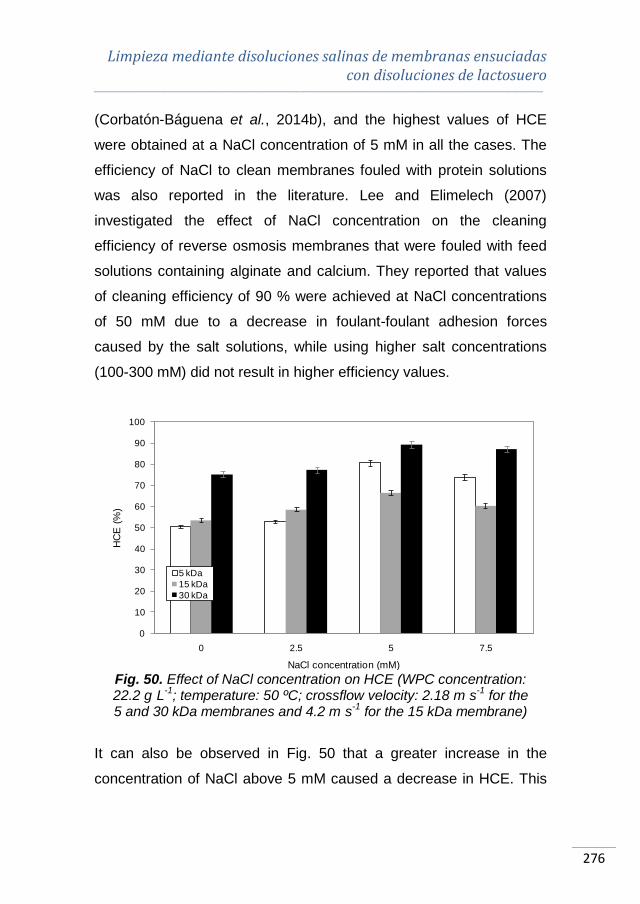
Limpieza mediante disoluciones salinas de membranas ensuciadas con disoluciones de lactosuero
________________________________________________________________________________________________________________________________________________________
276
(Corbatón-Báguena et al., 2014b), and the highest values of HCE
were obtained at a NaCl concentration of 5 mM in all the cases. The
efficiency of NaCl to clean membranes fouled with protein solutions
was also reported in the literature. Lee and Elimelech (2007)
investigated the effect of NaCl concentration on the cleaning
efficiency of reverse osmosis membranes that were fouled with feed
solutions containing alginate and calcium. They reported that values
of cleaning efficiency of 90 % were achieved at NaCl concentrations
of 50 mM due to a decrease in foulant-foulant adhesion forces
caused by the salt solutions, while using higher salt concentrations
(100-300 mM) did not result in higher efficiency values.
Fig. 50. Effect of NaCl concentration on HCE (WPC concentration: 22.2 g·L
-1; temperature: 50 ºC; crossflow velocity: 2.18 m·s
-1 for the
5 and 30 kDa membranes and 4.2 m·s-1
for the 15 kDa membrane)
It can also be observed in Fig. 50 that a greater increase in the
concentration of NaCl above 5 mM caused a decrease in HCE. This
0
10
20
30
40
50
60
70
80
90
100
0 2.5 5 7.5
HC
E (
%)
NaCl concentration (mM)
5 kDa
15 kDa
30 kDa
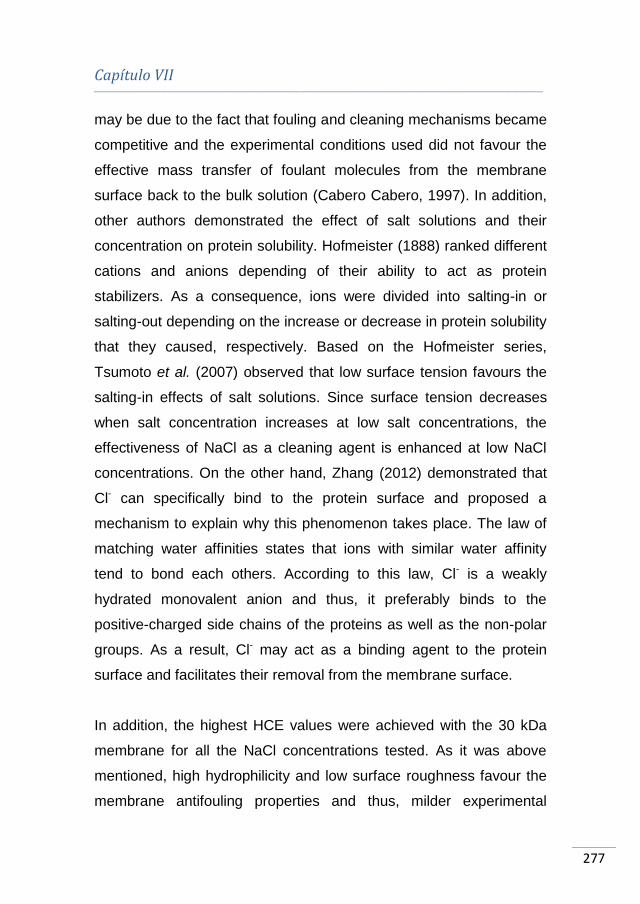
Capítulo VII ________________________________________________________________________________________________________________________________________________________
277
may be due to the fact that fouling and cleaning mechanisms became
competitive and the experimental conditions used did not favour the
effective mass transfer of foulant molecules from the membrane
surface back to the bulk solution (Cabero Cabero, 1997). In addition,
other authors demonstrated the effect of salt solutions and their
concentration on protein solubility. Hofmeister (1888) ranked different
cations and anions depending of their ability to act as protein
stabilizers. As a consequence, ions were divided into salting-in or
salting-out depending on the increase or decrease in protein solubility
that they caused, respectively. Based on the Hofmeister series,
Tsumoto et al. (2007) observed that low surface tension favours the
salting-in effects of salt solutions. Since surface tension decreases
when salt concentration increases at low salt concentrations, the
effectiveness of NaCl as a cleaning agent is enhanced at low NaCl
concentrations. On the other hand, Zhang (2012) demonstrated that
Cl- can specifically bind to the protein surface and proposed a
mechanism to explain why this phenomenon takes place. The law of
matching water affinities states that ions with similar water affinity
tend to bond each others. According to this law, Cl- is a weakly
hydrated monovalent anion and thus, it preferably binds to the
positive-charged side chains of the proteins as well as the non-polar
groups. As a result, Cl- may act as a binding agent to the protein
surface and facilitates their removal from the membrane surface.
In addition, the highest HCE values were achieved with the 30 kDa
membrane for all the NaCl concentrations tested. As it was above
mentioned, high hydrophilicity and low surface roughness favour the
membrane antifouling properties and thus, milder experimental
Limpieza mediante disoluciones salinas de membranas ensuciadas con disoluciones de lactosuero
________________________________________________________________________________________________________________________________________________________
278
conditions have to be used in order to clean such membrane. For this
reason, at the same salt concentration, temperature and crossflow
velocity, the 30 kDa membrane showed the highest values of HCE.
Effect of temperature on HCE
In order to increase the HCE values obtained for the best NaCl
concentration (see Fig. 50), several cleaning experiments at different
temperatures were performed. In this way, temperatures ranging from
50 to 80 ºC were tested to study the influence of this parameter on
HCE, while the other experimental conditions were maintained
constant for all the experiments at a NaCl concentration of 5 mM and
crossflow velocities of 2.18 m·s-1 (for the 5 and 30 kDa membranes)
and 4.2 m·s-1 (for the 15 kDa membrane).
Fig. 51 shows the values of HCE for the different temperatures and
membranes tested. Increasing the temperature of the cleaning
solution from 50 to 80 ºC resulted in an increase in HCE, achieving
efficiency values of 100 % at the highest temperature for all the
membranes used when the fouling experiments were performed with
a WPC concentration of 22.2 g·L-1. As it was above mentioned, the
lower the surface tension is, the greater the salting-in effect is
(Tsumoto et al., 2007). High temperatures lead to a decrease in the
surface tension, which enhances the effectiveness of NaCl as
cleaning agent. The interactions salt-proteins also increased as the
temperature of the cleaning solution increased, due to the effect of
temperature on the diffusivity coefficient. In this way, an increase in
temperature causes an increase in that coefficient, which results in an
Capítulo VII ________________________________________________________________________________________________________________________________________________________
279
enhancement of the mass transfer process of protein molecules from
the membrane surface to the bulk solution (Lee and Elimelech, 2007).
Fig. 51. Effect of temperature on HCE (WPC concentration: 22.2 g·L
-1;
NaCl concentration: 5 mM; crossflow velocity: 2.18 m·s-1
for the 5 and 30 kDa membranes and 4.2 m·s
-1 for the 15 kDa membrane)
Effect of crossflow velocity on HCE
Membranes fouled with WPC solutions of 22.2 g·L-1 were cleaned at
a NaCl concentration of 5 mM, a temperature of 80 ºC and different
crossflow velocities to study the influence of this operating parameter
on the HCE values. As it is shown in Fig. 52, an increase in crossflow
velocity from 1.2 to 2.18 m·s-1 caused an increase in the HCE values
obtained for all the membranes tested. The greatest HCE (about
100 %) was achieved at a crossflow velocity of 2.18 m·s-1. As Lee et
al. (2001) demonstrated, the higher the crossflow velocity during the
cleaning procedure of a PES UF membrane was, the higher the flux
0
20
40
60
80
100
50 60 70 80
HC
E (
%)
Temperature (ºC)
5 kDa15 kDa30 kDa
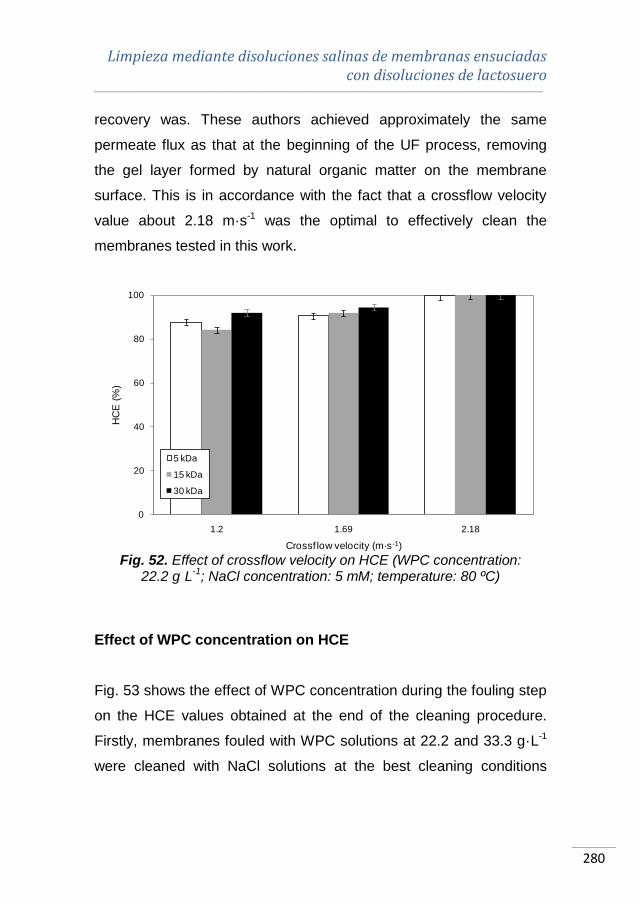
Limpieza mediante disoluciones salinas de membranas ensuciadas con disoluciones de lactosuero
________________________________________________________________________________________________________________________________________________________
280
recovery was. These authors achieved approximately the same
permeate flux as that at the beginning of the UF process, removing
the gel layer formed by natural organic matter on the membrane
surface. This is in accordance with the fact that a crossflow velocity
value about 2.18 m·s-1 was the optimal to effectively clean the
membranes tested in this work.
Fig. 52. Effect of crossflow velocity on HCE (WPC concentration:
22.2 g·L-1
; NaCl concentration: 5 mM; temperature: 80 ºC)
Effect of WPC concentration on HCE
Fig. 53 shows the effect of WPC concentration during the fouling step
on the HCE values obtained at the end of the cleaning procedure.
Firstly, membranes fouled with WPC solutions at 22.2 and 33.3 g·L-1
were cleaned with NaCl solutions at the best cleaning conditions
0
20
40
60
80
100
1.2 1.69 2.18
HC
E (
%)
Crossf low velocity (m·s-1)
5 kDa
15 kDa
30 kDa
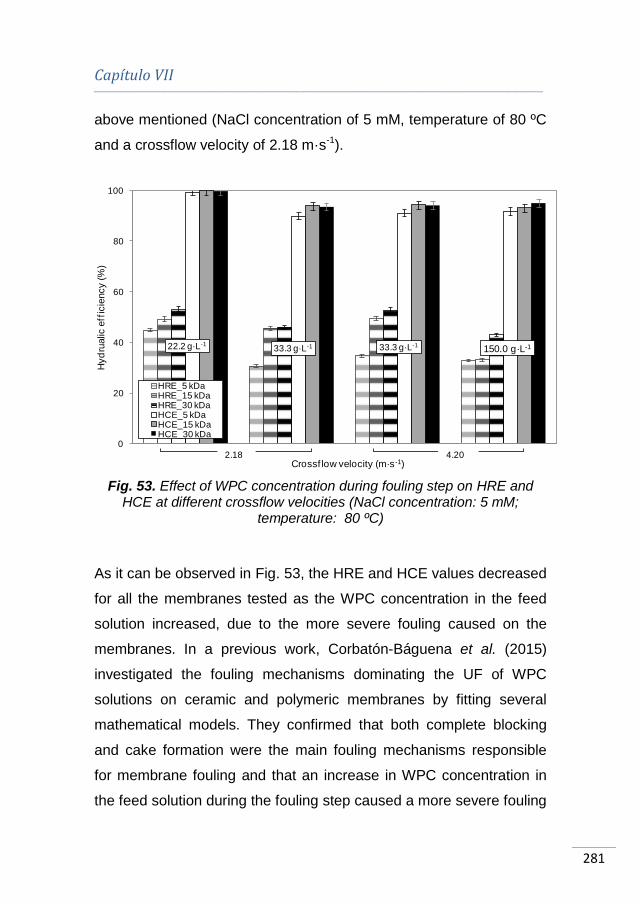
Capítulo VII ________________________________________________________________________________________________________________________________________________________
281
above mentioned (NaCl concentration of 5 mM, temperature of 80 ºC
and a crossflow velocity of 2.18 m·s-1).
Fig. 53. Effect of WPC concentration during fouling step on HRE and HCE at different crossflow velocities (NaCl concentration: 5 mM;
temperature: 80 ºC)
As it can be observed in Fig. 53, the HRE and HCE values decreased
for all the membranes tested as the WPC concentration in the feed
solution increased, due to the more severe fouling caused on the
membranes. In a previous work, Corbatón-Báguena et al. (2015)
investigated the fouling mechanisms dominating the UF of WPC
solutions on ceramic and polymeric membranes by fitting several
mathematical models. They confirmed that both complete blocking
and cake formation were the main fouling mechanisms responsible
for membrane fouling and that an increase in WPC concentration in
the feed solution during the fouling step caused a more severe fouling
150.0 g·L-122.2 g·L-133.3 g·L-1 33.3 g·L-1
0
20
40
60
80
100
Hyd
rualic
eff
icie
ncy (%
)
Crossf low velocity (m·s-1)
HRE_5 kDaHRE_15 kDaHRE_30 kDaHCE_5 kDaHCE_15 kDaHCE_30 kDa
2.18 4.20
Limpieza mediante disoluciones salinas de membranas ensuciadas con disoluciones de lactosuero
________________________________________________________________________________________________________________________________________________________
282
on the membrane surface because the values of the model
parameters increased as the WPC concentration increased. They
observed that the resistance due to concentration polarization and
adsorption as well as the resistance due to cake formation increased
for all the membranes tested when WPC concentration increased
from 22.2 to 33.3 g·L-1.
In order to obtain higher HCE results, the crossflow velocity during
the cleaning step was increased at 4.2 m·s-1. At this new value, two
different WPC concentrations were tested (33.3 and 150.0 g·L-1).
Comparing the HRE and HCE values achieved at 2.18 and 4.2 m·s-1
when a WPC concentration of 33.3 g·L-1 was used in the fouling step,
it can be observed that, although slightly higher HRE was obtained
when crossflow velocity increased, almost identical results were
obtained for all the membranes tested. This indicated that this
increase in crossflow velocity could not completely remove the protein
deposits on the membrane surface and thus, did not result in an
increase in the HCE values. This pattern also occurred when the
WPC concentration increased up to 150.0 g·L-1. In this case, the HCE
achieved was the same as that obtained for all the membranes fouled
with a WPC concentration of 33.3 g·L-1. Therefore, there is a
maximum quantity of proteins that can be removed from the
membrane surface when NaCl solutions were used as cleaning
agents and as a consequence, a maximum HCE of about 90-95 %
can be achieved with this cleaning method at the highest WPC
concentration tested.

Capítulo VII ________________________________________________________________________________________________________________________________________________________
283
Statistical and optimization analysis
An equation that relates HCE to the operating conditions and their
interactions was developed by means of the Statgraphics software
(Eq. 36). These conditions were: temperature during cleaning step, T;
NaCl concentration, CNaCl; crossflow velocity, v; membrane surface
roughness, Rq and WPC concentration during the fouling step, CWPC.
The regression coefficient R2 for Eq. 36 was 0.980 at a confidence
level of 95 % (p-values lower than 0.05).
WPCNaClq
WPCqNaCl
qNaCl
C·v·.v·C·.R·T·.v·T·.
C·.R·.v·.C·.
R·.v·.C·.T·..(%) HCE
2670636018108641
0060183019727190
93017544123236103923028303
2222
Eq. 36
To obtain the optimal conditions resulting in a HCE value of 100 %,
the Microsoft Excel Solver tool was used. Those optimal conditions
were a temperature of 80.00 ºC, a NaCl concentration of 5.01 mM, a
crossflow velocity of 2.23 m·s-1, a membrane surface roughness of
2.02 nm and a WPC concentration of 22.19 g·L-1. These values are in
a good agreement with those related to the best conditions to obtain
the highest HCE observed in Figs. 50-52 for the PESH 30 kDa
membrane used (Rq = 1.657 nm). Therefore, low membrane
roughness favours the cleaning process at milder conditions of
crossflow velocity and cleaning agent concentration, while high
temperatures result in greater cleaning efficiency values when low
protein concentration in the fouling feed solution was used.

Limpieza mediante disoluciones salinas de membranas ensuciadas con disoluciones de lactosuero
________________________________________________________________________________________________________________________________________________________
284
7.1.4. Conclusions
NaCl solutions were able to effectively clean three UF membranes of
different materials and MWCOs (a PES membrane of 5 kDa, a
ceramic ZrO2-TiO2 membrane of 15 kDa and a PESH membrane of
30 kDa) fouled with WPC solutions, resulting in high values of HCE
for all the membranes and WPC solutions tested.
Cleaning results demonstrated that an increase in temperature and
crossflow velocity of the cleaning solution caused an increase in the
HCE. Regarding NaCl concentration, there was an optimal value up
to which the HCE increased (about 5 mM for all the membranes
tested). When the concentration was greater than this value, the
cleaning efficiency decreased possibly due to the competition
between cleaning and fouling mechanisms and the reduction in
surface tension. On the other hand, the higher the WPC
concentration in the feed solution during the fouling step was, the
lower the HCE was, due to the more severe fouling caused when
protein concentration in the feed solution increased. The highest
values of the cleaning efficiency (100 %) were achieved for the lowest
WPC concentration tested (22.2 g·L-1).
An equation that correlates the HCE to the operating parameters
(temperature, NaCl concentration, crossflow velocity in the cleaning
procedure and WPC concentration during the fouling step) was
obtained with high accuracy (R2 = 0.980) at a confidence level of
95%. The optimization analysis performed showed that a temperature
Capítulo VII ________________________________________________________________________________________________________________________________________________________
285
of 80.00 ºC, a NaCl concentration of 5.01 mM, a crossflow velocity of
2.23 m·s-1, a membrane surface roughness of 2.02 nm and a WPC
concentration of 22.19 g·L-1 resulted in a 100 % of HCE, which
corresponded to the best conditions experimentally obtained for the
30 kDa membrane.
Acknowledgements
The authors of this work wish to gratefully acknowledge the financial
support from the Spanish Ministry of Science and Innovation through
the project CTM2010-20186.
Nomenclature
List of symbols
Cb Protein concentration in the feed solution (g·L-1)
CNaCl NaCl concentration (mM)
Cp Protein concentration in the permeate (g·L-1)
CWPC WPC concentration in the feed solutions (g·L-1)
J Permeate flux (m3·m-2·s-1)
ΔP Transmembrane pressure (bar)
R Total hydraulic resistance (m-1)
Rm Resistance of the new membrane (m-1)
Rf Resistance after the fouling step (m-1)
Rr1 Resistance after the first rinsing step (m-1)
Rr2 Resistance after the second rinsing step (m-1)

Limpieza mediante disoluciones salinas de membranas ensuciadas con disoluciones de lactosuero
________________________________________________________________________________________________________________________________________________________
286
Rq Root Mean Square Roughness (nm)
t Filtration time (s)
T Temperature of the cleaning solution (ºC)
v Crossflow velocity (m·s-1)
Greek letters
μ Feed solution viscosity (kg·m-1·s-1)
Abbreviations
AFM Atomic force microscopy
BSA Bovine serum albumin
HCE Hydraulic cleaning efficiency
HRE Hydraulic rinsing efficiency
MWCO Molecular weight cut off
PES Polyethersulfone
UF Ultrafiltration
WPC Whey protein concentrate
Capítulo VII ________________________________________________________________________________________________________________________________________________________
287
7.2. BIBLIOGRAFÍA
ADAMS M.C., ZULEWSKA J. y BARBANO D.M. (2013). “Effect of
annatto addition and bleaching treatments on ultrafiltration flux during
production of 80 % whey protein concentrate and 80 % serum protein
concentrate” en Journal of Dairy Science, vol. 96, p. 2035-2047.
ALMÉCIJA M.C. et al. (2009a). “Influence of the cleaning temperature
on the permeability of ceramic membranes” en Desalination, vol. 245,
p. 708-713.
ALMÉCIJA M.C. et al. (2009b). “Analysis of cleaning protocols in
ceramic membranes by liquid-liquid displacement porosimetry” en
Desalination, vol. 245, p. 541-545.
ANG W.S. y ELIMELECH M. (2007). “Protein (BSA) fouling of reverse
osmosis membranes: Implications for wastewater reclamation” en
Journal of Membrane Science, vol. 296, p. 83-92.
AOAC Official Method 930.30. (1930). “Ash of Dried Milk”. First action
1930.
BALDASSO C., BARROS T.C. y TESSARO I.C. (2011).
“Concentration and purification of whey proteins by ultrafiltration” en
Desalination, vol. 278, p. 381-386.
BRADFORD M.M. (1976). “A rapid and sensitive method for the
quantitation of microgram quantities of protein utilizing the principle of
protein-dye binding” en Analytical Biochemistry, vol. 72, p. 248-254.
CABERO CABERO M.L. (1997). Limpieza química de membranas
inorgánicas: Aplicación al tratamiento de lactosuero. Tesis Doctoral.
Oviedo: Universidad de Oviedo, <http://hdl.handle.net/10651/13566>.
Limpieza mediante disoluciones salinas de membranas ensuciadas con disoluciones de lactosuero
________________________________________________________________________________________________________________________________________________________
288
CHESSA S. et al. (2014). “Selection for milk coagulation properties
predicted by Fourier transform infrared spectroscopy in the Italian
Holstein-Friesian breed” en Journal of Dairy Science, vol. 97, p. 4512-
4521.
CORBATÓN-BÁGUENA M.J., ÁLVAREZ-BLANCO S. y VINCENT-
VELA M.C. (2014a). “Cleaning of ultrafiltration membranes fouled
with BSA by means of saline solutions” en Separation and Purification
Technology, vol. 125, p. 1-10.
CORBATÓN-BÁGUENA M.J., ÁLVAREZ-BLANCO S. y VINCENT-
VELA M.C. (2014b). “Salt cleaning of ultrafiltration membranes fouled
by whey model solutions” en Separation and Purification Technology,
vol. 132, p. 226-233.
CORBATÓN-BÁGUENA M.J., ÁLVAREZ-BLANCO S. y VINCENT-
VELA M.C. (2015). “Fouling mechanisms of ultrafiltration membranes
fouled with whey model solutions” en Desalination, vol. 360, p. 87-96.
DAUFIN G. et al. (2001). “Recent and emerging applications of
membrane processes in the food and dairy industry” en Food and
Bioproducts Processing, vol. 79, p. 89-102.
EVANS P.J. et al. (2008). “The influence of hydrophobicity,
roughness and charge upon ultrafiltration membranes for black tea
liquor clarification” en Journal of Membrane Science, vol. 313, p. 250-
262.
GARCÍA-IVARS J. et al. (2014). “Development of fouling-resistant
polyethersulfone ultrafiltration membranes via surface UV
photografting with polyethylene glicol/aluminum oxide nanoparticles“
en Separation and Purification Technology, vol. 135, p. 88-99.
Capítulo VII ________________________________________________________________________________________________________________________________________________________
289
HOFMEISTER F. (1888). “Zur lehre von der wirkung der salze” en
Archiv for Experimentelle Pathologie und Pharmakologie, vol. 24, p.
247.
HUSSAIN R., GAIANI C. y SCHER J. (2012). “From high milk protein
powders to the rehydrated dispersions in variable ionic environments:
A review” en Journal of Food Engineering, vol. 113, p. 486-503.
KAZEMIMOGHADAM M. y MOHAMMADI T. (2007). “Chemical
cleaning of ultrafiltration membranes in the milk industry” en
Desalination, vol. 204, p. 213-218.
LEE H. et al. (2001). “Cleaning strategies for flux recovery of an
ultrafiltration membrane fouled by natural organic matter” en Water
Research, vol. 35, p. 3301-3308.
LEE S. y ELIMELECH M. (2007). “Salt cleaning of organic-fouled
reverse osmosis membranes” en Water Research, vol. 41, p. 1134-
1142.
MAK W.C. et al. (2003). “Biosensor for rapid phosphate monitoring in
a sequencing batch reactor (SBR) system” en Biosensors and
bioelectronics, vol. 19, p. 233-237.
MATHEW J., ARAVINDAKUMAR C.T. y ARAVIND U.K. (2008).
“Effect of ionic strength and protein concentration on the transport of
proteins through chitosan/polystyrene sulfonate multilayer membrane”
en Journal of Membrane Science, vol. 325, p. 625-632.
MATZINOS P. y ÁLVAREZ R. (2002). “Effect of ionic strength on
rinsing and alkaline cleaning of ultrafiltration inorganic membranes
fouled with whey proteins” en Journal of Membrane Science, vol. 208,
p. 23-20.
Limpieza mediante disoluciones salinas de membranas ensuciadas con disoluciones de lactosuero
________________________________________________________________________________________________________________________________________________________
290
MILLER G.L. (1959). “Use of dinitrosalicylic acid reagent for
determination of reducing sugar” en Analytical Chemistry, vol. 31, p.
426-428.
MUTHUKUMARAN S. et al. (2004). “The use of ultrasonic cleaning
for ultrafiltration membranes in the dairy industry” en Separation and
Purification Technology, vol. 39, p. 99-107.
NUCCI N.V. y VANDERKOOI J.M. (2008). “Effects of salts of the
Hofmeister series on the hydrogen bond network of water” en Journal
of Molecular Liquids, vol. 143, p. 160-170.
OGUNBIYI O.O., MILES N.J. y HILAL N. (2008). “The effects of
performance and cleaning cycles of new tubular ceramic
microfiltration membrane fouled with a model yeast suspension” en
Desalination, vol. 220, p. 273-289.
RAHIMPOUR A. y MADAENI S.S. (2010). “Improvement of
performance and surface properties of nano-porous polyethersulfone
(PES) membrane using hydrophilic monomers as additives in the
casting solution” en Journal of Membrane Science, vol. 360, p. 371-
379.
SANMARTÍN B. et al. (2012). “Composition of caprine whey protein
concentrates produced by membrane technology after clarification of
cheese whey” en Small Ruminant Research, vol. 105, p. 186-192.
TARAZAGA C.C., CAMPDERRÓS M.E. y PÉREZ-PADILLA A.
(2006). “Physical cleaning by means of electric field in the
ultrafiltration of a biological solution” en Journal of Membrane
Science, vol. 278-p. 219-224.
TSUMOTO K. et al. (2007). “Effects of salts on protein-surface
interactions: Applications for column chromatography” en Journal of
Pharmaceutical Science, vol. 96, p. 1677-1690.
Capítulo VII ________________________________________________________________________________________________________________________________________________________
291
ZHANG J. (2012). “Protein-protein interactions in salt solutions” en
Cai W. y Hong H. Protein-protein interactions – Computational and
experimental tools. Intech.
Limpieza mediante
disoluciones salinas de
membranas ensuciadas
con enzimas

Limpieza mediante disoluciones salinas de membranas ensuciadas con enzimas
________________________________________________________________________________________________________________________________________________________
294
8.1. LIMPIEZA DE MEMBRANAS DE
ULTRAFILTRACIÓN ENSUCIADAS CON
DISOLUCIONES ENZIMÁTICAS
Este Capítulo constituye una adaptación al formato de la Tesis
Doctoral del artículo titulado “Destabilization and removal of
immobilized enzymes adsorbed onto polyethersulfone ultrafiltration
membranes by salt solutions”, publicado en la revista Journal of
Membrane Science. En él se evaluó la efectividad de dos
disoluciones salinas (NaCl y Na2SO4) para limpiar membranas de
30 kDa que habían sido ensuciadas con disoluciones enzimáticas. La
eficacia del proceso de limpieza se determinó mediante técnicas de
AFM y ATR-FTIR. Además, los modelos matemáticos descritos en el
Capítulo IV se utilizaron para determinar los mecanismos
responsables del ensuciamiento de las membranas. Los datos
bibliográficos del artículo se destacan a continuación:
Autores: M.-J. Corbatón-Báguena, A. Gugliuzza, A. Cassano, R.
Mazzei, L. Giorno
Título: Destabilization and removal of immobilized enzymes
adsorbed onto polyethersulfone ultrafiltration membranes
by salt solutions
Editorial: Elsevier
Revista: Journal of Membrane Science
año: 2015 vol. 486 p. 207-214
Doi: http://dx.doi.org/10.1016/j.memsci.2015.03.061
Capítulo VIII ________________________________________________________________________________________________________________________________________________________
295
Destabilization and removal of immobilized
enzymes adsorbed onto polyethersulfone
ultrafiltration membranes by salt solutions
María-José Corbatón-Báguena1*, Annarosa Gugliuzza2*, Alfredo
Cassano2, Rosalinda Mazzei2, Lidietta Giorno2
1Department of Chemical and Nuclear Engineering, Universitat
Politècnica de València, C/Camino de Vera s/n 46022 Valencia,
Spain
2Institute on Membrane Technology, ITM-CNR, c/o University of
Calabria, via P. Bucci, 17/C, I-87030 Rende (Cosenza), Italy
*Corresponding author 1:
María-José Corbatón-Báguena
Ph : +34963879633
Fax : +34963877639
e-mail: [email protected]
*Corresponding author 2:
Dr Annarosa Gugliuzza Ph.D.
Ph : +39 0984 49 2026 / 2004 / 2005
Fax : +39 0984 40 2103
e-mail: [email protected]
Limpieza mediante disoluciones salinas de membranas ensuciadas con enzimas
________________________________________________________________________________________________________________________________________________________
296
Abstract
In this work the effectiveness of two saline solutions (NaCl and
Na2SO4) to clean a permanently hydrophilic polyethersulfone (PESH)
ultrafiltration (UF) membrane with a molecular weight cut-off (MWCO)
of 30 kDa previously fouled with enzymatic solutions was
investigated. The influence of protein concentration in the enzymatic
solution during the fouling step and the effect of salt type during the
cleaning procedure were studied.
The protein aggregation was analysed in solution and onto the
membrane surface by using several techniques including Dynamic
Light Scattering (DLS), Atomic Force Microscopy (AFM) and Infrared
Spectroscopy with Attenuated Total Reflectance (ATR-FTIR). In
addition, mechanisms that dominate membrane fouling were studied
by fitting some mathematical models (Hermia’s models adapted to
crossflow filtration, a combined model based on the complete
blocking and cake formation equations and a resistance-in-series
model) to the experimental data.
Fouling results showed that the complete blocking/adsorption on
membrane surface was the predominant fouling mechanism.
Regarding the cleaning results, higher cleaning efficiency and low
residual protein concentration was obtained with NaCl solutions for all
the feed solutions tested due to the favourable interaction between Cl-
and proteins.

Capítulo VIII ________________________________________________________________________________________________________________________________________________________
297
Keywords: membrane cleaning; protein fouling; salt solutions;
ultrafiltration; mathematical models
8.1.1. Introduction
Fouling due to protein-membrane interactions can influence and
strongly limit the performance of membranes in several processes
such as: proteins separation/fractionation, removal of denatured
enzymes in biocatalytic membrane reactors and clarification of food
streams.
It is well known that pectinases are enzymes largely used in fruit juice
microfiltration (MF) or ultrafiltration (UF) in order to hydrolize pectic
substances, i.e. complex glycosidic macromolecules with high
molecular weight and negative charge (Jayani et al., 2005) which are
responsible for membrane fouling. In addition, pectinases can be also
immobilized on different supports depending on the industrial
application including fruit juice and olive mill wastewater processing
(Ramírez et al., 2013; Gebreyohannes et al., 2013).
Enzyme immobilization techniques and membrane fouling
mechanisms have similar characteristics, physical and/or interfacial
donor/acceptor interactions being surface controlling factors (Mazzei
et al., 2010; De Bartolo et al., 2004; Yua et al., 2013; De Luca et al.,
2009). In this way, Luo et al. (2013) stated that enzymatic entrapment
on membranes may be considered as a pore blocking mechanism

Limpieza mediante disoluciones salinas de membranas ensuciadas con enzimas
________________________________________________________________________________________________________________________________________________________
298
and the adsorption fouling can be related to the enzymatic adsorption
on the membrane surface due to hydrophobic and electrostatic
interactions. In their work, fouling mechanisms that dominate the
enzyme filtration were analyzed by two different mathematical
models: a resistance-in-series model considering the intrinsic
membrane resistance, the reversible fouling resulting from
concentration polarization layer or particle deposit and the irreversible
fouling including pore blocking or cake deposit and the classical
Hermia’s models applied to dead-end filtration. Other authors also
used these models to investigate membrane fouling. Vincent-Vela et
al. (2009) fitted the Hermia’s models adapted to crossflow filtration to
the experimental data obtained during the UF of polyethylenglycol.
They concluded that the intermediate and complete blocking
mechanisms were the models with the highest fitting accuracy for
most of the operating conditions tested. De Barros et al. (2003)
identified the fouling mechanism as a function of the membrane
material used during the crossflow UF of pineapple juice previously
treated with enzymes.
Results after fitting the Hermia’s models adapted to crossflow showed
that complete pore blocking and cake formation were the
predominant mechanisms when using the ceramic and polymeric
membranes, respectively. Similarly, Cassano et al. (2007) established
that the fouling mechanism involved in the crossflow UF of blood
orange juice with a tubular polyvinylidenefluoride (PVDF) membrane
evolved from a partial to a complete pore blocking in dependence of
the axial feed velocity. Choi et al. (2000) applied a resistance-in-
series model to the MF of bovine serum albumin (BSA) taking into
Capítulo VIII ________________________________________________________________________________________________________________________________________________________
299
account the membrane resistance, the gel layer resistance and the
fouling resistance due to the foulant deposits inside the membrane
pores. They obtained good agreement with the experimental data
recorded. Machado et al. (2012) investigated the effect of an
enzymatic treatment with pectin lyase of açaí pulp on its crossflow
MF. They also studied the predominant fouling mechanisms by a
resistance-in-series and the Hermia’s models adapted to crossflow
ones. They observed that fouling resistance decreased after the
enzymatic treatment as well as the cake formation followed by
intermediate and complete pore blocking mechanisms dominated the
MF process.
However, as Luo et al. described (2013), during the immobilization of
enzymes the convective transport of enzymes to the membrane
surface makes these particles to be retained on it and thus, enzymes
cause an increase in the local concentration. As a result,
concentration polarization increases and a fouling layer can be
formed on the membrane surface or inside its pores. In order to
remove such a fouling layer, membranes have to be cleaned.
Conventional cleaning protocols involve chemical cleaning agents
such as alkalis, acids, disinfectants, surfactants or combinations of
them (Ogunbiyi et al., 2008). However, these conventional cleaning
methods may be aggressive for the membranes and their lifetime and
selectivity may be reduced. In addition, these conventional cleaning
agents cause a negative environmental impact when they are
discharged as wastewaters after the cleaning step. For all these
reasons, new alternative cleaning techniques, including ultrasounds
(Muthukumaran et al., 2004), electromagnetic fields (Tarazaga et al.,
Limpieza mediante disoluciones salinas de membranas ensuciadas con enzimas
________________________________________________________________________________________________________________________________________________________
300
2006) and saline solutions (Lee and Elimelech, 2007) have been
developed in the recent years to overcome these problems.
Regarding the use of saline solutions, previous studies reported the
salting-in and salting-out effect of different cations and anions to
increase or decrease, respectively, protein solubility at pH values
above and below the isoelectric point of the protein (Curtis and Lue,
2006; Zhang, 2012). Lee and Elimelech (2007) also investigated the
cleaning mechanism of saline solutions: in a first stage, the difference
between the bulk solution concentration and the gel layer
concentration on the membrane surface causes changes on the
cross-linked fouling layer. Then, an ion-exchange reaction takes
place between the ions forming the gel layer on the membrane
surface and the salt ions of the cleaning solution that diffuse in the gel
layer. This ion exchange results in a swelling and removal of the gel
layer by freeing the protein molecules and favouring their transport to
the bulk solution.
The aim of this work is to investigate the effectiveness of NaCl and
Na2SO4 solutions for cleaning a PESH UF membrane with a
molecular weight cut-off (MWCO) of 30 kDa that was previously
fouled with enzymatic solutions of pectinases at different protein
concentration (2, 7.5 and 15 g/L). The influence of protein
concentration on membrane fouling was studied by AFM and ATR-
FTIR techniques and the fouling mechanism that dominates the UF of
each feed solution tested was also determined by fitting three
mathematical models to the experimental data: Hermia’s models
adapted to crossflow filtration, a combined model based on the
complete blocking and cake formation mechanisms and a resistance-
Capítulo VIII ________________________________________________________________________________________________________________________________________________________
301
in-series model. The membrane cleanliness was evaluated by
ATR-FTIR measurements and the residual protein concentration
adsorbed on the membrane surface was also quantified.
8.1.2. Materials and methods
8.1.2.1. Chemicals
Enzymatic solutions of pectinases (Pectinex Smash XXL,
Novozymes) at different protein concentrations (2, 7.5 and 15 g/L)
were used as feed solutions during the fouling step. According to the
manufacturer information, the enzymatic solution is mainly composed
of pectin lyases from Aspergillus niger. NaCl and Na2SO4 solutions
were the cleaning agents tested. Protein concentration in the
enzymatic solutions was determined by the Bicinchoninic Acid (BCA)
assay (Sigma Aldrich).
8.1.2.2. Experimental set-up
A permanently hydrophilic polyethersulfone (PESH) ultrafiltration
membrane (Microdyn Nadir, Germany) with a MWCO of 30 kDa was
tested in the experiments. The main characteristics of the virgin
membrane are shown in Table 28.
All the fouling and cleaning experiments were performed in a
conventional crossflow UF system. It consisted of a feed tank of 1 L,
a variable speed pump, a stainless-steel cell able to accommodate a

Limpieza mediante disoluciones salinas de membranas ensuciadas con enzimas
________________________________________________________________________________________________________________________________________________________
302
flat-sheet membrane and a permeate tank. Transmembrane pressure
was measured by two manometers allocated before and after the
membrane module and regulated by a pressure control valve located
on the retentate line. Crossflow velocity was controlled by a digital
flowmeter. Temperature was set at 25 ± 1 ºC during the fouling and
rinsing steps using a cooling system fed with tap water, while during
the cleaning step temperature was set at 50 ± 3ºC using a heater.
Table 28. Main properties of the membrane used
Commercial code UH030
Manufacturer Microdyn Nadir
Type Flat-sheet
Nominal MWCO (kDa) 30
Active layer PESH
Effective area (cm2) 35.25
Water permeability at 25ºC (L/m2·h·bar) 106.00
Maximum operating temperature (ºC) 95
pH range 0-14
8.1.2.3. Experimental procedure
Fouling tests were carried out with an enzymatic solution at three
different protein concentrations (2, 7.5 and 15 g/L) without pH
adjustment (pH value of about 4.3). Experimental conditions of
transmembrane pressure, crossflow velocity and temperature were
set at 2 bar, 2 m/s and 25 ºC, respectively. The duration of the fouling
tests was 2 h. These conditions were selected according to previous
studies on protein solutions ultrafiltration (Corbatón-Báguena et al.,
2014a; Corbatón-Báguena et al., 2014b; Matzinos and Álvarez,
2002).
Capítulo VIII ________________________________________________________________________________________________________________________________________________________
303
After the fouling step, a first rinsing with distilled water was performed
during 30 min at a transmembrane pressure of 1 bar and a crossflow
velocity of 2.18 m/s. According to the literature (Blanpain-Avet et al.,
2009), low transmembrane pressures and high crossflow velocities
favour the removal of solute molecules deposited on the membrane
surface. Then, a cleaning step with saline solutions during 60 min and
a second rinsing step with distilled water during 30 min were carried
out at the same experimental conditions of transmembrane pressure
as the first rinsing step. NaCl and Na2SO4 solutions were tested
during the cleaning protocol at a concentration of 5 mM and a
temperature of 50 ºC. These conditions were the optimal ones in
previous studies about saline cleaning of membranes fouled with
protein solutions (Corbatón-Báguena et al., 2014a; Corbatón-
Báguena et al., 2014b).
Permeate flux and hydraulic resistance were monitored during all the
steps of the experimental procedure. Once the cleaning procedure
was finished, water permeability was measured again in order to
evaluate the cleaning efficiency, expressed as:
1000
1 WP
WPCE Eq. 37
where WP1 and WP0 are the water permeability of the cleaned and
virgin membrane, respectively.
Limpieza mediante disoluciones salinas de membranas ensuciadas con enzimas
________________________________________________________________________________________________________________________________________________________
304
8.1.2.4. Characterization of the enzymatic solutions
The BCA assay was used to determine the protein concentration in
the enzymatic solutions (Morton and Evans, 1992; Krieg et al., 2005).
This assay is a colorimetric method based on the formation of a Cu+2-
protein complex under alkaline conditions. Then, reduction of Cu+2 to
Cu+1 takes place and the amount of reduction is directly proportional
to the amount of protein in the sample. According to the standard
assay protocol, 0.1 mL of sample were mixed with 2 mL of the BCA
working reagent and incubated at 37 ºC during 30 min. Then,
samples were cooled at room temperature and absorbance was
measured at a wavelength of 562 nm by a UV-visible
spectrophotometer. By using a calibration test performed with the
bovine serum albumin (BSA) standard solution, protein concentration
in the enzymatic solutions was estimated. Each sample was
duplicated for the measurement.
Size measurements of protein particles were carried out by Zetasizer
nano (Malvern Instruments). The Zetasizer system determines the
particles size by measuring the Brownian motion of the particles in a
sample using Dynamic Light Scattering (DLS). Previous studies
demonstrated that these techniques were suitable for protein
characterization (Mattison and Kaszuba, 2004; Schultz et al., 2008).
In order to analyse the particle size in pectinase solution in the
conditions in which membrane was fouled with pectinase (at 25 °C)
and during cleaning treatment (at 50 °C in presence of NaCl),
different analysis were carried out by DLS varying protein
Capítulo VIII ________________________________________________________________________________________________________________________________________________________
305
concentration (2, 7, 15 g/L). In addition protein size measurements at
15 g/L were also carried out in presence of NaCl (5mM). Hypothesis
testing considering a confidence interval of 95 % and using the
Statgraphics® Centurion XVI software were performed in order to
determine if statistically significant differences exist among the
particle size distributions at 25 ºC, 50 ºC and the combination of
50 ºC and NaCl (Alcheikhhamdon et al., 2015).
8.1.2.5. Membrane characterization
Prior to the fouling experiments, the membrane was compacted with
ultrapure water by increasing and decreasing the transmembrane
pressure from 1 bar to 4 bar until a constant hydraulic permeability
was obtained. Accordingly, the intrinsic membrane resistance (Rm)
was calculated. Ultrapure water was used in order to prevent
additional dirty on the membrane surface.
Infrared spectra in ATR mode were collected onto the membrane
surface before and after each fouling and cleaning experiments by
using an ATR-FTIR spectrometer (Spectrum One, Perkin Elmer). The
adsorption and deposition of proteins on the membrane surface and
related changes in the surface roughness were detected by using
Atomic Force Microscopy (AFM), Nanoscope III (Digital Instruments,
VEECO Metrology Group). Tapping Mode AFM operated by scanning
a tip attached to the end of an oscillating cantilever across
2.5x2.5 μm of sample surface.
Limpieza mediante disoluciones salinas de membranas ensuciadas con enzimas
________________________________________________________________________________________________________________________________________________________
306
The amount of residual material adsorbed onto the membrane
surface was quantified according to the following equation (Rabiller-
Baudry et al., 2008):
01650003401240
1539 .C·.H
Hprotein Eq. 38
where H1539 is the height of the absorption band at 1539 cm-1 (amide
2), H1240 is the height of the absorption band at 1240 cm-1 (PES
membrane) and Cprotein is the residual protein concentration deposited
on membrane surface. This equation is valid in the protein
concentration range of 0.5-350 μg/cm2 with a maximum deviation of
1 μg/cm2, according to Rabiller-Baudry et al. (2012).
8.1.2.6. Mathematical modelling
Different mathematical models were fitted to the experimental data
obtained during the UF of pectinase solutions using the MathCad®
Genfit algorithm, which minimizes the overall difference between
experimental and predicted results by the Levenberg-Marquadt
method. The success of fitting was evaluated in terms of regression
coefficient R2 and standard deviation SD.
Hermia’s models
Hermia (1982) developed four models based on classical constant
pressure dead-end filtration equations in order to describe four main
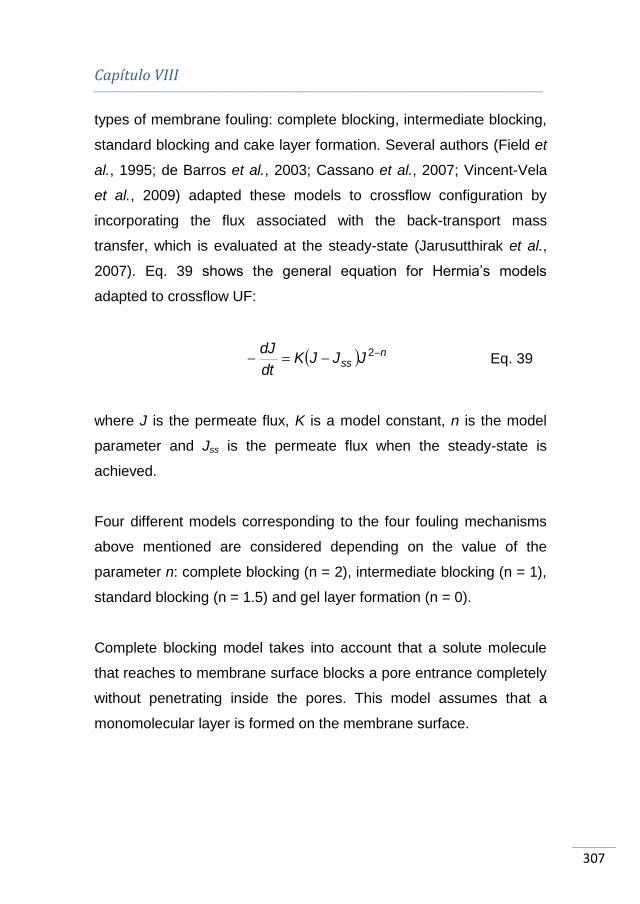
Capítulo VIII ________________________________________________________________________________________________________________________________________________________
307
types of membrane fouling: complete blocking, intermediate blocking,
standard blocking and cake layer formation. Several authors (Field et
al., 1995; de Barros et al., 2003; Cassano et al., 2007; Vincent-Vela
et al., 2009) adapted these models to crossflow configuration by
incorporating the flux associated with the back-transport mass
transfer, which is evaluated at the steady-state (Jarusutthirak et al.,
2007). Eq. 39 shows the general equation for Hermia’s models
adapted to crossflow UF:
nss JJJK
dt
dJ 2 Eq. 39
where J is the permeate flux, K is a model constant, n is the model
parameter and Jss is the permeate flux when the steady-state is
achieved.
Four different models corresponding to the four fouling mechanisms
above mentioned are considered depending on the value of the
parameter n: complete blocking (n = 2), intermediate blocking (n = 1),
standard blocking (n = 1.5) and gel layer formation (n = 0).
Complete blocking model takes into account that a solute molecule
that reaches to membrane surface blocks a pore entrance completely
without penetrating inside the pores. This model assumes that a
monomolecular layer is formed on the membrane surface.

Limpieza mediante disoluciones salinas de membranas ensuciadas con enzimas
________________________________________________________________________________________________________________________________________________________
308
The intermediate blocking model considers that a solute molecule can
deposit on previously settled ones. However, as in the complete
blocking model, fouling takes place only on the membrane surface.
When solute molecules are smaller than membrane pore size, these
molecules can penetrate inside the pores. This is the main hypothesis
of the standard blocking model.
Cake formation model is based on the assumption that solute
molecules accumulate on membrane surface because they have a
larger size than membrane pores. Therefore, a permeable layer is
formed on the membrane surface.
Combined model
Previous studies (Field et al., 1995; Ho and Zydney, 2000;
Jarusutthirak et al., 2007; de la Casa et al., 2008) reported that the
typical variation of permeate flux with time includes two fouling
mechanisms: a rapid flux decline during the first minutes of operation
due to pore blocking and an accumulation of foulants on the
membrane surface that causes a long term flux decline due to a cake
formation. In this work, a combined model considering the Hermia’s
equations for crossflow UF corresponding to complete blocking and
cake formation was used to predict the permeate flux decline.
Therefore, the general equation of the combined model is Eq. 40,
where α is the fraction of membrane pores that are completely
blocked:
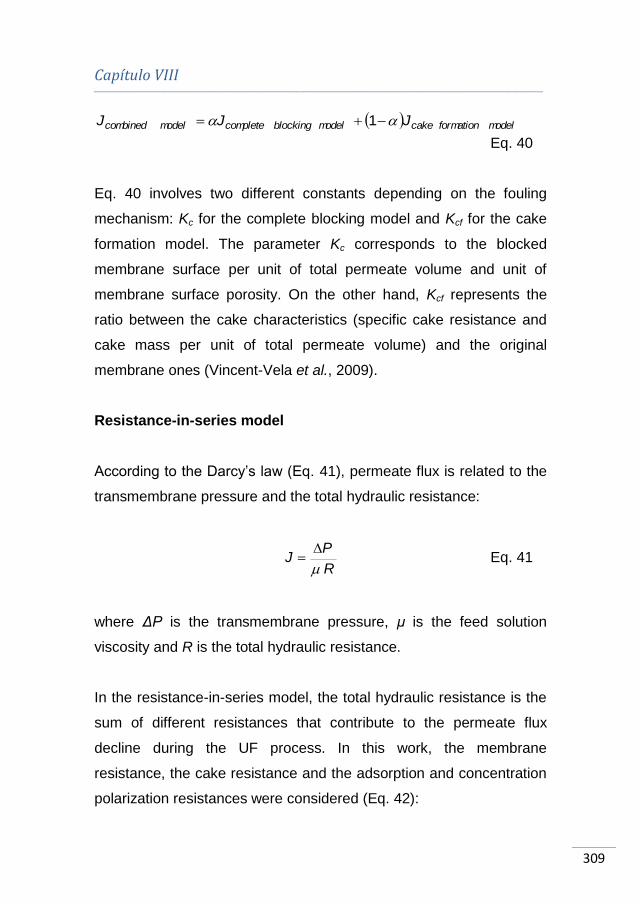
Capítulo VIII ________________________________________________________________________________________________________________________________________________________
309
model formation cakemodel blocking completemodel combined JJJ 1
Eq. 40
Eq. 40 involves two different constants depending on the fouling
mechanism: Kc for the complete blocking model and Kcf for the cake
formation model. The parameter Kc corresponds to the blocked
membrane surface per unit of total permeate volume and unit of
membrane surface porosity. On the other hand, Kcf represents the
ratio between the cake characteristics (specific cake resistance and
cake mass per unit of total permeate volume) and the original
membrane ones (Vincent-Vela et al., 2009).
Resistance-in-series model
According to the Darcy’s law (Eq. 41), permeate flux is related to the
transmembrane pressure and the total hydraulic resistance:
R·
PJ
Eq. 41
where ΔP is the transmembrane pressure, μ is the feed solution
viscosity and R is the total hydraulic resistance.
In the resistance-in-series model, the total hydraulic resistance is the
sum of different resistances that contribute to the permeate flux
decline during the UF process. In this work, the membrane
resistance, the cake resistance and the adsorption and concentration
polarization resistances were considered (Eq. 42):

Limpieza mediante disoluciones salinas de membranas ensuciadas con enzimas
________________________________________________________________________________________________________________________________________________________
310
cadm RRR·
PJ
Eq. 42
where Rm is the virgin membrane resistance, Rc is the cake
resistance and Rad is the resistance due to adsorption on/in
membrane surface and pores and concentration polarization. In
addition, Rad can be expressed as an exponential function of the
steady-state adsorption and concentration polarization resistance and
the rate at which foulant molecules are deposited on the membrane
(Choi et al., 2000; Carrère et al., 2001). Therefore, Eq. 43 shows the
general equation for the resistance-in-series model:
cadm Rbtexp'RR·
PJ
1 Eq. 43
where R’ad is the steady-state adsorption and concentration
polarization resistance and b is the fouling rate due to adsorption.
8.1.3. Results and discussion
8.1.3.1. Fouling results
Determination of protein fouling
DLS measurements on protein solutions (Table 29) showed a
bimodal distribution for all the protein concentrations tested at 25 °C.
As it is possible to observe, the particle size belonging to distribution
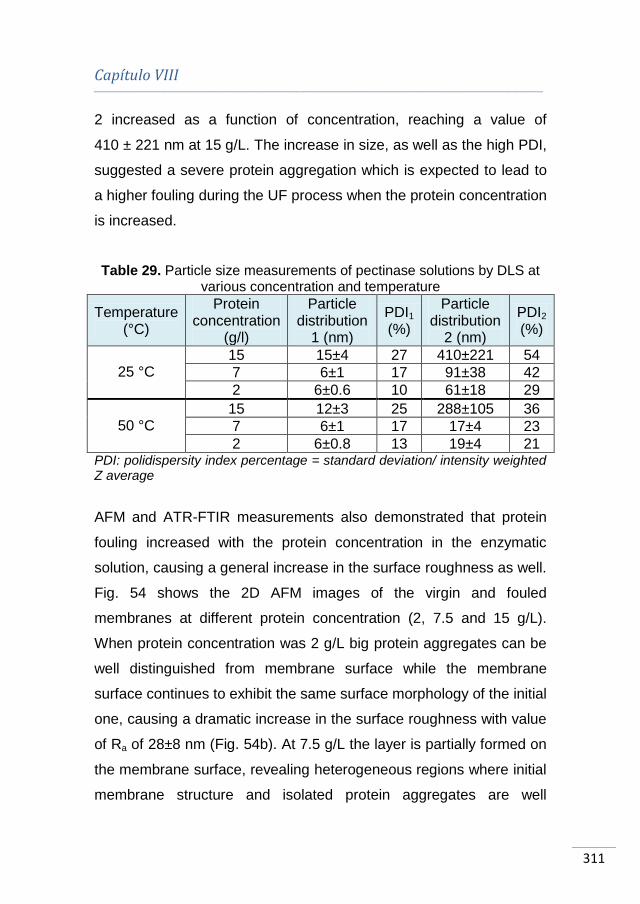
Capítulo VIII ________________________________________________________________________________________________________________________________________________________
311
2 increased as a function of concentration, reaching a value of
410 ± 221 nm at 15 g/L. The increase in size, as well as the high PDI,
suggested a severe protein aggregation which is expected to lead to
a higher fouling during the UF process when the protein concentration
is increased.
Table 29. Particle size measurements of pectinase solutions by DLS at various concentration and temperature
Temperature (°C)
Protein concentration
(g/l)
Particle distribution
1 (nm)
PDI1
(%)
Particle distribution
2 (nm)
PDI2
(%)
25 °C
15 15±4 27 410±221 54
7 6±1 17 91±38 42
2 6±0.6 10 61±18 29
50 °C
15 12±3 25 288±105 36
7 6±1 17 17±4 23
2 6±0.8 13 19±4 21 PDI: polidispersity index percentage = standard deviation/ intensity weighted Z average
AFM and ATR-FTIR measurements also demonstrated that protein
fouling increased with the protein concentration in the enzymatic
solution, causing a general increase in the surface roughness as well.
Fig. 54 shows the 2D AFM images of the virgin and fouled
membranes at different protein concentration (2, 7.5 and 15 g/L).
When protein concentration was 2 g/L big protein aggregates can be
well distinguished from membrane surface while the membrane
surface continues to exhibit the same surface morphology of the initial
one, causing a dramatic increase in the surface roughness with value
of Ra of 28±8 nm (Fig. 54b). At 7.5 g/L the layer is partially formed on
the membrane surface, revealing heterogeneous regions where initial
membrane structure and isolated protein aggregates are well
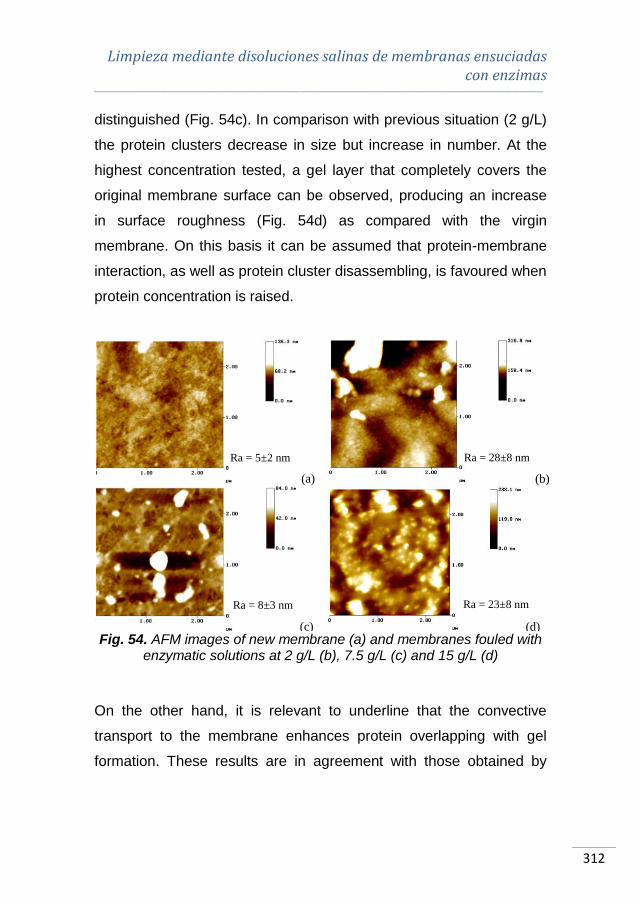
Limpieza mediante disoluciones salinas de membranas ensuciadas con enzimas
________________________________________________________________________________________________________________________________________________________
312
distinguished (Fig. 54c). In comparison with previous situation (2 g/L)
the protein clusters decrease in size but increase in number. At the
highest concentration tested, a gel layer that completely covers the
original membrane surface can be observed, producing an increase
in surface roughness (Fig. 54d) as compared with the virgin
membrane. On this basis it can be assumed that protein-membrane
interaction, as well as protein cluster disassembling, is favoured when
protein concentration is raised.
Fig. 54. AFM images of new membrane (a) and membranes fouled with
enzymatic solutions at 2 g/L (b), 7.5 g/L (c) and 15 g/L (d)
On the other hand, it is relevant to underline that the convective
transport to the membrane enhances protein overlapping with gel
formation. These results are in agreement with those obtained by
(a) (b)
(c) (d)
Ra = 5±2 nm Ra = 28±8 nm
Ra = 8±3 nm Ra = 23±8 nm

Capítulo VIII ________________________________________________________________________________________________________________________________________________________
313
Ohnishi et al. (1998), who demonstrated protein layer was denser at
the highest concentration tested, as it occurs in our work.
ATR-FTIR spectra were collected onto virgin and fouled membranes.
An intense absorption band can be detected at about 1650 cm-1 due
to the stretching vibration of C=Oamide typical of the amide I group
(Fig. 55a). This band becomes more intense for membranes fouled
with solutions at 2 g/L. The broadness of this band along with the
appearance of a strong IR mode at 1504 cm-1, which is typical of a C-
Harom bond, suggests a strong contribution of the aromatic component
to the spectrum due to different rearrangement of the protein
aggregates when binding the membrane surface. Also, at 1168 cm-1
an IR mode associated to C-O-C stretching vibrations appears to be
more intense confirming a different local chemical environment due to
a varied rearrangement of the protein assembling. It is noteworthy
that stretching located at 1620 towards higher frequency suggests
intermolecular β-sheets bonds confirming a protein aggregation state
(Blume et al., 2015; Matheus et al., 2006).
Another diagnostic weak band is observed at around 1730 cm-1,
which corresponds to C=Oester bond. This infrared mode was detected
in the spectra for all the fouled membranes with the same band
intensity, whereas it was never observed in the new membrane
spectrum. It is relevant to underline that the strong IR absorption
bands, which characterize the spectrum of fouled membranes with
2.0 g/L, are due to local adsorption of protein aggregates completely
spanned at higher concentration as confirmed by AFM images (Fig.
54b,d).
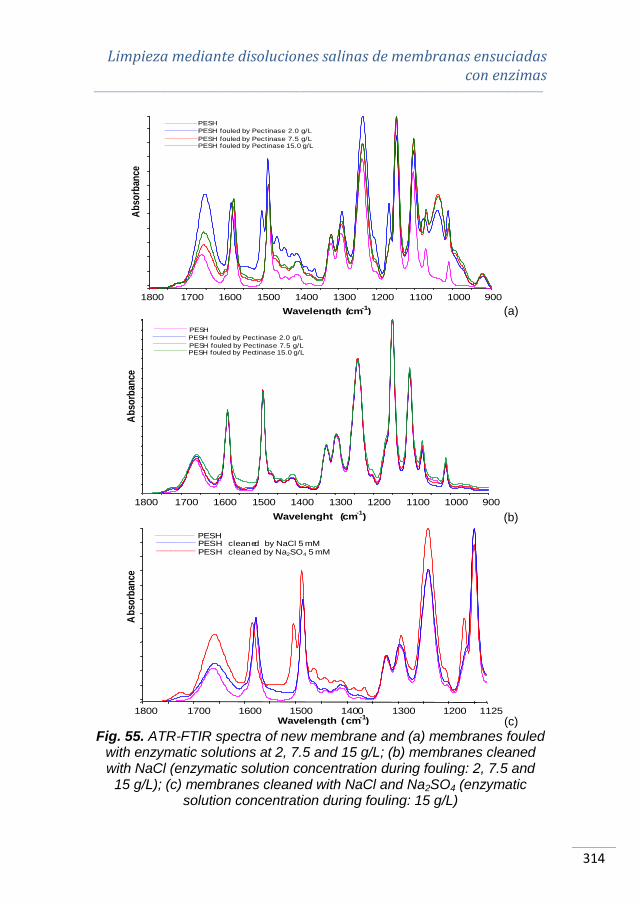
Limpieza mediante disoluciones salinas de membranas ensuciadas con enzimas
________________________________________________________________________________________________________________________________________________________
314
(a)
(b)
(c)
Fig. 55. ATR-FTIR spectra of new membrane and (a) membranes fouled with enzymatic solutions at 2, 7.5 and 15 g/L; (b) membranes cleaned with NaCl (enzymatic solution concentration during fouling: 2, 7.5 and
15 g/L); (c) membranes cleaned with NaCl and Na2SO4 (enzymatic solution concentration during fouling: 15 g/L)
1800 1700 1600 1500 1400 1300 1200 1100 1000 900
Wavelength (cm-1)
Ab
sorb
ance
________ PESH________PESH fouled by Pectinase 2.0 g/L ________
PESH fouled by Pectinase 7.5 g/L________ PESH fouled by Pectinase 15.0 g/L
1800 1700 1600 1500 1400 1300 1200 1100 1000 900
Wavelenght (cm-1
)
Ab
sorb
ance
PESH
PESH fouled by Pectinase 2.0 g/L
PESH fouled by Pectinase 7.5 g/LPESH fouled by Pectinase 15.0 g/L
________
________
________ ________
1800 1700 1600 1500 1400 1300 1200 1125Wavelength (cm
-1)
Ab
sorb
ance
PESH________
PESH cleaned by NaCl 5 mM________
PESH cleaned by Na2SO4 5 mM________
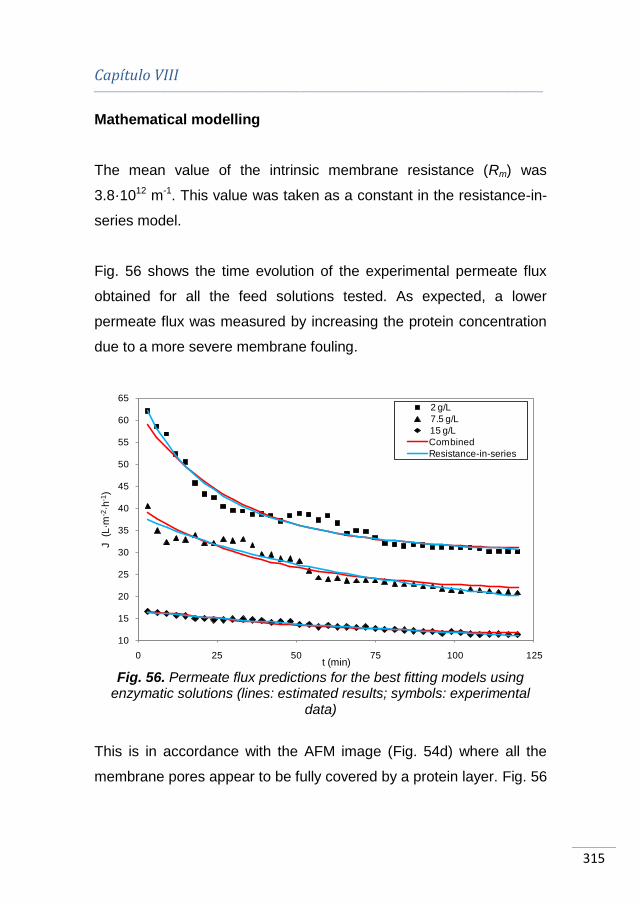
Capítulo VIII ________________________________________________________________________________________________________________________________________________________
315
Mathematical modelling
The mean value of the intrinsic membrane resistance (Rm) was
3.8·1012 m-1. This value was taken as a constant in the resistance-in-
series model.
Fig. 56 shows the time evolution of the experimental permeate flux
obtained for all the feed solutions tested. As expected, a lower
permeate flux was measured by increasing the protein concentration
due to a more severe membrane fouling.
Fig. 56. Permeate flux predictions for the best fitting models using
enzymatic solutions (lines: estimated results; symbols: experimental data)
This is in accordance with the AFM image (Fig. 54d) where all the
membrane pores appear to be fully covered by a protein layer. Fig. 56
10
15
20
25
30
35
40
45
50
55
60
65
0 25 50 75 100 125
J (L
·m-2
·h-1
)
t (min)
2 g/L
7.5 g/L
15 g/L
Combined
Resistance-in-series
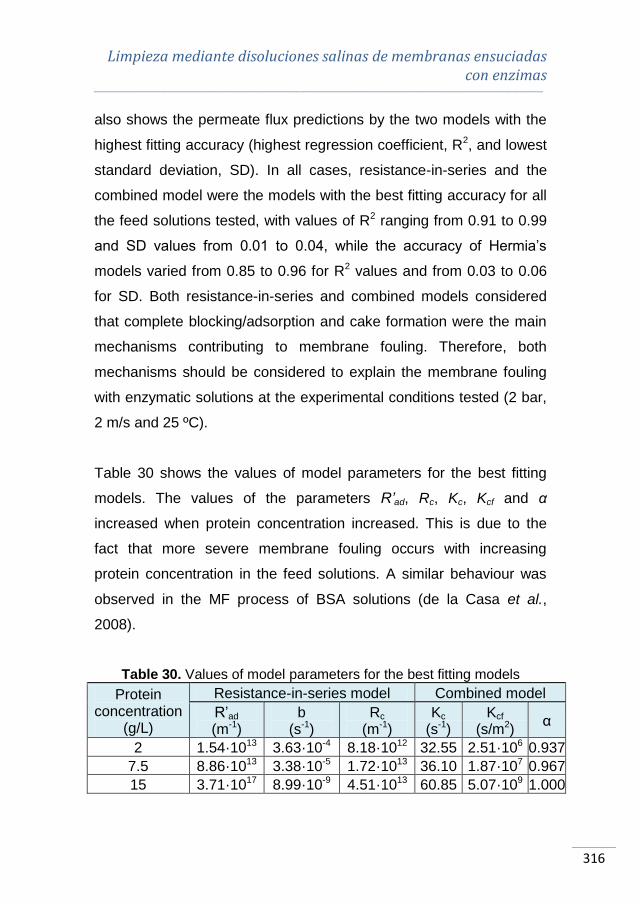
Limpieza mediante disoluciones salinas de membranas ensuciadas con enzimas
________________________________________________________________________________________________________________________________________________________
316
also shows the permeate flux predictions by the two models with the
highest fitting accuracy (highest regression coefficient, R2, and lowest
standard deviation, SD). In all cases, resistance-in-series and the
combined model were the models with the best fitting accuracy for all
the feed solutions tested, with values of R2 ranging from 0.91 to 0.99
and SD values from 0.01 to 0.04, while the accuracy of Hermia’s
models varied from 0.85 to 0.96 for R2 values and from 0.03 to 0.06
for SD. Both resistance-in-series and combined models considered
that complete blocking/adsorption and cake formation were the main
mechanisms contributing to membrane fouling. Therefore, both
mechanisms should be considered to explain the membrane fouling
with enzymatic solutions at the experimental conditions tested (2 bar,
2 m/s and 25 ºC).
Table 30 shows the values of model parameters for the best fitting
models. The values of the parameters R’ad, Rc, Kc, Kcf and α
increased when protein concentration increased. This is due to the
fact that more severe membrane fouling occurs with increasing
protein concentration in the feed solutions. A similar behaviour was
observed in the MF process of BSA solutions (de la Casa et al.,
2008).
Table 30. Values of model parameters for the best fitting models
Protein concentration
(g/L)
Resistance-in-series model Combined model
R’ad (m-1)
b (s-1)
Rc (m-1)
Kc (s-1)
Kcf (s/m2)
α
2 1.54·1013 3.63·10-4 8.18·1012 32.55 2.51·106 0.937
7.5 8.86·1013 3.38·10-5 1.72·1013 36.10 1.87·107 0.967
15 3.71·1017 8.99·10-9 4.51·1013 60.85 5.07·109 1.000
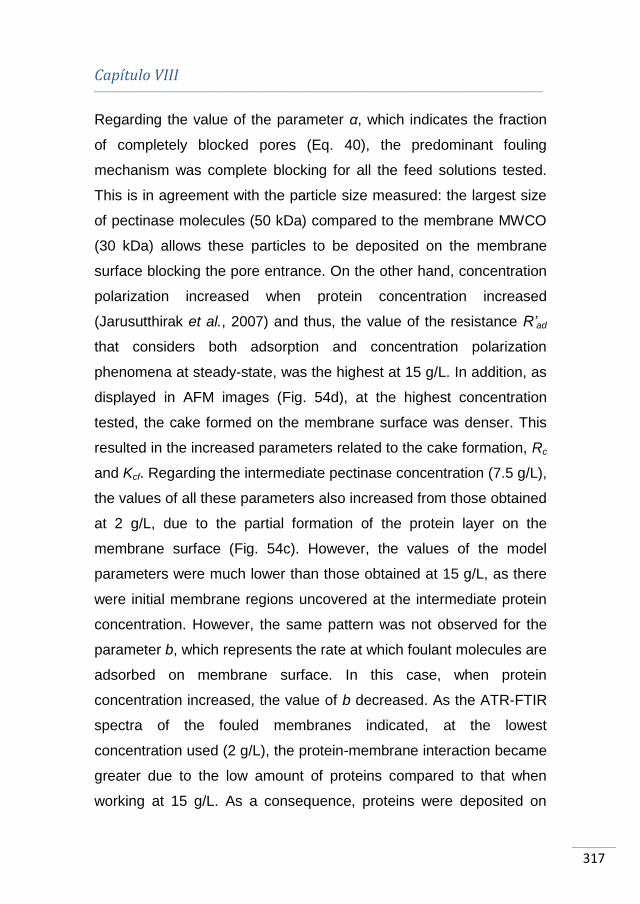
Capítulo VIII ________________________________________________________________________________________________________________________________________________________
317
Regarding the value of the parameter α, which indicates the fraction
of completely blocked pores (Eq. 40), the predominant fouling
mechanism was complete blocking for all the feed solutions tested.
This is in agreement with the particle size measured: the largest size
of pectinase molecules (50 kDa) compared to the membrane MWCO
(30 kDa) allows these particles to be deposited on the membrane
surface blocking the pore entrance. On the other hand, concentration
polarization increased when protein concentration increased
(Jarusutthirak et al., 2007) and thus, the value of the resistance R’ad
that considers both adsorption and concentration polarization
phenomena at steady-state, was the highest at 15 g/L. In addition, as
displayed in AFM images (Fig. 54d), at the highest concentration
tested, the cake formed on the membrane surface was denser. This
resulted in the increased parameters related to the cake formation, Rc
and Kcf. Regarding the intermediate pectinase concentration (7.5 g/L),
the values of all these parameters also increased from those obtained
at 2 g/L, due to the partial formation of the protein layer on the
membrane surface (Fig. 54c). However, the values of the model
parameters were much lower than those obtained at 15 g/L, as there
were initial membrane regions uncovered at the intermediate protein
concentration. However, the same pattern was not observed for the
parameter b, which represents the rate at which foulant molecules are
adsorbed on membrane surface. In this case, when protein
concentration increased, the value of b decreased. As the ATR-FTIR
spectra of the fouled membranes indicated, at the lowest
concentration used (2 g/L), the protein-membrane interaction became
greater due to the low amount of proteins compared to that when
working at 15 g/L. As a consequence, proteins were deposited on
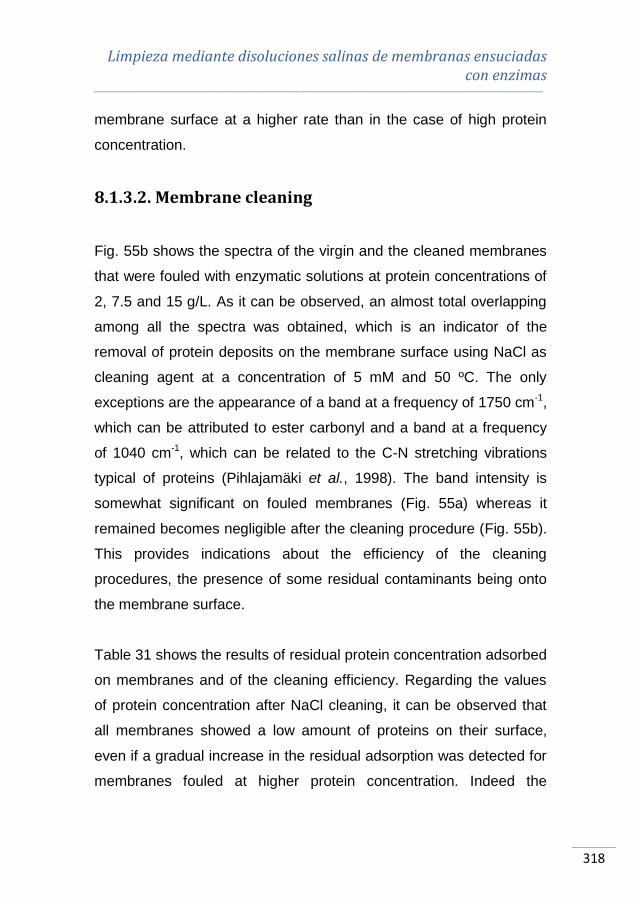
Limpieza mediante disoluciones salinas de membranas ensuciadas con enzimas
________________________________________________________________________________________________________________________________________________________
318
membrane surface at a higher rate than in the case of high protein
concentration.
8.1.3.2. Membrane cleaning
Fig. 55b shows the spectra of the virgin and the cleaned membranes
that were fouled with enzymatic solutions at protein concentrations of
2, 7.5 and 15 g/L. As it can be observed, an almost total overlapping
among all the spectra was obtained, which is an indicator of the
removal of protein deposits on the membrane surface using NaCl as
cleaning agent at a concentration of 5 mM and 50 ºC. The only
exceptions are the appearance of a band at a frequency of 1750 cm-1,
which can be attributed to ester carbonyl and a band at a frequency
of 1040 cm-1, which can be related to the C-N stretching vibrations
typical of proteins (Pihlajamäki et al., 1998). The band intensity is
somewhat significant on fouled membranes (Fig. 55a) whereas it
remained becomes negligible after the cleaning procedure (Fig. 55b).
This provides indications about the efficiency of the cleaning
procedures, the presence of some residual contaminants being onto
the membrane surface.
Table 31 shows the results of residual protein concentration adsorbed
on membranes and of the cleaning efficiency. Regarding the values
of protein concentration after NaCl cleaning, it can be observed that
all membranes showed a low amount of proteins on their surface,
even if a gradual increase in the residual adsorption was detected for
membranes fouled at higher protein concentration. Indeed the
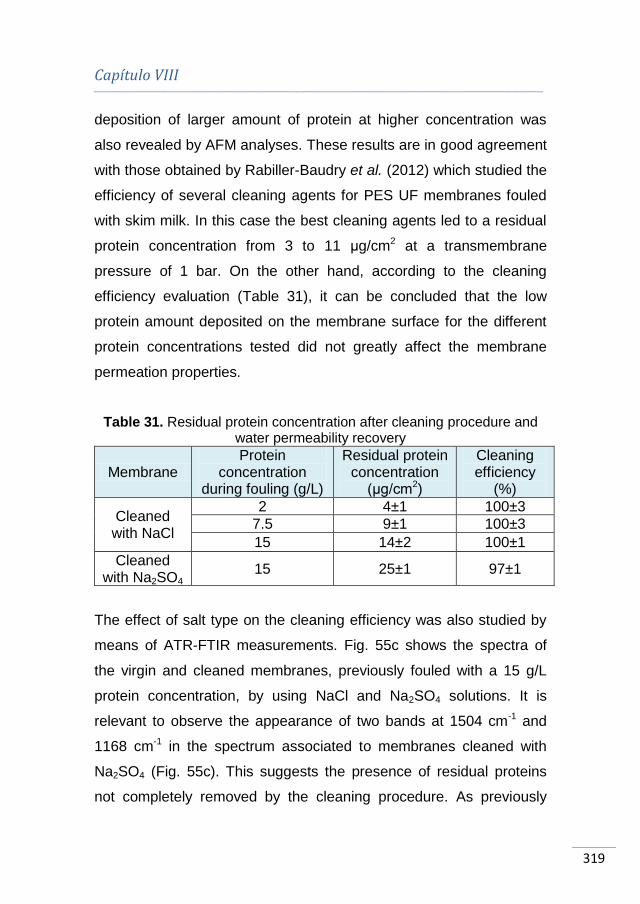
Capítulo VIII ________________________________________________________________________________________________________________________________________________________
319
deposition of larger amount of protein at higher concentration was
also revealed by AFM analyses. These results are in good agreement
with those obtained by Rabiller-Baudry et al. (2012) which studied the
efficiency of several cleaning agents for PES UF membranes fouled
with skim milk. In this case the best cleaning agents led to a residual
protein concentration from 3 to 11 μg/cm2 at a transmembrane
pressure of 1 bar. On the other hand, according to the cleaning
efficiency evaluation (Table 31), it can be concluded that the low
protein amount deposited on the membrane surface for the different
protein concentrations tested did not greatly affect the membrane
permeation properties.
Table 31. Residual protein concentration after cleaning procedure and water permeability recovery
Membrane Protein
concentration during fouling (g/L)
Residual protein concentration
(μg/cm2)
Cleaning efficiency
(%)
Cleaned with NaCl
2 4±1 100±3
7.5 9±1 100±3
15 14±2 100±1
Cleaned with Na2SO4
15 25±1 97±1
The effect of salt type on the cleaning efficiency was also studied by
means of ATR-FTIR measurements. Fig. 55c shows the spectra of
the virgin and cleaned membranes, previously fouled with a 15 g/L
protein concentration, by using NaCl and Na2SO4 solutions. It is
relevant to observe the appearance of two bands at 1504 cm-1 and
1168 cm-1 in the spectrum associated to membranes cleaned with
Na2SO4 (Fig. 55c). This suggests the presence of residual proteins
not completely removed by the cleaning procedure. As previously

Limpieza mediante disoluciones salinas de membranas ensuciadas con enzimas
________________________________________________________________________________________________________________________________________________________
320
described, these two bands indicate a different protein rearrangement
on the membrane surface at lower protein concentration. Indeed, the
spectrum is comparable to that recorded onto membranes fouled with
2 g/L pectinase (Fig. 55a). In addition, the shift of the infrared mode
located around 1620 cm-1 towards higher frequency suggests a
contribution of the band usually assigned to intermolecular β-sheets
bonds, well known as “aggregation band” (Blume et al., 2015;
Matheus et al., 2006). This shift is also observable for membranes
coming in contact with 2 g/L pectinase solution (Fig. 55a).
The residual protein concentration quantified from the ATR-FTIR
spectrum was calculated for the Na2SO4 cleaning protocol (Table 31).
In this table, the greatest amount of protein deposited on the
membrane surface after cleaning procedure was obtained with
Na2SO4 (24.68 μg/cm2) and the cleaning efficiency was slightly lower
than those obtained when NaCl was used as cleaning agent.
The different cleaning efficiency obtained with the two salt solutions
can be ascribed to salting-in and salting-out mechanisms. Na2SO4
showed a strong salting-out effect and enhanced protein aggregation
and adsorption according to Tsumoto et al. (2007). In addition, SO42-
exhibits a salting-out effect higher than Cl-, causing a protein
precipitation. This is due to the different ability of anions to interact
with water molecules (Curtis and Lue, 2008). According to the law of
matching water affinities, monovalents anions (as Cl-) are weakly
hydrated because they have a larger size than monovalent cations
and they preferably interact with the positive-charged side chains of
proteins and with the non-polar functional groups that are weakly
Capítulo VIII ________________________________________________________________________________________________________________________________________________________
321
hydrated as well (Zhang, 2012). This behaviour was also observed in
a previous study about salt cleaning of membranes fouled with whey
model solutions (Corbatón-Báguena et al., 2014b), in which similar
efficiencies to those reported in Table 31 after the cleaning procedure
were achieved.
On the basis of these experimental findings, DLS analyses were also
performed in order to evaluate the combined effect of NaCl and
temperature on protein aggregates destabilization/solubilisation. As it
can be observed in Table 29 membrane cleaning with NaCl at 50 °C
led to an additional protein aggregates destabilization that enhances
salting-in effects. In particular, when the temperature was increased
from 25 °C to 50 °C, with and without NaCl, the changes in size
observed for the particles belonging to both the first and second
distribution were statistically significant (p-values lower than 0.05),
while a big effect of particle decrease is observed for the distribution
2. This effect demonstrated that the distribution 2 is characterized by
big aggregates that, thanks to a temperature effect, are destabilized.
In addition, for what concerns particles belonging to distribution 1, any
substantial change is observed both increasing temperature and in
presence of NaCl (5mM), but a greater change in size is observed for
particles belonging to distribution 2. In this last case, the combination
of NaCl and temperature (50 ºC) resulted in a decrease in particle
size from 288 to 240 nm. At higher temperature protein hydration is
favoured. This means that protein-water bonds are predominant,
causing solubilisation of protein aggregates. In the presence of NaCl,
protein-protein interactions are further broken due to salting-in effects,
Limpieza mediante disoluciones salinas de membranas ensuciadas con enzimas
________________________________________________________________________________________________________________________________________________________
322
thus promoting higher hydration shell (Tsumoto et al., 2007; Zhang et
al., 2012).
8.1.4. Conclusions
Fouling experiments performed with enzymatic solutions of
pectinases at different protein concentrations (2, 7.5 and 15 g/L)
demonstrated that a higher protein concentration caused a more
severe UF membrane fouling. AFM images as well as ATR
measurements carried out on the virgin and fouled membranes
confirmed that a continuous protein layer was formed on the
membrane surface when a concentration of 15 g/L was used.
The mathematical models studied in this work predicted with high
accuracy the experimental permeate flux decline corresponding to the
UF of enzymatic solutions of pectinases at different protein
concentration (2, 7.5 and 15 g/L), 2 bar and 2 m/s. The Hermia’s
standard blocking model did not fit well the experimental data since
the solute molecules size was larger than the membrane pore size
and thus, these molecules cannot penetrate inside the membrane
pores. Adversely, the models that showed the best fitting accuracy
were the combined model and the resistance-in-series, one of which
suggested a predominant pore blocking/adsorption mechanism,
followed by a cake formation.
Among the salts tested, NaCl showed better results than Na2SO4 due
to a better ability to dissolve proteins from membrane surface for
Capítulo VIII ________________________________________________________________________________________________________________________________________________________
323
salting-in effect. The cleaning efficiency of NaCl in combination with
temperature was also investigated by DLS experiments, thus
confirming a cooperation of the two parameters in the protein
aggregates destabilization. The cleaning efficiency was investigated
through water permeability measurements. Although some residual
contaminants were still present after cleaning with NaCl solution, the
initial permeability value was completely restored. The suitability and
reliability of the cleaning procedure with NaCl was confirmed with
other protein solutions (whey model solutions), achieving similar
cleaning efficiencies.
Acknowledgements
María-José Corbatón-Báguena wishes to gratefully acknowledge the
financial support from the Spanish Ministry of Economy and
Competitiveness through the grant EEBB-I-14-09011 (project
CTM2010-20186). The authors acknowledge the European Union,
Fondo Europeo di Sviluppo Regionale, The Ministero dell'Istruzione,
dell'Università e della Ricerca - MIUR, The Ministero dello Svilupppo
Economico - MSE - for the financial support to the project “Sistemi
tecnologici avanzati e processi integrati della filiera olivicola per la
valorizzazione dei prodotti e dei sottoprodotti, lo sviluppo di nuovi
settori e la creazione di sistemi produttivi Eco-compatibili” (PON Olio
Più, PON01_01545), within the framework PON Ricerca e
Competitività 2007-2013.
Limpieza mediante disoluciones salinas de membranas ensuciadas con enzimas
________________________________________________________________________________________________________________________________________________________
324
8.2. BIBLIOGRAFÍA
ALCHEIKHHAMDON A.A., DARWISH N.A. y HILAL N. (2015).
“Statistical analysis of air-gap membrane desalination experimental
data: Hypothesis testing” en Desalination, vol. 362, p. 117-125.
BLANPAIN-AVET P., MIGDAL J.F. y BÉNÉZECH T. (2009).
“Chemical cleaning of a tubular ceramic microfiltration membrane
fouled with a whey protein concentrate suspension – characterization
of hydraulic and chemical cleanliness” en Journal of Membrane
Science, vol. 337, p. 153-174.
BLUME K. et al. (2015). “Exploring the relationship between protein
secondary structures, temperature-dependent viscosities, and
technological treatments in egg yolk and LDL by FTIR and rheology”
en Food Chemistry, vol. 173, p. 584-593.
CARRÈRE H., BLASZKOW F. y ROUX DE BALMANN H. (2001).
“Modelling the clarification of lactic acid fermentation broths by cross-
flow microfiltration” en Journal of Membrane Science, vol. 186, p.
219-230.
CASSANO A., MARCHIO M. y DRIOLI E. (2007). “Clarification of
blood orange juice by ultrafiltration: analyses of operating parameters,
membrane fouling and juice quality” en Desalination, vol. 212, p. 15-
27.
CHOI S-W. et al. (2000). “Modeling of the permeate flux during
microfiltration of BSA-adsorbed microspheres in a stirred cell” en
Journal of Colloid and Interface Science, vol. 228, p. 270-278.
CORBATÓN-BÁGUENA M.J., ÁLVAREZ-BLANCO S. y VINCENT-
VELA M.C. (2014a). “Cleaning of ultrafiltration membranes fouled
Capítulo VIII ________________________________________________________________________________________________________________________________________________________
325
with BSA by means of saline solutions” en Separation and Purification
Technology, vol. 125, p. 1-10.
CORBATÓN-BÁGUENA M.J., ÁLVAREZ-BLANCO S. y VINCENT-
VELA M.C. (2014b). “Salt cleaning of ultrafiltration membranes fouled
by whey model solutions” en Separation and Purification Technology,
vol. 132, p. 226-233.
CURTIS R.A. y LUE L. “A molecular approach to bioseparations:
protein-protein and protein-salt interactions” en Chemical Engineering
Science, vol. 61, p. 907-923.
DE BARROS S.T.D. et al. (2003). “Study of fouling mechanism in
pineapple juice clarification by ultrafiltration” en Journal of Membrane
Science, vol. 215, p. 213-224.
DE BARTOLO L. et al. (2004). “Novel PEEK-WC membranes with
low plasma protein affinity related to surface free energy parameters”
en Journal of Materials Science: Materials in Medicine, vol. 15, p.
877-883.
DE LA CASA E.J. et al. (2008). “A combined fouling model to
describe the influence of the electrostatic environment on the cross-
flow microfiltration of BSA” en Journal of Membrane Science, vol.
318, p. 247-254.
DE LUCA G., GUGLIUZZA A. y DRIOLI E. (2009). “Competitive
hydrogen-bonding interactions in modified polymer membranes: A
density functional theory investigation” en Journal of Physical
Chemistry B, vol. 113, p. 5473-5477.
FIELD R.W. et al. (1995). “Critical flux concept for microfiltration
fouling” en Journal of Membrane Science, vol. 100, p. 259–272.
GEBREYOHANNES A.Y. et al. (2013). “Study on the in situ
enzymatic self-cleansing of microfiltration membrane for valorization
Limpieza mediante disoluciones salinas de membranas ensuciadas con enzimas
________________________________________________________________________________________________________________________________________________________
326
of olive mill wastewater” en Industrial & Engineering Chemistry
Research, vol. 52, p. 10396-10405.
HERMIA J. (1982). “Constant pressure blocking filtration laws –
application to powerlaw non-newtonian fluids” en Trans IChemE, vol.
60, p. 183-187.
HO C-C. y ZYDNEY A.L. (2000). “A combined pore blockage and
cake filtration model for protein fouling during microfiltration” en
Journal of Colloid and Interface Science, vol. 232, p. 389-399.
JARUSUTTHIRAK C., MATTARAJ S. y JIRARATANANON R. (2007).
“Influence of inorganic scalants and natural organic matter on
nanofiltration membrane fouling” en Journal of Membrane Science,
vol. 287, p. 138-145.
JAYANI R.S., SAXENA S. y GUPTA R. (2005). “Microbial pectinolytic
enzymes: A review” en Process Biochemistry, vol.40, p. 2931-2944.
KRIEG R.C. et al. (2005). “Protein quantification and its tolerance for
different interfering reagents using the BCA-method with regard to 2D
SDS PAGE” en Journal of Biochemical and Biophysical Methods, vol.
65, p. 13-19.
LEE S. y ELIMELECH M. (2007). “Salt cleaning of organic-fouled
reverse osmosis membranes” en Water Research, vol. 41, p. 1134-
1142.
LUO J. et al. (2013). “Fouling-induced enzyme immobilization for
membrane reactors” en Bioresource Technology, vol. 147, p. 260-
268.
MACHADO R.M.D. et al. (2012). “Effect of enzymatic treatment on
the cross-flow microfiltration of açaí pulp: Analysis of the fouling and
recovery of phytochemicals” en Journal of Food Engineering, vol.
113, p. 442-452.
Capítulo VIII ________________________________________________________________________________________________________________________________________________________
327
MATHEUS S., MAHLER H.C. y FRIESS W. (2006). “A critical
evaluation of T-m (FTIR) measurements of high-concentration IgG(1)
antibody formulation development tool” en Pharmaceutical Research,
vol. 23, p. 1617-1627.
MATTISON K.W. y KASZUBA M. (2004). “Automated protein
characterization” en American Biothecnology Laboratory, vol. 22, p.
8-11.
MATZINOS P. y ÁLVAREZ R. (2002). “Effect of ionic strength on
rinsing and alkaline cleaning of ultrafiltration inorganic membranes
fouled with whey proteins” en Journal of Membrane Science, vol. 208,
p. 23-20.
MAZZEI R., DRIOLI E. Y GIORNO L. (2010). “Membranes and
Membrane Bioreactors” en Drioli E., Giorno L. Comprehensive
Membrane Science and Engineering. Reino Unido: Academic Press.
MORTON R.E. y EVANS T.A. (1992). “Modification of the
bicinchoninic acid protein assay to eliminate lipid interference in
determining lipoprotein protein content” en Analytic Biochemistry, vol.
204, p. 332-334.
MUTHUKUMARAN S. et al. (2004). “The use of ultrasonic cleaning
for ultrafiltration membranes in the dairy industry” en Separation and
Purification Technology, vol. 39, p. 99-107.
OGUNBIYI O.O., MILES N.J. y HILAL N. (2008). “The effects of
performance and cleaning cycles of new tubular ceramic
microfiltration membrane fouled with a model yeast suspension” en
Desalination, vol. 220, p. 273-289.
OHNISHI S., MURATA M. y HATO M. (1998). “Correlation between
surface morphology and surface forces of protein A adsorbed on
mica” en Biophysical Journal, vol. 74, p. 455-465.
Limpieza mediante disoluciones salinas de membranas ensuciadas con enzimas
________________________________________________________________________________________________________________________________________________________
328
PIHLAJAMÄKI A., VÄISÄNEN P. y NYSTRÖM M. (1998).
“Characterization of clean and fouled polymeric ultrafiltration
membranes by Fourier transform IR spectroscopy-attenuated total
reflection” en Colloids Surfaces A: Physicochemical Engineering
Aspects, vol. 138, p. 323-333.
RABILLER-BAUDRY M. et al. (2008). “A dual approach of membrane
cleaning based on physic-chemistry and hydrodynamics. Application
to PES membrane of dairy industry” en Chemical Engineering and
Processing, vol. 47, p. 267-275.
RABILLER-BAUDRY M. et al. (2012). “Coupling of SEM-EDX and
FTIR-ATR to (quantitatively) investigate organic fouling on porous
organic and composite membranes” en Méndez-Vilas A. Current
Microscopy Contributions to Advances in Science and Technology.
Badajoz: Formatex.
RAMÍREZ H.L. et al. (2013). “Immobilization of pectinase by
adsorption on an alginate-coated chitin support” en Biotecnología
Aplicada, vol. 30, p. 101-104.
SCHULTZ N. et al. (2008). “Zeta potential measurement as a
diagnostic tool in enzyme immobilization” en Colloids Surface B:
Biointerfaces, vol. 66, p. 39-44.
TARAZAGA C.C., CAMPDERRÓS M.E. y PÉREZ-PADILLA A.
(2006). “Physical cleaning by means of electric field in the
ultrafiltration of a biological solution” en Journal of Membrane
Science, vol. 278-p. 219-224.
TSUMOTO K. et al. (2007). “Effects of salts on protein-surface
interactions: Applications for column chromatography” en Journal of
Pharmaceutical Science, vol. 96, p. 1677-1690.
Capítulo VIII ________________________________________________________________________________________________________________________________________________________
329
VINCENT VELA M.C. et al. (2009). “Analysis of membrane pore
blocking models adapted to crossflow ultrafiltration in the ultrafiltration
of PEG” en Chemical Engineering Journal, vol. 149, p. 232-241.
YUA L. et al. (2013). “Adaptive hydrophobic and hydrophilic
interactions of mussel foot proteins with organic thin films” en
Proceedings of the National Academy of Sciences, vol. 110, p.
15680-15685.
ZHANG F. et al. (2012). “Hydration and interactions in protein
solutions containing concentrated electrolytes studied by small-angle
scattering” en Physical Chemistry Chemical Physics, vol. 14, p. 2483-
2493.
ZHANG J. (2012). “Protein-protein interactions in salt solutions” en
Cai W. y Hong H. Protein-protein interactions – Computational and
experimental tools. Intech.

Limpieza de
membranas mediante
campos eléctricos


Limpieza de membranas mediante campos eléctricos ________________________________________________________________________________________________________________________________________________________
332
9.1. LIMPIEZA DE MEMBRANAS DE
ULTRAFILTRACIÓN ENSUCIADAS CON
DISOLUCIONES MODELO DE LACTOSUERO
El presente Capítulo constituye una adaptación al formato de la Tesis
Doctoral del artículo titulado “Application of electric fields to clean
ultrafiltration membranes fouled with whey model solutions”, en
revisión en la revista Separation and Purification Technology. En él
se investiga la eficacia del proceso de limpieza de membranas de UF
ensuciadas con disoluciones modelo de lactosuero y limpiadas
mediante la aplicación de un método físico (campos eléctricos). Para
ello, se utilizaron membranas cerámicas de 15 y 50 kDa ensuciadas
con BSA, BSA con CaCl2 y WPC. Además, se estudió la influencia de
las condiciones de operación durante la etapa de limpieza
(concentración de NaCl, temperatura y potencial de campo eléctrico
aplicado), sobre la eficacia hidráulica del proceso de limpieza. Los
datos bibliográficos del artículo se destacan a continuación:
Autores: M.-J. Corbatón-Báguena, S. Álvarez-Blanco, M.-C.
Vincent-Vela, E. Ortega-Navarro, V. Pérez-Herranz
Título: Application of electric fields to clean ultrafiltration
membranes fouled with whey model solutions
Editorial: Elsevier
Revista: en revisión en Separation and Purification Technology
Doi:

Capítulo IX ________________________________________________________________________________________________________________________________________________________
333
Application of electric fields to clean ultrafiltration
membranes fouled with whey model solutions
María-José Corbatón-Báguena1, Silvia Álvarez-Blanco1, María-Cinta
Vincent-Vela1, Emma Ortega-Navarro2, Valentín Pérez-Herranz2
1Institute for Industrial, Radiophysical and Environmental Safety,
Department of Chemical and Nuclear Engineering, Universitat
Politècnica de València, C/Camino de Vera s/n 46022 Valencia,
Spain
2IEC Group, Departament d’Enginyeria Química i Nuclear, Universitat
Politècnica de València, C/Camino de Vera s/n 46022 Valencia,
Spain
*Corresponding author: [email protected]
Tel: +34963879630 (Ext.: 796383)
Fax: +34963877639 (Ext.: 77639)
Abstract
In this work, the effectiveness of electric fields to clean two ZrO2-TiO2
ultrafiltration (UF) membranes fouled with three types of whey model
solutions was investigated. Membranes tested had different molecular
weight cut-offs (MWCOs) (15 and 50 kDa). Whey model solutions
consisted of aqueous solutions of bovine serum albumin (BSA) at
10 g·L-1, a mixture of BSA (10 g·L-1) and CaCl2 (1.65 g·L-1) and whey
protein concentrate (WPC) (total protein content 45 %) solutions at

Limpieza de membranas mediante campos eléctricos ________________________________________________________________________________________________________________________________________________________
334
different concentrations (22.2, 33.3 and 150.0 g·L-1). The hydraulic
cleaning efficiency (HCE) achieved by means of the application of the
electric fields was evaluated as a function of the membrane MWCO
and the operating conditions of the cleaning technique (applied
potential, temperature of the cleaning solution and concentration of
NaCl). The results demonstrated that the presence of NaCl favoured
the removal of protein deposits on the membrane layer. On the other
hand, the higher the temperature of the cleaning solution and the
applied potential were, the higher HCE was achieved. Regarding the
membrane MWCO, the permselective properties of the 15 kDa
membrane were completely recovered after the cleaning procedure
by electric field for all the feed fouling solutions tested, whereas this
technique could not completely remove the protein deposits on the
50 kDa membrane when BSA solutions were used as feed.
Keywords: Ultrafiltration; membrane cleaning; electric fields; whey
model solutions.
9.1.1. Introduction
Ultrafiltration (UF) is one of the most widely used techniques in dairy
industries to dehydrate milk, concentrate whey and fractionate and
purify proteins (Ogunbiyi et al., 2008; Kazemimoghadam and
Mohammadi, 2007). However, the implementation of membrane
separation processes at industrial scale has a major limitation:
membrane fouling. This drawback is due to the combination of
several phenomena, such as concentration polarization, pore
blocking or cake formation, among others (Zumbusch et al., 1998).
Capítulo IX ________________________________________________________________________________________________________________________________________________________
335
In dairy industries, proteins are one of the compounds mainly
responsible for membrane fouling, because they can be deposited on
membrane surface and also, be adsorbed inside the membrane
porous structure (Almécija et al., 2009). In addition, when whey and
WPC solutions are ultrafiltered, the salts presented in these solutions
(especially calcium salts) can act as binding agents between proteins,
favouring their aggregation and accumulation onto the membrane
surface (Ang and Elimelech, 2007). In order to minimize membrane
fouling, several researchers have investigated the interaction among
proteins, between proteins and membranes and also, protein-
inorganic compounds interactions (Almécija et al., 2009; Ang and
Elimelech, 2007; Mo et al., 2008). Other authors studied different
pretreatments focused on increasing protein solubility and limiting
salt-protein bridging during the UF process (Adams et al., 2013).
Since pretreating the feed solutions used during the UF may not be
enough to completely avoid membrane fouling, membranes have to
be cleaned to remove the foulant deposits and restore their initial
permeation properties. The conventional cleaning protocol employed
when treating dairy solutions includes an alkali cleaning step followed
by an acid cleaning stage. If this cleaning procedure cannot
completely remove the protein deposits, a subsequent cleaning step
using sodium hypochlorite or sodium dodecyl sulphate can be carried
out (Ogunbiyi et al., 2008; Kazemimoghadam and Mohammadi, 2007;
Almécija et al., 2009). However, as these procedures may be
performed even once per day in dairy industries (Blanpain-Avet et al.,
2009), the abovementioned conventional cleaning agents may
damage the membranes, reducing their lifetime and causing
Limpieza de membranas mediante campos eléctricos ________________________________________________________________________________________________________________________________________________________
336
morphological modifications. In addition, the discharge of these
chemicals as wastewaters results in a negative environmental impact.
For all these reasons, during the last years several researchers have
focused their studies on the development and implementation of non
conventional cleaning techniques, for instance, ultrasounds
(Muthukumaran et al., 2007), saline solutions (Lee and Elimelech,
2007; Corbatón-Báguena 2014b) or electric fields.
This last technique, the application of electric fields, has been used
by other authors to improve permeate flux during the UF of different
feed solutions. They demonstrated that the total hydraulic resistance
achieved at the end of this process is reduced and concentration
polarization is minimized (Zumbusch et al., 1998; Tarazaga et al.,
2006; Song et al., 2010; Holder et al., 2013). This technique is based
on two electrokinetic phenomena: on one hand, the charged particles
move towards the electrode with opposite sign when the electric field
is applied (electrophoresis) and, on the other hand, a liquid (usually
water, as most of the times aqueous solutions are ultrafiltered) is
forced to move to a charged surface (for example, the membrane
pores), which is known as electro-osmosis. Both effects,
electrophoresis and electro-osmosis, are achieved by placing two
electrodes at both sides of the membrane or using only one
electrode, being the membrane the other one. This last case is very
often used in the case of ceramic membranes, as they are made of
electrically conductive materials (Shi et al., 2014).
Capítulo IX ________________________________________________________________________________________________________________________________________________________
337
Zumbusch et al. (1998) investigated the utilization of alternating
electrical fields to reduce membrane fouling during the UF of
biological suspensions and studied the effect of several operating
conditions (field strength, protein concentration and conductivity) on
fouling decrease. Although both direct and alternating current can be
used, the former is suitable only when the particles in the feed fouling
solution have a uniform charge. They reported that high field strength
and an increase in conductivity up to the limiting electrolytic current
led to a more effective cleaning procedure. However, the increase in
protein concentration reduced the effect of the electric field applied.
Tarazaga et al. (2006) used electric field pulses of 2-3 min to restore
the initial membrane permeate flux during the filtration of bovine
plasma at a concentration of 0.5 %w/w at a pH of 7.8. They applied
three different potentials (10, 15 and 30 V) and demonstrated that the
higher the electric potential was, the greater the permeate flux was
after the electric pulses. Holder et al. (2013) investigated the effect of
electric fields on the fractionation of bio-functional peptides from
micellar casein hydrolysate. After the UF experiments, these authors
reversed the polarity of the electrodes in order to study the
effectiveness of electric fields to clean the membranes. They
indicated that this technique was able to completely remove some
peptides deposited on membrane surfaces because Van der Waals
forces also influenced the fouling process.
Although there are several works available in the literature focused on
the application of electric fields, they applied electric pulses during the
feed solution filtration to recover the permeate flux once it decreased
up to a certain value or to minimize the concentration polarization
Limpieza de membranas mediante campos eléctricos ________________________________________________________________________________________________________________________________________________________
338
phenomenon. However, only a few papers deal with the application of
this technique during the cleaning step, i.e. after the membrane was
fouled by the feed solution treatment (Holder et al., 2013). The main
goal of this work is to evaluate the effectiveness of a physical
cleaning procedure based on the application of electric fields to clean
membranes previously fouled with whey model solutions. In addition,
the effect of different cleaning operating conditions, such as applied
potential, temperature of the cleaning solution and concentration of
NaCl used as electrolyte, on the efficiency of the cleaning procedure
was determined. The novelty of this work lies in the application of the
electric fields during the cleaning step in order to remove the
irreversible fouling caused on the membranes and not during the
fouling stage as other authors reported to minimize fouling and the
concentration polarization phenomena (Tarazaga et al., 2006; Sarkar
et al., 2009).
9.1.2. Materials and methods
9.1.2.1. Chemicals
Whey model solutions used during the fouling step consisted of BSA
(10 g·L-1), BSA (10 g·L-1) with CaCl2 (1.65 g·L-1) and WPC (22.2, 33.3
and 150.0 g·L-1) aqueous solutions. As these products were supplied
in powder form, a certain amount was weighted and dissolved in
deionized water until the desired concentration was achieved. Renylat
WPC solutions were supplied by Industrias Lácteas Asturianas S.A.
(Spain), BSA (lyophilized powder after heat shock fractionation, 98 %
purity, A3733) was provided by Sigma-Aldrich (Germany) and CaCl2
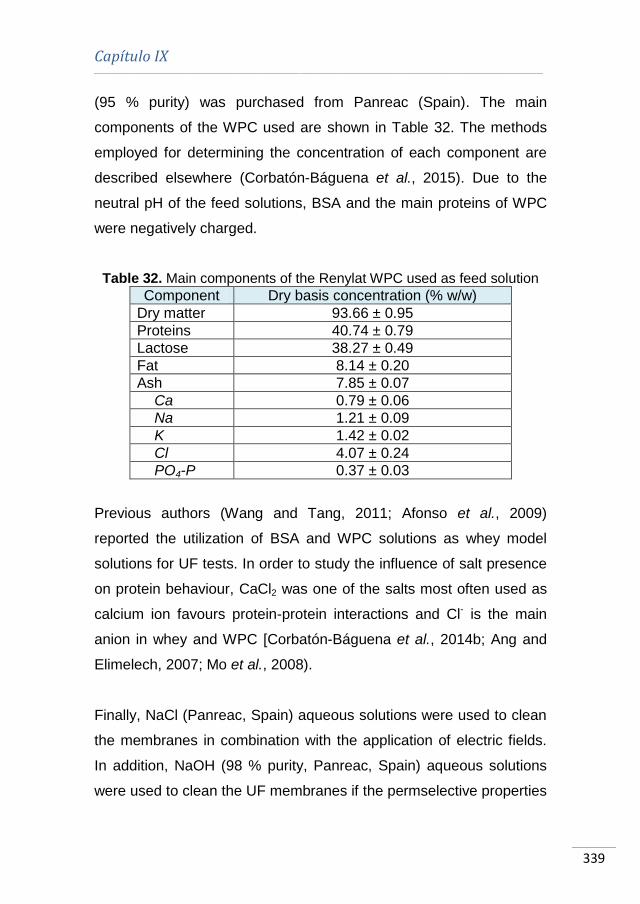
Capítulo IX ________________________________________________________________________________________________________________________________________________________
339
(95 % purity) was purchased from Panreac (Spain). The main
components of the WPC used are shown in Table 32. The methods
employed for determining the concentration of each component are
described elsewhere (Corbatón-Báguena et al., 2015). Due to the
neutral pH of the feed solutions, BSA and the main proteins of WPC
were negatively charged.
Table 32. Main components of the Renylat WPC used as feed solution
Component Dry basis concentration (% w/w)
Dry matter 93.66 ± 0.95
Proteins 40.74 ± 0.79
Lactose 38.27 ± 0.49
Fat 8.14 ± 0.20
Ash 7.85 ± 0.07
Ca 0.79 ± 0.06
Na 1.21 ± 0.09
K 1.42 ± 0.02
Cl 4.07 ± 0.24
PO4-P 0.37 ± 0.03
Previous authors (Wang and Tang, 2011; Afonso et al., 2009)
reported the utilization of BSA and WPC solutions as whey model
solutions for UF tests. In order to study the influence of salt presence
on protein behaviour, CaCl2 was one of the salts most often used as
calcium ion favours protein-protein interactions and Cl- is the main
anion in whey and WPC [Corbatón-Báguena et al., 2014b; Ang and
Elimelech, 2007; Mo et al., 2008).
Finally, NaCl (Panreac, Spain) aqueous solutions were used to clean
the membranes in combination with the application of electric fields.
In addition, NaOH (98 % purity, Panreac, Spain) aqueous solutions
were used to clean the UF membranes if the permselective properties
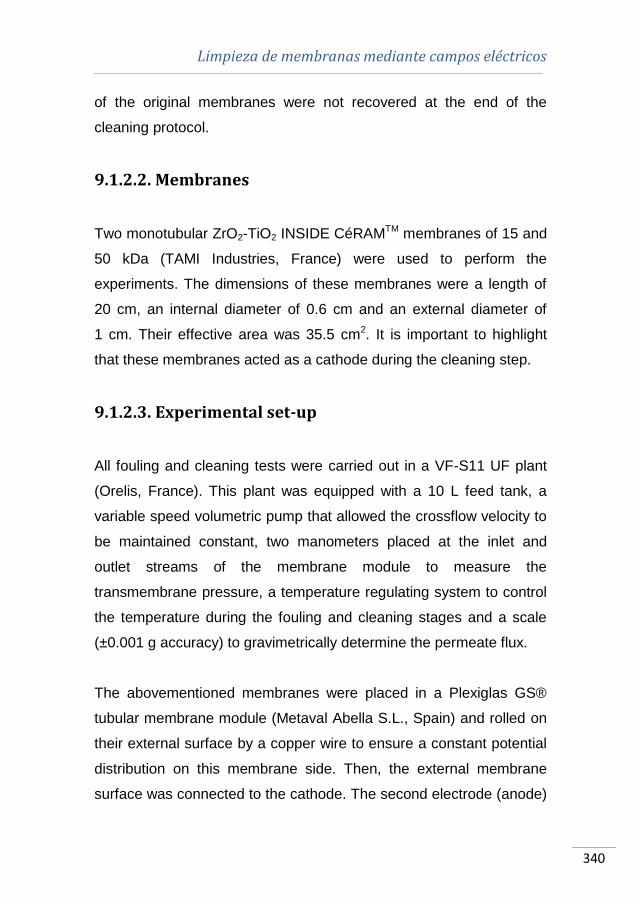
Limpieza de membranas mediante campos eléctricos ________________________________________________________________________________________________________________________________________________________
340
of the original membranes were not recovered at the end of the
cleaning protocol.
9.1.2.2. Membranes
Two monotubular ZrO2-TiO2 INSIDE CéRAMTM membranes of 15 and
50 kDa (TAMI Industries, France) were used to perform the
experiments. The dimensions of these membranes were a length of
20 cm, an internal diameter of 0.6 cm and an external diameter of
1 cm. Their effective area was 35.5 cm2. It is important to highlight
that these membranes acted as a cathode during the cleaning step.
9.1.2.3. Experimental set-up
All fouling and cleaning tests were carried out in a VF-S11 UF plant
(Orelis, France). This plant was equipped with a 10 L feed tank, a
variable speed volumetric pump that allowed the crossflow velocity to
be maintained constant, two manometers placed at the inlet and
outlet streams of the membrane module to measure the
transmembrane pressure, a temperature regulating system to control
the temperature during the fouling and cleaning stages and a scale
(±0.001 g accuracy) to gravimetrically determine the permeate flux.
The abovementioned membranes were placed in a Plexiglas GS®
tubular membrane module (Metaval Abella S.L., Spain) and rolled on
their external surface by a copper wire to ensure a constant potential
distribution on this membrane side. Then, the external membrane
surface was connected to the cathode. The second electrode (anode)

Capítulo IX ________________________________________________________________________________________________________________________________________________________
341
consisted of a titanium electrode with an iridium coating (MAGNETO
Special Anodes B.V., The Netherlands). The anode was placed inside
the membrane, crossing it along the tubular channel. Both cathode
and anode were connected to a direct current supplier (Konstanter
SSP, Gossen, Germany). It is important to highlight that both
electrodes were situated in the position aforementioned in order to
promote protein migration from the membrane active layer to the bulk
solution, due to the negative charge of most of the whey proteins in
the feed fouling solutions. Experiments with the electric fields were
performed in potentiostatic mode. The experimental set-up is shown
in Fig. 57.
(a)
(b)
Fig. 57. Schematic representation of the VF-S11 UF plant connected to a direct current (DC) supplier (a) and electrodes connection in the
membrane module (b)
Negative electrode (-): cathodePositive electrode (+): anode
Membrane external side
Ti-Ir electrodeMembrane internal side
(active layer)
Limpieza de membranas mediante campos eléctricos ________________________________________________________________________________________________________________________________________________________
342
9.1.2.4. Experimental procedure
Firstly, membranes were fouled with the different feed solutions at a
transmembrane pressure of 2 bar, a crossflow velocity of 2 m·s-1 and
a temperature of 25 ºC, according to previous studies about protein
UF (Matzinos and Álvarez, 2002; Corbatón-Báguena et al., 2015).
After the fouling step, membranes were rinsed with deionized water
during 30 min at a transmembrane pressure of 1 bar and 4.2 m·s-1.
Several studies reported that low transmembrane pressures and high
crossflow velocities favour the removal of proteins deposited on
membrane surfaces (Blanpain-Avet et al., 2009; Lee et al., 2001).
Then, a cleaning procedure was carried out at the same
transmembrane pressure and crossflow velocities as the rinsing step
and varying the applied potential (0, 15 and 30 V), the NaCl
concentration (0 and 5 mM) and the temperature of the cleaning
solution (25-50 ºC). These conditions were selected according to
other works about membrane cleaning by means of electric fields and
saline solutions (Tarazaga et al., 2006; Corbatón-Báguena et al.,
2014a). Finally, membranes were rinsed again with deionized water
to remove the loose protein deposits from the membrane surface as
well as the cleaning agents. During all these steps, both the permeate
flux and the hydraulic resistance were determined.
An additional conventional cleaning step was performed when
needed if the initial membrane hydraulic resistance was not
completely recovered after the cleaning procedure. This step was
performed with NaOH at a temperature of 50 ºC and pH values about
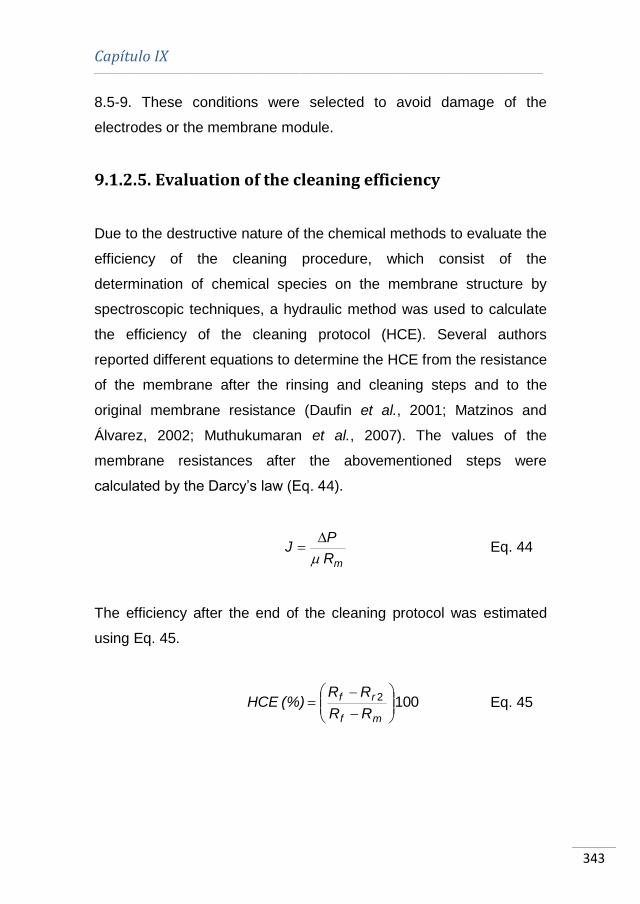
Capítulo IX ________________________________________________________________________________________________________________________________________________________
343
8.5-9. These conditions were selected to avoid damage of the
electrodes or the membrane module.
9.1.2.5. Evaluation of the cleaning efficiency
Due to the destructive nature of the chemical methods to evaluate the
efficiency of the cleaning procedure, which consist of the
determination of chemical species on the membrane structure by
spectroscopic techniques, a hydraulic method was used to calculate
the efficiency of the cleaning protocol (HCE). Several authors
reported different equations to determine the HCE from the resistance
of the membrane after the rinsing and cleaning steps and to the
original membrane resistance (Daufin et al., 2001; Matzinos and
Álvarez, 2002; Muthukumaran et al., 2007). The values of the
membrane resistances after the abovementioned steps were
calculated by the Darcy’s law (Eq. 44).
mR·
PJ
Eq. 44
The efficiency after the end of the cleaning protocol was estimated
using Eq. 45.
1002 ·RR
RR(%) HCE
mf
rf
Eq. 45

Limpieza de membranas mediante campos eléctricos ________________________________________________________________________________________________________________________________________________________
344
Where HCE is the hydraulic cleaning efficiency, Rf is the resistance at
the end of the fouling step, Rr2 is the resistance at the end of the
second rinsing and Rm is the resistance of the original membrane.
9.1.3. Results and discussion
9.1.3.1. Cleaning of membranes fouled with BSA
solutions
Results for the 15 kDa membrane
Fig. 58 shows the values of HCE obtained for the 15 kDa membrane
using two different cleaning solutions: deionized water at different
temperatures (25 and 50 ºC) and NaCl solutions at a concentration of
5 mM and three different temperatures (25, 37.5 and 50 ºC). NaCl
concentration was selected according to a previous work by the
authors dealing with membrane cleaning by means of saline
solutions. These experiments were performed at three different
electric field potentials (0, 15 and 30 V) in order to check the influence
of both temperature and applied potential on the HCE.
As it can be observed from Fig. 58, an increase in temperature and
applied potential during the cleaning step resulted in an increase in
the values of HCE achieved. This pattern was previously confirmed
by other authors (Tarazaga et al., 2006; Chen et al., 2007; Shi et al.,
2014; Corbatón-Báguena et al., 2014a).

Capítulo IX ________________________________________________________________________________________________________________________________________________________
345
(a)
(b)
Fig. 58. Influence of temperature of the cleaning solution and electric field potential on HCE for the 15 kDa membrane using (a) deionized water and (b) NaCl at a concentration of 5 mM as cleaning solution
(fouling solution: BSA; operating conditions during cleaning: 1 bar and 4.2 m·s
-1)
Tarazaga et al. (2006) demonstrated that an increase in the electric
field potential caused an increase in the permeate flux obtained
0
20
40
60
80
100
25 50
HC
E (
%)
Temperature (ºC)
0 V
15 V
30 V
0
20
40
60
80
100
HC
E (
%)
Temperature (ºC)
0 V
15 V
30 V
25 37.5 50
Limpieza de membranas mediante campos eléctricos ________________________________________________________________________________________________________________________________________________________
346
during the membrane fouling with bovine plasma solutions. Chen et
al. (2007) reported that electric field strengths greater than 15 V
resulted in a dramatic decrease of the hydraulic resistance when
membranes were fouled with sewage water. This should be due to
the greater amount of charged particles migrating from one electrode
to another when high electric field potential was applied. This effect
was also demonstrated by Shi et al. (2014) and Huotari et al. (1999)
using oily wastewaters during the membrane fouling. According to
these authors, the electrophoretic forces increase as the electric field
potential increases. These forces are ascribed to the movement of
charged particles towards the electrode of opposite sign. In their
works, this electrode is placed on the bulk solution channel. For all
these reasons, HCE increased as the electric potential increased.
On the other hand, Corbatón-Báguena et al. (2014a) tested different
temperatures during the cleaning of several UF membranes with
deionzed water as well as NaCl solutions. In all cases, an increase in
temperature resulted in an increase in the values of HCE achieved.
This trend was corroborated by Lee and Elimelech (2007), who
demonstrated that the mass transfer process as well as the chemical
reactions velocity increased when temperature increased, favouring
the weakness of the fouling layer on the membrane surface and
easing its removal. Regarding the effect of the saline solutions,
results shown in Fig. 58 indicated that higher HCE values were
obtained when cleaning was carried out in presence of NaCl at low
concentrations (5 mM). When an electric field is applied on NaCl
aqueous solutions, different cathodic and anodic reactions occurred
on the electrode surfaces (Mook et al., 2012):
Capítulo IX ________________________________________________________________________________________________________________________________________________________
347
Cathode: 2H2O + 2e- → H2 + 2OH-
Anode: 4OH- → O2 + 2H2O + 4e-
2Cl- → Cl2 + 2e-
In addition, when chlorine is in contact with water molecules,
hypochlorite is formed due to the following reaction (Mook et al.,
2012):
Cl2 + H2O → HOCl + H+ + Cl-
Hypochlorite formed in this last reaction oxidizes the organic pollutant
species (proteins in this work), breaking their bonds to partially
decompose them and favouring their removal from the system (Yasri
et al., 2015). This technique is known as indirect electrochemical
oxidation and has been successfully implemented in the treatment of
different organic effluents (Naumczyk et al., 1996; Donaldson et al.,
2002). Therefore, as it was expected, the HCE values obtained in
presence of NaCl 5 mM were greater than those obtained with
deionized water, due to the oxidation of proteins deposited on the
membrane surface.
Therefore, the best operating conditions to clean the 15 kDa
membrane fouled with BSA solutions were a temperature of 37.5 ºC,
an electric field potential of 30 V and a NaCl concentration of 5 mM.
When cleaning with NaCl solutions was performed without applying
electric fields, a greater temperature (50 ºC) was required to achieve
the same HCE, showing that the combination of electric fields and the
addition of NaCl is a more efficient membrane cleaning procedure.

Limpieza de membranas mediante campos eléctricos ________________________________________________________________________________________________________________________________________________________
348
Results for the 50 kDa membrane
Fig. 59 shows the effect of temperature of the cleaning solution on the
HCE values obtained when the 50 kDa membrane was fouled with
BSA solutions and cleaned with different cleaning agents and
different electric potentials: NaCl at a concentration of 7.5 mM at 0
and 30 V and NaOH at a concentration of 5 g·L-1. These cleaning
agent concentrations were selected according to the range of pH
recommended by the manufacturer to clean this membrane and
previous works about salt cleaning of UF membranes (Corbatón-
Báguena et al., 2014a).
Fig. 59. Influence of temperature of the cleaning solution and electric
field potential on HCE for the 50 kDa membrane using different cleaning agents (fouling solution: BSA; operating conditions during cleaning: 1 bar
and 4.2 m·s-1
)
Capítulo IX ________________________________________________________________________________________________________________________________________________________
349
As it can be observed, the highest cleaning efficiency was achieved
when the conventional cleaning with NaOH solutions was performed.
Regarding the cleaning with NaCl solutions, negligible differences in
HCE were observed between the cleaning protocol carried out at
37.5 ºC and 30 V and that performed at 80 ºC and 0 V. This fact
demonstrated the greater efficiency reached when electric fields were
applied, as it was reported for the 15 kDa membrane (Fig. 58). Higher
temperatures are required if no electric fields are used to reach the
same HCE. Despite the good results obtained when the
electrochemical oxidation took place, this technique was not as
efficient as the conventional cleaning protocol, even when higher
temperatures were used to facilitate protein removal. This may be
due to the fact that the amount of hypochlorite formed when an
electric field was applied was too low to completely clean this
membrane. In a previous work by the authors where this membrane
was used to ultrafilter BSA solutions, it was observed that, this
membrane shows a very sharp permeate flux decrease at the
beginning of the UF process, which indicates severe membrane
fouling (Corbatón-Báguena et al., 2014a). The reason for this fact is
the similar size between membrane pores (50 kDa) and BSA
molecules (67 kDa), which favours that these molecules completely
block the membrane pores and/or penetrate inside its porous
structure, as it was reported by other authors (Qu et al., 2014).
However, permeate flux decline was much lower for the 15 kDa
membrane (Corbatón-Báguena et al., 2014a). Therefore, fouling was
less severe for this membrane and easier to remove.
Limpieza de membranas mediante campos eléctricos ________________________________________________________________________________________________________________________________________________________
350
9.1.3.2. Cleaning of the 15 kDa membrane fouled with
whey model solutions
As electric fields were not able to completely restore the initial
membrane permeselective properties in the case of the 50 kDa
membrane, only the 15 kDa membrane was used to test the
effectiveness of the electrochemical process when whey model
solutions (BSA with CaCl2 and WPC solutions at different
concentrations) were employed as feed during the fouling step.
The same cleaning operating conditions that resulted in the best HCE
values when the membrane was fouled by BSA (1 bar, 4.2 m·s-1,
37.5 ºC, 30 V and a NaCl concentration of 5 mM) were tested with the
15 kDa membrane once it was fouled with BSA and CaCl2 and WPC
(22.2 g·L-1) solutions. The results shown in Fig. 60 demonstrated that
the maximum HCE achieved was about 90 % in both cases at the
experimental conditions tested. This is due to the more severe
membrane fouling caused when salts are introduced in the protein
solution. These salts can act as bridging agents between proteins,
aggregating them and favouring its deposition on the membrane
surface. This behaviour was previously reported by other authors
(Nucci and Vanderkooi, 2008; Ang and Elimelech, 2007).
In order to improve the efficiency of the cleaning process, the 15 kDa
membrane was cleaned at three different temperatures within the
range 37.5-50 ºC. Fig. 61 shows the evolution of HCE with
temperature for the BSA with CaCl2 and WPC (22.2, 33.3 and
150.0 g·L-1) solutions.

Capítulo IX ________________________________________________________________________________________________________________________________________________________
351
Fig. 60. Influence of feed solution composition of the fouling step on
HCE for the 15 kDa membrane (operating conditions during cleaning: 1 bar, 4.2 m·s
-1, 37.5 ºC, 30 V and 5 mM NaCl).
Fig. 61. Influence of temperature of the cleaning solution on HCE for the
15 kDa membrane (operating conditions during cleaning: 1 bar, 4.2 m·s
-1, 30 V and 5 mM NaCl)
0
20
40
60
80
100H
CE
(%
)
Feed solution
BSA(10 g·L-1)
BSA (10 g·L-1)CaCl2 (1.65 g·L-1)
WPC(22.2 g·L-1)
0
20
40
60
80
100
40.7 43.8 50
HC
E (
%)
Temperature (ºC)
BSA + CaCl2WPC 22.2 g·L-1
WPC 33.3 g·L-1
WPC 150 g·L-1
Limpieza de membranas mediante campos eléctricos ________________________________________________________________________________________________________________________________________________________
352
As it can be observed, HCE values about 100 % were obtained at
temperatures of 43.8 and 50 ºC. Therefore, an increase in the
cleaning solution temperature caused an increase in the HCE as it
had been previously observed when this membrane was fouled with
BSA solutions (Fig. 58). Therefore, the best operating conditions to
carry out the cleaning protocol of the 15 kDa membrane fouled with
whey model solutions were 1 bar, 4.2 m·s-1, 30 V, 43.8 ºC and a NaCl
concentration of 5 mM. As it was expected, the higher the protein
concentration in the feed solution was, the more severe the
membrane fouling was due to the greater protein aggregation and
accumulation on the membrane surface. This fact was previously
reported by the authors in works about membrane fouling
characterization and modelling in the case of UF membranes fouled
with whey model solutions (Corbatón-Báguena et al., 2015).
Therefore, the more severe fouling caused by an increase in protein
concentration decreased the HCE achieved with the cleaning
procedure, requiring harsher operating conditions (higher
temperature) to achieve similar HCE values (Zumbusch et al., 1998).
9.1.4. Conclusions
Cleaning by means of the application of electric fields
combined with the addition of NaCl solutions was effective to
completely restore the 15 kDa membrane initial permeation
properties when it was used to treat different whey model
solutions. However, the 50 kDa membrane could not be
completely cleaned by this cleaning procedure, probably due
Capítulo IX ________________________________________________________________________________________________________________________________________________________
353
to the more severe fouling that proteins caused in this
membrane.
Results demonstrated that the higher the temperature of the
cleaning solution as well as the electric potential were, the
higher HCE values were achieved.
The presence of NaCl at low concentrations (5 mM) favoured
membrane cleaning, obtaining HCE values about 100 % at
mild temperatures (37.5-50 ºC) for the 15 kDa membrane.
This fact is due to the electrochemical oxidation process that
occurs when NaCl is used as electrolyte and transformed to
hypochlorite by the application of electric fields.
The best operating conditions to clean the 15 kDa membrane
fouled by whey model solutions were a NaCl concentration of
5 mM, a transmembrane pressure of 1 bar, a crossflow
velocity of 4.2 m·s-1, a electric field potential of 30 V and a
temperature around 43.8 ºC.
Acknowledgements
The authors of this work wish to gratefully acknowledge the financial
support from the Spanish Ministry of Science and Innovation through
the project CTM2010-20186 and the company MAGNETO Special
Anodes B.V. for supplying the Ti-Ir electrode.
Limpieza de membranas mediante campos eléctricos ________________________________________________________________________________________________________________________________________________________
354
9.2. BIBLIOGRAFÍA
ADAMS M.C., ZULEWSKA J. y BARBANO D.M. (2013). “Effect of
annatto addition and bleaching treatments on ultrafiltration flux during
production of 80 % whey protein concentrate and 80 % serum protein
concentrate” en Journal of Dairy Science, vol. 96, p. 2035-2047.
AFONSO A., MIRANDA J.M. y CAMPOS J.B.L.M. (2009). “Numerical
study of BSA ultrafiltration in the limiting flux regime – effect of
variable physical properties” en Desalination, vol. 249, p. 1139-1150.
ALMÉCIJA M.C. et al. (2009). “Influence of the cleaning temperature
on the permeability of ceramic membranes” en Desalination, vol. 245,
p. 708-713.
ANG W.S. y ELIMELECH M. (2007). “Protein (BSA) fouling of reverse
osmosis membranes: Implications for wastewater reclamation” en
Journal of Membrane Science, vol. 296, p. 83-92.
BLANPAIN-AVET P. MIGDAL J.F. y BÉNÉZECH T. (2009).
“Chemical cleaning of a tubular ceramic microfiltration membrane
fouled with a whey protein concentrate suspension – characterization
of hydraulic and chemical cleanliness” en Journal of Membrane
Science, vol. 337, p. 153-174.
CHEN J.-P. et al. (2007). “Study of the influence of the electric field
on membrane flux of a new type of membrane bioreactor” en
Chemical Engineering Journal, vol. 128, p. 177-180.
CORBATÓN-BÁGUENA M.J., ÁLVAREZ-BLANCO S. y VINCENT-
VELA M.C. (2014a). “Cleaning of ultrafiltration membranes fouled
with BSA by means of saline solutions” en Separation and Purification
Technology, vol. 125, p. 1-10.
Capítulo IX ________________________________________________________________________________________________________________________________________________________
355
CORBATÓN-BÁGUENA M.J., ÁLVAREZ-BLANCO S. y VINCENT-
VELA M.C. (2014b). “Salt cleaning of ultrafiltration membranes fouled
by whey model solutions” en Separation and Purification Technology,
vol. 132, p. 226-233.
CORBATÓN-BÁGUENA M.J., ÁLVAREZ-BLANCO S. y VINCENT-
VELA M.C. (2015). “Fouling mechanisms of ultrafiltration membranes
fouled with whey model solutions” en Desalination, vol. 360, p. 87-96.
DAUFIN G. et al. (2001). “Recent and emerging applications of
membrane processes in the food and dairy industry” en Food and
Bioproducts Processing, vol. 79, p. 89-102.
DONALDSON J.D. et al. (2002). “Anodic oxidation of the dye
materials methylene blue, acid blue 25, reactive blue 2 and reactive
blue 15 and the characterization of novel intermediate compounds in
the anodic oxidation of methylene blue” en Journal of Chemical
Technology and Biotechnology, vol. 77, p. 756-760.
HOLDER A., WEIK J. y HINRICHS J. (2013). “A study of fouling
during long-term fractionation of functional peptides by means of
cross-flow ultrafiltration and cross-flow electro membrane filtration” en
Journal of Membrane Science, vol. 446, p. 440-448.
HUOTARI H.M., HUISMAN I.H. y TRÄGÅRDH G. (1999). “Electrically
enhanced crossflow membrane filtration of oily wastewater using the
membrane as a cathode” en Journal of Membrane Science, vol. 156,
p. 49-60.
KAZEMIMOGHADAM M. y MOHAMMADI T. (2007). “Chemical
cleaning of ultrafiltration membranes in the milk industry” en
Desalination, vol. 204, p. 213-218.
Limpieza de membranas mediante campos eléctricos ________________________________________________________________________________________________________________________________________________________
356
LEE H. et al. (2001). “Cleaning strategies for flux recovery of an
ultrafiltration membrane fouled by natural organic matter” en Water
Research, vol. 35, p. 3301-3308.
LEE S. y ELIMELECH M. (2007). “Salt cleaning of organic-fouled
reverse osmosis membranes” en Water Research, vol. 41, p. 1134-
1142.
MATZINOS P. y ÁLVAREZ R. (2002). “Effect of ionic strength on
rinsing and alkaline cleaning of ultrafiltration inorganic membranes
fouled with whey proteins” en Journal of Membrane Science, vol. 208,
p. 23-20.
MO H., TAY K.G. y NG H.Y. (2008). “Fouling of reverse osmosis
membrane by protein (BSA): Effects of pH, calcium, magnesium,
ionic strength and temperature” en Journal of Membrane Science,
vol. 315, p. 28-35.
MOOK W.T. et al. (2012). “Removal of total ammonia nitrogen (TAN),
nitrate and total organic carbon (TOC) from aquaculture wastewater
using electrochemical technology: A review” en Desalination, vol.
285, p. 1-13.
MUTHUKUMARAN S. et al. (2007). “The application of ultrasound to
dairy ultrafiltration: the influence of operating conditions” en Journal of
Food Engineering, vol. 81, p. 364-373.
NAUMCZYK J., SZPYRKOWICZ L. y ZILIOGRANDI F. (1996).
“Electrochemical treatment of textile wastewater” en Water Science
and Technology, vol. 34, p. 17-24.
NUCCI N.V. y VANDERKOOI J.M. (2008). “Effects of salts of the
Hofmeister series on the hydrogen bond network of water” en Journal
of Molecular Liquids, vol. 143, p. 160-170.
Capítulo IX ________________________________________________________________________________________________________________________________________________________
357
OGUNBIYI O.O., MILES N.J. y HILAL N. (2008). “The effects of
performance and cleaning cycles of new tubular ceramic
microfiltration membrane fouled with a model yeast suspension” en
Desalination, vol. 220, p. 273-289.
QU F. et al. (2014). “Ultrafiltration membrane fouling caused by
extracellular organic matter (EOM) from Microcystis aeruginosa:
Effects of membrane pore size and surface hydrophobicity” en
Journal of Membrane Science, vol. 449, p. 58-66.
SARKAR B., DASGUPTA S. y DE S. (2009). “Application of external
electric field to enhance the permeate flux during micellar enhanced
ultrafiltration” en Separation and Purification Technology, vol. 66, p.
263-272.
SHI X. et al. (2014). “Fouling and cleaning of ultrafiltration
membranes: A review” en Journal of Water Process Engineering, vol.
1, p. 121-138.
SONG W. et al. (2010). “Rapid concentration of protein solution by a
crossflow electro-ultrafiltration process” en Separation and
Purification Technology, vol. 73, p. 310-318.
TARAZAGA C.C., CAMPDERRÓS M.E. y PÉREZ-PADILLA A.
(2006). “Physical cleaning by means of electric field in the
ultrafiltration of a biological solution” en Journal of Membrane
Science, vol. 278-p. 219-224.
WANG Y-N. y TANG C.Y. (2011). “Protein fouling of nanofiltration,
reverse osmosis, and ultrafiltration membranes - The role of
hydrodynamic conditions, solution chemistry and membrane
properties” en Journal of Membrane Science, vol. 376, p. 275-282.
YASRI N.G., YAGHMOUR A. y GUNASEKARAN S. (2015). “Effective
removal of organics from corn wet milling steepwater effluent by

Limpieza de membranas mediante campos eléctricos ________________________________________________________________________________________________________________________________________________________
358
electrochemical oxidation and adsorption on 3-D granulated graphite
electrode” en Journal of Environmental Chemical Engineering, vol. 3,
p. 930-937.
ZUMBUSCH P.v., KULCKE W. y BRUNNER G. (1998). “Use of
alternating electrical fields as anti-fouling strategy in ultrafiltration of
biological suspensions – Introduction of a new experimental
procedure for crossflow filtration” en Journal of Membrane Science,
vol. 142, p. 75-86.

Conclusiones
finales

Conclusiones finales ________________________________________________________________________________________________________________________________________________________
362
10.1. CONCLUSIONES FINALES
10.1.1. Modelización del ensuciamiento de las
membranas
Los diferentes modelos matemáticos de UF considerados en
esta Tesis Doctoral (los modelos de Hermia adaptados a flujo
tangencial, un modelo combinado que considera los
mecanismos de bloqueo completo de poros y formación de
torta y un modelo de resistencias en serie) fueron capaces de
predecir con gran precisión (valores de R2 mayores de 0.904
y valores de desviación estándar menores de 0.040) el
descenso de la densidad de flujo de permeado con el tiempo
para todas las membranas seleccionadas (5, 15, 30 y 50 kDa)
durante la UF a 2 bar y 2 m·s-1 de diversas disoluciones
propias de la industria alimentaria: disoluciones modelo de
lactosuero que contenían BSA (10 g·L-1), BSA (10 g·L-1) con
CaCl2 (1.65 g·L-1) y WPC (22.2, 33.3 y 44.4 g·L-1), y
disoluciones enzimáticas de pectinasas con distintas
concentraciones de proteínas (2, 7.5 y 15 g·L-1).
El modelo de Hermia de bloqueo estándar de poros fue el
único con el que no se obtuvo una buena precisión en el
ajuste a los datos experimentales (con valores de R2
negativos y valores de desviación estándar superiores a 1),
debido a que las moléculas de soluto eran de un tamaño
mayor que el tamaño de poro de las membranas, por lo que
Capítulo X ________________________________________________________________________________________________________________________________________________________
363
no podían penetrar dentro de la estructura porosa de dichas
membranas.
Entre los modelos matemáticos considerados, aquellos con
los que se obtuvieron ajustes más precisos (con mayor valor
de R2 y menor valor de desviación estándar) fueron el modelo
combinado y el modelo de resistencias en serie para todas las
membranas y disoluciones alimento ensayadas. Este hecho
indicó que tanto la formación de torta como el bloqueo de
poros contribuyeron al ensuciamiento de las membranas.
De entre todas las membranas utilizadas, la que mostró un
menor descenso de la densidad de flujo de permeado con el
tiempo y menores valores de los parámetros de los modelos
para todas las disoluciones alimento consideradas fue la
membrana de 30 kDa, puesto que la combinación de alta
hidrofilicidad y baja rugosidad superficial que presenta da
como resultado una membrana con mejor comportamiento
antiensuciamiento.
La mayor concentración de proteínas en la disolución
alimento, así como la presencia de iones en dichas
disoluciones (como en el caso de las disoluciones de BSA y
CaCl2 y WPC) conllevó un ensuciamiento de las membranas
más severo. Esto es debido a varias razones: por un lado, un
aumento de la concentración de proteínas favorece la
interacción entre ellas y, por tanto, la mayor acumulación de
las mismas sobre la superficie de las membranas. Por otra
parte, los iones divalentes (como el calcio) actúan como
enlace entre las cadenas de proteínas, facilitando también la
agregación de las mismas.
Conclusiones finales ________________________________________________________________________________________________________________________________________________________
364
10.1.2. Limpieza de membranas mediante
disoluciones salinas
En cuanto al tipo de sal utilizado como agente de limpieza
para la membrana de 15 kDa ensuciada con disoluciones de
BSA a una concentración de 10 g·L-1, los mayores valores de
EHL fueron obtenidos cuando la etapa de limpieza se realizó
con disoluciones de NaCl, KCl, NaNO3 y NH4Cl. El menor
valor de EHL se obtuvo al utilizar disoluciones de Na2SO4.
Esta diferencia se debe a la mejor habilidad de los iones Na+,
K+, NH4+, Cl- y NO3
- para disolver las proteínas de la superficie
de la membrana debido a su carácter “salting-in”.
La sal NaCl fue seleccionada para utilizarse como agente de
limpieza para las membranas de 5, 15, 30 y 50 kDa
ensuciadas con disoluciones modelo de lactosuero (BSA,
BSA con CaCl2 y WPC) y disoluciones enzimáticas debido a
su bajo coste e impacto ambiental.
Las disoluciones de NaCl fueron capaces de limpiar, de
manera efectiva, las membranas de 5, 15 y 30 kDa
ensuciadas con disoluciones modelo de lactosuero (BSA,
BSA con CaCl2 y WPC) así como con disoluciones
enzimáticas en las condiciones experimentales ensayadas en
cada caso, alcanzando valores de EHL cercanos a 100 % en
todos ellos. Sin embargo, estas disoluciones no fueron
efectivas para limpiar completamente la membrana de 50 kDa
ensuciada con disoluciones modelo de lactosuero. Esto
puede atribuirse al ensuciamiento más severo observado en
esta membrana.
Capítulo X ________________________________________________________________________________________________________________________________________________________
365
Los resultados obtenidos demostraron que a mayor
temperatura de la disolución de limpieza y a mayor velocidad
tangencial, mayor valor de EHL. Esta tendencia se confirmó
con todas las disoluciones alimento y membranas ensayadas.
Al aumentar la concentración de sal hasta un cierto valor
(entre 2.5 y 10 mM), el valor de EHL aumentó también. Sin
embargo, un mayor incremento en la concentración de NaCl
no resultó en valores más elevados de EHL e, incluso, causó
su descenso. Este descenso en la eficacia de limpieza pudo
deberse a la competición entre los mecanismos de
ensuciamiento y limpieza y a la reducción de la tensión
superficial.
En cuanto a la concentración de proteínas en la disolución
alimento durante la etapa de ensuciamiento, cuanto mayor
fue dicha concentración, menor fue la EHL obtenida, debido al
ensuciamiento más severo causado sobre las membranas
conforme la concentración de proteínas aumentó. Esta
tendencia se confirmó con disoluciones de WPC (22.2, 33.3 y
150 g·L-1), así como con disoluciones enzimáticas (2, 7.5 y
15 g·L-1).
De acuerdo con los resultados de los análisis de superficie
respuesta (RSM) y los resultados de los métodos de
optimización utilizados, las mejores condiciones de operación
para limpiar las membranas de 5, 15 y 30 kDa ensuciadas
con disoluciones modelo de lactosuero fueron: temperaturas
de 50 ºC (para las disoluciones de BSA y BSA con CaCl2) y
80 ºC (para las disoluciones de WPC), concentraciones de
NaCl entre 5 y 10 mM y velocidades tangenciales de
Conclusiones finales ________________________________________________________________________________________________________________________________________________________
366
2.18 m·s-1 (para las membranas poliméricas) y 4.2 m·s-1 (para
la membrana de 15 kDa).
Diversas ecuaciones que correlacionan los valores de EHL
con los parámetros de operación (temperatura, concentración
de NaCl, velocidad tangencial durante el protocolo de
limpieza y concentración de WPC durante la etapa de
ensuciamiento) se obtuvieron mediante análisis de regresión
múltiple para las membranas de 5, 15 y 30 kDa con elevado
grado de ajuste (valores de R2 mayores de 0.893).
Las imágenes de SEM y AFM, así como las medidas de ATR-
FTIR llevadas a cabo sobre las membranas poliméricas
nuevas, sucias y limpias, confirmaron la formación de una
capa de proteínas en la superficie de la membrana de 30 kDa
sucia, mientras que la densidad de agregados de proteínas
fue mayor sobre la membrana de 5 kDa. La razón para estas
diferencias radica en la naturaleza hidrofílica de la membrana
de 30 kDa, que le confiere mejores propiedades
antiensuciamiento y, por tanto, menor acumulación de
agentes de suciedad en su superficie.
La elevada eficacia de limpieza estimada mediante los
métodos hidráulicos (basados en la comparación de la
resistencia total al final del protocolo de limpieza con la
resistencia de la membrana original) se corroboró al
determinar mediante ATR-FTIR valores muy pequeños de
concentración residual de proteínas (menores de 14 μg·cm-2)
sobre la superficie de las membranas limpias. Aunque
reducidas cantidades de contaminantes residuales
permanecieron presentes después de la limpieza con
Capítulo X ________________________________________________________________________________________________________________________________________________________
367
disoluciones de NaCl, los valores de permeabilidad inicial
fueron completamente recuperados.
10.1.3. Limpieza de membranas mediante campos
eléctricos
La aplicación de campos eléctricos combinados con
disoluciones de NaCl fue una técnica de limpieza efectiva
para recuperar las propiedades permselectivas de la
membrana cerámica tubular de 15 kDa ensuciada con
distintas disoluciones modelo de lactosuero que consistían en
BSA (10 g·L-1), BSA (10 g·L-1) con CaCl2 (1.65 g·L-1) y WPC
(22.2, 33.3 y 150.0 g·L-1). Sin embargo, la membrana
cerámica de 50 kDa no pudo ser completamente limpiada
después de este protocolo de limpieza, probablemente debido
al ensuciamiento más severo que las proteínas causan sobre
dicha membrana.
En cuanto a las condiciones de operación, un aumento en la
temperatura de la disolución de limpieza y en el potencial de
campo eléctrico aplicado resultaron en un aumento de los
valores de EHL obtenidos, para todas las disoluciones
alimento ensayadas con la membrana de 15 kDa.
La utilización de bajas concentraciones de NaCl en
combinación con los campos eléctricos favoreció la limpieza
de la membrana de 15 kDa en comparación con la utilización
de agua desionizada, alcanzando valores de EHL cercanos al
100 % a temperaturas moderadas (alrededor de 43.8 ºC para
disoluciones de WPC). La razón de este comportamiento es
Conclusiones finales ________________________________________________________________________________________________________________________________________________________
368
la producción de hipoclorito cuando los campos eléctricos se
aplicaron utilizando NaCl como electrolito, que oxida las
proteínas presentes en la superficie de la membrana y
favorece la disgregación de dichos depósitos.
Las mejores condiciones de operación para limpiar la
membrana de 15 kDa fueron una concentración de NaCl de
5 mM, una presión transmembranal de 1 bar, una velocidad
tangencial de 4.2 m·s-1, un potencial de campo eléctrico de
30 V y temperaturas entre 37.5 y 43.8 ºC.
Capítulo X ________________________________________________________________________________________________________________________________________________________
369
10.2. FINAL CONCLUSIONS
10.2.1. Membrane fouling modelling
The different mathematical UF models selected in this PhD
Thesis (Hermia’s models adapted to crossflow, a combined
model that considers both complete blocking and cake
formation mechanisms and a resistance-in-series model) were
able to predict with high accuracy (values of R2 higher than
0.904 and values of SD lower than 0.040) the permeate flux
decline obtained with time for all the membranes tested (5, 15,
30 and 50 kDa) during the UF at 2 bar and 2 m·s-1 of several
food solutions: whey model solutions that contained BSA
(10 g·L-1), BSA (10 g·L-1) with CaCl2 (1.65 g·L-1) and WPC
(22.2, 33.3 and 44.4 g·L-1) and enzymatic solutions of
pectinases at different protein concentrations (2, 7.5 and
15 g/L).
Only the Hermia’s standard blocking model did not show a
very accurate fitting (with negative values of R2 and SD values
higher than 1) to the experimental data, because solute
molecules were higher than membrane pore size, thus they
cannot penetrate inside the membrane porous structure.
Among the mathematical models tested, those that showed
the best fitting accuracy (the highest R2 and lowest SD) were
the combined model and the resistance-in-series model for all
the membranes and feed solutions considered. This fact
indicated that both cake layer formation and pore blocking
contributed to membrane fouling.
Conclusiones finales ________________________________________________________________________________________________________________________________________________________
370
Among the different membranes used, the one that showed
the lowest permeate flux decline with time and the lowest
values of model parameters for all the feed solutions
considered was the 30 kDa membrane, because the
combination of high hydrophilicity and low surface roughness
resulted in a membrane with better antifouling properties.
An increase in protein concentration in the feed solutions and
the presence of calcium ions in these solutions (as in the case
of BSA with CaCl2 and WPC solutions) resulted in a more
severe membrane fouling. This is due to several reasons: on
one hand, an increase in protein concentration favours the
interaction among them and thus, the greater protein
accumulation on the membrane surface. On the other hand,
salts such as calcium acts as binding agent between protein
chains, easing their aggregation.
10.2.2. Membrane cleaning by means of saline
solutions
Regarding the type of salt used as cleaning agent for the
15 kDa membrane fouled with BSA solutions at a
concentration of 10 g·L-1, the highest values of HCE were
achieved when the cleaning stage was performed with NaCl,
KCl, NaNO3 and NH4Cl solutions. The lowest value of HCE
was obtained when Na2SO4 solutions were used. This
difference is due to the better ability of Na+, K+, NH4+, Cl- y
NO3- ions to dissolve proteins from membrane surface due to
the salting-in effect.
Capítulo X ________________________________________________________________________________________________________________________________________________________
371
NaCl was selected to be used as cleaning agent for the
membranes of 5, 15, 30 and 50 kDa fouled with whey model
solutions (BSA, BSA with CaCl2 and WPC solutions) and
enzymatic solutions because of its lower cost and
environmental impact.
NaCl solutions were able to effectively clean the 5, 15 and
30 kDa membranes fouled with whey model solutions (BSA,
BSA with CaCl2 and WPC solutions) as well as with enzymatic
solutions at the experimental conditions tested, achieving
values of HCE about 100 % in all cases. However, they were
not effective to completely clean the 50 kDa membrane fouled
with whey model solutions. This can be attributed to the more
intense fouling observed for this membrane.
The cleaning results obtained demonstrated that the higher
the temperature of the cleaning solution and the
crossflow velocity were, the higher HCE was achieved. This
trend was confirmed with all the feed solutions and
membranes tested.
When salt concentration increased up to a certain value
(ranging from 2.5 to 10 mM), HCE increased as well.
However, a further increase in NaCl concentration did not
result in higher values of HCE or could even cause their
decrease. The cleaning efficiency decrease may be due to the
competition between cleaning and fouling mechanisms and
the reduction in surface tension.
Regarding the protein concentration in the feed solution during
the fouling step, the higher this concentration was, the lower
the HCE was, due to the more severe fouling caused when

Conclusiones finales ________________________________________________________________________________________________________________________________________________________
372
protein concentration in the feed solution increased. This
pattern was confirmed with the WPC solutions (22.2, 33.3 and
150 g·L-1) as well as the enzymatic solutions (2, 7.5 and
15 g·L-1).
According to the results of the RSM analyses and the results
of the optimization methods, the best operating conditions to
clean the 5, 15 and 30 kDa membranes fouled with whey
model solutions were: temperatures of 50 ºC (for BSA and
BSA with CaCl2 solutions) and 80 ºC (for WPC solutions),
NaCl concentrations ranging from 5 to 10 mM and crossflow
velocities of 2.18 m·s-1 (for the polymeric membranes) and
4.2 m·s-1 (for 15 kDa membrane).
Several equations that correlated HCE to the operating
parameters (temperature, NaCl concentration, crossflow
velocity in the cleaning procedure and WPC concentration
during the fouling step) were obtained by means of a Multiple
Regression Analysis for the 5, 15 and 30 kDa membranes.
The accuracy of these equations was very high (values of R2
higher than 0.893).
SEM and AFM images as well as ATR-FTIR measurements
carried out on the virgin, fouled and cleaned polymeric
membranes, confirmed that a continuous protein layer was
formed on the fouled 30 kDa membrane surface, while the
density of protein aggregates was greater on the fouled 5 kDa
membrane surface. The reason for this difference is the
hydrophilic nature of the 30 kDa membrane, which results in
better antifouling properties and thus, lower accumulation of
foulants on its surface.
Capítulo X ________________________________________________________________________________________________________________________________________________________
373
The high cleaning efficiency estimated by means of the
hydraulic methods (by comparing the total resistance at the
end of the cleaning protocol to the original membrane
resistance) was corroborated as very low values of residual
protein concentration on the surface of the clean membranes
was measured by ATR-FTIR. Although small quantities of
residual contaminants were still present after cleaning with
NaCl solutions, the initial permeability value was completely
restored.
10.2.3. Membrane cleaning by means of electric
fields
Electric fields combined with NaCl solutions were an effective
cleaning technique to restore the permselective properties of a
ceramic monotubular 15 kDa membrane fouled with different
whey model solutions consisting of BSA (10 g·L-1), BSA
(10 g·L-1) with CaCl2 (1.65 g·L-1) and WPC (22.2, 33.3 and
150.0 g·L-1). However, the 50 kDa ceramic membrane could
not be completely cleaned after this cleaning procedure,
probably due to the more severe fouling that proteins caused
in this membrane.
Regarding the cleaning operating conditions, an increase in
temperature of the cleaning solution and in the potential of the
electric field applied resulted in an increase in the HCE values
achieved for all the feed solutions tested for the 15 kDa
membrane.

Conclusiones finales ________________________________________________________________________________________________________________________________________________________
374
The utilization of low concentrations of NaCl combined with
the application of electric fields favoured the membrane
cleaning of the 15 kDa membrane in comparison with the
utilization of deionized water. HCE values about 100 % were
achieved at mild temperatures (about 43.8 ºC for the WPC
solutions). The reason for this observation is the production of
hypochlorite when electric fields are applied using NaCl as
electrolyte, which oxidises the protein deposits on the
membrane surface and favours the disaggregation of these
deposits.
The best operating conditions to clean the 15 kDa membrane
were a NaCl concentration of 5 mM, a transmembrane
pressure of 1 bar, a crossflow velocity of 4.2 m·s-1, an electric
field potential of 30 V and temperatures ranging from 37.5 to
43.8 ºC.