Interacción entre las vías de HGF y TGF-ß en células...
193
UNIVERSIDAD COMPLUTENSE DE MADRID FACULTAD DE FARMACIA TESIS DOCTORAL Interacción entre las vías de HGF y TGF-ß en células progenitoras adultas hepáticas y células de hepatocarcinoma Crosstalk between HGF and TGF-ß signaling pathways in adult liver progenitor cells and hepatocellular carcinoma cells MEMORIA PARA OPTAR AL GRADO DE DOCTOR PRESENTADA POR Laura Almalé del Barrio Directoras Aránzazu Sánchez Muñoz Blanca Herrera González Madrid © Laura Almalé del Barrio, 2019
Transcript of Interacción entre las vías de HGF y TGF-ß en células...

UNIVERSIDAD COMPLUTENSE DE MADRID FACULTAD DE FARMACIA
TESIS DOCTORAL
Interacción entre las vías de HGF y TGF-ß en células progenitoras adultas hepáticas y células de hepatocarcinoma
Crosstalk between HGF and TGF-ß signaling pathways in
adult liver progenitor cells and hepatocellular carcinoma cells
MEMORIA PARA OPTAR AL GRADO DE DOCTOR
PRESENTADA POR
Laura Almalé del Barrio
Directoras
Aránzazu Sánchez Muñoz Blanca Herrera González
Madrid
© Laura Almalé del Barrio, 2019
TESIS DOCTORAL
Interacción entre las vías de HGF y TGF-β en células
progenitoras adultas hepáticas y células de
hepatocarcinoma
Crosstalk between HGF and TGF-β signaling pathways in adult
liver progenitor cells and hepatocellular carcinoma cells
MEMORIA PARA OPTAR AL GRADO DE DOCTOR
PRESENTADA POR
Laura Almalé del Barrio
Directoras
Aránzazu Sánchez Muñoz Blanca Herrera González
Madrid 2019
UNIVERSIDAD COMPLUTENSE DE MADRID
FACULTAD DE FARMACIA
DEPARTAMENTO DE BIOQUÍMICA Y BIOLOGÍA MOLECULAR

DECLARACIÓN DE AUTORÍA Y ORIGINALIDAD DE LA TESIS PRESENTADA PARA OBTENER EL TÍTULO DE DOCTOR
D./Dña.________________________________________________________________, estudiante en el Programa de Doctorado _____________________________________, de la Facultad de _____________________________ de la Universidad Complutense de Madrid, como autor/a de la tesis presentada para la obtención del título de Doctor y titulada:
y dirigida por:
DECLARO QUE:
La tesis es una obra original que no infringe los derechos de propiedad intelectual ni los derechos de propiedad industrial u otros, de acuerdo con el ordenamiento jurídico vigente, en particular, la Ley de Propiedad Intelectual (R.D. legislativo 1/1996, de 12 de abril, por el que se aprueba el texto refundido de la Ley de Propiedad Intelectual, modificado por la Ley 2/2019, de 1 de marzo, regularizando, aclarando y armonizando las disposiciones legales vigentes sobre la materia), en particular, las disposiciones referidas al derecho de cita.
Del mismo modo, asumo frente a la Universidad cualquier responsabilidad que pudiera derivarse de la autoría o falta de originalidad del contenido de la tesis presentada de conformidad con el ordenamiento jurídico vigente.
En Madrid, a ____ de _________________________ de 20___
Fdo.: _______________________________
Esta DECLARACIÓN DE AUTORÍA Y ORIGINALIDAD debe ser insertada en
la primera página de la tesis presentada para la obtención del título de Doctor.
Laura Almalé del Barrio
Bioquímica, Biología Molecular y Biomedicina
Ciencias Químicas
28 mayo 19
Aránzazu Sánchez Muñoz y Blanca Herrera González
Crosstalk between HGF and TGF- β signaling pathways in adult liver progenitor cells and hepatocellular carcinoma cells
ALMALE DEL
BARRIO
LAURA -
16812897N
Firmado digitalmente
por ALMALE DEL
BARRIO LAURA -
16812897N
Fecha: 2019.05.28
17:02:12 +02'00'
Interacción entre las vías de HGF y TGF-β en células progenitoras adultas hepáticas y células de hepatocarcinoma//


A mis padres

Parece difícil resumir el trabajo de todos estos años en el laboratorio, pero
más complicado resulta recoger en unas pocas páginas todos los recuerdos y
emociones que lo han acompañado, y agradecer a todas las personas que lo han
enriquecido y formado parte de esta experiencia. Por eso, estas páginas son
para vosotros.
Arancha y Blanca, mis mentoras científicas. Si hoy estoy escribiendo esta
Tesis es gracias a la oportunidad que me disteis de comenzar en la ciencia, a
vuestra guía y profesionalidad. A veces, las circunstancias no os ponen las cosas
fáciles, pero no por ello dejáis de trabajar y hacerlo de la mejor manera posible.
Gracias por vuestra confianza, cariño y cercanía. En estos años he aprendido y
crecido tanto científica como personalmente, y he superado retos que no
hubiera podido imaginar. Gracias.
César, mi primer contacto con el grupo Hígado. Siempre recordaré la
primera vez que entré en el despacho llena de nervios. Quien me iba a decir que
años después seguiría entrando, ahora ya sí, sin tanta vergüenza y con muchas
preguntas. Gracias por tu apoyo, consejos y tus palabras de ánimo. Gracias
también Marga, por tu interés, cariño y fuerza.
Gracias a María, la transmisora de los cuidados de mis queridas TβT.
Cuántas veces acudiste a mis llamadas de auxilio en mis comienzos. Gracias por
tu ayuda, sinceridad, confianza y apoyo, por haber estado dentro del
laboratorio, y más importante, seguir estando fuera de él. Gracias Annalisa, que
junto con María fuisteis las primeras en recibirme y enseñarme como era la vida
en laboratorio.
Gracias Nerea, mi vasca. Tu generosidad y compañerismo hacen fácil el
trabajo en grupo. Tu entrada en el laboratorio fue una gran elección, y ahora
parece mentira que haya pasado tanto tiempo desde entonces. Sería imposible
contar aquí tantas experiencias y momentos que hemos pasado juntas (risas,
muchas risas, pero también llantos, dramas, largos conciertos a cappella en el
animalario, cotilleos…). No sé si podría haber tenido una compañera mejor.
Gracias por estar ahí.
Gracias a todos los compañeros que por un corto o largo periodo de tiempo
habéis formado parte del grupo Hígado. Todos habéis contribuido de una una
manera u otra a mi aprendizaje y muchos de vosotros formáis ahora parte de mi
vida. Con especial cariño recuerdo a Ami, Chechu, Ceci, Esti, Sergio, Paulita...;
Nerea Deleyto, sentí mucho cuando te fuiste del laboratorio, por suerte, sigo
contando contigo como amiga. Sara Baak, we were lucky that you were part of
the group, you are an excelent colleague and person. Diana, maravilloso, gracias
Acknowledgements

por tu tiempo y dedicación en la portada. Rebequiña, una pena no haber
coincidido más tiempo en el laboratorio. Gracias por tu alegría, fuerza y cariño.
Estoy segura de que podrás hacer todo aquello que te propongas.
Gracias Almudena Porras, por tu cercanía y afecto. Y gracias a tu grupo,
indispensable apoyo en estos años. Gracias María Arechederra y Neibla por
vuestra ayuda y cariño en mis primeras etapas en el laboratorio; y también,
gracias Dani, que aun estando en Barcelona has seguido presente en el
laboratorio. Ha sido una suerte el haber podido encontrarnos a lo largo de estos
años. Como no, gracias Nerea Palao, Cristina, Celia, Sara, Noelia. Inolvidables
van a ser vuestros consejos de sabias para apoyo profesional y/o personal y las
reuniones higaporritos para tratar los distintos temas que iban aconteciendo.
Vuestra alegría hace el día a día mucho más fácil en el laboratorio. Celia, han
sido muchos años puerta con puerta, gracias por tu ayuda aquí, y por tus
indicaciones a mi llegada a Marsella. Nerea y Cris, mil gracias también por
vuestros abrazos, apoyo y preocupación en estos últimos meses.
Gracias a las nuevas y no tan nuevas incorporaciones: Paloma, Beatriz y
Álvaro. Gracias por vuestras palabras de ánimo, por dar un punto de vista
diferente y por ofrecer vuestra ayuda para lo que sea necesario. Estáis siendo
un apoyo para mí.
Gracias a todos los que formáis parte de esta pequeña familia que es el
Departamento y por haber formado también parte de mi etapa en él.
Gracias Oscar, Almudena Gómez, Mariola, Tamara, Elisa y Carlos, por
vuestro interés y ayuda.
Gracias al grupo del Dr. José Carlos Segovia por su colaboración en este
trabajo. Gracias María García Bravo, ha sido un placer trabajar contigo, tanto
por tu profesionalidad como por el trato que me has dado.
Flavio. Many thanks for opening me the doors of your lab. It has been an
excellent experience to be part of your group. Thanks for your energy, the
enthusiasm for science that you transmit and your positive words. Thanks
Fabienne and Rosanna for your advice and your help. Thank to rest of the
members of the group Sylvie, Fahmida, Sehrish, Diane and the students Marta,
Thomas and Alexia for your help and make me feel like part of the group.
Gracias especiales Serena por tu tiempo, tu atención y por nuestras
conversaciones en inglés/español latino.
No puedo olvidarme de mis francesas/españolas. Sin duda mi estancia en
Marsella no habría sido lo mismo sin vosotras, y por supuesto, los momentos en
el microscopio, hubieran sido insalvables. Irene, ojalá todo el mundo que tuviera
que instalarse una nueva ciudad encontrase a una anfitriona como tú. Gracias
por estar siempre pendiente de mí, por abrirme las puertas de tu casa y tu vida
y por mostrarme rincones de la ciudad. Patricia, gracias por tu fuerza, ayuda y

comprensión. Voy a copiar las palabras que alguien te dijo una vez “buena
científica y mejor persona”. Gracias a las dos por seguir estando presentes.
Sois muchos los familiares y amigos, viejos y nuevos, que fuera del
laboratorio os habéis interesado por mí durante todos estos años. Gracias por
vuestro cariño, interés y por vuestras palabras de ánimo que resultan mucho
más alentadoras cuando se escuchan desde la distancia.
Gracias Noe, Sonia, María, Oli y Leyre por los buenos momentos de re-
encuentro a lo largo de todos los años que llevo en Madrid. La vida nos ha
puesto a kilómetros de distancia y hace que muchas veces nos sea fácil
compartir momentos importantes como lo va a ser éste. De alguna manera,
siempre estáis presentes, y espero que sigáis estándolo. Gracias Marta por
comprenderme y entenderme tan bien, y por tu apoyo incondicional. Gracias
por tenerme siempre presente. Y gracias, como no, por nuestros tan necesarios
momentos de desconexión.
Gracias tía Petra por tu generosidad durante todos estos años, y por
cuidarme y preocuparte por mi como si fueras una madre.
Gracias a los coautores ocultos de esta tesis, mis padres, Antonio y Leo. Sin
duda todo lo que he conseguido es gracias a vosotros. Gracias por vuestra
educación y por los valores que me habéis transmitido. Gracias por vuestros
sacrificios, y por tanto amor.


1. Abstract ............................................................................... 1
2. Resumen .............................................................................. 7
3. Abbreviations .................................................................... 13
4. Introduction ....................................................................... 17
1. Liver damage ............................................................................................... 19
1.1. Liver fibrosis and cirrhosis ..................................................................... 20
1.1.1. Pathophysiology ............................................................................. 20
1.1.2. Diagnosis and therapy .................................................................... 23
1.2. Hepatocellular carcinoma (HCC) ............................................................ 23
1.2.1. Pathophysiology ............................................................................. 23
1.2.2. Diagnosis and therapy .................................................................... 25
2. Hepatic progenitor cell/oval cell regeneration ............................................ 26
2.1. Liver regenerative response................................................................... 26
2.2. HPC/oval cell generalities ...................................................................... 27
2.3. HPC/oval cell markers ............................................................................ 27
2.4. HPC/oval cell origin ............................................................................... 28
2.5. HPC/oval cell response .......................................................................... 28
2.6. HPC/oval cell in therapy ........................................................................ 30
2.7. HPC/oval cell in liver fibrosis and HCC .................................................... 31
3. Transforming growth factor β (TGF-β) ......................................................... 32
3.1. Signaling pathway.................................................................................. 32
3.2. TGF-β responses .................................................................................... 34
3.2.1. TGF-β and growth inhibition ........................................................... 34
3.2.2. TGF-β and apoptosis ....................................................................... 35
3.2.3. TGF-β and epithelial to mesenchymal transition (EMT) ................... 36
3.3. Physiological and pathological activities of TGF-β in the liver.............................................................................................................. 38
3.3.1. TGF-β in liver fibrosis ...................................................................... 38
3.3.2. TGF-β in HCC .................................................................................. 41
4. Hepatocyte growth factor (HGF)/Met ......................................................... 43
Index

4.1. Signaling pathway.................................................................................. 43
4.2. Physiological and pathological activities of HGF/Met in the liver.............................................................................................................. 46
4.2.1. HGF/Met in liver regeneration ........................................................ 46
4.2.2. HGF/Met in HCC ............................................................................. 47
5. Senescence .................................................................................................. 49
5.1. Biomarkers ............................................................................................ 50
5.2. Physiological and pathological senescence ............................................ 51
5. Background…………………………………………..…….. .................. 55
6. Aims………………………………………………….. ............................ 65
7. Materials and methods…………………….……………… .............. 69
1. Cell culture .................................................................................................. 71
1.1. Cell models ............................................................................................ 71
1.2. Cell culture conditions ........................................................................... 72
1.3. Growth factors and inhibitors ................................................................ 73
2. DNA analysis................................................................................................ 74
2.1. DNA isolation from cultured cells........................................................... 74
2.2. DNA isolation from liver tissue............................................................... 74
2.3. Polymerase chain reaction (PCR) ........................................................... 75
3. mRNA expression analysis ........................................................................... 75
3.1. Total RNA extraction.............................................................................. 75
3.2. cDNA synthesis (reverse transcription, RT)............................................. 76
3.3. Quantitative reverse transcription PCR (RT-qPCR) .................................. 76
4. Protein expression analysis ......................................................................... 77
4.1. Protein expression analysis by western blot........................................... 77
4.1.1. Cell extract preparation .................................................................. 77
4.1.2. Protein quantification ..................................................................... 78
4.1.3. Protein electrophoresis and blotting ............................................... 79
4.1.4. Protein transfer .............................................................................. 79
4.1.5. Immunodetection ........................................................................... 79
4.2. Protein expression analysis by immunoprecipitation assay .................... 81
4.3. Protein expression analysis by flow cytometry ....................................... 81
4.4. Protein expression analysis by immunocytochemistry ........................... 82
4.5. Protein expression analysis by immunohistochemistry and immunofluorescence in hepatic tissues ........................................................ 84

4.5.1. pSMAD2 staining on liver sections paraffin embedding and immunohistochemistry ...................................................................... 84
4.5.2. Detection of GFP by confocal microscopy/immunofluorescence ........................................................... 85
5. Clonogenic assay ......................................................................................... 86
6. Spheres formation assay ............................................................................. 86
7. Analysis of cell number ............................................................................... 87
7.1. Analysis of cell number in the presence of serum .................................. 87
7.2. Analysis of cell number in the absence of serum .................................... 87
8. Invasion assay ............................................................................................. 87
9. Analysis of MMP2 and MMP9 activities by zymography ............................. 88
10. Senescence associated β-galactosidase staining (SA-β-Gal)....................... 89
11. Analysis of apoptosis by propidium iodide (PI) staining ............................ 89
12. Measurement of intracellular ROS ............................................................ 90
12.1. Analysis by confocal microscopy .......................................................... 90
12.2. Analysis by flow cytometry .................................................................. 90
13. Gene silencing by siRNA ........................................................................... 90
14. Intrasplenic transplantation of oval cells ................................................... 90
14.1. Sample collection ................................................................................ 91
15. Analysis of serum parameters ................................................................... 91
16. Histopathological analysis of liver damage ................................................ 92
17. Statistical analysis ..................................................................................... 92
8. Results ............................................................................... 93
1. TGF-β induces partial EMT in oval cells....................................................... .95
1.1. TGF-β induces phenotypic changes in oval cells ..................................... 95
1.2. TGF-β-induced EMT in oval cells is associated with decreased stemness 97
1.3. TGF-β-induced EMT in oval cells is associated with alterations in hepatic lineage markers.......................................................................................... 100
1.4. TGF-β-induced EMT in oval cells is associated with alterations in the autocrine signaling ..................................................................................... 102
1.5. TGF-β-induced EMT in oval cells confers functional advantages ........... 103
1.6. EMT enhances oval cells repopulation capacity in a damaged liver ...... 105
2. Relevance of HGF/Met pathway in TGF-β-induced EMT in oval cells ........ 110
2.1. Lack of Met tyrosine kinase activity induces replicative senescence and impedes oval cell expansion after chronic EMT ................. 110
2.2. Met tyrosine kinase activity is essential for oval cell expansion and contributes to TβT-OC properties ............................................................... 113
2.3. EMT-induced senescence in Met deficient oval cells is associated with oxidative stress and decreased Twist expression ........................................ 118
3. Relevance of the crosstalk between HGF/Met and TGF-β in hepatocellular carcinoma...................................................................................................... 123
3.1. TGF-β signaling pathway is activated prior to tumor appearance and during tumor development in Alb-R26Met mice. .......................................... 123
3.2. Activation of TGF-β signaling pathway inversely correlates with Met expression levels in HCC lines derived from Alb-R26Met mice ...................... 124
3.3. TGF-β-dependent transcriptional activity is enhanced in HCC cells with low levels of Met ........................................................................................ 126
3.4. HCC lines with low levels of Met are more sensitive to anti-proliferative and apoptotic effects of TGF-β ................................................................... 128
9. Discussion ........................................................................ 131
1. HGF/Met signaling is essential to allow oval cells expansion after TGF-β-induced EMT ................................................................................................. 133
2. Interaction between HGF and TGF-β in HCC. A pro-survival role for the HGF/Met axis ................................................................................................ 140
3. General discussion ..................................................................................... 142
10. Conclusions .................................................................... 145
11. References ..................................................................... 149
12. Annexes ......................................................................... 177

1. Abstract

3
Crosstalk between HGF and TGF-β signaling
pathways in adult liver progenitor cells and
hepatocellular carcinoma cells
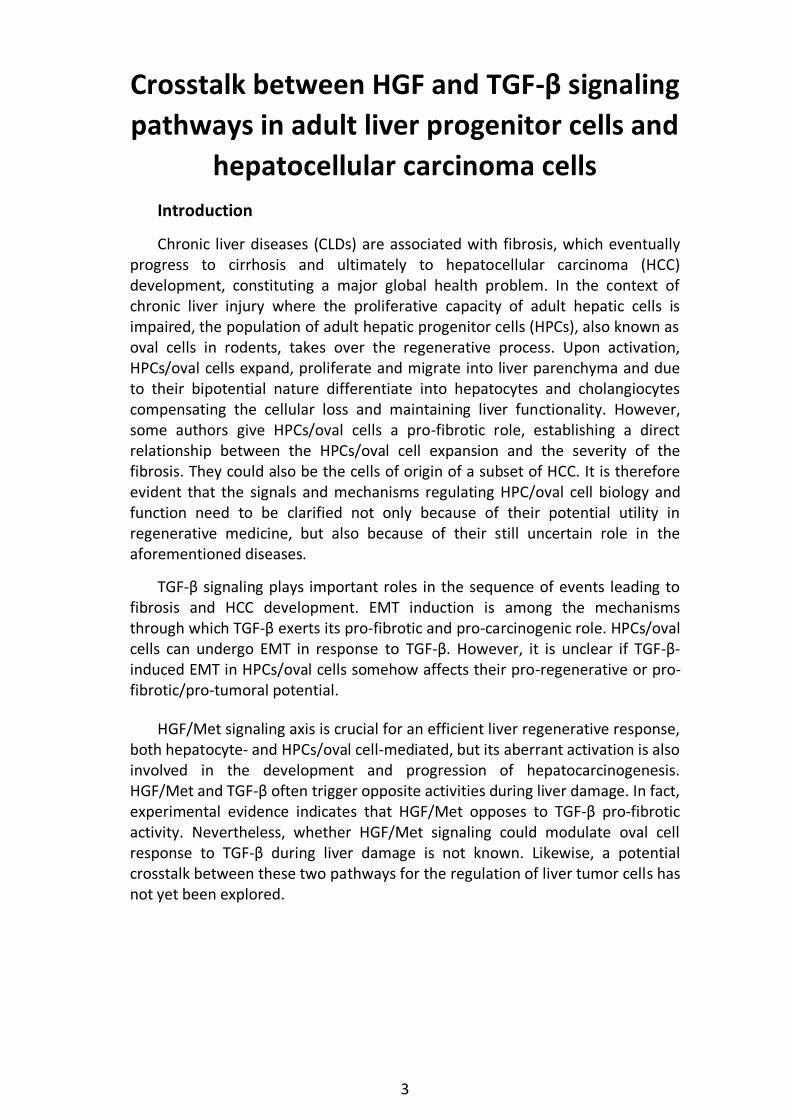
Introduction
Chronic liver diseases (CLDs) are associated with fibrosis, which eventually progress to cirrhosis and ultimately to hepatocellular carcinoma (HCC) development, constituting a major global health problem. In the context of chronic liver injury where the proliferative capacity of adult hepatic cells is impaired, the population of adult hepatic progenitor cells (HPCs), also known as oval cells in rodents, takes over the regenerative process. Upon activation, HPCs/oval cells expand, proliferate and migrate into liver parenchyma and due to their bipotential nature differentiate into hepatocytes and cholangiocytes compensating the cellular loss and maintaining liver functionality. However, some authors give HPCs/oval cells a pro-fibrotic role, establishing a direct relationship between the HPCs/oval cell expansion and the severity of the fibrosis. They could also be the cells of origin of a subset of HCC. It is therefore evident that the signals and mechanisms regulating HPC/oval cell biology and function need to be clarified not only because of their potential utility in regenerative medicine, but also because of their still uncertain role in the aforementioned diseases.
TGF-β signaling plays important roles in the sequence of events leading to fibrosis and HCC development. EMT induction is among the mechanisms through which TGF-β exerts its pro-fibrotic and pro-carcinogenic role. HPCs/oval cells can undergo EMT in response to TGF-β. However, it is unclear if TGF-β-induced EMT in HPCs/oval cells somehow affects their pro-regenerative or pro-fibrotic/pro-tumoral potential.
HGF/Met signaling axis is crucial for an efficient liver regenerative response, both hepatocyte- and HPCs/oval cell-mediated, but its aberrant activation is also involved in the development and progression of hepatocarcinogenesis. HGF/Met and TGF-β often trigger opposite activities during liver damage. In fact, experimental evidence indicates that HGF/Met opposes to TGF-β pro-fibrotic activity. Nevertheless, whether HGF/Met signaling could modulate oval cell response to TGF-β during liver damage is not known. Likewise, a potential crosstalk between these two pathways for the regulation of liver tumor cells has not yet been explored.

4
Aims
TGF-β and HGF/Met pathways are important mediators during liver regeneration, fibrosis and hepatocarcinogenesis and play roles on different liver cell populations. Taking this into consideration, the general objective of this work was to analyze the relevance of the crosstalk between TGF-β and HGF/Met pathways in oval cell biology and fate in a context of chronic liver injury as well as to explore if such crosstalk could play a role during hepatocarcinogenesis.
To achieve this general objective, we propose three specific objectives:
Objective 1: To characterize the TGF-β-induced EMT response in oval cells in vitro and to evaluate the effects on oval cell fate upon transplantation into a fibrotic liver.
Objective 2: To elucidate the HGF/Met signaling-mediated regulation on the EMT response induced by TGF-β and its contribution to oval cell properties.
Objective 3: To analyze the TGF-β pathway in liver tumor cells from Met-overexpressing livers and how affects tumor cell growth and survival properties.
Results
Our results show that oval cells suffer a partial EMT in response to chronic TGF-β treatment. After EMT, oval cells display profound changes in their phenotype and properties. Besides the loss of some epithelial markers and gain of mesenchymal markers, cells acquire proliferative, survival and invasive advantages. However, these changes are not associated with stemness but rather with induction of differentiation along the hepatic lineage. Importantly, these changes confer oval cells a greater in vivo regenerative capacity being able to attenuate liver damage when transplanted into mice submitted to CCl4-induced liver fibrosis. Moreover, our results reveal that HGF/Met signaling pathway is essential to allow oval cell expansion after TGF-β-induced EMT. In the absence of Met tyrosine kinase activity oval cells enter into a senescence process concomitant with an exacerbated oxidative stress. In this respect, we have uncovered a novel role for Twist as a downstream mediator of HGF/Met antioxidant activity against TGF-β-induced oxidative stress in oval cells. Additionally, HGF/Met signaling pathway contributes to the phenotypic and functional properties of oval cells after EMT, counterbalancing the mesenchymal switch while promoting proliferation, survival and invasion.
On the other hand, we provide preliminary evidence on the activation of the TGF-β pathway in livers with moderate Met overexpression and in subsequently developed tumors. We also provide preliminary evidence on reciprocal regulatory interactions between HGF/Met and TGF-β signaling pathways in tumor cell lines derived from these livers. Thus, high levels of Met lead to constitutive Met activation and a decrease in TGF-β-triggered Smad activation,

5
whereas TGF-β decreases Met phosphorylation in Met-low overexpressing HCC cells. Notably, this signaling interplay affects tumor cell properties. In fact, our results suggest that Met kinase activity is critical for tumor cell survival and protection against TGF-β-induced apoptosis.
Conclusions
1. Chronic treatment of oval cells with TGF-β leads to a stable and partial EMT phenotype.
2. TGF-β-induced EMT in oval cells does not increase stemness but rather promotes differentiation along the hepatic lineage, while conferring proliferation, survival and invasion advantages in vitro.
3. Oval cells chronically treated with TGF-β attenuate CCl4-induced liver
damage and fibrosis upon transplantation.
4. HGF/Met signaling activation is required to overcome the oxidative stress-induced senescence and allow oval cell expansion after TGF-β-induced EMT.
5. Twist is a downstream target of HGF/Met in oval cells that mediates the antioxidant activity driven by HGF/Met signaling and prevents cell senescence.
6. HGF/Met signaling modulates TGF-β-induced EMT phenotype in oval cells contributing to cell proliferation, survival and invasive advantages while counterbalancing the mesenchymal phenotypic switching.
7. HCC cell lines derived from Alb-R26Met mice show negative regulatory circuits between HGF and TGF-β signaling pathways. Thus, HCC cells with high levels of Met show an attenuation of TGF-β-triggered Smad signaling, whereas TGF-β is able to decrease Met phosphorylation but only in HCC cells with low overexpression of levels of Met.
8. HCC cell lines derived from Alb-R26Met mice show dependence on Met signaling for cell survival and protection against TGF-β.


2. Resumen


9
Interacción entre las vías de HGF y TGF-β
en células progenitoras adultas hepáticas y
células de hepatocarcinoma
Introducción
Las enfermedades hepáticas crónicas (CLD) están asociadas con fibrosis, que eventualmente progresa a cirrosis, y en último término al desarrollo de un carcinoma hepatocelular (HCC), y constituyen un importante problema de salud global. En este contexto de daño hepático crónico en el que la capacidad regenerativa de las células maduras hepáticas se ve comprometida, es la población de células progenitoras adultas (HPCs), también conocidas como células ovales en modelos murinos, la que va a tomar las riendas del proceso de regeneración hepática. Tras su activación, las HPCs/células ovales se expanden, proliferan y migran en el parénquima hepático y gracias a su naturaleza bipotencial se diferencian a hepatocitos y colangiocitos, compensando así la pérdida de masa hepática y manteniendo la funcionalidad hepática. Sin embargo, algunos autores dotan a las HPCs/células ovales de un papel pro-fibrótico, estableciendo una relación directa entre su expansión y la severidad de la fibrosis. Estas células también pueden ser el origen celular de algunos subtipos de HCC. Resulta por tanto evidente la necesidad de estudiar las señales y mecanismos que regulan la biología y la función de estas células, no solo por su potencial utilidad en medicina regenerativa sino también por su papel aún no claro en las ya mencionadas enfermedades hepáticas.
La vía de señalización del TGF-β es clave en los distintos eventos que conducen a un proceso fibrótico y al desarrollo del HCC. La inducción de EMT es uno de los mecanismos a través de los cuales el TGF-β lleva a cabo su papel pro-fibrótico y pro-tumoral. Las HPCs/células ovales pueden sufrir EMT en respuesta al TGF-β. Sin embargo, no está claro si esta respuesta influye en su potencial pro-regenerativo o pro-fibrótico/pro-tumoral.
La vía de señalización de HGF/Met es fundamental para una regeneración hepática eficiente, tanto la llevada a cabo por las células maduras como la mediada por las HPCs/células ovales, aunque una activación aberrante de esta vía también está implicada en el desarrollo y la progresión de la carcinogénesis hepática. HGF/Met y TGF-β a menudo tienen papeles opuestos en el daño hepático crónico. De hecho, las evidencias experimentales indican que HGF/Met se opone a los efectos pro-fibróticos de TGF-β. Sin embargo, no se sabe si el HGF podría regular la respuesta de las HPCs/células ovales al TGF-β durante el daño hepático. Asimismo, tampoco se ha explorado una posible interacción entre estas dos vías de señalización en la regulación de las células tumorales hepáticas.

10
Objetivos
El objetivo general de este trabajo ha sido analizar la relevancia de la interacción cruzada entre las vías de TGF-β y HGF/Met en la biología y el destino de la célula oval en el hígado dañado, así como estudiar si dicha interacción podría intervenir en procesos de hepatocarcinogenesis.
Para conseguir este objetivo proponemos tres objetivos específicos: Objetivo 1: Caracterizar la respuesta de EMT inducida por TGF-β en las
células ovales in vitro y evaluar sus efectos en el destino de la célula oval tras su trasplante en un hígado fibrótico.
Objetivo 2: Elucidar la regulación medida por la vía de HGF/Met sobre la
respuesta de EMT inducida por TGF-β y su contribución a las propiedades de la célula oval.
Objetivo 3: Analizar la vía de TGF-β en células tumorales hepáticas
procedentes de hígados con sobre-expresión de Met y cómo esta vía podría afectar al crecimiento y supervivencia de la célula tumoral.
Resultados
Nuestros resultados muestran que las células ovales sufren un proceso de EMT parcial en respuesta al tratamiento crónico con TGF-β. Este proceso provoca profundos cambios en el fenotipo y las propiedades de las células. Además de la pérdida de algunos marcadores epiteliales y la adquisición de marcadores mesenquimales, estas células adquieren ventajas proliferativas, de supervivencia e invasión. Sin embargo, estos cambios desencadenados por la EMT no están asociados con la adquisición de marcadores y propiedades de célula madre, sino con la inducción de diferenciación hacia el linaje del hepatocito. Es importante destacar que estos cambios confieren a las células ovales una mayor capacidad regenerativa in vivo, siendo capaces de atenuar el daño hepático cuando son trasplantadas en ratones con un proceso de fibrosis hepática inducida por CCl4. Adicionalmente, nuestros resultados revelan que la vía de HGF/Met es esencial para permitir la expansión de la /célula oval tras la inducción de EMT por TGF-β. En ausencia de la actividad tirosina quinasa de Met las células ovales entran en senescencia, proceso que es simultáneo a un estrés oxidativo exacerbado. En este sentido, hemos descubierto un nuevo papel para Twist como mediador de la actividad antioxidante de HGF/Met frente al estrés oxidativo inducido por TGF-β en células ovales. La vía de HGF/Met también contribuye a las características fenotípicas y funcionales de las células ovales adquiridas después de la EMT, contrarrestando la transición mesenquimal a la vez que promueve la proliferación, supervivencia e invasión.
Por otro lado, con este trabajo mostramos evidencias preliminares de la activación de la vía de señalización de TGF-β en hígados de ratón con sobreexpresión moderada de Met y en los tumores hepáticos que desarrollan, así como de la existencia de interacciones regulatorias recíprocas entre las vías

11
de HGF/Met y TGF-β en líneas de células tumorales derivadas de estos hígados. Así, niveles altos de Met conducen a su activación constitutiva y a una disminución en la activación de Smads por TGF-β, mientras que el TGF-β disminuye la fosforilación de Met en células tumorales con una baja sobreexpresión de Met. Esta interacción a nivel de señalización afecta a las propiedades de la célula tumoral. De hecho, nuestros resultados sugieren que la actividad quinasa de Met es crítica para la supervivencia y la protección de las células tumorales frente a la apoptosis inducida por TGF-β.
Conclusiones
1. El tratamiento crónico con TGF-β induce en las células ovales un fenotipo EMT parcial y estable.
2. La inducción de EMT por TGF-β en las células ovales no conlleva un incremento en los marcadores y propiedades de célula madre, sino que promueve la diferenciación hacía el linaje hepático, confiriendo, además, ventajas proliferativas, de supervivencia e invasivas in vitro.
3. El trasplante de las células ovales crónicamente tratadas con TGF-β atenúan el daño hepático y la fibrosis inducidos por CCl4.
4. La activación de la vía de HGF/Met es esencial para superar la senescencia producida por estrés oxidativo y permitir la expansión de la célula oval tras la inducción de EMT por TGF-β.
5. Twist es una diana de la vía de señalización de HGF/Met en las células ovales que media la actividad antioxidante ejercida por HGF/Met previniendo la senescencia celular.
6. La vía de señalización de HGF/Met modula el fenotipo EMT inducido por TGF-β en las células ovales contribuyendo así a las ventajas proliferativas, de supervivencia e invasivas a la vez que contrarresta el cambio fenotípico mesenquimal.
7. Las células de hepatocarcinoma obtenidas de los ratones Alb-R26Met
muestran un circuito de regulación negativa entre las vías de señalización de HGF y TGF-β. Así, las células de hepatocarcinoma con altos niveles de Met muestran una atenuación de la señalización desencadenada por TGF-β a través de las Smad, mientras que TGF-β es capaz de reducir la fosforilación de Met, pero solo en las células de hepatocarcinoma con una baja sobreexpresión de Met.
8. La supervivencia y la protección frente al TGF-β de las células de hepatocarcinoma obtenidas de los ratones Alb-R26Met es dependiente de la señalización de Met.


13
AFP alpha-Fetoprotein AKT AK strain Transforming ALB Albumin ALK Activin receptor-Like Kinase ALT Alanine aminotransferase AMH Anti-Mullerian Hormone AST Aspartate aminotransferase BCL-2 B-Cell Lymphoma 2 BIM BCL-2-like-11 BMF BCL-2 Modifying Factor BMP Bone Morphogenetic Proteins BSA Bovine Serum Albumin C-CBL Casitas B-Lineage Lymphoma CCL4 Carbon Tetrachloride CIEMAT Centro de Investigaciones Energéticas, Medioambientales y Tecnológicas CK Cytokeratin CKI Cyclin Dependent Kinase Inhibitors CLD Chronic Liver Disease CO-SMAD Cooperating SMAD CRK v-crk sarcoma virus CT10 oncogene homolog CTGF Connective Tissue Growth Factor CYP Citocrome DAPI 4′,6-diamidino-2-phenylindole DAP-KINASE Death-Associated Protein Kinase DCFH-DA 2′,7′-dichlorofluorescein dihydro diacetate DDC 3,5-diethoxycarbonyl-1,4-dihidro-collidine DMEM Dulbecco's Modified Eagle Medium DMSO Dimethyl Sulfoxide DNA Deoxyribonucleic Acid DTT Dithiothreitol ECAR Extracellular Acidification Rate ECM Extracellular Matrix EDTA Ethylenediaminetetraacetic Acid EGF Epidermal Growth Factor EGFR EGF Receptor EMT Epithelial to Mesenchymal Transition EMT-TF EMT Transcription Factors EPCAM Epithelial Cell Adhesion Molecule ERK Extracellular Signal-Regulated Kinases F.I. Fluorescence Intensity FAK Focal Adhesion Kinase FASL Fas Ligand FBS Foetal Bovine Serum FGF Fibroblast Growth Factor
GAB1 GRB2 Associated Binding Protein 1 GDP Growth Differentiation Factor GFP Green Fluorescence Protein GGT gamma-Glutamyltransferase
3. Abbreviations

14
GRB2 Growth Factor Receptor Bound Protein 2 H&E Hematoxylin and Eosin HCC Hepatocellular Carcinoma HCSC Hospital Clínico San Carlos HGF Hepatocyte Growth Factor HNF Hepatocyte Nuclear Factor HPC Hepatic Progenitor Cell HSC Hepatic Stellate Cell IB Immunoblotting ICAM1 Intercellular Adhesion Molecule 1 IFNα Interferon alfa IGF-I Insulin-like Growth Factor I IL Interleukin IP Immunoprecipitation IPT Immunoglobulin-like domains shared by Plexins and Transcriptional factors I-SMAD Inhibitory SMAD JNK c-Jun N-terminal kinase KC Kupffer Cells LAP Latency-Associated Peptide MAPK Mitogen-Activated Protein Kinase MET Mesenchymal to Epithelial Transition MFB Myofibroblasts miRNA microRNA MIS Müllerian Inhibiting Substance MMP Matrix Metalloproteinase MOI Multiplicity of Infection mTOR mammalian Target of Rapamycin NADPH Nicotinamide Adenine Dinucleotide Phosphate NAFLD Non-Alcoholic Fatty Liver Disease N-CAM Neural Cell Adhesion Molecule NF-ΚB Factor kappa-Light-chain-enhancer of activated B cells NT Non-Targeting OC Oval Cell OCR Oxygen consumption rate PAI1 Plasminogen Activator Inhibitor-1 PBS Phosphate Buffered Saline PCR Polymerase Chain Reaction PDGF Platelet Derived Growth Factor PFA Paraformaldehyde PI Propidium Iodide PI3K PhosphatidylInositol 3-kinase PLCγ Phospholipase C gamma PSI Plexin-Semaphorin-Integrin PTP1B Protein Tyrosine Phosphatase 1B RB Retinoblastoma Protein RNA Ribonucleic Acid
ROS Reactive Oxygen Species R-SMAD Receptor-associated SMAD RTK Receptor Tyrosine Kinase RT-qPCR quantitative Reverse Transcription-Polymerase Chain Reaction S.D. Standard Deviation S.E.M. Standard Error Of The Mean

15
SAHF Senescence-Associated Heterochromatic Foci SASP Senescence-Associated Secretory Phenotype SA-β-GAL Senescence-Associated beta-Galactosidase SDF1 Stromal cell-Derived Factor 1 SDS Sodium Dodecyl Sulphate SDS-PAGE SDS Polyacrylamide Gel Electrophoresis SF Scatter Factor SHC SH2 domain-containing transforming protein SHP2 Src Homology 2 domain-containing Phosphatase-2 siRNA Small interference RNA STAT Signal Transducers and Activators of Transcription TE buffer Tris-EDTA buffer TERT Telomerase Reverse Transcriptase THY-1 Thymocyte Differentiation Antigen 1 TIEG1 TGF-β-Inducible Early Response Gene 1 TIMP Tissue Inhibitors of Metalloproteinase TNF-α Tumor Necrosis Factor alfa TNF-β Transforming Growth Factor beta
TPBS Tween 20-PBS
TTBS Tween 20-Tris-Buffered Saline TU Transducing Units TWEAK Tumor Necrosis factor-like weak inducer of apoptosis TβR TGF-β Receptor TβT-OC Oval Cells chronically treated with TGF-β VEGF Vascular Endothelial Growth Factor ZEB Zinc finger E-box-Binding homeobox ZO-1 Zonula Occludens 1 α-SMA alfa Smooth Muscle Actin


4. Introduction


19
Figure 1. Structure of the hepatic lobule. a) The portal triad consists of a bile duct, hepatic artery and portal vein. Blood from the portal vein and hepatic artery flows through sinusoids to the central vein. Bile is excreted by hepatocytes, and flows through canaliculus to the bile ducts formed by cholangiocytes. The canal of Hering conducts bile from bile canaliculi to terminal bile ducts. b) Each hepatic lobule is formed by a central vein and 6 portal triads. Adapted from Duncan et al., 2009.
1. Liver damage The liver, composed of parenchymal cells (hepatocytes and cholangiocytes)
and non-parenchymal cells (endothelial cells, Kupffer cells (KC), lymphocytes and hepatic stellate cells (HSCs)), is a vital organ with a unique capacity to regenerate in response to liver damage (Itoh and Miyajima, 2014).
The functional unit of the liver is the hepatic lobule. The lobules are demarcated by portal triads, which consist of a portal vein, a hepatic artery and a bile duct. Blood enters the liver from portal vein and hepatic artery and flows through liver sinusoids towards the central vein. Row of hepatocytes is delimited by endothelium forming the sinusoids, which facilitate interaction between the blood and hepatocyte cell surface. Bile secreted by hepatocytes is collected into bile canaliculus, which is finally connected with bile ducts formed by cholangiocytes (bile duct epithelial cells) via the canal of Hering (Duncan et al., 2009).
A number of insults, including viral activity (chronic hepatitis C virus and
hepatitis B virus), chemical toxicity and metabolic overload, result in liver damage and hepatocyte and cholangiocyte death. Liver injury triggers a cascade of molecular and cellular reactions oriented towards damage limitation. Briefly,
20
the initial event of liver damage is liver epithelial cell stress, resulting in necrotic and/or apoptotic death. Death-mediated signals induce the activation of an inflammatory and wound healing response that might lead to tissue regeneration and repair in an acute damage. However, in chronic liver disease (CLD), the liver injury continues and the inflammation and wound healing become persistent. Finally, tissue remodeling goes awry, becomes inefficient, and results in fibrosis and cirrhosis, context in which hepatocellular carcinoma (HCC) could develop and deadly hepatic failure could occur. The number of patients with CLD is increasing, and CLD is becoming a common and difficult clinical challenge (Dooley and ten Dijke, 2012; Weiskirchen and Tacke, 2016).
1.1. Liver fibrosis and cirrhosis
Liver cirrhosis is the 13th most common cause of death in adults worldwide and the 4th among chronic diseases with 1,2 million deaths per year. Globally, the main causes of fibrosis and cirrhosis are, in this order, infection with hepatitis C virus, infection with hepatitis B virus and alcohol abuse (Rowe, 2017).
1.1.1. Pathophysiology
Liver fibrosis is a complex wound healing process characterized by an imbalance between extracellular matrix (ECM) synthesis and degradation in favor of deposition of ECM proteins. In the first stages of liver damage, liver fibrosis tries to encapsulate the injury in an attempt to limit its consequences and it is considered a reversible process. If injury is maintained, this process ultimately progresses to advanced fibrosis or cirrhosis, which might be irreversible, situation that occurs during a CLD (Ebrahimi et al., 2016). Cirrhosis is defined as an advanced stage of fibrosis characterized by regenerative nodules of liver parenchyma, which are encapsulated in fibrotic septa and associated with angioarchitectural changes (Pinzani, 2015). Together with chronic activation of the wound healing response, other different pro-fibrogenic mechanisms have been identified, including oxidative stress, disarrangement of epithelial-mesenchymal interactions, epithelial to mesenchymal transition (EMT) of parenchymal cells, hepatocyte loss and chronic inflammation (Czaja, 2014; Lee et al., 2014; Parola and Pinzani, 2019).
The principal source of ECM accumulation in the wound healing reaction is the activity of myofibroblasts (MFB). Different cell types have been proposed to be the origin of MFB, but undoubtedly, the major source of fibrogenic cells are portal fibroblasts and HSCs (Iwaisako et al., 2014).
HSCs are non-parenchymal liver cells that function as a major site of storage of vitamin A, constituting the largest reservoir of vitamin A in the body. In pathologic conditions, HSCs suffer a trans-differentiation process triggered by reactive oxygen species (ROS), pro-inflammatory and mitogenic cytokines and growth factors such as tumor necrosis factor alfa (TNF-α), transforming growth factor beta (TGF-β) or platelet derived growth factor (PDGF), changing from a quiescent phenotype to an activated myofibroblast state. MFB are characterized

21
by the expression of α-smooth muscle actin (α-SMA) protein, loss of lipid and retinoid storages, increased proliferation, survival, migration and contraction capacities, and secretion of pro-inflammatory cytokines and chemokines (Ebrahimi et al., 2016; Mallat and Lotersztajn, 2013). Furthermore, MFB contribute to the fibrous scar present in CLD by synthesizing large amounts of ECM proteins, specifically type I and type III collagen, and regulating ECM degradation. MFB express combinations of matrix metalloproteinases (MMPs) and tissue inhibitors of metalloproteinases (TIMPs) that degrade normal liver matrix, while inhibiting degradation of the accumulated fibrillary collagen in liver fibrosis. Although MMPs and TIMPS expression in MFB are thought to play central roles in the development of CLD, it has been suggested that hepatocyte-derived MMPs are also important mediators of the ECM turnover (Benyon and Arthur, 2001; Duarte et al., 2015; Mallat and Lotersztajn, 2013).
In addition to HSCs and fibroblasts, other cell types can suffer a myofibroblastic differentiation and therefore contribute to ECM accumulation (Weiskirchen et al., 2018; Wells, 2008). Thus, bone marrow fibrocytes (small subset of mononuclear bone marrow cells, that transmigrate to liver through the blood stream in response to injury), vascular smooth muscle cells, endothelial cells, pericytes and epithelial cells may undergo EMT (Rowe et al., 2011; Rygiel et al., 2008; Zeisberg et al., 2007), although the epithelial origin of MFB is still under debate.
Apart from the wound healing response, other processes take place during CLD. For example, oxidative stress with formation and degradation of ROS is a crucial part of fibrosis development and persistence. Intracellular sources of ROS include the mitochondrial electron transport chain and extra-mitochondrial ROS generating enzymes (Richter and Kietzmann, 2016). Among these, the NOX family of nicotinamide adenine dinucleotide phosphate oxidases (NADPH oxidases) appears to have a key role during liver fibrosis, being NOX4 the isoform with a more critical role in ROS production under pro-fibrogenic conditions (Crosas-Molist et al., 2015; De Minicis et al., 2010; Paik et al., 2014). ROS production contributes to the fibrotic process directly or indirectly by sustaining inflammation and/or increasing the production of chemokines or growth factors. At this respect, it is worth mentioning that ROS can activate latent TGF-β, which further promotes ROS production and oxidative stress. All these mechanisms can in turn increase fibrosis. More specifically, ROS contribute to transdifferentiate HSC to MFB. Additionally, ROS may activate proliferation, migration and differentiation of fibroblasts, and ROS can induce EMT and are responsible for apoptosis of epithelial cells and/or ECM deposition (Richter and Kietzmann, 2016).
Among the cytokines involved in CLD, TGF-β has a major pro-fibrotic role and acts as the main orchestrator of the injury. Because of its importance, roles of TGF-β during CLD will be discussed in 3.3 section.
Inflammation is also a central pathogenic mechanism of liver disease. A number of signaling molecules and executor cells are involved in this process (Dooley and ten Dijke, 2012). Activation of KC, HSCs and MFB, and dying cells,

22
Figure 2. Pathogenesis of hepatic fibrosis. Prolonged liver injury results in fibrosis/cirrhosis where HSCs are key mediators. HSCs transdifferentiate to MFB by soluble mediators (chemokines/cytokines, ROS, growth factors) released by immune cells (KC, leukocytes) and other cell types including damaged hepatocytes and cholangiocytes. The pool of MFB is further increased by different cells (resident fibroblasts, hepatocytes, cholangiocytes, bone marrow fibrocytes, pericytes and endothelial cells) that acquire pro-fibrotic activities and become ECM producers. MFB, positive for α-SMA, display an increased proliferation, survival, migration and contraction capacities, and are the predominant source of collagen deposition. Moreover, ECM homeostasis is disturbed during fibrotic process through the increase of expression of TIMPs, decrease of matrix MMPs or the expression of pro-fibrotic MMPs. Adapted from Ralf Weiskirchen et al., 2018.
like hepatocytes, produce cytokines (TNF-α, interleukin (IL)-1α/β, IL-6, IL-12, IL-18) and trigger the infiltration of macrophages, lymphocytes and eosinophils cells, which are responsible for a persistent inflammatory response (Weiskirchen and Tacke, 2016; Zhou et al., 2014). It is worthy to note that KC play a key role in the initiation and maintenance of the inflammatory response that sustains the fibrotic process. After activation, KC express chemokine receptors and secret various cytokines contributing to activate HSCs (Ebrahimi et al., 2016).
23
1.1.2. Diagnosis and therapy
Defining the disease state is essential in deciding the therapeutic choices and predicting prognosis. Liver biopsy is considered the gold standard method for assessing liver fibrosis but it has limitations such as invasiveness and sampling errors. Liver fibrosis is a heterogeneous process, often the obtained tissue does not represent the whole liver pathology and its analysis is subjected to observer variability. That is why other non-invasive methods have been developed. Imaging diagnostic modalities, including ultrasound-based or magnetic resonance imaging, and laboratory tests based on the detection of biochemical and hematological serum markers are other alternatives (Cheng and Wong, 2017; Ebrahimi et al., 2016).
Concerning the treatment, patients with fibrosis and cirrhosis caused by hepatitis virus infection show regression of liver fibrosis upon anti-viral therapy. In the case of non-alcoholic fatty liver disease (NAFLD), controlling metabolic risk factors is the option to improve liver fibrosis. Advances in the knowledge of the disease mechanisms are allowing the development of new treatments focused on HSCs regulation, collagen synthesis inhibition, blocking TGF-β action and inflammatory response control. Unfortunately, although some of these strategies work well in pre-clinical models, none of them has been translated into effective therapies in human so far (Cheng and Wong, 2017; Koyama et al., 2016).
1.2. Hepatocellular carcinoma (HCC)
Faery liver cancer association estimates that liver cancer is the second largest cause of cancer-related deaths (600,000 deaths each year) worldwide. HCC is the most common primary malignancy of the liver (80%-90% of all primary liver cancers) and the fourth most common cancer worldwide. Due to the asymptomatic nature in the early stages of the disease, the majority of HCC cases are detected in advanced stages, leading to incurable disease states (https://www.bluefaery.org/statistics).
Although HCC has a multitude of etiological risk factors, the development of HCC is closely related to the presence of CLD. In fact, around 80%-90% of HCC cases occur in the setting of underlying cirrhosis secondary to viral hepatitis (specifically hepatitis B virus or hepatitis C virus) or other non-viral CLD (Forner et al., 2012; Ghouri et al., 2017).
1.2.1. Pathophysiology
HCC is the result of a long-term process that begins with a pre-malignant stage that progresses to a dysplastic stage and ends in a malignant one. Hepatocarcinogenesis involves dysregulation of a number of molecular pathways as well as genetic alterations that ultimately lead to malignant transformation and HCC disease progression (Liu et al., 2014). It can originate from various cell types, including mature hepatocytes and stem or progenitor cells (Llovet et al., 2016). HCC hallmarks, as for other types of tumours, are

24
sustained cell proliferation, ability to evad growth suppression, resistance to cell death, invasion, metastasis, angiogenesis and deregulated energy metabolism (Liu et al., 2014).
HCC is a complex and heterogeneous disease both clinically and histopathologically, with a wide array of genetic and epigenetic changes that regulate cell proliferation, growth, survival, apoptosis, adhesion and metabolism (Liu et al., 2014). Recurrent somatic mutations in specific genes are well recognized as potential drivers of carcinogenesis. The most frequent mutations found affect telomerase reverse transcriptase (TERT) promoter, p53 (tumor suppressor) and Wnt/β-catenin pathways. Additional mutations in HCC have been described, such as those affecting members of SWI/SNF chromatin remodeling complex and JAK/ signal transducers and activators of transcription (STAT) pathways; genes related to oxidative stress, RAS/mitogen-activated protein kinase (MAPK) signaling and genes that encode members of the ubiquitination process such as ubiquitin ligases (Dhanasekaran et al., 2016; Ding et al., 2017; Inokawa et al., 2016; Liu et al., 2014; Llovet et al., 2016).
In addition to genetic modifications, epigenetic alterations (changes in the methylation, hydroxymethylation, acetylation of histone proteins or dysregulation of the deoxyribonucleic acid (DNA) methylation) and changes in micro ribonucleic acid (miRNA) expression result in an altered expression of key proteins involved in HCC, contributing to carcinogenesis by influencing gene transcription, chromosomal stability and cell differentiation (Dhanasekaran et al., 2016; Inokawa et al., 2016; Llovet et al., 2016).
Apart from genetic and epigenetic alterations, several specific pathways are dysregulated in HCC that include: receptor tyrosine kinases (RTK) signaling pathways regulated by insulin-like growth factor (IGF); epidermal growth factor (EGF); PDGF and hepatocyte growth factor (HGF). It has also been reported alterations in pathways related to cell differentiation (Wnt, Notch, Hedgehog). Due to the fact that HCC is a highly vascularized tumor and the angiogenic process is a dominant feature, it is not surprising to find changes in angiogenic pathways and its ligands, such as vascular endothelial growth factor (VEGF) and fibroblast growth factor (FGF). Moreover, the main signaling mediators RAS/RAF/MEK/extracellular signal-regulated kinases (ERK) and phosphatidylinositol 3-kinase/AK strain transforming/ mammalian target of rapamycin (PI3K/AKT/mTOR) cascades are likewise important to liver carcinogenesis. Another pathway that has not been mentioned so far is the one triggered by TGF-β, which plays a critical role in cancer and will be subject of discuss in section 3.3 (Dhanasekaran et al., 2016; Tahmasebi Birgani and Carloni, 2017; Whittaker et al., 2010).
It is known that tumor microenvironment is critical for the initiation, growth and metastasis of tumor. Fibroblasts, myofibroblast, endothelial cells, perycites, adipose cells, ECM and infiltrating immune cells form the typical tumor microenvironment. Tumor microenvironment is enriched with diffusible cytokines, chemokines or enzymes that are secreted from cancerous or non-cancerous cells (Tahmasebi Birgani and Carloni, 2017). All of these signals
25
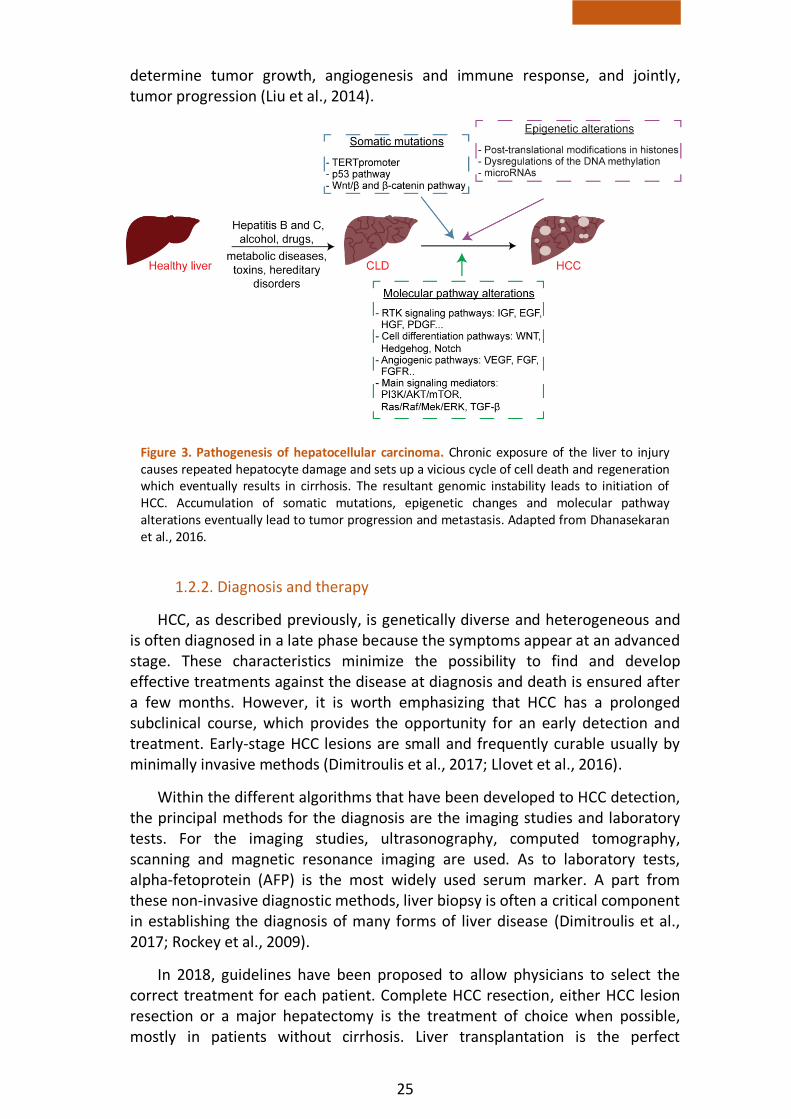
Figure 3. Pathogenesis of hepatocellular carcinoma. Chronic exposure of the liver to injury causes repeated hepatocyte damage and sets up a vicious cycle of cell death and regeneration which eventually results in cirrhosis. The resultant genomic instability leads to initiation of HCC. Accumulation of somatic mutations, epigenetic changes and molecular pathway alterations eventually lead to tumor progression and metastasis. Adapted from Dhanasekaran et al., 2016.
determine tumor growth, angiogenesis and immune response, and jointly, tumor progression (Liu et al., 2014).
1.2.2. Diagnosis and therapy
HCC, as described previously, is genetically diverse and heterogeneous and is often diagnosed in a late phase because the symptoms appear at an advanced stage. These characteristics minimize the possibility to find and develop effective treatments against the disease at diagnosis and death is ensured after a few months. However, it is worth emphasizing that HCC has a prolonged subclinical course, which provides the opportunity for an early detection and treatment. Early-stage HCC lesions are small and frequently curable usually by minimally invasive methods (Dimitroulis et al., 2017; Llovet et al., 2016).
Within the different algorithms that have been developed to HCC detection, the principal methods for the diagnosis are the imaging studies and laboratory tests. For the imaging studies, ultrasonography, computed tomography, scanning and magnetic resonance imaging are used. As to laboratory tests, alpha-fetoprotein (AFP) is the most widely used serum marker. A part from these non-invasive diagnostic methods, liver biopsy is often a critical component in establishing the diagnosis of many forms of liver disease (Dimitroulis et al., 2017; Rockey et al., 2009).
In 2018, guidelines have been proposed to allow physicians to select the correct treatment for each patient. Complete HCC resection, either HCC lesion resection or a major hepatectomy is the treatment of choice when possible, mostly in patients without cirrhosis. Liver transplantation is the perfect

26
treatment for HCC with an underlying CLD because it eliminates liver disease. For early HCC, patients can undergo local ablative therapy (radiofrequency ablation, microwave ablation or laser-induced interstitial thermotherapy). An alternative to these options is the transarterial chemoembolization (Dimitroulis et al., 2017). Despite the existence of these clinical possibilities to deal with the tumor, chemotherapy is the most important treatment for advanced HCC even though results are still unsatisfactory mainly due to HCC high molecular heterogeneity and its resistance to conventional chemotherapy. This may be the reason why prognosis of HCC patients is poor. Sorafenib is the first-line therapy for patients with advanced HCC. Since its discovery, only one of the numerous studied agents, lenvatinib, has shown survival benefit and non-inferiority to sorafenib. Recently, immuno-oncologic treatment and other new agents are under development or in clinical trials. Individual therapies based on genome sequencing might be the solution to improve the treatment in patients with advanced HCC (Ikeda et al., 2018; Llovet et al., 2016).
2. Hepatic progenitor cell/oval cell regeneration
2.1. Liver regenerative response
The liver has a unique capacity to regenerate in response to liver damage. Following partial removal of the tissue, the remaining population of parenchymal cells starts proliferating to meet replacement demands of cellular loss. This process is better defined as a compensatory hyperplasia since the expanding liver does not regain its original anatomical structure (Mao et al., 2014).
Different animal models have been used to study this phenomenon but the most widely studied model is partial hepatectomy in rodents (Higgins et al 1931). 2/3 of liver mass are surgically removed and the regenerative response is complete within 5-7 days after surgery, both in rats and mice. The remaining mitotically quiescent hepatocytes undergo cell division entering into S phase and consequently, binuclear hepatocytes give rise to two mononuclear cells. After two or three cell cycles, remaining liver has enlarged to a mass equivalent to the original organ (Mao et al., 2014; Michalopoulos, 2007, 2010, 2014).
Nevertheless, if the liver injury is persistent or severe and the proliferation capacity and function of hepatocytes is impaired or exhausted, such as during submassive necrosis, chronic viral hepatitis and NAFLD, the normal renewal from mature epithelial cells is overwhelmed. In this context, adult hepatic stem/ progenitor cells, called hepatic progenitor cells (HPCs) in humans and oval cells in rodents, act as a second line of defense against liver failure (Chen et al., 2017; Duncan et al., 2009).

27
2.2. HPC/oval cell generalities
HPCs have been described in many pathophysiological processes of human liver diseases (chronic hepatitis B and C, cirrhosis, alcoholic and nonalcoholic liver disease among others) (Bria et al., 2017; Chen et al., 2017; Lowes et al., 1999).
In rodents, oval cells were first described by E.Farber in 1956 as hepatobiliary reactive cells with approximately 10 μm of diameter, large nuclear-cytoplasm ratio and oval-shape nucleus (hence their name). The term hepatobiliary refers to their bipotential differentiation capacity towards both hepatocytes and cholangiocytes (Fausto and Campbell, 2003).
The oval cell-mediated regenerative process is referred to as “oval cell response” or “ductular reaction” because oval cells organize into ductular structures or ductules (Bria et al., 2017). However, ductular reaction is associated not only with HPCs/oval cells expansion, but also with other liver cells, such as stromal cells, inflammatory cells and infiltrated cells, including bone marrow–derived macrophages, and therefore, other liver processes such as ECM modifications, inflammatory infiltration and angiogenesis (Roskams et al., 2004; Sato et al., 2019).
Different liver injury protocols have been developed for activation and expansion of oval cells in rodents, but one of the most extensively used in mice is the administration of a diet containing 0.1% of 3,5-diethoxycarbonyl-1,4-dihidro-collidine (DDC), a porphyrinogenic hepatotoxin (Preisegger et al., 1999). DDC diet causes the inhibition of mitochondrial enzyme ferrochelatase leading to accumulation of protoporphyrin. This pigment accumulates in the cytoplasm of parenchymal cells and in KC. Due to its hydrophobic nature, the pigment only exits the liver through biliary secretion, precipitating and forming crystals in bile canaliculi and bile ducts that obstruct the biliary tree. Therefore, the tissue responds with a ductular reaction, peri-cholangitis, periductal fibrosis, and portal-portal fibrosis after 4–8 weeks that resembles the human cholestatic disease primary sclerosing cholangitis (Delire et al., 2015).
2.3. HPC/oval cell markers
HPCs/oval cells represent a heterogeneous population of cells that include different states of differentiation reflected by dynamic phenotype changes. Despite this, a number of surface antigens and intracellular proteins characteristic of the HPC/oval cell population have been described. Because of its bipotential and immature nature, these cells express a diverse set of markers that include hepatocyte markers as albumin (ALB), cytokeratins 8 and 18 (CK8, CK18) and MET; immature hepatocyte markers as AFP; biliary epithelial markers as CK19, A6, OV6 and epithelial cell adhesion molecule (EPCAM); markers associated with hematopoietic linages as thymocyte differentiation antigen (THY-1) (CD90) and c-KIT; neuroendocrine markers as neural cell adhesion molecule (N-CAM); and stem cell markers as CD133, CD44 and nestin (Bria et al., 2017; Chen et al., 2017).
28
2.4. HPC/oval cell origin
The cellular origin and location of HPCs/oval cells is still controversial and different theories keep emerging. The classical theory supports that HPCs/oval cells derive from quiescent stem cells located in the Canal of Hering, which is a structure connecting bile canaliculi formed by hepatocyte with bile ducts lined by cholangiocytes in the portal triad (Fausto, 2004; Fausto and Campbell, 2003; Itoh and Miyajima, 2014). This is still considered the most likely origin of HPCs/oval cells. Nevertheless, recent studies have demonstrated the existence of other stem cell origins apart from canal of Hering including intralobular bile ducts, periductal cells and peribiliary hepatocytes (Kuwahara et al., 2008).
In contrast with this view, it has been proposed that a liver stem cell hierarchy exists with different stages of HPC/oval cell maturation where the most mature HPC/oval cell is the one with the bipotential capacity. An additional model proposes that there are different precursor cells for hepatocytes and cholangiocytes instead of a bipotential progenitor population (Duncan et al., 2009). An extrahepatic origin of oval cells, particularly bone marrow, has also been proposed. Additional theories hold that HPCs/oval cells may come from hepatic stellate cells (Kordes et al., 2014), or from hepatocytes or bile epithelial cells (Tarlow et al., 2014), after a dedifferentiation process in response to liver damage (Bria et al., 2017; Tarlow et al., 2014).
2.5. HPC/oval cell response
Following the classical theory, upon activation of HPC/oval cell precursors at periportal niches, HPCs/oval cells expansion occurs, proliferating, migrating into liver parenchyma and differentiating into hepatocytes and cholangiocytes. In fact, activation, proliferation, migration and differentiation are considered the four phases of the HPC/oval cell response (Tanaka et al., 2011).
These phases, together with HPC/oval cell survival, self-renewal and/or maintenance of stemness in HPCs/oval cells, are regulated by the microenvironment, which is referred to as HPC/oval cell niche, and is composed of different cell types, ECM scaffold, growth factors and cytokines and other signals and molecules released by the niche cells.
The different cell types in the niche can interact and cross-talk with HPCs/ oval cells influencing its response. Parenchymal cells, hepatocytes and cholangiocytes, which are damaged during liver injury can direct/determine the activation and the fate of HPCs/oval cells. Moreover, cooperation with HSCs and myofibroblasts plays a critical role in HPC/oval cell expansion and differentiation through the release of growth factors and production of ECM. It has been also suggested that inflammatory cells stimulate and initiate regenerative responses in experimental models and can also remodel the ECM through the production of MMPs. ECM and ECM remodeling are essential for survival, activation, expansion and differentiation of HPCs/oval cells by binding, and presenting growth factors and signals to HPCs/oval cells (Bria et al., 2017; Chen et al., 2017; Van Hul et al., 2009; Vestentoft et al., 2013).

29
Figure 4. Classic model of HPC/oval cell origin. Quiescent stem cells are the precursors of HPCs/oval cells. The canal of Hering can provide a niche for these precursors of HPCs/oval cells. The niche is defined as the microenvironment which regulates HPC/oval cell behavior. Different cell types, ECM scaffold, growth factors and cytokines and other signals and molecules released by the niche cells form part of the HPC/oval cell niche. Adapted from Chen et al., 2017.
The niche is the microenvironment which regulates oval cell behavior. The niche is composed of different cell types, extracellular components, growth factors and cytokines and other signals and molecules released by the niche cells.
regulates stem cell behaviour Adapted from Chen et al.2017.
Important signals take part in HPC/oval cell response. Among these signals, which can act directly on HPCs/oval cells or indirectly via non-parenchymal cells that in turn regulate HPCs/oval cells, are growth factors such as HGF, TGF-β, FGF, connective tissue growth factor (CTGF); hormones (insulin, somatoestatin); adipokines (leptin); chemokines (SDF1, stromal cell-derived factor 1); and neurotransmitters (serotonin, epinephrine or norepinephrine). Besides this signaling network, inflammatory response (immune cells and inflammatory cytokines, such as interferon alfa (IFNα), TNFα, tumor necrosis factor-like weak inducer of apoptosis (TWEAK), IL-6, STAT3, etc) is critical for HPC/oval cell regenerative process (Best et al., 2013; Bird et al., 2008; Lukacs-Kornek and Lammert, 2017). Additionally, morphogens such as Wnt, Notch and Hedgehod are key regulators of HPC/oval cell response (Apte et al., 2008; Chen et al., 2017; Darwiche et al., 2011; Yang et al., 2008).
Due to the large number of signals and molecules that regulate HPCs/oval cells, a better understanding of their specific role and relevance in HPC/oval cell biology is necessary.

30
Figure 5. HPC/oval cell response. With minor injury, restoration of hepatocyte mass and function is mediated by the replication of remaining healthy hepatocytes (and cholangiocytes). During major liver insult, this mechanism is overwhelmed and HPCs/oval cells compartment is activated in an attempt to restore epithelial cell mass, architecture and function. The bipotential HPCs/oval cells upon activation are able to infiltrate along the liver parenchyma from the Canals of Hering, proliferate and differentiate into hepatocytes and cholangiocytes. This regenerative process is triggered and regulated by a plethora of signals. Adapted from Best et al., 2013.
2.6. HPC/oval cell in therapy
The bipotential nature of HPCs/oval cells and their ability to restore the damaged liver make the scientific community think in this population as an interesting target to develop new strategies against CLD. Thus cell transplantation alone or combined with drugs to enhance native regeneration could be alternative options to liver transplantation, the only effective therapy nowadays for patients with end-stage liver disease.
Regeneration by liver repopulation with transplanted hepatocytes has been explored for patients with liver-based inborn errors of metabolism or acute liver failure. Clinical trials have proved that liver hepatocyte transplantation is safe and effective but it only partially corrects metabolic disorders and it only does it in the short-term. Additionally, working with hepatocytes presents a number of difficulties, including difficulty in obtaining an easy and reproducible hepatocyte source; poor survival of primary hepatocytes in hypothermic storage conditions and number variation, scarce availability of good quality hepatocyte; and poor traceability of cells post-transplantation (Gilgenkrantz and Collin de l'Hortet, 2018).
31
All of these problems together with the limitations in treatment of CLD and HCC make the use of HPCs in therapy more attractive. However, understanding the molecular and signaling regulation of HPCs/oval cells is critical not only because it will help determine their true regenerative potential and utility in clinical strategies, but also because evidences show a role of HPCs/oval cells in liver fibrosis and HCC (Huebert and Rakela, 2014). Today, it is still not clear if HPCs/oval cells are a friend or foe in chronic injury.
2.7. Oval cell in liver fibrosis and HCC
We have already mentioned that HPCs/oval cells are present not only in rodent models of liver injury but in different human liver pathologies. Studies performed in humans and rodents have established a direct relationship between the degree of hepatic injury, the HPCs/oval cells expansion and the severity of fibrosis (Knight et al., 2007; Williams et al., 2014). So, opposed to the viewpoint of HPCs/oval cells as pro-regenerative cells, another current of opinion sees them as pro-fibrotic/pro-tumorigenic cells.
A study published by Chobert et al. (2012) showed that expanded HPCs/oval cells, after strong fibrosis induction in mice, express TGF-β, contributing in this way to the accumulation of α-SMA-positive MFB and consequently, to the disease progression. Kuramitsu et al. (2013) studies also support the profibrotic role of HPCs/oval cells. In this work, failure of hepatocyte-mediated regeneration in fibrotic mouse livers triggers activation of HPCs/oval cells and a severe fibrotic response. In this setting, inhibition of HPC/oval cell response results in prevention of fibrotic process and in an improvement in liver regeneration. The work of Clouston et al. (2005) also demonstrates a correlation between the increase in hepatic fibrosis during chronic hepatitis C virus infection and a periportal ductular reaction. These evidences attribute HPCs/oval cells a role in the progression of fibrosis. The controversy about the precise role of HPCs/oval cells as pro-fibrogenic or anti-fibrogenic makes necessary further studies to clarify this point. It is worthy to understand that these two opposing ideas are not mutually exclusive, and this paradox can be resolved by recognizing heterogeneity in the ductular reaction activation and evolution in the specific context of the different models used.
One of the theories proposed to explain the origin of HCC states that HCC derives from stem cells whose differentiation is blocked. Stem cells that are committed to form a certain tissue divide into two daughter cells, during normal cell renewal. One daughter cell remains as a stem cell and the other cell expresses a more differentiated state. These differentiating cells are capable of proliferating and lead to terminally differentiated cells. However, mutations can occur during the differentiation process and the mitotically active cells acquire a malignant phenotype due to an abnormal differentiation state with self-renewal ability, multi-directional differentiation, unlimited proliferation and high tumorigenic ability. In this line, HPCs/oval cells have been proposed to behave as a cancer stem cell in certain contexts (Sell, 1993; Wu and Chen, 2006). Different evidences support this theory. 1) Cells phenotypically similar to
32
HPCs/oval cells are observed in many hepatic tumors and several studies based on immunohistochemical analysis of HCCs have concluded that about 28–50% of HCCs express markers of progenitor cells (such as CK19, AFP and OV6) (Roskams, 2006; Yang et al., 2012). Interestingly, these tumors carry a significantly poorer prognosis and higher recurrence after surgical resection and liver transplantation (Kohn-Gaone et al., 2016; Lee et al., 2006). 2) Microarray analysis have revealed that many of the disrupted pathways in HCC are involved in stem cell maintenance and self-renewal such as Wnt/β-catenin, TGF-β, HGF/Met, Hedgehog (Marquardt and Thorgeirsson, 2010). 3) Both transfection of activated oncogenes or silencing of tumor suppressor genes in HPCs/oval cells can give rise to HCC (Braun et al., 1987; Dumble et al., 2002; Iidaka et al., 2005).
3. Transforming growth factor β (TGF-β) 3.1. Signaling pathway
Mammalian genome encodes 33 members of the TGF-β superfamily that includes isoforms of TGF-β, BMP (Bone Morphogenetic Proteins), nodal, activin, inhibin, GDPs (Growth Differentiation Factors), MIS/AMH (Müllerian Inhibiting Substance/Anti-Mullerian Hormone) and Lefty (Massague, 2012; Morikawa et al., 2016).
Focusing on TGF-β sub-family, the mammalian genome encodes 3 different isoforms: TGF-β1, β2 and β3. TGF-β1 is ubiquitously expressed and is the most abundant isoform. The ligands of the TGF-β are synthesized as polypeptide precursors formed by 3 segments: an amino-terminal signal peptide, a large precursor segment or pro-segment (LAPs, latency-associated peptides) and the carboxy-terminal polypeptide. TGF-β precursor segment must be eliminated before binding to its receptor, process accomplished by proteolytic cleavage mediated by furin enzymes in the trans-Golgi. The still inactive TGF-β form is released into the ECM, where the final activation by integrins and proteases like plasmin or gelatinases takes place. To become active, TGF-β must form dimers stabilized by a disulphide bridge and hydrophobic interactions (Massague, 2012; Morikawa et al., 2016).
Upon activation, TGF-β binds to a tetrameric complex consisting of two type I and two type II serine-threonine kinase receptors. There are 7 type I receptors (activin receptor-like kinase, ALK1-7) (TβRI) and 5 type II receptors (TβRII), but TGF-β preferentially signals through ALK5 (TβRI) and the type II receptor, TβRII. Thus, active TGF-β binds to TβRII that leads to recruitment and transphosphorylation of TβRI in a glycine and serine-rich domain (GS domain). This phosphorylation switches the GS region in TβRI from a site that binds the 12KDa FK506-binding protein (FKBP12), a protein that silences the kinase activity, into a site that binds R-Smad (receptor-associated Smad) proteins for their phosphorylation. Among the 5 different R-Smads, TGF-β1 specifically activates Smad2 and Smad3. Then, they form a trimeric complex with the Co-Smad4 (common mediator Smad4) and subsequently, this complex translocates
33
to the nucleus where it cooperates with other transcription factors, coactivators and corepressors to regulate the expression of specific target genes. Apart from R-Smad and Co-Smad, Smad family includes other members named I-Smads (inhibitory Smads), I-Smad 6 and 7, which regulate negatively TGF-β signaling pathway. Smad7 binds to and inhibits essentially all type I receptors in the TGF-β family whereas Smad6 exhibits higher specificity on BMP mediated signaling. Smad family members consist in two domains (MH1 and MH2) coupled by an unstructured linker. The amino-terminal MH1 domain has a hairpin structure with DNA-binding ability. MH2 is the carboxy-terminal domain with hydrophobic segments that are able to interact with adaptor proteins, active TGF-β receptors and DNA coactivators and repressors. Apart from regulating genes expression, Smad also regulate miRNA expression and maturation, epigenetic changes, RNA splicing and RNA methylation (Derynck and Budi, 2019; Heldin and Moustakas, 2016; Huse et al., 2001; Itoh and ten Dijke, 2007; Massague, 2012; Shi and Massagué, 2003).
Besides the Smad signaling pathway, known as “canonical pathway”, TGF-β can activate other pathways that are referred to as “non-canonical” or “non-Smad” pathway. These pathways are activated through the interaction between the members of the canonical response with other signaling pathways and through the ability to TGF-β receptors to activate other signaling molecules. Non-canonical pathways include among others, various branches of MAPK pathways (ERK, c-Jun N-terminal kinase (JNK) and p38 kinase pathways); Rho-like GTPase, nuclear factor kappa-light-chain-enhancer of activated B cells (NFκB), JAK/STAT and PI3K/AKT signaling pathways. These signaling pathways act alone or in conjunction with Smads to control TGF-β activities (Derynck and Budi, 2019; Derynck and Zhang, 2003; Heldin and Moustakas, 2016; Massague, 2012; Zhang, 2009).
TGF-β signaling pathway is subjected to regulation (positive, negative, spacio-temporal) at different levels such as ligand activation, receptor complex formation, R-Smad activation and translocation, and transcriptional activity.
I-Smad 6 and 7 negatively regulate TGF-β pathway by different mechanisms. These include: binding to activated type I receptor inhibiting R-Smad phosphorylation; interactions with Smad4 preventing R-Smad–Smad4 complex formation, degradation of TβRI through the proteasome pathway and recruitment of transcriptional Smad co-repressors (Itoh and ten Dijke, 2007; Yan et al., 2009). In addition to the regulation of the signaling pathway through I-Smads, numerous points of control exist in TGF-β pathway, some of them are mentioned below. TGF-β receptor expression, activity and stability can be controlled by different means, including phosphorylation, ubiquitination, sumoylation and neddylation (Budi et al., 2017; Heldin and Moustakas, 2016). In the same manner, Smad proteins are also regulated by phosphorylation, ubiquitination, sumoylation and acetylation (Massague et al., 2005). TGF-β receptor signaling intensity, duration, specificity and diversity are modulated by cell surface co-receptors such as betaglycan/TβRIII, endoglin or Neuropilin-1 and other cell-surface proteins such as integrins or occludin. Moreover, signaling via TGF-β receptors is modulated by interactions with cytoplasmic proteins and

34
Figure 6. Canonical and non-canonical TGF-β signaling pathways. TGF-β dimer binds to the receptor complex and consequently activates the canonical Smad pathway, through Smad2/3 and Smad4, and non-canonical signaling pathways. Adapted from Budi et al., 2017.
with nuclear shuttling proteins (Heldin and Moustakas, 2016; Nickel et al., 2018). Another point of control is the regulation of the receptor by endocytosis (Zhao and Chen, 2014)
3.2. TGF-β responses
In most cell types, in particular in normal epithelial cells, TGF-β family members regulate a large number of cellular responses including proliferation, differentiation, migration and apoptosis among others. Dysregulation of these signals is implicated in various human diseases including cancer, fibrosis, autoimmune diseases and vascular disorders (Akhurst and Hata, 2012; Heldin and Moustakas, 2016; Massague, 2008).
3.2.1. TGF-β and growth inhibition
TGF-β has a high growth inhibitory capacity in epithelial cells and many non-epithelial cell types, which is irreversible if cytokine is eliminated. The inhibitory action is based on the induction of cyclin dependent kinase inhibitors (CKI

35
inhibitors) and/or the inhibition of proliferative drivers. The specific mechanisms depend on the cell type and context (Morikawa et al., 2016).
In epithelial cells, TGF-β orchestrates the cytostatic effect primarily during G1 phase of the cell cycle through inhibition of CDKs, which leads to de-phosphorylation of retinoblastoma protein (RB). Different studies show that TGF-β induces expression of p21 (Cdkn1a) and p57 (Cdkn1c), members of the Cip/Kip CKI family, which inhibit CDKs involved in the G1/S transition, and p15 (Cdkn2b), member of INK4 family, which inhibits Cyclin D-cdk4/6 complexes. p27 (Cdk1b) is another member of Cip/Kip family involved in the mechanism of growth arrest. p27 when bound to Cyclin D-Cdk4/6 complex is in an inactive state and upon induction of p15 by TGF-β, p15 displaces p27 from Cyclin D-Cdk4/6 and p27 moves on to inhibit Cdk2. At the same time, TGF-β induces c-Myc downregulation, a transcription factor that promotes cellular growth and proliferation, and the inhibition of ID1, 2 and 3 expression, transcription factors that oppose cellular differentiation (Massague and Gomis, 2006; Siegel and Massague, 2003). Although the majority of these effects are Smad-dependent, TGF-β is also able to induce cell cycle arrest through non-Smad pathways (Petritsch et al., 2000).
3.2.2. TGF-β and apoptosis
TGF-β-regulated apoptosis is highly dependent on the cell type. In fact, there is not a clear TGF-β apoptotic program and various components link TGF-β signaling pathway with the machinery of programmed cell death (Zhang et al., 2017). Different SMAD dependent and independent mechanisms have been described in the control of apoptosis in different cell types.
TGF-β cooperates in several systems with the death receptor apoptotic pathways: Fas ligand (FasL) or apoptosis antigen-1 ligand and TNF-α, enhancing or inhibiting the apoptotic responses. Intracellularly, several apoptotic target genes, the TGF-β-inducible early response gene I (TIEG1) and the death-associated protein kinase (DAP-kinase) among others, are regulated by Smad transcriptional complexes. But, at the same time, TGF-β activates pro-survival signals such as ERK MAPK, NF-κB and PI3K-AKT, and the pro-apoptotic JNK and p38 MAPKs. This intricate and complex response leads us to think that the balance between pro- and anti-apoptotic signaling pathways is essential to determine whether or not cells will undergo apoptosis in response to TGF-β (Sanchez-Capelo, 2005; Schuster and Krieglstein, 2002; Zhang et al., 2017).
TGF-β also induces apoptosis via mitochondrial apoptotic pathway through cytochrome c release mediated by B-cell lymphoma 2 (BCL-2) family members. TGF-β modulate the expression, localization and activation of pro- and anti-apoptotic BCL-2 proteins. In fact, TGF-β has been shown to induce ROS and oxidative stress by different means, by regulating ROS producing systems (as NADPH) or by down regulating antioxidant genes (Carmona-Cuenca et al., 2008; Herrera et al., 2001; Martinez-Palacian et al., 2013; Sanchez-Capelo, 2005; Sanchez et al., 1996; Schuster and Krieglstein, 2002; Zhang et al., 2017).

36
3.2.3. TGF-β and epithelial to mesenchymal transition (EMT)
Definition of EMT
Classically, EMT has been described as a biological process that allows an epithelial cell to undergo multiple biochemical changes that enable it to acquire a mesenchymal phenotype which includes enhanced migratory capacity, invasiveness, elevated resistance to apoptosis, and increased production of ECM components. Numerous biochemical changes take place during this phenotype transition: loss of junctions and apical-basal polarity, reorganization of cytoskeleton, and changes in signaling programs that altogether define cell shape and reprogramming of gene expression (Lamouille et al., 2014; Nieto et al., 2016).
However, nowadays, EMT is not only described as a shift between two alternative states, full mesenchymal or full epithelial. Cells can transition through a spectrum of intermediary states that could be understood as partial EMT, states in which cells present a hybrid epithelial and mesenchymal phenotype. Many studies define the hybrid state as the co-expression of epithelial and mesenchymal markers, but cells do not need to gain mesenchymal proteins in a partial EMT, it is enough to repress epithelial properties. Likewise, induction of mesenchymal markers while maintaining E-cadherin is considered a partial EMT. It is unknown whether this hybrid status reflects an intermediate phase during a mesenchymal transition or represents its own end state. Mechanisms driving partial EMT remain to be clarified (Aiello et al., 2018; Kai et al., 2018; Nieto et al., 2016).
EMT transcription factors and inducers
EMT process is orchestrated by specific transcription factors (EMT-TF): Zinc-finger binding transcription factors Snail1 and Snail2 and several helix-loop-helix factors such as zinc finger E-box-binding homeobox 1 (Zeb1), Zeb2 and Twist (Twist 1 and 2). Expression of these transcription factors and their precise contribution to EMT regulation depend on the cell or the tissue in which EMT takes place and on the signaling pathway that initiates the process. EMT-TF often regulate each other and act coordinately to repress epithelial genes and induce mesenchymal genes. Additionally, epigenetic modifications, differential splicing of RNA and miRNA have been described as modulators of the EMT process (Lamouille et al., 2014; Nieto et al., 2016; Skrypek et al., 2017).
Although different signals induce EMT process, TGF-β is one of the best known and studied. TGF-β triggers EMT through Smad proteins, regulating the transcriptional program that involves the EMT-TF. Besides the canonical pathway, non-canonical TGF-β effectors can mediate TGF-β ability to induce the transition between epithelial to mesenchymal features in cells. ERK/MAPK, p38/MAPK Rho GTPases, PI3K/AKT, NF-KB, JNK are some of the pathways associated with TGF-β-induced EMT (Gonzalez and Medici, 2014; Wendt et al., 2009; Xie et al., 2004; Xu et al., 2009).

37
EMT-related phenotypic and functional changes
Cell to cell contact is maintained through tight junctions, adherent junctions, desmosomes and gap junctions. After EMT induction, these cell junctions are deconstructed and the junction proteins are relocalized and/or degraded. Loss of tight junctions is characterized by decreased claudin and occludin expression and intracellular relocalization of zonula occludens 1 (ZO-1). Adherent junctions suffer a “cadherin switch”, that is, E-cadherin is down-regulated, cleaved at the plasma membrane and degraded whereas N-cadherin expression is upregulated. EMT is also accompanied by desmosomes and gap disruption, being the later accompanied by a decrease in connexins levels (Lamouille et al., 2014).
Another important event during EMT process is the re-organization of the actin cytoskeleton. This process enables cells to change their shape, and favors the formation of membrane projections that facilitate cell movement and invasion. Progressive alterations in cell morphology are accompanied by reorganization of actin filaments from thin cortical bundles in epithelial cells to thick and contractile bundles, actin stress fibers, that facilitate contractility in mesenchymal cells (Haynes et al., 2011; Lamouille et al., 2014; Yilmaz and Christofori, 2009).
The intermediate filament composition also changes during the EMT process with a repression of cytokeratin and an activation of vimentin (Lamouille et al., 2014).
In addition to these alterations, an increase in the expression of MMPs takes places. MMPs collaborate in ECM degradation, facilitating the invasion process. MMPS contribute to the loss of adherent junctions, targeting some transmembrane proteins, and more strikingly, some of them can induce the EMT program by inducing signaling molecules like the GTPase RAC1 that in turn leads to Snail activation (Lamouille et al., 2014).
As previously mentioned, cells that have undergone EMT acquire resistance to senescence and apoptosis, which will be relevant to tumor progression (Brabletz et al., 2018). Different studies have associated resistance to TGF-β-induced cell death with an EMT induction (Gal et al., 2008; Valdes et al., 2002) and others have demonstrated that some EMT-TF confer resistance to cell death (Snail and Twist) (Vega et al., 2004). EMT and cellular senescence are two processes that seem to cross paths, sharing transcription factors. In fact, some EMT-TFs prevent cells to undergo cellular senescence (Ansieau et al., 2008; Puisieux et al., 2014; Smit and Peeper, 2010).

38
Figure 7. General features of epithelial to mesenchymal transition. The transition of epithelial cells towards a mesenchymal phenotype, induced by several factors such as TGF-β, is characterized by the loss of junctions and apical-basal polarity and reorganization of cytoskeleton. These changes disrupt the epithelial architecture and mesenchymal cells acquire migratory and invasive competences. EMT is orchestrated by specific transcriptions factors (Snail1/2, Zeb1/2, Twist1/2) that modulate well-known markers such as E-cadherin, claudins or cytokeratin. The acquisition of mesenchymal markers sustains and stabilizes the newly acquired phenotype. Adapted from Morandi et al., 2017.
3.3. Physiological and pathological activities of TGF-β in the liver
In general, TGF-β regulates cell proliferation, migration and differentiation during embryonic development and has an essential role in maintaining tissue homeostasis. In the liver, TGF-β dosage and spatiotemporal activity is involved in different aspects of hepatogenesis, controlling gene expression and determining the differentiation of hepatoblasts to hepatocytes or cholangiocytes. Moreover, TGF-β regulates liver architecture and biliary morphogenesis (Karkampouna et al., 2012). Contrary to these beneficial activities, TGF-β is one of the main orchestrators of liver fibrogenesis and hepatocarcinogenesis processes upon liver injury.
3.3.1. TGF-β in liver fibrosis
After liver damage, active TGF-β levels increase, being the non-parenchymal liver cells, principally macrophages and HSCs, the main sources of TGF-β.

39
Moreover, hepatocytes appear to acquire and store latent TGF-β in the cytoplasm, that could be activated and released upon damage, providing a source of active cytokine. Active TGF-β plays important roles on different hepatic cell populations, therefore contributing to critical events from the initial liver injury to the final stages of CLD (Dooley and ten Dijke, 2012).
Among the hepatic cell population, HSCs are the main target for TGF-β action during CLD; TGF-β induces the trans-differentiation of HSCs into MFB while promoting their proliferation. MFB play a key role in hepatic fibrosis since they are the principal cell type responsible for production of an excess of ECM proteins (Dewidar et al., 2015; Dooley and ten Dijke, 2012).
TGF-β induces growth arrest and apoptosis in hepatocytes, events considered critical for hepatic fibrosis. It is important to mention that cytostatic properties of TGF-β are key during hepatocyte liver regeneration since they mark the end of the regenerative process (Karkampouna et al., 2012). In relation to this, our group has shown that low doses of TGF-β inhibit fetal hepatocyte growth whereas higher doses result in an apoptotic cell death (Sanchez et al., 1995). TGF-β-induced apoptosis is associated with an induction of ROS that results in loss of mitochondrial transmembrane potential that leads to the release of cytochrome c, and subsequently, the activation of caspase-3. Upregulation of NOX4 by TGF-β is required for ROS induction and therefore, for its pro-apoptotic activity in fetal hepatocytes (Carmona-Cuenca et al., 2008; Herrera et al., 2001; Sanchez et al., 1996). It has also been suggested that oxidative stress mediates the progression of fibrosis, ROS acting as mediators of molecular and cellular events implicated in liver fibrosis. In fact, there are evidences sustaining critical roles for members of the NOX family, upon activation by TGF-β, both in hepatocyte apoptosis (NOX4) and HSC activation and proliferation (NOX1,4) during the fibrotic process (Crosas-Molist and Fabregat, 2015; Sanchez-Valle et al., 2012).
Controversy exists regarding hepatocyte EMT as a source of MFB (Dooley et al., 2008; Herbst et al., 1997; Nitta et al., 2008; Wells, 2008; Zeisberg et al., 2007). Our group has demonstrated that fetal hepatocytes undergo an EMT in response to TGF-β. After EMT, hepatocytes acquire progenitor markers and properties and become resistant to apoptosis (del Castillo et al., 2008a; Del Castillo et al., 2006; Pagan et al., 1999). However, if adult hepatocytes suffer an EMT process in response to TGF-β is still not clear, with some in vitro studies in favor of this hypothesis (Meyer et al., 2013) and others against it (Caja et al., 2007). Despite these discrepancies, EMT seems to be key in the development of liver fibrosis.
Additional potential targets of TGF-β in liver fibrosis are HPCs/oval cells. It has been reported that TGF-β induces apoptosis and inhibits proliferation of HPCs/oval cells in mouse models of liver damage (Park and Suh, 1999; Thenappan et al., 2010). Additionally, in vitro studies of our group reveal that TGF-β induces cell growth arrest and apoptosis in HPCs/oval cells by a mitochondrial apoptotic program associated with induction of oxidative stress. Similar to what was observed in hepatocytes, TGF-β induces disruption of

40
Figure 8. TGF-β effects on different hepatic cells population during liver fibrosis/cirrhosis. TGF-β plays important roles during CLD by acting on different hepatic cell populations. TGF-β induces the transdifferentation process of HSC to MFB, the main cell responsible for fibrosis. Additionally, TGF-β induces growth arrest and apoptosis in hepatocytes, critical for hepatic fibrosis. More controversial is that hepatocyte EMT could be another source of MFB. TGF-β could also participate in liver fibrosis targeting HPCs/oval cells. TGF-β induces apoptosis and inhibits proliferation of HPCs/oval cells. HPCs/oval cells could suffer EMT in response to TGF-β becoming MFB.
mitochondrial transmembrane potential and increases the expression of pro-apoptotic BCL-2 proteins, such as BCL-2 modifying factor (BMF) and BCL-2-like-11 (BIM). These events are related to an oxidative stress process, which also involves increase in NOX4 expression and decrease in antioxidant enzymes protein levels (del Castillo et al., 2008b; Martinez-Palacian et al., 2013). Interestingly, it has been described that hepatocytes are more sensitive to TGF-β-induced apoptosis than HPCs/oval cells, fact that allows this population to proliferate and repair the liver damage in a situation in which hepatocyte proliferation is blocked (Karkampouna et al., 2012; Nguyen et al., 2007). Besides the apoptotic effect of TGF-β in HPCs/oval cells, some authors have reported an induction of ECM genes and HSC markers in HPCs/oval cells in culture upon TGF-β treatment, suggesting these cells might be an origin of HSC via EMT, becoming another source of MFB and so contributing to liver fibrosis (Wang et al., 2009).
Based on the key roles played by TGF-β in the pathogenesis of liver fibrosis and cirrhosis, different therapeutic strategies targeting TGF-β signaling have been proposed to treat these diseases, including anti-sense oligonucleotides, blocking antibodies, soluble receptors that bind the ligand and block ligand-receptor binding or overexpression of I-SMADs (Smad7) among others. Anti TGF-β therapies have successful results in experimental models. However,

41
unfortunately these results have not been translated to humans, which might be a consequence of the multiple and cell- and context-dependent TGF-β functions (Cheng and Wong, 2017; Dooley and ten Dijke, 2012). Clearly, a better understanding of the TGF-β participation in CLDs is needed in order to develop efficient treatments in humans.
3.3.2. TGF-β in HCC
It is widely recognized that TGF-β has critical roles in tumor initiation, development and metastasis in several cancer types. Strikingly, TGF-β switches from a potent cytostatic and pro-apoptotic effect in normal epithelial cells to a tumor promoter activity at the late stages of the disease, phenomenon that is known as the “TGF-β paradox” (Seoane and Gomis, 2017; Siegel and Massague, 2003).
Accumulating mutations in components of the TGF-β pathway or selective impairment of the growth inhibitory response are some of the strategies developed in tumor cells to bypass the TGF-β suppressor activities (Seoane and Gomis, 2017). In HCC, mutations or alterations in Smad proteins or TGF-β receptors are not very frequent. However, TGF-β upregulation is found in a large number of HCC patients, and in contexts where the canonical pathway is blocked, TGF-β can still signal via non-canonical pathways (Fabregat et al., 2016b). Alternative mechanisms to escape from TGF-β suppressor effects in HCC cells are: i) expression of specific miRNAs that allow them to escape from TGF-β-induced apoptosis (Huang and He, 2011); ii) epigenetic silencing in genes encoding TGF-β pathway components (Seoane and Gomis, 2017); iii) over-activation of growth factors that trigger survival signaling pathways (MAPK/ERKs, PI3K/AKT or NF-KB) (Colak and Ten Dijke, 2017; Fabregat et al., 2016b; Huang et al., 2018).
It has been also demonstrated that tumor cells that overcome TGF-β-induced growth arrest/apoptosis undergo EMT in response to TGF-β. Acquisition of mesenchymal properties confers stemness, invasiveness and motility to tumor cells, properties that strongly influence their metastatic capacity. Therefore, tumor cells invade the surrounding environment being able to colonize distant sites and disseminate the disease (Seoane and Gomis, 2017).
TGF-β pathway also exerts its pro-tumorigenic effects by remodeling tumor microenvironment. Accumulating evidence has demonstrated that immune microenvironment plays crucial roles in the development of HCC and that TGF-β generate a favorable microenvironment for tumor growth and metastasis. TGF-β has immunosuppressive effects on innate and adaptive immune cells and also affects cytokine production by tumor cells (Colak and Ten Dijke, 2017; Shen et al., 2015; Yang et al., 2010). Another important aspect of the HCC microenvironment is its strong angiogenic activity, which seems to be induced by TGF-β (Colak and Ten Dijke, 2017; Mazzocca et al., 2009). TGF-β is also able to differentiate stromal mesenchymal cells into MFB that secrete ECM proteins and fibrotic growth factors to support tumor growth. Besides, TGF-β induces an

42
Figure 9. Regulation of non-cancerous cells and tumor microenvironment cells by TGF-β. TGF-β is expressed by tumor cells and stromal cells, including cancer-associated fibroblasts. TGF-β in normal cells induces cell-cycle arrest and/or apoptosis. However, tumor cells escape from these effects and undergo EMT in response to TGF-β. EMT is thought to foster tumor cell migration and invasion and plays an important role in conferring therapy resistance. TGF-β can also contribute to tumor progression by stimulating immune evasion and promoting angiogenesis. Adapted from Colak and Ten Dijke, 2017.
endothelial to mesenchymal transition towards tumor-facilitating fibroblast-like cells in endothelial cells (Colak and Ten Dijke, 2017).
Just like in the case of liver fibrosis, the pivotal role played by TGF-β during
HCC development make it a promising target to develop new therapies. Similar
strategies to those mentioned before have been develop to inhibit TGF-β
pathway in cancer: antisense oligonucleotide, blocking antibodies and ligand
traps, TβRII and/or ALK5 inhibitors, in addition to immune response-based
strategies and other inhibitors of the TGF-β pathway (Fabregat et al., 2014). As
an example, ongoing clinical trials evaluating galunisertib, a TβRI kinase inhibitor
factor, has shown promising results in HCC patients. Nevertheless, further
advances in HCC therapies targeting TGF-β signaling require a better
understanding of the disease, and more particularly, the diverse functions of
TGF-β in the hepatic cell populations (Giannelli et al., 2016; Neuzillet et al.,
2015).

43
4. Hepatocyte growth factor (HGF)/Met 4.1. Signaling pathway
HGF was discovered as a strong mitogen for hepatocytes (Miyazawa et al.,
1989; Nakamura, 1989). It is also known as Scatter Factor (SF), since a fibroblast-
derived cell motility factor for epithelial cells that was identified independently
(Stoker et al., 1987) was later found to be the same factor as HGF (Naldini et al.,
1991).
HGF is produced and secreted primarily by stromal and mesenchymal cells (fibroblasts, macrophages, smooth muscle cells, among others) but acts mainly on epithelial cells, where its receptor Met is expressed, therefore acting in a paracrine fashion (Zarnegar, 1995). Some cells show an autocrine HGF/Met signaling, at least in certain contexts, expressing both the ligand and its receptor, as it is the case in HPCs/oval cells (del Castillo et al., 2008b). Additionally, Met is not only expressed in epithelial cells, but also in other cell types including vascular endothelial cells, lymphatic endothelial cells, neural cells, hematopoietic cells and pericytes (You and McDonald, 2008).
HGF is secreted as an inactive single-chain peptide that is cleaved by proteases to generate an active heterodimer with two chains, α- and β-chains, held together by a disulphide bond. The α-chain is formed by an amino-terminal hairpin loop (HL) and four kringle domains (K1-K4, amino acid double-looped structures formed by three internal disulphide bridges. β-chain is a serine protease homology domain without proteolytic activity (Nakamura and Mizuno, 2010; Trusolino et al., 2010).
HGF triggers its signaling pathway by binding to its tyrosine kinase receptor Met. Met receptor is a heterodimer, consisting of an extracellular α-subunit and a transmembrane β-subunit, disulphide-linked. The entire α-subunit forms a semaphorin domain and is associated with the extracellular region of the β-subunit, which is formed by a semaphorin domain (SEMA), a plexin- semaphorin-integrin (PSI) cysteine‑rich domain (also present in semaphorins and plexins), and four immunoglobulin-like domains shared by plexins and transcriptional factors (IPT) . The intracellular part of the β-subunit is composed by a juxtamembrane region, an intracellular tyrosine kinase domain (catalytic region) and a C-terminal tail (Kato, 2017; Trusolino et al., 2010).

44
Figure 10. Domain structures of Met and HGF. a) HGF is an α- and β-chain heterodimer. HGF consists of six domains: an amino-terminal hairpin loop (HL), four Kringle domains (K1-k4, amino acid double-looped structures formed by three internal disulphide bridges) and a serine protease homology (SPH) domain. b) MET receptor is a disulphide-linked heterodimer formed by an extracellular α-subunit and a transmembrane β-subunit. The extracellular region of Met is composed of three domains: the Sema domain that includes the entire α-chain and part of the β-chain; the PSI domain and four IPT domains. The intracellular region is formed by a juxtamembrane sequence, a catalytic region and a carboxy-terminal multifunctional docking site. This portion of Met contains the catalytic tyrosines (Tyr1234 and Tyr1235) and the Tyr1003 that negatively regulates Met. The Tyr1349 and Tyr1356 recruit several transducers and adaptors after Met activation. Adapted from Trusolino et al., 2010.
When HGF binds to the SEMA domain of Met receptor, two molecules of
the receptor homodimerize and the intracellular tyrosine kinase domains of the two β-subunits trans-phosphorylate each other at tyrosine residues (Tyr1234 and Tyr1235) in the catalytic loops. Subsequently, tyrosines 1349 and 1356 in the carboxy-terminal tail become phosphorylated. These two tyrosines form a tandem SH2 recognition motif (multifunctional docking site) that acts recruiting signaling molecules (Organ and Tsao, 2011; Trusolino et al., 2010).
Upon ligand binding, numerous signaling adaptors and signaling effectors are recruited to activated Met receptor. Among adaptors proteins we find growth factor receptor bound protein 2 (GRB2), the non-receptor tyrosine kinase (Src), v-crk sarcoma virus CT10 oncogene homolog (CRK), and the SH2 domain-containing transforming protein (SHC). Moreover, Met biological activity is principally due to the recruitment and phosphorylation of the scaffold protein GRB2-associated binding protein 1 (GAB1) to activated Met receptor, providing binding sites for additional downstream adaptors or signaling molecules. Interestingly, GAB1 binds to Met directly or indirectly through GRB2 (Gherardi et al., 2012; Organ and Tsao, 2011).

45
Figure 11. HGF/Met signaling pathway. Binding HGF to Met initiates receptor activation, dimerization and trans-phosphorilation of the Tyr1234 and Tyr1235. This results in the phosphorylation of the tyrosines in the multifunctional docking site (Tyr1349 and Tyr1356). They recruit signaling effectors and adaptor proteins that lead to the activation of signaling pathways including ERK/MAPK, PI3K, JNK, p38, NF-κB, STAT3, PLCγ and FAK pathways, which mediate HGF/Met biological effects. Adapted from Organ and Tsao, 2011.
Different signaling pathways mediate the downstream response to Met activation. The two major pathways downstream of Met are the ERK/MAPK and PI3K/Akt. Activation of ERK/MAPK occurs through the SHC/GRB2/SOS/RAS/RAF pathway or via GAB1/Src homology 2 domain-containing phosphatase (SHP2). MAPK pathway activation results in the regulation of transcription factors that control the expression of genes related to cell proliferation and cell cycle progression and/or cell motility. Regarding PI3K/Akt pathway, the p85 subunit of PI3K binds to Met directly or indirectly through GAB1. This signaling pathway is responsible for Met-driven cell survival response. Other signaling pathways are: i) STAT3. STAT3 binds directly to Met, becomes phosphorylated, dimerizes and translocates to the nucleus. This signaling pathway has been implicated in tubulogenesis and invasion, although contradictory data has been reported in this respect. ii) JNK and p38. These pathways are stimulated by RAC GTPase, which is switched on by PI3K/RAS. JNK and p38 control differentiation, transformation, proliferation and apoptosis. iii) Focal adhesion kinase (FAK). FAK is activated through Src and has been related to cellular migration and anchorage-independent growth. iv) NF-κB. Met activation leads to the release of NF-κB through PI3K/Akt- and Src- dependent pathways. Once in the nucleus, stimulates the transcription of genes related with mitogenic and anti-apoptotic functions. v) Phospholipase Cγ (PLCγ). PLCγ binds directly to Met or indirectly through GAB1 and participates in the morphogenesis activity of Met (Gherardi et al., 2012; Kim and Salgia, 2009; Organ and Tsao, 2011; Trusolino et al., 2010).

46
HGF/Met signaling pathway is regulated at different levels. Thus, Met downstream signaling can be modulated, potentiated or inhibited through cross-talk with different membrane receptors such as plexins, integrins (α6β4), semaphorins, CD44 family members, intercellular adhesion molecule 1 (ICAM1), mucins, death receptors (Fas), and other tyrosine kinase receptors (EGFR, Her2) (Giordano and Columbano, 2014; Trusolino et al., 2010; Viticchie and Muller, 2015), thus creating complex interacting networks that can operate in different ways.
Additionally, Met is rapidly internalized by endocytosis and recycled back to the plasma membrane or degraded by lysosomal pathway. Phosphorylation of Tyr1003 at the juxtamembrane domain facilitates the recruitment of the E3 ubiquitin ligase casitas B-lineage lymphoma (c-CBL) after internalization, therefore leading to Met ubiquitination and degradation (Parikh and Ghate, 2018). However, Met continues signaling from endosomal compartments. Thus, the compartmentalization of the receptor in endocytic vesicles is required for the full activation of signals such as GAB1, ERK, STAT3 and RAC1 (Barrow-McGee and Kermorgant, 2014; Kermorgant and Parker, 2005). Phosphorylation of Ser985 in the juxtamembrane domain also inhibits the phosphorylation and activation of Met. Besides, tyrosine phosphatases such as protein-tyrosine phosphatase 1B (PTP1B) can attenuate Met signaling (Parikh and Ghate, 2018).
4.2. Physiological and pathological activities of HGF/Met in the liver
HGF/Met is essential for liver development. Homozygous null mice for both Met and HGF fail to complete the developmental process and die in utero due to impaired organogenesis of the placenta, the skeletal muscles of the limb and diaphragm, and the liver (Bladt et al., 1995; Schmidt et al., 1995; Uehara et al., 1995). HGF/Met plays important roles in the migration of myogenic precursor cells and in epithelial morphogenesis through its mitogenic, motogenic, morphogenic and anti-apoptotic activities. The impaired development of the embryonic liver in Met or HGF knockout mice is known to be due to the submassive apoptosis of hepatoblasts (Fausto et al., 1995; Nakamura et al., 2011; Stoker et al., 1987).
4.2.1. HGF/Met in liver regeneration
Despite the key roles exerted by HGF in developmental liver, selective ablation of Met in adult mouse livers seems not to be detrimental to hepatocyte function under physiological conditions. However, these conditional knockout models have demonstrated that the lack of Met dramatically affects the reparative responses of the liver against injury (Huh et al., 2004).
Hepatocytes lacking a functional Met receptor display an augmented
sensitivity to Fas-induced apoptosis which might be explained by the defects in the redox regulation and the lack of survival signaling pathway triggered by HGF/Met (Gomez-Quiroz et al., 2008; Huh et al., 2004). Liver specific Met knockout mice show delayed liver regeneration after partial hepatectomy. In this context, a decrease in mitotic hepatocytes due to a lack of ERK1/2

47
activation is observed in association with a persistent inflammatory reaction (Borowiak et al., 2004; Factor et al., 2010).
However, HGF/Met is not only important during hepatocyte-mediated regeneration, it is also essential for liver regeneration associated with HPC/oval cell-expansion. Thus, in liver-specific Met knockout mice, HPC/oval cell-mediated regenerative response after liver injury is abolished, which is associated with alteration in HPC/oval cell proliferation, survival, differentiation, migration and stemness capacities (Ishikawa et al., 2012). Moreover, other in vivo studies show that the increase in the expression of HGF accelerates proliferation of HPCs/oval cells in a damaged liver (Shiota et al., 2000). Our group and others have analyzed the effects of HGF/Met on HPCs/oval cells in vitro. We have demonstrated that HGF has a mitogenic activity while promotes invasion and migration and a morphogenic response in HPCs/oval cells (del Castillo et al., 2008b; Okano et al., 2003; Suarez-Causado et al., 2015; Yao et al., 2004). Furthermore, HGF/Met protects HPCs/oval cells from TGF-β-induced apoptotic death (Martinez-Palacian et al., 2013). These results indicate a unique role for HGF/Met in regulation of HPCs/oval cells biology that is critical for their function during liver regeneration.
Furthermore, liver specific Met knockout mice are more susceptible to chronic inflammation and liver fibrosis (Giebeler et al., 2009; Marquardt et al., 2012). HGF/Met exerts its hepatoprotective effect against fibrosis by different mechanisms. On the one hand, HGF/Met opposes to TGF-β pro-fibrotic activity at different levels. It reduces the expression of TGF-β, impairs TGF-β-mediated hepatocyte apoptosis and TGF-β-dependent transcriptional activity (Inagaki et al., 2008; Ueki et al., 1999), induces MMPs expression, which is believed to contribute to the resolution of liver fibrosis (Kanemura et al., 2008), and blocks TGF-β-induced EMT on biliary epithelial cells, one of the process that might contribute to MFB generation (Xia et al., 2006). HGF anti-fibrotic activity also relies on the induction of collagenase expression (Matsuda et al., 1997; Ozaki et al., 2002) and a strong cytostatic effect on activated HSCs (Kim et al., 2005; Li et al., 2008).
All of these findings set the basis to propose HGF/Met as a therapeutic target for the development of new anti-fibrotic and pro-regenerative liver treatments.
4.2.2. HGF/Met in HCC
As mentioned previously, HCC is a heterogeneous disease and the pathogenic mechanisms are still not clear. Dysregulation of HGF/Met signaling pathway has been associated with tumor onset but mainly tumor progression since this pathway can promote tumor growth, invasion, metastasis and angiogenesis (Giordano and Columbano, 2014). Contrarily, some works describe HGF/Met signaling as a tumor suppressor (Takami et al., 2007), highlighting the need to clarify the importance of HGF/Met in this context.

48
Met aberrations occur in approximately 50% of patients with HCC and can arise through gene mutation (4%), gene amplification (24%), increased mRNA expression (50%) and receptor overexpression (28%). Constitutively activating mutations in the kinase domain are rare in HCC. It is more frequent to find Met overexpression driving independent dimerization and activation. In other setting, abnormal high HGF levels also resulted in aberrant Met activity (Bouattour et al., 2018). In terms of the status and role of Met and HGF in liver cancer there are controversial results. While most of the studies show a decrease in HGF expression, there are disagreements on the percentage of liver tumor showing Met overexpression, and not only that, some works reveal opposite results, that is, a downregulation of Met in HCC (Giordano and Columbano, 2014). The prognostic utility of Met and HGF overexpression is also uncertain. While some works have not found any correlation between Met overexpression and tumor size, proliferation or invasive behavior (Boix et al., 1994; Okano et al., 1999), others have related Met overexpression with poorly differentiated HCC, increased metastasis and angiogenesis, early tumor recurrence and shorter survival (Daveau et al., 2003; Kim et al., 2017b; Ueki et al., 1997; Xie et al., 2001). The discrepancies could be consequence of the different techniques used to determine the levels of Met, the size and diversity of the group of patients included in the study with different tumor origins, or lack of data on Met activation. Indeed, the analysis of Met activation is important to classify the cluster of patients that would be sensitive to therapy with Met inhibitors (Giordano and Columbano, 2014; Venepalli and Goff, 2013).
In order to clarify the role of HGF/Met in HCC a number of in vitro and in vivo analyses have been performed, but unfortunately, findings are not conclusive. Thus, some early works described that HGF inhibits growth in most of HCC cell lines while exerts a pro-invasive action (Shiota et al., 1992; Tajima et al., 1991). Noticeably, the intracellular mechanisms triggered by HGF to impair HCC cell growth are not known. In later studies, inhibition or downregulation of Met interferes with both cell growth and invasion. Numerous studies show that Met overexpression promote HCC cell invasion and relate it to the ability of HGF/Met to induce EMT (Salvi et al., 2007; Xie et al., 2010) . Thus, HCC cells lines with high Met levels display a mesenchymal phenotype and markers (Ogunwobi and Liu, 2011; You et al., 2011).
Unfortunately, in vivo studies are not much more clarifying. A number of laboratories have analyzed the effects of inactivating or overexpressing Met and/or HGF on HCC, but the results are discordant. Both stimulatory and inhibitory effects on liver tumor formation have been described after exogenous administration of HGF on rat models of carcinogen-induced HCC (Liu et al., 1995; Ogasawara et al., 1998). Likewise, results from HGF transgenic mice showed either a pro-tumorigenic role of HGF or an inability to form HCC (Sakata et al., 1996; Santoni-Rugiu et al., 1996). The same variability is observed with Met receptor. Loss of Met in hepatocytes led to bigger tumors with shorter latency compared to controls in an experimental model of HCC. On the contrary, transgenic mouse models of MET overexpression in liver spontaneously generate liver tumors (Fan et al., 2017; Wang et al., 2001). The scenario is

49
complex and suggest that a fine balance of HGF/Met signaling is nessary for liver homeostasis.
Despite the controversy, based on evidence supporting a pro-tumorigenic role of HGF/Met in liver, HGF/Met axis has emerged as a therapeutic target in HCC. Nevertheless, the uncertain results indicate the necessity of further studies in order to select those patients with HGF/Met-dependent tumors for whom developing therapies could be effective. Indeed, inhibitors of Met/HGF signaling have demonstrated signs of efficacy against Met-positive HCCs. HGF neutralizing antibodies, HGF antagonists and Met tyrosine kinase inhibitors are utilized to inhibit Met in the clinic. Recently, the HGF/Met inhibitor cabozantinib has been approved for patients with HCC previously treated with sorafenib; and to date, other five HGF/Met inhibitors have been investigated in clinical trials in HCC. Tivantinib is in phase III studies and others such as capmatinib are being investigated in phase II (Bouattour et al., 2018; Zhang et al., 2018).
5. Senescence Cellular senescence is defined as a long-term cell cycle arrest despite
continued viability and metabolic activity (Kuilman et al., 2010). Senescence plays both beneficial and detrimental roles in the organism. Excessive accumulation of senescent cells and the inability to eliminate them can affect regenerative capacity and create a pro-inflammatory environment that favors the progression of some diseases, including cancer (Hernandez-Segura et al., 2018). On the contrary, transient induction of this program followed by tissue remodeling contribute to eliminate damaged cells, and due to the cell cycle arrest works as a barrier against cancer progression (Munoz-Espin and Serrano, 2014).
In vitro cell senescence can be induced by different stimuli such as progressive shortening of telomeres (replicative senescence) but it can be also activated in the absence of detectable telomere loss or dysfunction by different conditions such as DNA-damage, oncogene signals, oxidative stress, mitochondrial dysfunction and epigenetic changes, among others. If these “types of senescence” occur in vivo is not clear (Hernandez-Segura et al., 2018; Kuilman et al., 2010; Munoz-Espin and Serrano, 2014).
Mechanisms that ultimately lead to senescence depend on the cell type, conditions and stimuli. In general, many of the intracellular pathways driving senescence modulate p53, CKI such as p16 (cdkn2a), p15 (cdkn2b), p19 (ARF, cdkn2d)/p14 in humans, p21 (cdkn1a) and p27 (cdkn1b). Subsequently, hypo-phosphorylated RB accumulates, a crucial event in senescence, that in turn results in proliferative growth arrest (Munoz-Espin and Serrano, 2014). In human cells, p53 can induce senescence through a pathway independent of the RB family (Smogorzewska and de Lange, 2002).

50
5.1. Biomarkers
The identification of senescent cells is not an easy work. Many of the senescence-associated molecular and morphological features are present in other cellular states and the process is quite heterogeneous and dynamic (Hernandez-Segura et al., 2018). In spite of the complexity of the program, a panel of markers and hallmarks is often used to detect senescence in cultured cells and in tissue samples (Hernandez-Segura et al., 2018; Kuilman et al., 2010; Munoz-Espin and Serrano, 2014).
- In vitro senescent cells usually undergo evident morphological
changes. Cells become large, flat, vacuolized and sometimes, multinuclear. Contrarily, senescent cells in vivo maintain their normal morphology.
- Histochemical detection of β-galactosidase activity at pH 6.0, commonly referred to as senescence-associated β-galactosidase (SA-β-GAL). Its increased activity in senescent cells derives from lysosomal β-D-galactosidase and is due to an expansion of the lysosomal compartment giving rise to an increase in β-galactosidase activity that can be measured at suboptimal pH 6.0.
- Lack of proliferative markers (Ki67, 5-bromodeoxyuridine) incorporation) and presence of common mediators of senescence: p16, p19, p53, p21, p15, p27 and hypo-phosphorylated RB.
- Senescence-associated heterochromatic foci (SAHF). Cellular senescence can be associated with an altered chromatin structure, at least in vitro. Senescent cells show different heterochromatin patterns, but DNA SAHFs are enriched in repressive epigenetic markers.
- Senescence-associated secretory phenotype (SASP). Senescent cells secrete numerous factors that include TGF-β, IGF-I, inflammatory cytokines and chemokines that can reinforce and propagate senescence in an autocrine and paracrine manner.

51
Figure 12. Overview of senescence biomarkers. Senescence program can be activated by different stress stimuli such as oxidative stress, oncogenic signaling, ionizing radiation and replicative stress (due to deficiencies in the DNA replication machinery or maintenance of cell cycle checkpoints). Hallmarks of senescent cells include an irreversible cell cycle arrest, secretion of growth factors, cytokines among others (SASPs factors), expansion of the lysosomal compartment and SA-β-GAL expression, and rearrangement of the chromatin landscape (SAHFs). Adapted from Gonzalez-Meljem et al., 2018.
5.2. Physiological and pathological senescence
Generally, senescence process has been related to cellular damage or stress. However, cells with senescence features are found in embryonic structures where might play a role in organogenesis. Although these cells express SA-β-GAL, they do not present other characteristics found in stress-induced senescence. Thus, there is no relation with DNA damage; p53 and p16 are not usually found in these cells and SASP is not present. Evidences suggest that this type of senescence process relies on p21. In addition to embryonic development, senescence also takes part in maturation programs in adult cells (He and Sharpless, 2017).
In liver diseases, senescence may occur in different cell populations as part of the pathogenic mechanism.
Senescence in activated HSCs during liver fibrosis can block their proliferation, inhibit their activation, reduce ECM secretion and enhance immune surveillance (Guo, 2017; Krizhanovsky et al., 2008). Some growth factor and cytokines induce senescence in this hepatic cell population during liver
52
fibrosis/cirrhosis: IL-22, through the activation of STAT3; cysteine-rich angiogenic inducer 61, a non-structural protein of the extracellular matrix whose expression is induced upon injury; GATA6 and IGF-I. Mechanism of HSC senescence may involve upregulation of p53, p16, p21 and p27 (Guo, 2017; Kong et al., 2012; Krizhanovsky et al., 2008; Panebianco et al., 2017). In this way, induction of HSC senescence could constitute a therapeutic approach against liver fibrosis.
Immune cells also suffer the senescence process in patients with CLD. Accelerated telomere shortening in peripheral lymphocytes has been demonstrated in chronic viral hepatitis and cirrhosis (Guo, 2017).
Senescence in parenchymal cells, hepatocytes and cholangiocytes, has been observed in chronic human liver disorders and has been demonstrated in animal models of liver disease (Wiemann et al., 2002; Yang et al., 2004). The mechanism driving senescence in these cells during liver disease remains undefined. Replicative senescence or telomeric and non-telomeric DNA damage by oxidative stress have been proposed as origin of these senescent cells, although a combination of mechanisms is more likely (Aravinthan and Alexander, 2016). The accumulation of senescent cells influence disease progression through an impact on the microenvironment and tissue homeostasis. Hepatocyte senescence is a way of limiting tissue injury during normal wound healing process. The recruitment of immune cells for clearance of cell debris and senescent cells also contributes to successful wound healing outcome. However, sustained liver insult, which continuously generate senescent cells, together with immune cell senescence found in patients with CLD, which avoids the clearance of senescent cells, contribute to senescent cells accumulation. Additionally, animal models reveal that the accumulation of senescent hepatocytes leads to continuous activation of HSC and fibrosis progression. Although increased senescent cholangiocytes during CLD has also been demonstrated, it is not clear whether senescent cholangiocytes induce HSC activation or rather cholangiocyte senescence and HSC activation are parallel consequences of biliary injury. On the other hand, senescent hepatocytes undergo major metabolic changes such as alterations in the transport of bilirubin and acquisition of insulin resistance that lead to a decline in hepatocellular function (Aravinthan and Alexander, 2016).
Interestingly, SASP factors have both beneficial and detrimental effects. SASP factors reinforce the senescent state in an autocrine manner and induce senescence in neighboring normal hepatocytes, a phenomenon known as senescence-induced-senescence. Additionally, these factors promote inflammation, which aids in clearance of senescent cells and cell debris, thus favoring tissue repair and remodeling (Aravinthan and Alexander, 2016).
SASP factors may also promote tumorigenesis in neighboring cells. Accumulation of senescent cells during CLD results in a SASP-rich microenvironment, which promotes tumorigenesis in DNA-damaged, pre-senescent hepatocytes (Aravinthan and Alexander, 2016; Coppe et al., 2010;

53
Davalos et al., 2010). Related with this, escape of hepatocytes from senescent process is consider a primary mechanism involved in HCC development, as demonstrated by gene expression analysis of cirrhosis and HCC. Therefore, a potential therapeutic strategy could be induction of senescence in HCC cells, regulating the influence of SASP on the tumor microenvironment (Aravinthan and Alexander, 2016; Yildiz et al., 2013).


5. Background


57
HPC/oval cell response takes places during CLD in order to restore liver function (Duncan et al., 2009; Tanaka et al., 2011). However, the HPC/oval cell-associated regenerative response sometimes fails and HPCs/oval cells have been involved in the progression of liver fibrosis (Kuramitsu et al., 2013; Williams et al., 2014). Thus, the HPCs/oval cells fate and the mechanisms that regulate their function during the regenerative process accompanying CLDs are not fully understood. Dr. Sánchez´s laboratory research is focused on deciphering signals and mechanisms that regulate the biology and function of oval cells. Specifically, over the past few years, major efforts have been put into characterizing the relevance of the interaction between TGF-β ligands (TGF-β and BMP9) and two tyrosine kinase receptors, Met and EGFR, on oval cells regulation.
For that purpose, oval cell lines expressing a functional (Metflx/flx) or non-functional (Met-/-) Met receptor that lacks tyrosine kinase activity, were established from a Met knock-out mouse model generated in Dr. S.S.Thorgeirsson´s lab (Huh et al., 2004). These cell lines have become a key tool for the study of HGF/Met axis in oval cell control. A detailed characterization of this in vitro model showed that Met-/- oval cells are more sensitive to both serum withdrawal- and TGF-β-induced apoptosis than Metflx/flx cells (del Castillo et al., 2008b) (Figure 13a and b).
The differential behavior of these two cell lines in response to apoptotic signals evidenced the key pro-survival activity of HGF/Met signaling pathway on oval cells. This anti-apoptotic effect occurs through a paracrine (Figure 13b) and autocrine signaling, since an active autocrine HGF/Met loop is present in oval cells (Figure 14a and b).
Figure 13. Met−/− oval cells are more sensitive to serum withdrawal and TGF-β-induced apoptosis than Metflx/flx oval cells. a) Apoptotic index at different time points after serum
withdrawal. A total of 1000 to 2000 cells were counted per dish after propidium iodide (PI) staining under a fluorescence microscope in a blinded manner. Solid circles, Metflx/flx oval cells. Open circles, Met-/- oval cells. Data are mean ± S.E.M. of at least eight experiments. ** p < 0.01. b) Apoptotic index in oval cells treated with TGF-β (T; 1 ng/ml) for 48 hours in the absence or presence of HGF (H; 20 ng/ml). Apoptotic cells were determined as in a). Black bars, Metflx/flx oval cells. White bars, Met-/- oval cells. Data are mean ± S.E.M. of three experiments. *** p < 0.001 (versus T, Metflx/flx), ++ p < 0.01 (versus T, Metflx/flx) (del Castillo et al., 2008b).

58
It was also shown that TGF-β apoptotic process is mediated by intracellular ROS production. The upregulation of Nox4 suggested both mitochondrial and extra-mitochondrial sources for ROS (Figure 15a and b). Consistent with an increased sensitivity to apoptosis, intracellular ROS content and Nox4 expression were increased in TGF-β-treated Met-/- (Figure 15a and b) respect to Metflx/flx oval cells.
Figure 14. HGF/Met autocrine loop is active in Metflx/flx oval cells. a) HGF mRNA levels detected by RT-PCR analysis in untreated Metflx/flx and Met-/- oval cells. Bl, Blank, no reverse transcription. β-actin was used for normalization. b) Kinetics of Met activation in Metflx/flx cells cultured in serum-free medium or conditioned serum-free medium (CM). Whole protein extracts were used for immunoprecipitation of Met protein. Phosphorylation was detected by immunoblotting with anti-P-tyrosine antibody using Met as a loading control (del Castillo et al., 2008b).
Figure 15. Intracellular oxidative stress induced by TGF-β in oval cells is amplified in cells lacking a functional Met receptor. Metflx/flx and Met-/- oval cell lines were serum starved and incubated in the absence (C) or presence of 1 ng/ml TGF-β (Tβ) for different periods of time. a) After 30 minutes incubation with DFCH-DA (5 µM) fluorescence intensity was measured in a FACScan flow cytometer. Data are expressed as fold induction over untreated cells and are mean ± S.E.M. of three independent experiments run in duplicate. b) Nox4 mRNA levels were analyzed by RT-qPCR and normalized to the housekeeping gene Gusb. Data are expressed relative to untreated samples and are mean ± S.E.M. of at least four independent experiments. * p < 0.05; ** p < 0.01; *** p < 0.001 (treated versus untreated); # p < 0.05 (treated Met-/- versus treated Metflx/flx). Black bars, Metflx/flx oval cells. White bars, Met-/- oval cells (Martinez-Palacian et al., 2013).
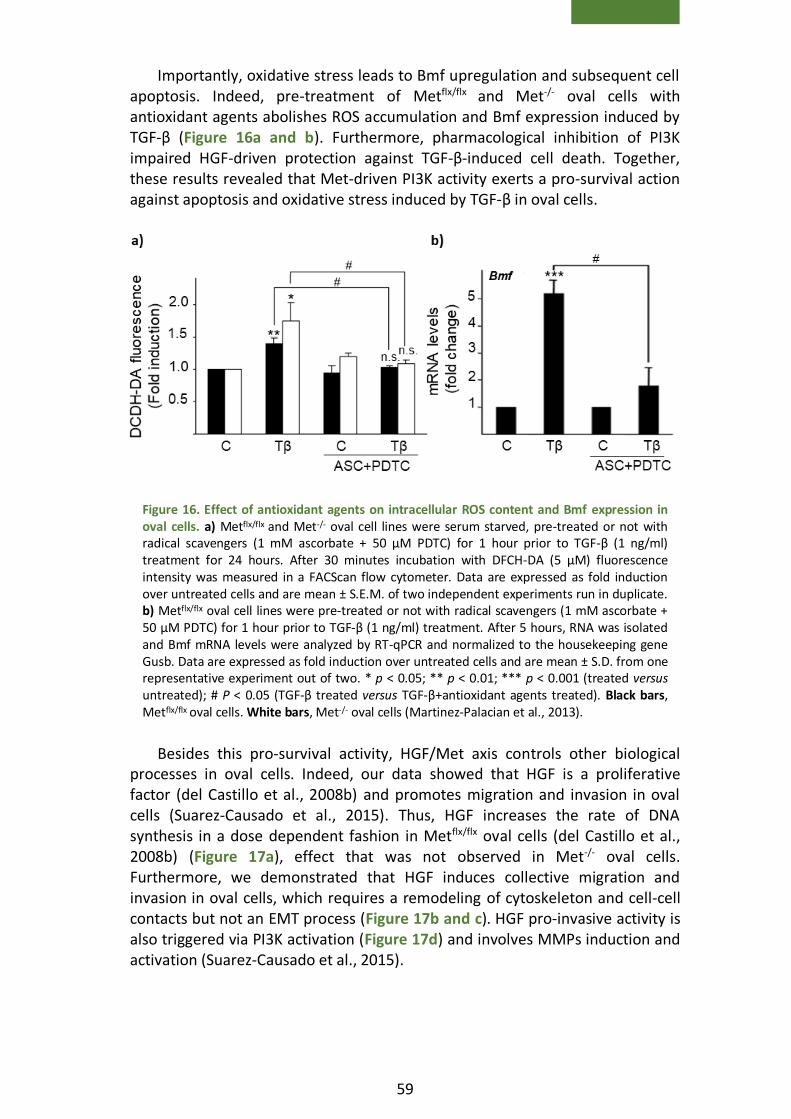
59
Importantly, oxidative stress leads to Bmf upregulation and subsequent cell apoptosis. Indeed, pre-treatment of Metflx/flx and Met-/- oval cells with antioxidant agents abolishes ROS accumulation and Bmf expression induced by TGF-β (Figure 16a and b). Furthermore, pharmacological inhibition of PI3K impaired HGF-driven protection against TGF-β-induced cell death. Together, these results revealed that Met-driven PI3K activity exerts a pro-survival action against apoptosis and oxidative stress induced by TGF-β in oval cells.
Besides this pro-survival activity, HGF/Met axis controls other biological processes in oval cells. Indeed, our data showed that HGF is a proliferative factor (del Castillo et al., 2008b) and promotes migration and invasion in oval cells (Suarez-Causado et al., 2015). Thus, HGF increases the rate of DNA synthesis in a dose dependent fashion in Metflx/flx oval cells (del Castillo et al., 2008b) (Figure 17a), effect that was not observed in Met-/- oval cells. Furthermore, we demonstrated that HGF induces collective migration and invasion in oval cells, which requires a remodeling of cytoskeleton and cell-cell contacts but not an EMT process (Figure 17b and c). HGF pro-invasive activity is also triggered via PI3K activation (Figure 17d) and involves MMPs induction and activation (Suarez-Causado et al., 2015).
Figure 16. Effect of antioxidant agents on intracellular ROS content and Bmf expression in oval cells. a) Metflx/flx and Met-/- oval cell lines were serum starved, pre-treated or not with radical scavengers (1 mM ascorbate + 50 µM PDTC) for 1 hour prior to TGF-β (1 ng/ml) treatment for 24 hours. After 30 minutes incubation with DFCH-DA (5 µM) fluorescence intensity was measured in a FACScan flow cytometer. Data are expressed as fold induction over untreated cells and are mean ± S.E.M. of two independent experiments run in duplicate. b) Metflx/flx oval cell lines were pre-treated or not with radical scavengers (1 mM ascorbate + 50 µM PDTC) for 1 hour prior to TGF-β (1 ng/ml) treatment. After 5 hours, RNA was isolated and Bmf mRNA levels were analyzed by RT-qPCR and normalized to the housekeeping gene Gusb. Data are expressed as fold induction over untreated cells and are mean ± S.D. from one representative experiment out of two. * p < 0.05; ** p < 0.01; *** p < 0.001 (treated versus untreated); # P < 0.05 (TGF-β treated versus TGF-β+antioxidant agents treated). Black bars, Metflx/flx oval cells. White bars, Met-/- oval cells (Martinez-Palacian et al., 2013).

60
Importantly, in regard to TGF-β-induced effects in oval cells, we observed that, not all the cells die in response to acute TGF-β treatment and there is a population of Metflx/flx and Met-/- oval cells that survive, as it occurs in fetal hepatocytes (Sanchez et al., 1999). Oval cells that survive to TGF-β-induced cell death undergo phenotypical changes that are consistent with an EMT process.
Figure 17. HGF acts as a proliferative, pro-migratory and pro-invasive factor in oval cells. a) [3H] Thymidine incorporation assay in Metflx/flx and Met-/- oval cells treated for 48 hours with HGF (10 and 40 ng/ml) and epidermal growth factor (20 ng/ml). Results are expressed as cpm/dish. Data are mean ± S.E.M. of triplicate experiments. Black bars, Metflx/flx oval cells. White bars, Met-/- oval cells (del Castillo et al., 2008b). b) Quantitative analysis of in vitro wound closure. Metflx/flx and Met-/- oval cells were cultured at confluency on plastic dishes. Next day a wound was done using a sterile tip and cells were cultured during 48 hours with or without HGF (40 ng/ml). Data are expressed as % of closure and are mean ± S.E.M. of four independent experiments. c) Metflx/flx and Met-/- oval cells were plated on the upper chamber of a 24-transwell plate coated with matrigel and incubated for 24 hours in the absence or presence of HGF (40 ng/ml). Cells that passed through matrigel-coated filters were fixed and stained with crystal violet and counted by phase contrast microscopy. Data are number of invaded cells and are mean ± S.E.M. of at least 5 experiments performed in duplicate. d) Effect of p85 silencing on HGF-induced oval cell invasion. 24 hours after transfection with non-targeting (NT) small interference RNA (siRNA) or p85 specific siRNAs (sip85) cells were trypsinized and seeded on transwell chambers coated with matrigel and cultured for 24 hours with or without HGF (40 ng/ml). Data are expressed as fold change with respect to control and are mean ± S.E.M. of 5 independent experiments run in triplicate. * p < 0.05; **p < 0.01; ***p < 0.001 (treated versus untreated or as indicated) (Suarez-Causado et al., 2015).
d)
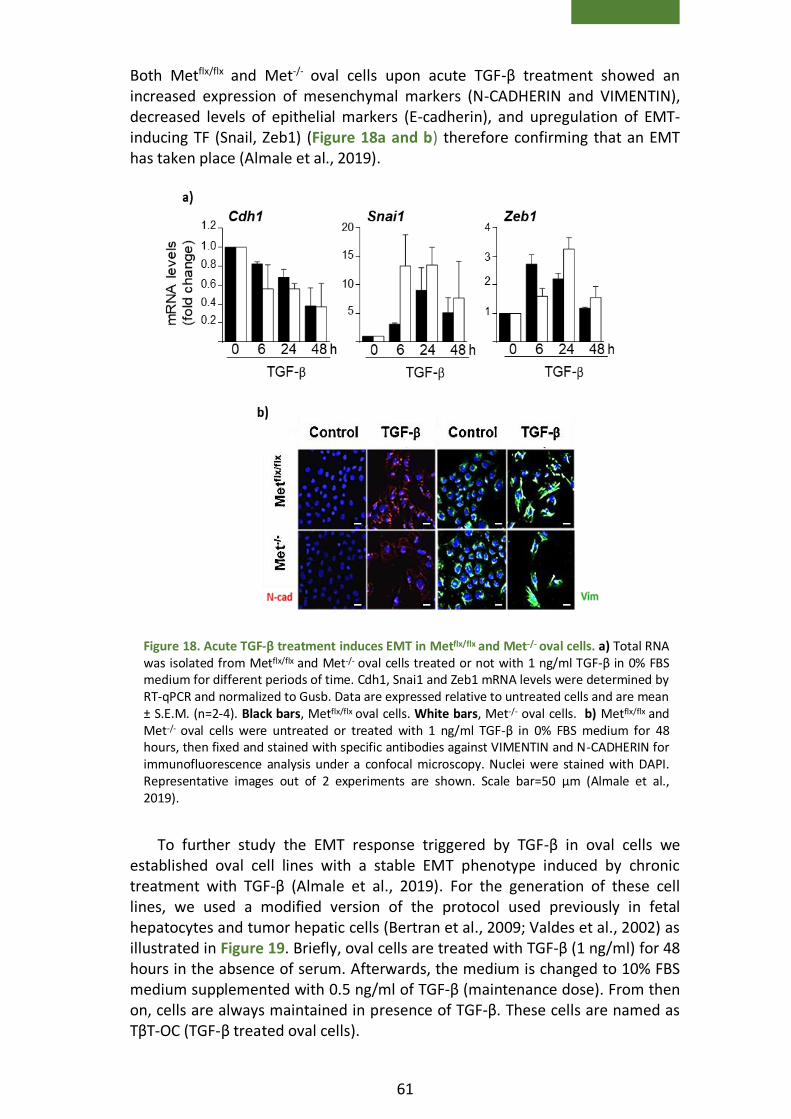
61
Both Metflx/flx and Met-/- oval cells upon acute TGF-β treatment showed an increased expression of mesenchymal markers (N-CADHERIN and VIMENTIN), decreased levels of epithelial markers (E-cadherin), and upregulation of EMT-inducing TF (Snail, Zeb1) (Figure 18a and b) therefore confirming that an EMT has taken place (Almale et al., 2019).
To further study the EMT response triggered by TGF-β in oval cells we established oval cell lines with a stable EMT phenotype induced by chronic treatment with TGF-β (Almale et al., 2019). For the generation of these cell lines, we used a modified version of the protocol used previously in fetal hepatocytes and tumor hepatic cells (Bertran et al., 2009; Valdes et al., 2002) as illustrated in Figure 19. Briefly, oval cells are treated with TGF-β (1 ng/ml) for 48 hours in the absence of serum. Afterwards, the medium is changed to 10% FBS medium supplemented with 0.5 ng/ml of TGF-β (maintenance dose). From then on, cells are always maintained in presence of TGF-β. These cells are named as TβT-OC (TGF-β treated oval cells).
Figure 19. Scheme of the establishment of TβT- OC.
Figure 18. Acute TGF-β treatment induces EMT in Metflx/flx and Met-/- oval cells. a) Total RNA was isolated from Metflx/flx and Met-/- oval cells treated or not with 1 ng/ml TGF-β in 0% FBS medium for different periods of time. Cdh1, Snai1 and Zeb1 mRNA levels were determined by RT-qPCR and normalized to Gusb. Data are expressed relative to untreated cells and are mean ± S.E.M. (n=2-4). Black bars, Metflx/flx oval cells. White bars, Met-/- oval cells. b) Metflx/flx and Met-/- oval cells were untreated or treated with 1 ng/ml TGF-β in 0% FBS medium for 48 hours, then fixed and stained with specific antibodies against VIMENTIN and N-CADHERIN for immunofluorescence analysis under a confocal microscopy. Nuclei were stained with DAPI. Representative images out of 2 experiments are shown. Scale bar=50 μm (Almale et al., 2019).

62
Once TβT-OC were established, functional properties of these cells were analyzed (Almale et al., 2019).
Figure 20. Chronic EMT induces functional changes in oval cells. a) Apoptotic index in oval cells and TβT-OC treated with TGF-β for 48 hours. A total of 1000 to 2000 cells were counted per dish after PI staining under a fluorescence microscope in a blinded manner. Data are mean ± S.E.M. of 4 experiments performed in triplicate. b) OCR and rate ECAR of oval cells, TβT-OC and Ras-oval cells were analyzed in 25 mM glucose medium. Ratios OCR/ECAR were calculated. Data are mean ± S.E.M. (n=8). c) Lactate production in oval cells, TβT-OC and Ras-oval cells in 25 mM glucose medium. Data are mean ± S.E.M. of 2 independent experiments performed in triplicate. d) Oval cells, TβT-OC and Ras-oval cells were plated in soft agar and the colonies were counted after 2 weeks. Data are mean ± S.E.M. (n=4). * p < 0.05; ** p < 0.01; *** p < 0.005 (versus oval cells or untreated group or as indicated). (Almale et al., 2019)
Figure 19. Scheme of the establishment of TβT- OC.
63
Firstly, cells chronically treated with TGF-β lost the apoptotic cell death response upon acute treatment with TGF-β, proving that EMT confers oval cells resistance against TGF-β-induced apoptosis (Figure 20a). Likewise, TβT-OC showed lower apoptosis under serum deprivation. Moreover, TβT-OC displayed a switch in their bio-energetic profile towards a more glycolytic phenotype, expressed as oxygen consumption rate/ extracellular acidification rate (OCR/ECAR) ratio, further confirmed by increased lactate production (Figure 20b and c).
These features (apoptotic resistance and switch of bio-energetic profile) found in TβT-OC are similar to those found in oval cells transformed with oncogenic v-Ha-Ras (Ras-OC), used as a control of tumorigenic cells (Figure 20b and c). However, despite these similarities with tumor cells, TβT-OC do not acquire anchorage independent growth capacity (Figure 20d) discarding a malignant transformation after EMT (Almale et al., 2019).


6. Aims


67
TGF-β and HGF/Met pathways are important mediators during liver regeneration, fibrosis and hepatocarcinogenesis and play roles on different liver cell populations. Taking this into consideration, the general objective of this work was to analyze the relevance of the crosstalk between TGF-β and HGF/Met pathways in oval cell biology and fate in a context of chronic liver injury as well as to explore if such crosstalk could play a role during hepatocarcinogenesis.
To achieve this general objective, we propose three specific objectives:
Objective 1: To characterize the TGF-β-induced EMT response in oval cells in vitro and to evaluate the effects on oval cell fate upon transplantation into a fibrotic liver.
Objective 2: To elucidate the HGF/Met signaling-mediated regulation on the EMT response induced by TGF-β and its contribution to oval cell properties.
Objective 3: To analyze the TGF-β pathway in liver tumor cells from Met-overexpressing livers and how affects tumor cell growth and survival properties.


7. Materials
and methods

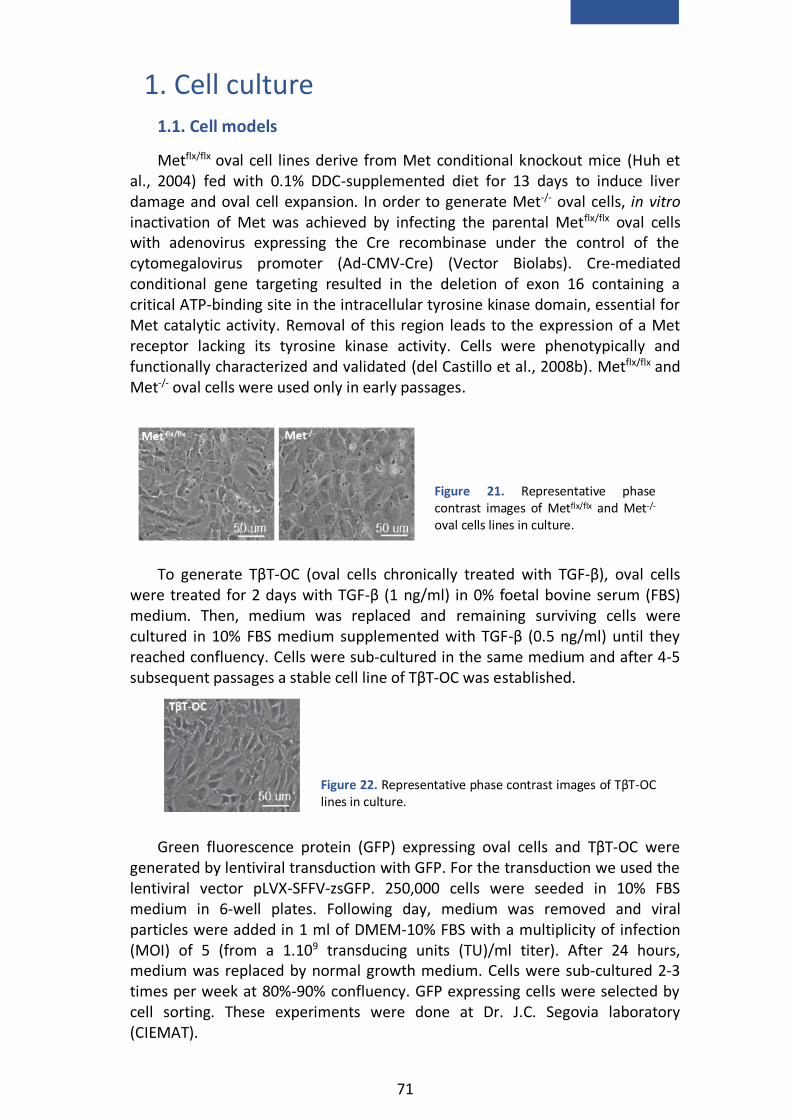
71
1. Cell culture
1.1. Cell models
Metflx/flx oval cell lines derive from Met conditional knockout mice (Huh et al., 2004) fed with 0.1% DDC-supplemented diet for 13 days to induce liver damage and oval cell expansion. In order to generate Met-/- oval cells, in vitro inactivation of Met was achieved by infecting the parental Metflx/flx oval cells with adenovirus expressing the Cre recombinase under the control of the cytomegalovirus promoter (Ad-CMV-Cre) (Vector Biolabs). Cre-mediated conditional gene targeting resulted in the deletion of exon 16 containing a critical ATP-binding site in the intracellular tyrosine kinase domain, essential for Met catalytic activity. Removal of this region leads to the expression of a Met receptor lacking its tyrosine kinase activity. Cells were phenotypically and functionally characterized and validated (del Castillo et al., 2008b). Metflx/flx and Met-/- oval cells were used only in early passages.
To generate TβT-OC (oval cells chronically treated with TGF-β), oval cells
were treated for 2 days with TGF-β (1 ng/ml) in 0% foetal bovine serum (FBS) medium. Then, medium was replaced and remaining surviving cells were cultured in 10% FBS medium supplemented with TGF-β (0.5 ng/ml) until they reached confluency. Cells were sub-cultured in the same medium and after 4-5 subsequent passages a stable cell line of TβT-OC was established.
Green fluorescence protein (GFP) expressing oval cells and TβT-OC were
generated by lentiviral transduction with GFP. For the transduction we used the lentiviral vector pLVX-SFFV-zsGFP. 250,000 cells were seeded in 10% FBS medium in 6-well plates. Following day, medium was removed and viral particles were added in 1 ml of DMEM-10% FBS with a multiplicity of infection (MOI) of 5 (from a 1.109 transducing units (TU)/ml titer). After 24 hours, medium was replaced by normal growth medium. Cells were sub-cultured 2-3 times per week at 80%-90% confluency. GFP expressing cells were selected by cell sorting. These experiments were done at Dr. J.C. Segovia laboratory (CIEMAT).
Figure 21. Representative phase contrast images of Metflx/flx and Met-/- oval cells lines in culture.
Figure 22. Representative phase contrast images of TβT-OC lines in culture.

72
Alb-R26Met HCC cells derive from Alb-R26Met mice, mice with increased Met
levels in the liver generated in Dr. F. Maina laboratory. For the generation of these animals, R26stopMet (international nomenclature Gt(ROSA)26Sortm1(Actb-
Met)Fmai) mice were crossed with Albumin-Cre, that is, mice expressing Cre recombinase under the control of albumin promoter. Thus, in R26Met mice, Met transgene is carried in the Rosa26 locus that is expressed in albumin positive cells. These mice spontaneously generate liver tumors (from 40 weeks of age). Several HCC cell lines from individual Alb-R26Met tumors were generated (Alb-R26Met HCC cells). In this work, we use two different HCC cells lines expressing different Met levels: HCC1, with high Met levels (named as HCC1HMet) and HCC3, with low Met levels (named as HCC3LMet).
1.2. Cell culture conditions
Cell lines were grown in the appropiated medium (Table 1) and were placed in a humidified incubator at 37°C and 5% CO2. Cells were passaged at 80%-90% confluency using trypsin-ethylene diaminetetraacetic acid (EDTA) and medium was replaced every 3 days.
For cryopreservation, cells were harvested and centrifuged (5 minutes, 1,300 rpm). The cells pellet was resuspended in 10% (v/v) dimethyl sulfoxide (DMSO)-FBS and transferred to cryotubes. Cells were frozen slowly using the Mr. Frosty freezing container (Thermo Scientific) at -80°C and moved to the liquid nitrogen (-190°C) tank within a week.
Cells thawing was done quickly in a water bath at 37°C. Once thawed, cells were placed in a culture dish with growth medium. Upon attachment, medium was replaced with fresh medium to completely remove the DMSO.
Figure 24. Representative phase contrast images of HCC1HMet and HCC3LMet cells in culture .
Figure 23. Representative fluorescence microscopy images of OC-GFP and TβT-OC-GFP in culture.
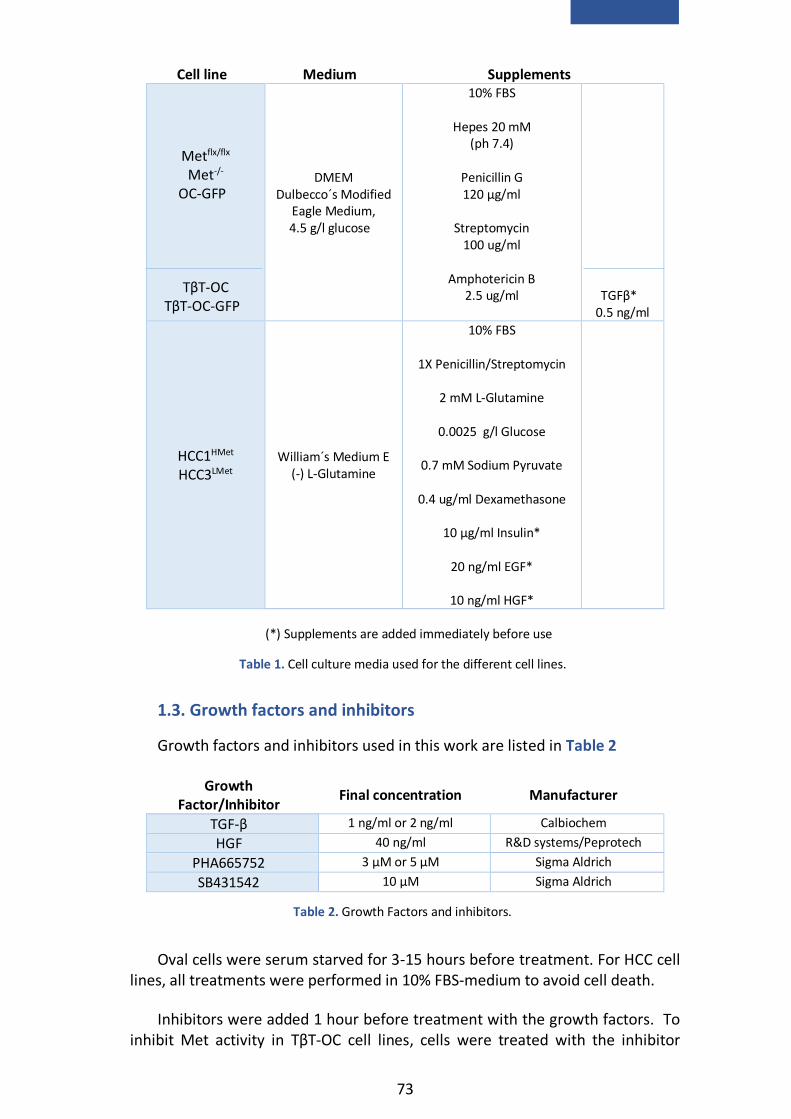
73
Cell line Medium Supplements
Metflx/flx
Met-/-
OC-GFP
TβT-OC
TβT-OC-GFP
DMEM Dulbecco´s Modified
Eagle Medium, 4.5 g/l glucose
10% FBS
Hepes 20 mM (ph 7.4)
Penicillin G 120 μg/ml
Streptomycin
100 ug/ml
Amphotericin B 2.5 ug/ml
TGFβ*
0.5 ng/ml
HCC1HMet HCC3LMet
William´s Medium E (-) L-Glutamine
10% FBS
1X Penicillin/Streptomycin
2 mM L-Glutamine
0.0025 g/l Glucose
0.7 mM Sodium Pyruvate
0.4 ug/ml Dexamethasone
10 μg/ml Insulin*
20 ng/ml EGF*
10 ng/ml HGF*
1.3. Growth factors and inhibitors
Growth factors and inhibitors used in this work are listed in Table 2
Growth Factor/Inhibitor
Final concentration Manufacturer
TGF-β 1 ng/ml or 2 ng/ml Calbiochem
HGF 40 ng/ml R&D systems/Peprotech
PHA665752 3 μM or 5 μM Sigma Aldrich
SB431542 10 μM Sigma Aldrich
Oval cells were serum starved for 3-15 hours before treatment. For HCC cell lines, all treatments were performed in 10% FBS-medium to avoid cell death.
Inhibitors were added 1 hour before treatment with the growth factors. To inhibit Met activity in TβT-OC cell lines, cells were treated with the inhibitor
Table 1. Cell culture media used for the different cell lines.
(*) Supplements are added immediately before use
Table 2. Growth Factors and inhibitors.

74
PHA665752 during 2 weeks prior to the experiment and during the course of the experiment.
2. DNA analysis
2.1. DNA isolation from cultured cells
DNA was extracted for genotyping Metflx/flx and Met-/- oval cells. First, cells were washed with cold phosphate buffered saline (PBS) and lysed overnight in lysis buffer (Table 3) at 58°C in a rotating oven (400 rpm). DNA was isolated using a phenol/chloroform extraction protocol. An equal volume of phenol was added to cell lysates and mixed for 10 minutes. They were centrifuged at 12,000 rpm for 3 minutes and the supernatant was transferred to a new tube. An equal volume of chloroform/isoamylalcohol (24:1) was added, mixed for 10 minutes, and centrifuged at 12,000 rpm for 3 minutes. Supernatant was transferred to a new tube and the extraction was repeated with chloroform alone. DNA was precipitated with 1/10 volume of 3M sodium acetate (pH 5.2) and 1 volume of isopropanol. Precipitated DNA was transferred into a tube with 70% ethanol and centrifuged at 9,000 rpm for 2 minutes. The pellet was resuspended in tris-EDTA (TE) buffer (Table 4) and incubated at 37°C to facilitate resuspension.
Component Final
concentration
Tris-HCl pH 8.5 100 mM
EDTA 5 mM
Sodium dodecyl sulphate (SDS)
0.2%
NaCl 200 mM
Proteinase K* 100 μg/ml
2.2. DNA isolation from liver tissue
DNA from liver tissue was isolated for the detection of floxed allele in the liver of transplanted mice (analysis of cell engraftment). For genomic DNA isolation, hepatic tissue was digested overnight in lysis buffer (Table 3), as explained before. Next day samples were centrifuged at 13,000 rpm for 10 minutes, supernatant was collected and genomic DNA was precipitated with cold isopropanol. DNA was diluted in TE buffer (Table 4) at 37°C.
Table 3. DNA isolation buffer.
(*) Added immediately before use
Component Final
concentration
Tris-HCl pH 8 10 mM
EDTA 1 mM
Table 4. TE buffer
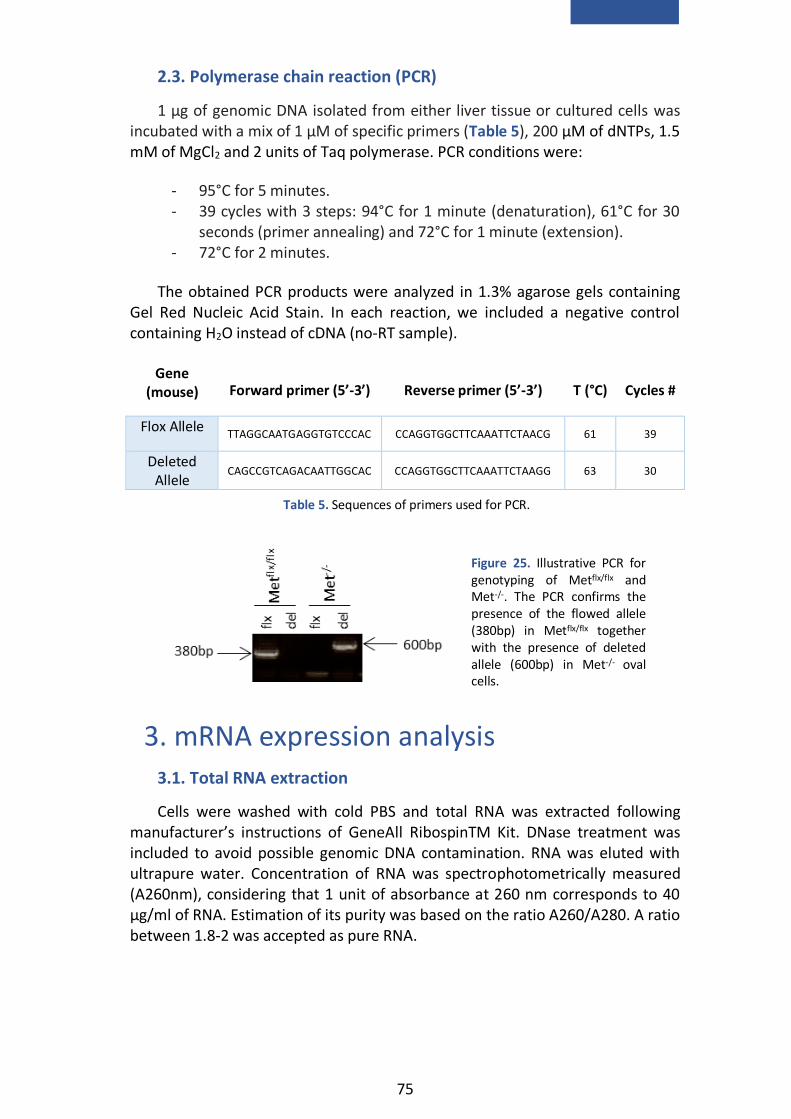
75
2.3. Polymerase chain reaction (PCR)
1 μg of genomic DNA isolated from either liver tissue or cultured cells was incubated with a mix of 1 µM of specific primers (Table 5), 200 μM of dNTPs, 1.5 mM of MgCl2 and 2 units of Taq polymerase. PCR conditions were:
- 95°C for 5 minutes. - 39 cycles with 3 steps: 94°C for 1 minute (denaturation), 61°C for 30
seconds (primer annealing) and 72°C for 1 minute (extension). - 72°C for 2 minutes.
The obtained PCR products were analyzed in 1.3% agarose gels containing Gel Red Nucleic Acid Stain. In each reaction, we included a negative control containing H2O instead of cDNA (no-RT sample).
Gene
(mouse) Forward primer (5’-3’) Reverse primer (5’-3’) T (°C) Cycles #
Flox Allele TTAGGCAATGAGGTGTCCCAC CCAGGTGGCTTCAAATTCTAACG 61 39
Deleted Allele
CAGCCGTCAGACAATTGGCAC CCAGGTGGCTTCAAATTCTAAGG 63 30
3. mRNA expression analysis
3.1. Total RNA extraction
Cells were washed with cold PBS and total RNA was extracted following manufacturer’s instructions of GeneAll RibospinTM Kit. DNase treatment was included to avoid possible genomic DNA contamination. RNA was eluted with ultrapure water. Concentration of RNA was spectrophotometrically measured (A260nm), considering that 1 unit of absorbance at 260 nm corresponds to 40 μg/ml of RNA. Estimation of its purity was based on the ratio A260/A280. A ratio between 1.8-2 was accepted as pure RNA.
Figure 25. Illustrative PCR for genotyping of Metflx/flx and Met-/-. The PCR confirms the presence of the flowed allele (380bp) in Metflx/flx together with the presence of deleted allele (600bp) in Met-/- oval cells.
Table 5. Sequences of primers used for PCR.

76
3.2. cDNA synthesis (reverse transcription, RT)
cDNA synthesis was performed using two alternative protocols:
For oval cells, we used 1 µg of total RNA. cDNA synthesis was performed in two consecutive reactions. In a first reaction, RNA was incubated with oligo dT (0.25 µg) and dNTPs (0.5 mM) at 65°C for 5 minutes to denature RNA. Then, this mix was incubated at 50°C for 1 hour in the presence of a cDNA synthesis mix (5X RT Buffer, 20 units of RNase inhibitor, 5 mM dithiothreitol (DTT), 200 units of SuperScript III) in a final volume of 20 μl. The enzyme was inactivated by heating samples at 70°C for 15 minutes.
For HCC cells, 600 ng of total RNA was used for complementary DNA synthesis by iScripTM Reverse Transcription Supermix (Bio-Rad) following the manufacturer’s instructions.
In both cases, cDNA was diluted as required with nuclease free water and stored at -20°C until further use.
3.3. Quantitative reverse transcription PCR (RT-qPCR)
Real time PCR was performed using specific primers (Table 6) and SYBR Green to detect DNA in the 7900 Fast Real Time System (Life technologies)/ QFX 96 (BioRad). PCR reactions were done in triplicate. Gusb and Hprt were used as housekeeping genes.
During the exponential phase of real time PCR, a fluorescence signal threshold was determined, so that it was significantly greater than background fluorescence. The fractional number of PCR cycles required to reach this threshold is defined as the cycle threshold or Ct. Based on this, quantification of RNA levels was performed through calculation of RQ (2-ΔΔCt). First, ΔCt value for each sample and gene is obtained by subtracting the Ct value for Gusb from the Ct value for the target gene under a particular experimental condition. Then, resulting ΔCt value is referred to control ΔCt value (sample ΔCt - control ΔCt = ΔΔCt) to calculate the RQ value.
Protein Gene
(Mus musculus) Forward primer
(5’-3’) Reverse primer
(5’-3’)
AFP Afp TGTTGCCAAGGAAACTCG GCAGCACTCTGCTATTTTGC
CD44 Cd44 GGCCACCATTGCCTCAACTGT TGCACTCGTTGTGGGCTCCTG
E-CADHERIN Cdh1 CAGCCTTCTTTTCGGAAGACT GGTAGACAGCTCCCTATGACTG
P21 Cdkn1a TATCCAGACATTCAGAGCCACA TCCAGCTTGCAGATGACCTT
P27 Cdkn1b TTCGCAAAACAAAAGGGCCAA CTTAATTCGGAGCTCTTTACGTCTG
p15 Cdkn2b CAATCCAGGTCATGATGATGGG TCGTGCACAGGTCTGGTAAG
P19 Cdkn2d CATCTGGAGCAGCATGGAGTC ATCATCATCACCTGAATCGGGG
CTGF Ctgf CACTCTGCCAGTGGAGTTCA AAGATGTCATTGTCCCCAGG
CYP7A1 Cyp7a1 CAACCTGCCAGTACTAGAT AAGGTGTAGAGTGAAGTCCTCC
EPCAM Epcam ACCTGAGAGTGAACGGAGAGCC TGCATGGAGAACTCGGGTGCCT
GGT Ggt TGCGGTTTCAGAGGATGGCAG AACAGGATGCCACTGACCCGA
GUSB Gusb AAAATGGAGTGCGTGTTGGGTCG CCACAGTCCGTCCAGCGCCTT
HGF Hgf GAGTCTGAGTTATGTGCTGGG AGGACGATTTGGGATGGC
HNF1B Hnf1b TCTCAGAACCTCATCAGACC GCTAGCCACACTGTTAATGACC

77
HNF4A Hnf4a GGCATGGATATGGCCGACTAC TTCAGATGGGGACGTGTCATT
HPRT Hprt CTGGTGAAAAGGACCTCTCGAAG CCAGTTTCACTAATGACACAAACG
MMP10 Mmp10 AACACGGAGACTTTTACCCTTTT GGTGCAAGTGTCCATTTCTCAT
MMP13 Mmp13 TTGGTCCCTGCCCCTTCCCTAT CGCAAGAGTCGCAGGATGGT
MMP2 Mmp2 CAACGGTCGGGAATACAGCA AGCCATACTTGCCATCCTTCTC
MMP9 Mmp9 CAAACCCTGTGTGTTCCCGT TGGTCATAGTTGGCTGTGGTG
NOX4 Nox4 CCTCAACTGCAGCCTCATCC CAACAATCTTCTTGTTCTCC
HNF6 Onecut1 CCTGGAGCAAACTCAAGTCG GTCCTTCCCGTGTTCTTGC
PAI1 Pai1 CGGCGGCAGATCCAAGATGCTA TTGTTCCACGGCCCCATGAGCT
PDGFA Pdgfa ACCATCGGGAGGAGGAGAC CACGGAGGAGAACAAAGACC
PDGFB Pdgfb ACTTGAACATGACCCGAGCA ATCTGGAACACCTCTGTGCG
PDGFC Pdgfc AGGTTGTCTCCTGGTCAAGC CCTGCGTTTCCTCTACACAC
PDGFD Pdgfd CCAAGGAACCTGCTTCTGAC CTTGGAGGGATCTCCTTGTG
CD133 Prom1 CTGGGATTGTTGGCCCTCTC AGGGCAATCTCCTTGGAATCA
SMAD6 Smad6 TGCGACCTCTGCTTCGGTGGAT TGGGGCAAGTCTCTCCTGAACG
SMAD7 Smad7 ATCGGTCACACTGGTGCGTG TCCGAGGCAAAAGCCATTCCCC
SNAI1 Snai1 TCCAAACCCACTCGGATGTGAAGA TTGGTGCTTGTGGAGCAAGGACAT
TGF-α Tgfa TCCTCATTATCACCTGTGTGC GTCTCAGAGTGGCAGCAAGC
TGF-β1 Tgfb1 ATGAACCGGCCCTTCCTGCT TTGGTATCCAGGGCTCTCCGGT
TGFβR1 Tgfbr1 GCTCCAAACCACAGAGTAGGCAC CCCATTGCATAGATGTCAGCGCG
TIMP1 Timp1 TGGGTGGATGAGTAATGCGT GGTATCTGCTCTGGTGTGTCTC
TIMP3 Timp3 AGGCTTCAGTAAGATGCCCC TTCATACACGCGCCCTGTC
TWIST2 Twist 2 GCAAGAAGTCGAGCGAAGAT GCTCTGCAGCTCCTCGAA
TWIST1 Twist1 CCGGAGACCTAGATGTCATTGT CCACGCCCTGATTCTTGTGA
4. Protein expression analysis
4.1. Protein expression analysis by western blot
4.1.1. Cell extract preparation
Cells were washed with cold PBS and lysed with RIPA (Table 7) or EBM (Table 8) lysis buffer.
RIPA lysis buffer EBM lysis buffer
Component Final
concentration Component
Final
concentration
Na-deoxycholate
1% (p/v) Glycerol 10%
Tris-HCl (pH 7.4) 10 mM Tris-HCl (pH 7.5) 20 mM
SDS 0,1% (p/v) Triton 1%
NaCl 150 mM NaCl 150 mM
Table 6. Sequences of primers used for RT-qPCR.
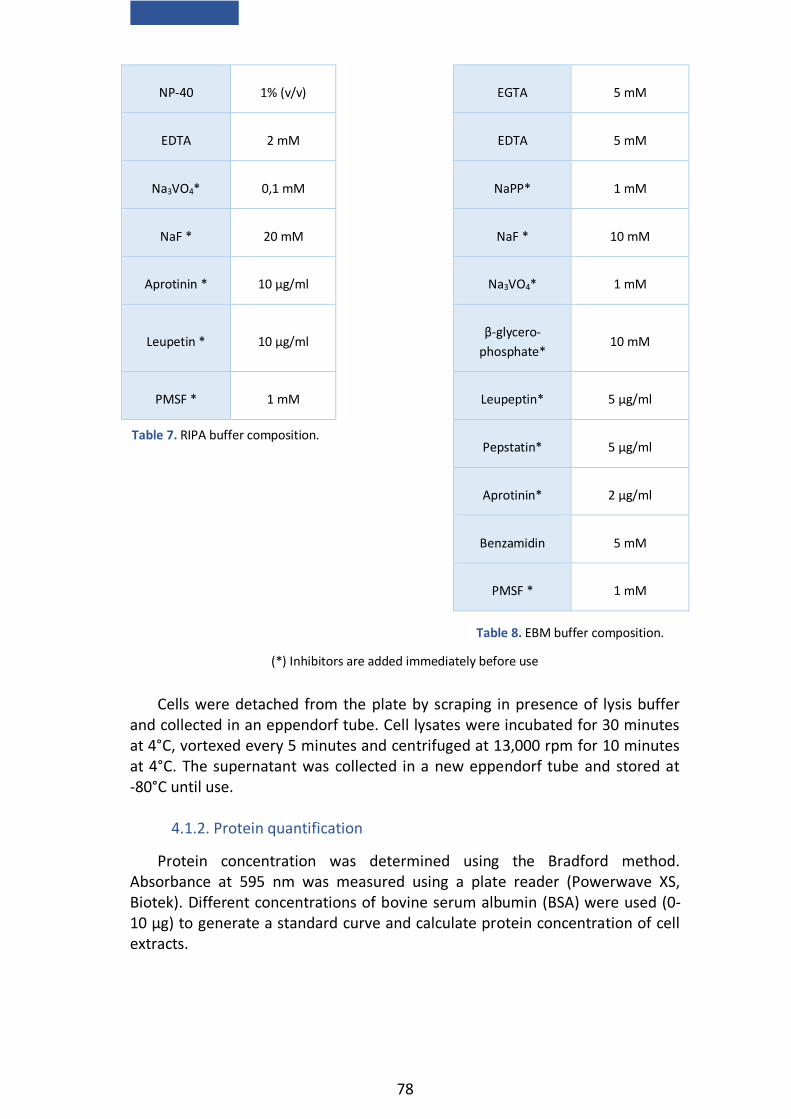
78
NP-40 1% (v/v) EGTA 5 mM
EDTA 2 mM EDTA 5 mM
Na3VO4* 0,1 mM NaPP* 1 mM
NaF * 20 mM NaF * 10 mM
Aprotinin * 10 µg/ml Na3VO4* 1 mM
Leupetin * 10 µg/ml β-glycero-
phosphate* 10 mM
PMSF * 1 mM Leupeptin* 5 µg/ml
Pepstatin* 5 µg/ml
Aprotinin* 2 µg/ml
Benzamidin 5 mM
PMSF * 1 mM
Cells were detached from the plate by scraping in presence of lysis buffer and collected in an eppendorf tube. Cell lysates were incubated for 30 minutes at 4°C, vortexed every 5 minutes and centrifuged at 13,000 rpm for 10 minutes at 4°C. The supernatant was collected in a new eppendorf tube and stored at -80°C until use.
4.1.2. Protein quantification
Protein concentration was determined using the Bradford method. Absorbance at 595 nm was measured using a plate reader (Powerwave XS, Biotek). Different concentrations of bovine serum albumin (BSA) were used (0-10 μg) to generate a standard curve and calculate protein concentration of cell extracts.
Table 7. RIPA buffer composition.
(*) Inhibitors are added immediately before use
Table 8. EBM buffer composition.
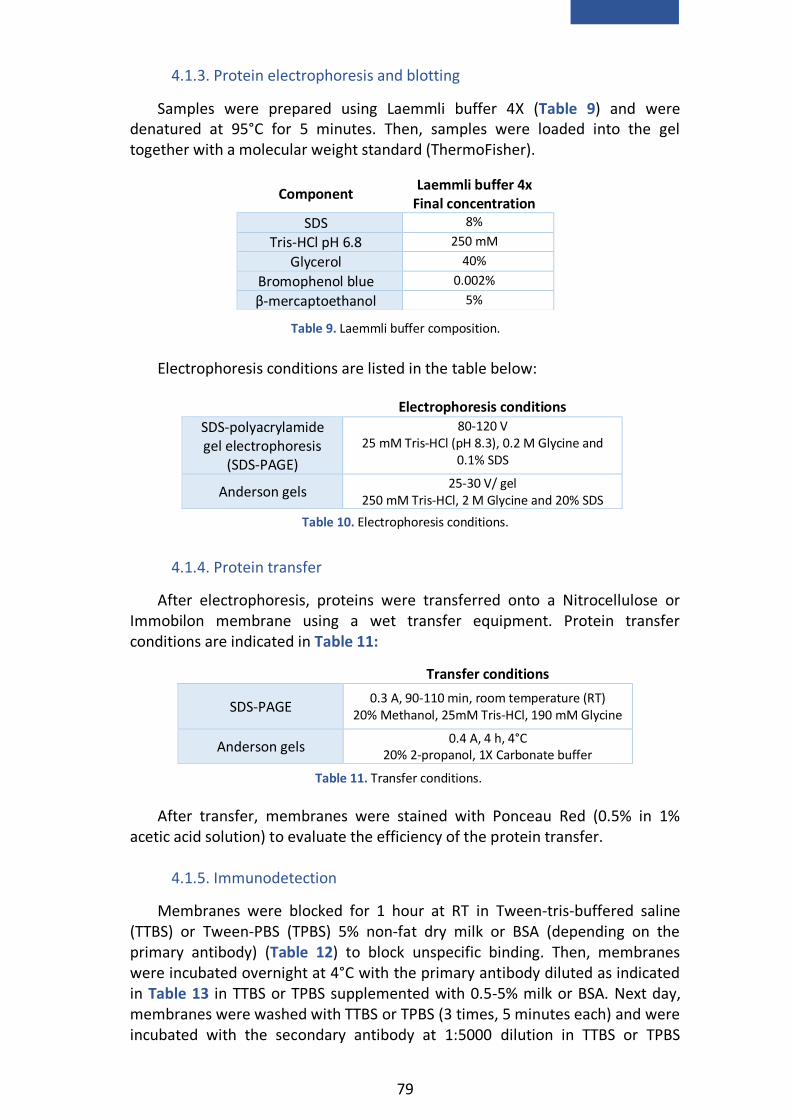
79
4.1.3. Protein electrophoresis and blotting
Samples were prepared using Laemmli buffer 4X (Table 9) and were denatured at 95°C for 5 minutes. Then, samples were loaded into the gel together with a molecular weight standard (ThermoFisher).
Electrophoresis conditions are listed in the table below:
4.1.4. Protein transfer
After electrophoresis, proteins were transferred onto a Nitrocellulose or Immobilon membrane using a wet transfer equipment. Protein transfer conditions are indicated in Table 11:
Transfer conditions
SDS-PAGE 0.3 A, 90-110 min, room temperature (RT)
20% Methanol, 25mM Tris-HCl, 190 mM Glycine
Anderson gels 0.4 A, 4 h, 4°C
20% 2-propanol, 1X Carbonate buffer
After transfer, membranes were stained with Ponceau Red (0.5% in 1%
acetic acid solution) to evaluate the efficiency of the protein transfer.
4.1.5. Immunodetection
Membranes were blocked for 1 hour at RT in Tween-tris-buffered saline (TTBS) or Tween-PBS (TPBS) 5% non-fat dry milk or BSA (depending on the primary antibody) (Table 12) to block unspecific binding. Then, membranes were incubated overnight at 4°C with the primary antibody diluted as indicated in Table 13 in TTBS or TPBS supplemented with 0.5-5% milk or BSA. Next day, membranes were washed with TTBS or TPBS (3 times, 5 minutes each) and were incubated with the secondary antibody at 1:5000 dilution in TTBS or TPBS
Component Laemmli buffer 4x
Final concentration
SDS 8%
Tris-HCl pH 6.8 250 mM
Glycerol 40%
Bromophenol blue 0.002%
β-mercaptoethanol 5%
Electrophoresis conditions
SDS-polyacrylamide gel electrophoresis
(SDS-PAGE)
80-120 V 25 mM Tris-HCl (pH 8.3), 0.2 M Glycine and
0.1% SDS
Anderson gels 25-30 V/ gel
250 mM Tris-HCl, 2 M Glycine and 20% SDS
Table 9. Laemmli buffer composition.
Table 10. Electrophoresis conditions.
Table 11. Transfer conditions.

80
supplemented with 0.5-1% milk or BSA for 1-2 hours at RT. After this period, membranes were washed 3 times (5 minutes each) and incubated with a chemiluminescent solution (Pierce ECL western blotting substrate).
SDS-PAGE Anderson gels
TTBS TPBS 20mM Tris-HCl (pH 7.6)
150mM NaCl 0.05% Tween-20
PBS 0.1% Tween 20
Primary Antibody Laboratory Dilution Secondary antibody
ALBUMIN (RaRa/Alb/PO) Nordic Immunology 1:1000 Rabbit
β-ACTIN Sigma-Aldrich (A-5441) 1:5000
Mouse Sigma-Aldrich (A-3853) 1:10000
E-CADHERIN BD Transduction Laboratories
(610181) 1:1000 Rabbit
ERK1/2 Cell Signaling Technology
(9102) 1:10000 Rabbit
L-CADHERIN Santa Cruz Biotechnology
(25628) 1:1000 Rabbit
MET
Santa Cruz Biotechnology (162)
1:1000 Rabbit
Cell Signaling Technology (3127)
Mouse
N-CADHERIN BD Transduction Laboratories
(610921) 1:1000 Mouse
OCCLUDIN Thermo Fisher Scientific
(711500) 1:1000 Rabbit
Phospho-AKT Cell Signaling Technology
(Ser473) (9271) 1:1000 Rabbit
Phospho-ERK1/2
Cell Signaling Technology
(Thr202/Tyr204) (9101) 1:1000 Rabbit
Cell Signaling Technology (T202/Y204) (9106)
1:10000 Mouse
Phospho-GAB1 Cell Signaling Technology
(Y627) (3231) 1:2000 Rabbit
Phospho-MET
Cell Signaling Technology (Tyr1234/1235) (3077)
1:1000 Rabbit
Cell Signaling Technology (Y1234/1235) (3126)
1:2000
Phospho-SMAD2 Cell Signaling Technology
(Ser465/467) (3101) 1:1000 Rabbit
SMAD2/3 Cell Signaling Technology
(5678) 1:1000 Rabbit
TUBULIN Santa Cruz Biotechnology
(8035) 1:5000 Mouse
TWIST Abcam (50887) 1:1000 Mouse
Table 13. Primary antibodies used for western blot.
Table 12. TTBS and TPBS buffer composition.

81
4.2. Protein expression analysis by immunoprecipitation assay
Total cell extracts for Met immunoprecipitation were prepared using RIPA buffer (section 4.1.1.). 1,000 μg of protein were diluted in lysis buffer to 1 μg/μl and anti-Met antibody (SC-162) was added (7 μg/mg of protein). This mix was incubated overnight at 4°C under rotation in presence of protein A-agarose beads (Roche), previously washed and resuspended in lysis buffer.
Next day, immunoprecipitates were washed 3 times with lysis buffer and resuspended in Laemli buffer 4X (section 4.1.3.). Then, samples were heated at 95°C for 5 minutes and centrifuged to separate the protein A-agarose. In parallel, we prepared a mock IP control (lacking protein extract) and IP control (without antibody).
Samples were loaded into an 8% SDS-PAGE gel together with a molecular weight standard. Gel electrophoresis and wet transfer (2 hours, 100V) were performed as described before (section 4.1.3. and 4.1.4) to detect phosphorylated and total Met by western blot (section 4.1.5) using the antibodies listed in Table 14 (del Castillo.et al., 2008b).
Primary Antibody Laboratory Dilution Secondary
antibody
MET Santa Cruz
Biotechnology (162)
1:1000 TTBS-0.5% milk
Rabbit 1:5000 TTBS-0.5% milk
Anti-phospho-Tyr Kinase
Upstate Biotechnology
(4G10)
1:1000 TTBS-3% milk
Mouse 1:3000 TTBS-0.5% milk
4.3. Protein expression analysis by flow cytometry
For protein expression analysis by flow cytometry, cells were detached with trypsin-EDTA and centrifuged at 1,200 rpm for 5 minutes at 4°C. Then, cells were washed and centrifuged again in the same conditions and resuspended in PBS. 1x10⁶ cells were collected for each condition and the following protocols were followed to analyze different proteins.
EPCAM analysis
A blocking step was performed by incubating cells in PBS-5% mouse serum for 15 minutes at 4°C. Cells were washed with PBS-3% BSA and centrifuged at 2,000 rpm for 5 minutes at 4°C. The cell pellet was resuspended in PBS-3% BSA and incubated with EPCAM-Phycoerythrin or with Isotype control mouse IgG1 (Table 15) or with PBS-3% BSA only, as a control, for 30 minutes at 4°C in darkness. Then, cells were washed with PBS and centrifuged at 2,000 rpm for 5 minutes at 4°C. The pellet was resuspended in PBS and transferred to cytometry tubes.
Table 14. Antibodies used for immunoprecipitation and western blot assays.

82
CD44 analysis
Cells were resuspended in PBS-0.1% BSA and incubated with CD44-Alexa 488 or with Isotype control Rat IgG (Table 15) or with PBS-0.1% BSA only, as a control, for 30 minutes at 4°C in darkness. Then, cells were washed with PBS and centrifuged at 2,000 rpm for 5 minutes at 4°C. The pellet was resuspended in PBS and transferred to cytometry tubes.
In both cases, 10,000 cells per condition were analysed by FACScalibur (Becton Dickinson; Flow Cytometry and Microscopy Core Facility at UCM
Antibody Laboratory Dilution
EPCAM-Phycoerythrin Santa Cruz
Biotechnology 66020 1:50
EPCAM isotype control Mouse IgG1 Santa Cruz
Biotechnology 2866 1:50
CD44-Alexa 488 BioLegend 103016 1:50
CD44 Isotype control Rat IgG BioLegend 400625 1:50
4.4. Protein expression analysis by immunocytochemistry
150,000 oval cells or 700,000 HCC cells were seeded on gelatin-coated glass coverslips in 12-wells plates or in 6 cm dishes, respectively. Next day, cells were washed with PBS and the following protocols were followed for detecting specific proteins (Suarez-Causado et al., 2015; Almale et al., 2019).
E-CADHERINE, N-CADHERIN and ALBUMIN analysis
Cells were fixed in cold methanol (-20°C) for 2 minutes at RT and then coverslips were washed twice with PBS and blocked in PBS-2% BSA for 1 hour at RT. Next, they were incubated with primary antibody (Table 16) in PBS-1% BSA, in a humidified chamber for 1 hour at 37°C. Coverslips were washed 3 times in PBS (5 minutes each) and incubated with secondary antibody in PBS-1% BSA for 1 hour at 37°C. Finally, cells were washed 3 times in PBS (5 minutes each) and mounted with Slowfade gold antifade reagent containing 4′,6-diAmidino-2-phenylIndole (DAPI) (Invitrogen).
CK19
Cells were fixed in ethanol 95% for 10 minutes at 4°C. Then, coverslips were washed twice with TBS (Table 12), blocked and fixed in TBS-0.3% Triton X-100-5% goat serum for 2 hours at RT. After washing once with TBS cells were incubated with primary antibody (Table 16) in blocking solution, in a humidified chamber overnight at 4°C. Coverslips were washed 3 times in TBS (5 minutes each) and incubated with secondary antibody in PBS-0.1% BSA for 1 hour at 37°C. Finally, cells were washed and mounted as explained before.
Table 15. Antibodies used for protein expression analysis by flow cytometry.

83
ZO-1 analysis
Cells were fixed in 4% paraformaldehyde (PFA) for 20 minutes at RT and permeabilized with PBS-0.1% Triton X-100-0.1% BSA for 20 minutes. Then coverslips were washed twice with PBS and blocked in PBS-2% BSA for 1 hour at RT. Next, they were incubated with primary antibody (Table 16) in PBS-1% BSA, in a humidified chamber for 1 hour at 37°C. Coverslips were washed 3 times in PBS (5 minutes each) and incubated with secondary antibody in PBS-1% BSA for 1 hour at 37°C. Finally, cells were washed and mounted as explained before.
In all cases, cells were examined in a confocal microscope (Olympus FV1200,
Flow Cytometry and Microscopy Core Facility at UCM).
Cleaved CASPASE-3 analysis
For detecting activated CASPASE-3, we used an antibody against the large fragment (17/19 kDa) resulting from cleavage of the pro-caspase (Table 16). Cells were fixed in 4% PFA for 10 minutes followed by two washes with PBS. The unmasking was done in PBS supplemented with 50 mM Lysine-50 mM NH4Cl2 for 15 minutes at RT. Then, cells were washed 3 times (5 minutes each), permeabilized with PBS-0.1% Triton X-100 for 15 minutes, washed 3 times (5 minutes each) with TPBS (Table 12) and blocked in TPBS-10% donkey serum for 1 hour. Incubation with primary antibody (Table 16) was done overnight at 4°C in blocking solution using a humidified chamber. Coverslips were washed 3 times (10 minutes each) with TPBS and incubated with the secondary antibody in blocking solution 1 hour at RT. Then, cells were washed with TPBS 3 times (10 minutes each) and once with PBS. For nuclear counterstaining cells were incubated in PBS-DAPI (1 μg/ml) for 15 minutes at RT. Finally, cells were washed with PBS and mounted in Prolong Gold antifade reagent (Thermofisher).
Primary
Antibody
Laboratory Dilution Secondary
Antibody Dilution
E-CADHERIN BD Transduction
Laboratories (610181) 1:50
Mouse
Alexa 488 1:200
ALBUMIN
(RaRa/Alb/PO)
Nordic Immunology 1:50 Rabbit
Alexa 594 1:200
CK19 (TROMAIII) Hybridoma Bank 1:50
Rat
Fitc 1:200
N-CADHERIN BD Transduction
Laboratories (610921) 1:50
Mouse
Alexa 488 1:200
ZO-1 Thermo Fisher Scientific
(617300) 1:50
Rabbit
Alexa 594 1:200
Cleaved
CASPASE-3
Cell Signaling
Technology (Asp175)
(9661)
1:500 Rabbit
Alexa 488 1:500
Table 16. Antibodies used for immunofluorescence staining for confocal microscopy analysis.

84
Cells were visualized under a Zeiss Apotome Microscope with a 20X objective. The fluorescence intensity was measured in at least 6 fields per condition by Image J program.
4.5. Protein expression analysis by immunohistochemistry and immunofluorescence in hepatic tissues
4.5.1. pSMAD2 staining on liver sections: paraffin embedding and immunohistochemistry
For paraffin embedding, liver tissue was fixed in 4% PFA for 4 hours at 4°C, rinsed twice with PBS and dehydrated by immersion in increasing concentrations of alcohol Dehydrated samples were then embedded in paraffin as indicated in Table 17. Following day, samples were allowed to solidify at RT.
Step Time
Ethanol 50% 40 minutes Ethanol 70% 40 minutes Ethanol 95% 40 minutes
Ethanol 95% (4°C) Overnight Ethanol 100% 40 minutes
Ethanol 100% 40 minutes
Ethanol 100% 40 minutes
Acetone:Paraffin (1:1) (62°C) 30 minutes
Paraffin (62°C) 1 hour
Paraffin (62°C) 1 hour
Paraffin (62°C) Overnight
Paraffin-embedded samples were cut into 4 μm-thick sections using a microtome, placed in slides and left air-drying at 37°C. For pSMAD2 staining, paraffin was removed and tissue was rehydrated. For that, samples were placed at 50°C for 30 minutes and passed through alcohol solutions with decreasing concentrations as indicated in Table 18.
Step Time
Xylene 10 minutes
Xylene 10 minutes
Xylene 10 minutes
Ethanol 100% 5 minutes
Ethanol 100% 5 minutes
Ethanol 100% 5 minutes
Ethanol 96% 5 minutes
Ethanol 96% 5 minutes
Ethanol 70% 5 minutes
Distilled water 5 minutes
Table 18. Hydration steps for immunohistochemistry.
Table 17. Steps for paraffin-embedding.
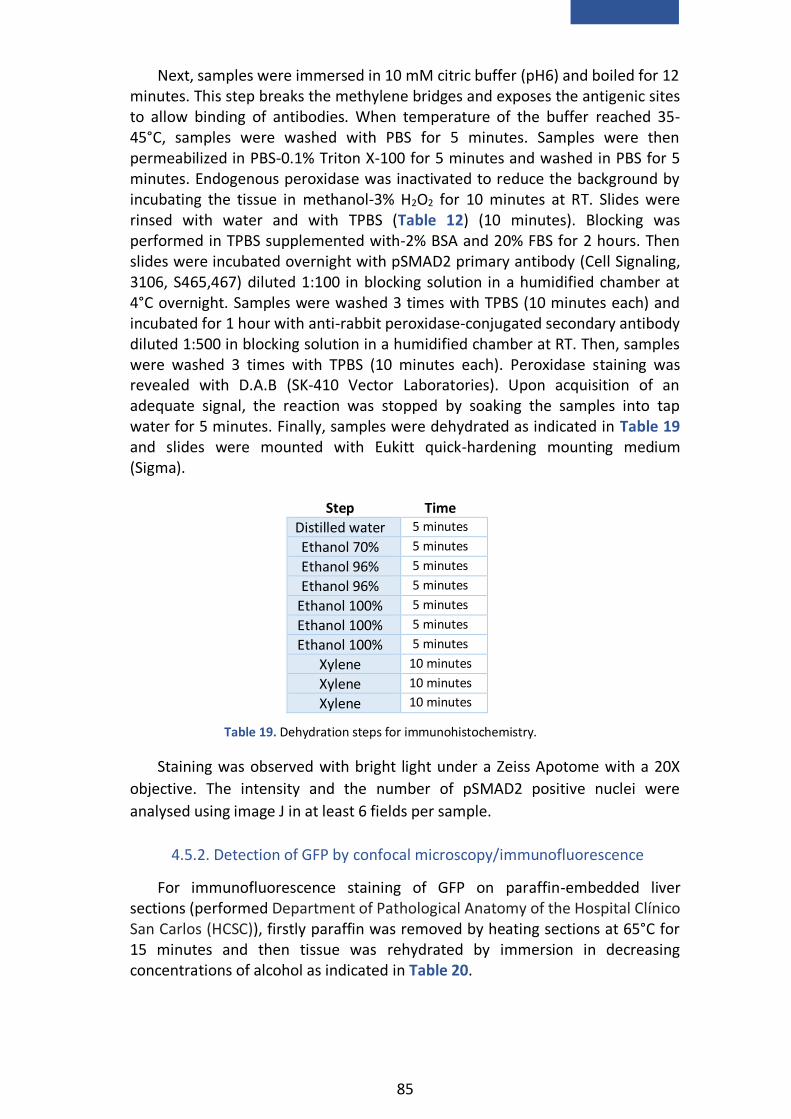
85
Next, samples were immersed in 10 mM citric buffer (pH6) and boiled for 12 minutes. This step breaks the methylene bridges and exposes the antigenic sites to allow binding of antibodies. When temperature of the buffer reached 35-45°C, samples were washed with PBS for 5 minutes. Samples were then permeabilized in PBS-0.1% Triton X-100 for 5 minutes and washed in PBS for 5 minutes. Endogenous peroxidase was inactivated to reduce the background by incubating the tissue in methanol-3% H2O2 for 10 minutes at RT. Slides were rinsed with water and with TPBS (Table 12) (10 minutes). Blocking was performed in TPBS supplemented with-2% BSA and 20% FBS for 2 hours. Then slides were incubated overnight with pSMAD2 primary antibody (Cell Signaling, 3106, S465,467) diluted 1:100 in blocking solution in a humidified chamber at 4°C overnight. Samples were washed 3 times with TPBS (10 minutes each) and incubated for 1 hour with anti-rabbit peroxidase-conjugated secondary antibody diluted 1:500 in blocking solution in a humidified chamber at RT. Then, samples were washed 3 times with TPBS (10 minutes each). Peroxidase staining was revealed with D.A.B (SK-410 Vector Laboratories). Upon acquisition of an adequate signal, the reaction was stopped by soaking the samples into tap water for 5 minutes. Finally, samples were dehydrated as indicated in Table 19 and slides were mounted with Eukitt quick-hardening mounting medium (Sigma).
Step Time
Distilled water 5 minutes Ethanol 70% 5 minutes Ethanol 96% 5 minutes Ethanol 96% 5 minutes
Ethanol 100% 5 minutes Ethanol 100% 5 minutes Ethanol 100% 5 minutes
Xylene 10 minutes
Xylene 10 minutes
Xylene 10 minutes
Staining was observed with bright light under a Zeiss Apotome with a 20X
objective. The intensity and the number of pSMAD2 positive nuclei were
analysed using image J in at least 6 fields per sample.
4.5.2. Detection of GFP by confocal microscopy/immunofluorescence
For immunofluorescence staining of GFP on paraffin-embedded liver sections (performed Department of Pathological Anatomy of the Hospital Clínico San Carlos (HCSC)), firstly paraffin was removed by heating sections at 65°C for 15 minutes and then tissue was rehydrated by immersion in decreasing concentrations of alcohol as indicated in Table 20.
Table 19. Dehydration steps for immunohistochemistry.
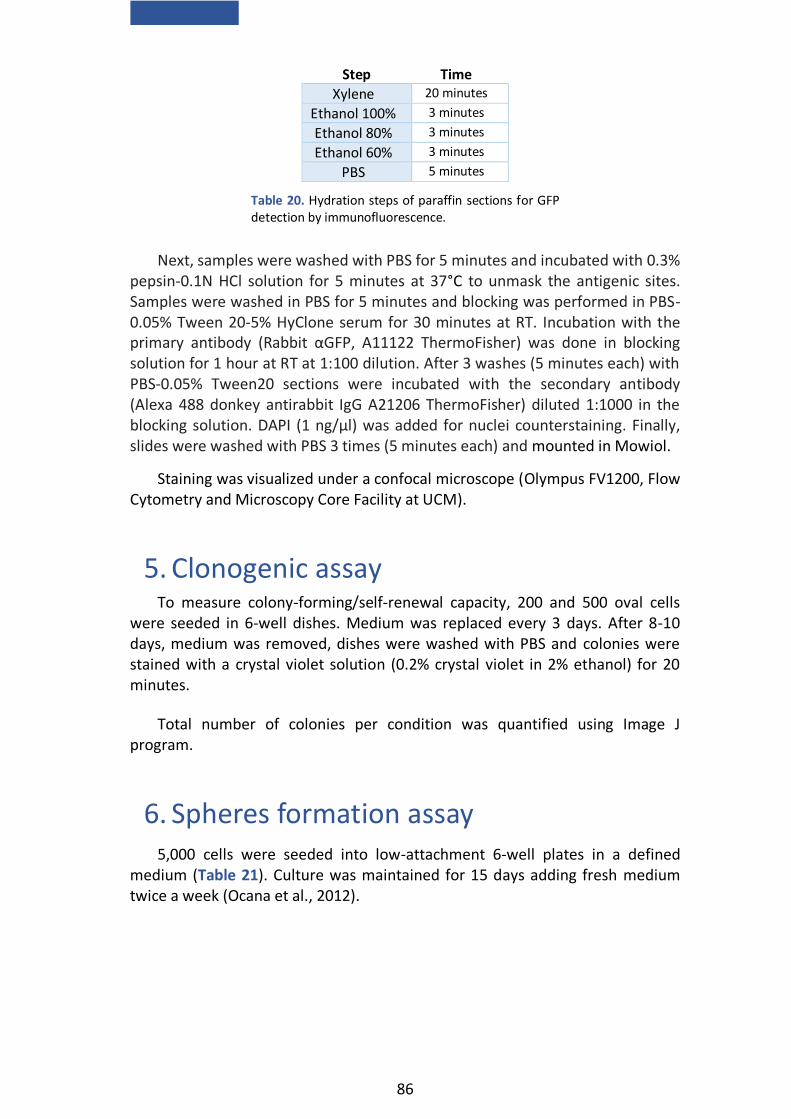
86
Step Time
Xylene 20 minutes
Ethanol 100% 3 minutes
Ethanol 80% 3 minutes
Ethanol 60% 3 minutes
PBS 5 minutes
Next, samples were washed with PBS for 5 minutes and incubated with 0.3% pepsin-0.1N HCl solution for 5 minutes at 37°C to unmask the antigenic sites. Samples were washed in PBS for 5 minutes and blocking was performed in PBS-0.05% Tween 20-5% HyClone serum for 30 minutes at RT. Incubation with the primary antibody (Rabbit αGFP, A11122 ThermoFisher) was done in blocking solution for 1 hour at RT at 1:100 dilution. After 3 washes (5 minutes each) with PBS-0.05% Tween20 sections were incubated with the secondary antibody (Alexa 488 donkey antirabbit IgG A21206 ThermoFisher) diluted 1:1000 in the blocking solution. DAPI (1 ng/μl) was added for nuclei counterstaining. Finally, slides were washed with PBS 3 times (5 minutes each) and mounted in Mowiol.
Staining was visualized under a confocal microscope (Olympus FV1200, Flow Cytometry and Microscopy Core Facility at UCM).
5. Clonogenic assay To measure colony-forming/self-renewal capacity, 200 and 500 oval cells
were seeded in 6-well dishes. Medium was replaced every 3 days. After 8-10 days, medium was removed, dishes were washed with PBS and colonies were stained with a crystal violet solution (0.2% crystal violet in 2% ethanol) for 20 minutes.
Total number of colonies per condition was quantified using Image J program.
6. Spheres formation assay 5,000 cells were seeded into low-attachment 6-well plates in a defined
medium (Table 21). Culture was maintained for 15 days adding fresh medium twice a week (Ocana et al., 2012).
Table 20. Hydration steps of paraffin sections for GFP detection by immunofluorescence.

87
Medium Supplements Final
Concentration
DMEM 4,5 g/l glucose
Hepes (pH 7.4) 20 mM
Penicilin G 120 µg/ml
Streptomycin 100 µg/ml Amphotericin B 2.5 µg/ml
Insulin* 5 μg/ml
hEGF* 20 ng/ml
Heparin* 4 μg/ml
B27 (w/ vit A)* 2%
Hydrocortisone* 0.5 μg/ml
For spheroid formation analysis, photographs of all spheroids in each well were taken under a phase contrast microscopy (Eclipse TE300, Nikon, connected to a camera Nikon digital Sight DS-U2) using a 20X objective. Both number of spheroid and spheroid diameter were measured using the Image J program. Spheroids were classified in three groups based upon size: [25-50 µm], (50-100 µm], > 100 µm.
7. Analysis of cell number 7.1. Analysis of cell number in the presence of serum
20,000 oval cells were seeded in 12-well plates in triplicates in DMEM-10% FBS. Media was replaced twice a week and cells were counted daily for 7 days using trypan blue staining and a Neubauer chamber.
7.2. Analysis of cell number in the absence of serum
57,000 oval cells or 25,000 HCC cells were seeded in 12-well plates in triplicate in 10% FBS media. The following day, serum (oval cells) or medium supplements (HCC cells) were removed prior to stimuli addition. Cells were counted at specific times as explained before (section 7.1).
8. Invasion assay Analysis of cell invasive/migratory capacity was performed using transwell
inserts (24-well plate inserts; 8 μm pore size; cell growth area 0.3 sq cm, BD Bioscience) coated with Matrigel (330 μg/ml) or type IV collagen (7.5 μg/ml) according to the manufacturer´s recommendation. 50,000-67,000 oval cells were seeded in triplicate on the upper chamber and incubated in the presence of stimuli in DMEM-0% FBS. DMEM-0% FBS was added in the lower compartment.
(*) Supplements are added immediately before use
Table 21. Medium used for spheres formation assay.
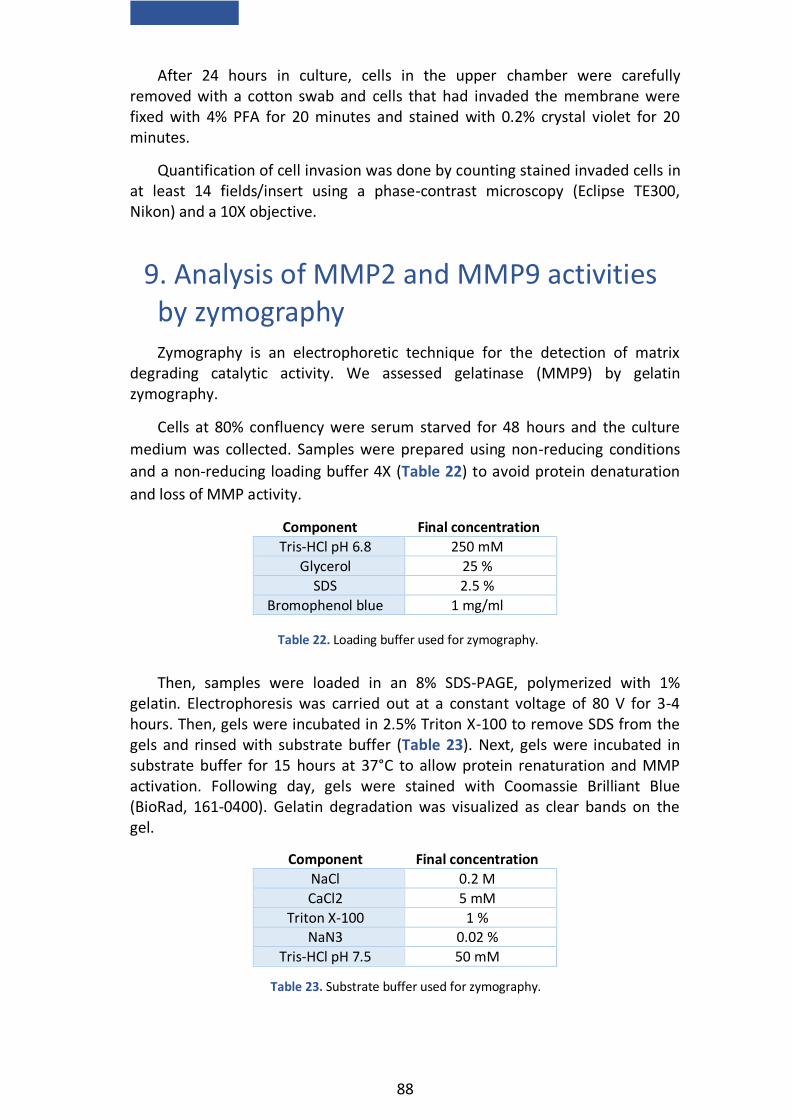
88
After 24 hours in culture, cells in the upper chamber were carefully removed with a cotton swab and cells that had invaded the membrane were fixed with 4% PFA for 20 minutes and stained with 0.2% crystal violet for 20 minutes.
Quantification of cell invasion was done by counting stained invaded cells in at least 14 fields/insert using a phase-contrast microscopy (Eclipse TE300, Nikon) and a 10X objective.
9. Analysis of MMP2 and MMP9 activities by zymography
Zymography is an electrophoretic technique for the detection of matrix degrading catalytic activity. We assessed gelatinase (MMP9) by gelatin zymography.
Cells at 80% confluency were serum starved for 48 hours and the culture
medium was collected. Samples were prepared using non-reducing conditions
and a non-reducing loading buffer 4X (Table 22) to avoid protein denaturation
and loss of MMP activity.
Component Final concentration
Tris-HCl pH 6.8 250 mM
Glycerol 25 %
SDS 2.5 %
Bromophenol blue 1 mg/ml
Then, samples were loaded in an 8% SDS-PAGE, polymerized with 1% gelatin. Electrophoresis was carried out at a constant voltage of 80 V for 3-4 hours. Then, gels were incubated in 2.5% Triton X-100 to remove SDS from the gels and rinsed with substrate buffer (Table 23). Next, gels were incubated in substrate buffer for 15 hours at 37°C to allow protein renaturation and MMP activation. Following day, gels were stained with Coomassie Brilliant Blue (BioRad, 161-0400). Gelatin degradation was visualized as clear bands on the gel.
Component Final concentration
NaCl 0.2 M
CaCl2 5 mM
Triton X-100 1 % NaN3 0.02 %
Tris-HCl pH 7.5 50 mM
Table 22. Loading buffer used for zymography.
Table 23. Substrate buffer used for zymography.

89
10. Senescence associated β-galactosidase staining (SA-β-Gal)
To evaluate cell senescence, staining with SA-β-Gal was performed. After treatment, cells were washed with PBS and fixed with PBS-2% PFA and 0.2% glutaraldehyde for 5 minutes at RT. Then, cells were washed with PBS and incubated for 16 hours at 37°C with the staining solution (Table 24). Next day, cells were washed with PBS and then with methanol. Cells were air-dried at RT in the darkness (Debacq-Chainiaux et al., 2009).
Component Final concentration
Citric acid/sodium phosphate (pH 6.0) 40 mM
Potassium ferrocyanide 5 mM
Potassium ferricyanide 5 mM
NaCl 150 mM
MgCl2 2 mM
5-bromo-4-chloro-3-indolyl-βD-galactopyranoside in methylformamide
1 mg/ml
Photographs were taken under a phase contrast microscopy (Eclipse TE300, Nikon, connected to a camera Nikon Digital Sight DS-U2).
11. Analysis of apoptosis by propidium iodide (PI) staining
250,000 oval cells were seeded in triplicate in 35 cm dishes in DMEM-10% FBS. After treatment, plates were washed twice with cold PBS and fixed using a mixture of methanol and acetic acid (3:1) for 30 minutes at RT. Next, cells were washed twice with PBS and stained for 20 minutes at 37°C with a staining solution prepared in PBS (Table 25). Finally, dishes were washed with PBS and coverslipped with Mowiol mounting medium (del Castillo et al., 2008b).
Component Final concentration
PI ( Sigma P-417) 5 µg/ml
TritonX-100 0.1 %
EDTA 0.1 M
RNAsa (Sigma) 25 U/ml
Apoptotic cells were observed under an inverted fluorescence microscope (Eclipse TE300, Nikon) using a 60X objective, following standard morphological criteria. At least 15 fields were counted per plate in a blinded manner.
Table 24. SA-β-Gal staining solution.
Table 25. PI staining solution.
90
12. Measurement of intracellular ROS For visualization and analysis of intracellular ROS the oxidation-sensitive
probe DCFH-DA (2′, 7′-Dichlorofluorescein diacetate, Molecular Probes) at 5 μM was used. This compound diffuses into cells and turns into highly fluorescent 2′,7′-dichlorofluorescein upon oxidation by reactive oxygen species, mainly hydrogen peroxide (Herrera et al., 2001).
12.1. Analysis by confocal microscopy
For confocal microscopy analysis, cells were seeded on gelatin-coated glass coverslips in 6 cm dishes in DMEM-10% FBS. After treatment with different factors cells were washed with PBS and loaded with DCFH-DA (5 µM) for 30 minutes at 37°C. Cellular fluorescence intensity was visualized by using a confocal microscope and a 60X objective (Olympus FV1200, Flow Cytometry and Microscopy Core Facility at UCM).
12.2. Analysis by flow cytometry
To analyze the intracellular generation of ROS by flow cytometry cells were detached by trypsinization and centrifuged at 1,200 rpm for 5 minutes at 4°C. Then, cells were washed and resuspended in PBS, transferred to cytometry tubes and incubated with DCFH-DA for 30 minutes (37°C). The cellular fluorescence intensity was measured by FACScalibur (Becton Dickinson, Flow Cytometry and Microscopy Core Facility at UCM). 10,000 cells were recorded in each analysis.
13. Gene silencing by siRNA Transient Twist1 knockdown was performed by transfection with a mouse
Twist1 siRNA-SMART pool (Dharmacon, M-055047-01-0005). Non-targeting siControl (NT) (Dharmacon, D-001210-03-05) was used as a negative control. For siRNA transfection, we used TransITsiQuest reagent (Mirus) according to the manufacturer´s recommendation and a final siRNA concentration of 100 nM. Cells were transfected twice to warrant down-regulation during the whole process. 24 hours after first transfection, cells were serum starved and treated with TGF-β for 48 hours. Then, medium was removed and we performed a second transfection. Medium was subsequently replaced with complete medium supplemented with TGF-β. Experiment was stopped at different time points.
14. Intrasplenic transplantation of oval cells As recipients for cell transplantation we used mice submitted to CCl4-
induced liver injury. For that, five-nine week-old mice (C57/Bl6) received bi-
91
weekly intraperitoneal injections of 3 μl CCl4/g body weight (solution of 10% CCl4 in mineral oil) for four weeks before transplantation. CCl4 treatment continued post-transplantation until mice sacrifice.
At transplantation, mice were randomly assigned to 3 groups: PBS-group (animals injected with PBS); OC-GFP-group (animals transplanted with OC-GFP), and TβT-OC-GFP-group (animals transplanted with TβT-OC-GFP).
Surgery was performed as follows: once mouse was anesthetized (isoflurane inhalation anesthesia), an incision was made to allow access to the spleen. Either PBS or cells (2.5x10⁶cells/100 μl PBS) were slowly infused into the spleen with a 29 gauge needle. Spleen was ligated with thread to avoid hemorrhage. Finally, the wound was closed with suture.
Animals were sacrificed 1 week or 8 weeks after transplantation and 72 hours after last injection to eliminate acute effects of CCl4.
14.1. Sample collection
Under anesthesia (using inhalatory isoflurane), the thoracic cavity was opened to expose the heart. Blood was obtained by cardiac puncture using a 1 ml heparinized hypodermic syringe and a 25 gauge needle and placed in eppendorf tubes. Blood samples were allowed to clot at RT and centrifuged at 1,800 rpm for 10 min at RT for serum separation. Serum was immediately frozen and stored at -80°C until analysis.
The whole liver was removed. Part of the liver lobes were thinly sectioned and fixed in 10% formalin solution (Sigma) overnight. Then, they were washed 3 times with PBS and immersed in PBS-30% sucrose, PBS-20% sucrose and PBS-10% sucrose, consecutively. Next, the tissue was embedded in paraffin, sectioned (4 μm) and stained with hematoxylin and eosin (H&E). Preparation of the tissue samples in paraffin and H&E was performed at the Department of Pathological Anatomy of the HCSC.
The remaining portions of the liver were immediately snap-frozen in liquid
nitrogen and collected in RNase-free tubes for DNA extraction.
15. Analysis of serum parameters L-aspartate aminotransferase (L-AST) and alanine aminotransferase (L-ALT)
activities were measured in blood serum at the laboratory of “Centro de Análisis Sanitarios” (Madrid) using gold-standard methods.

92
16. Histopathological analysis of liver damage
H&E stained liver sections were analyzed by Dr. Julián Sanz (head of the
Department of Pathological Anatomy, HCSC). He evaluated histopathological
changes observed in the CCl4 experimental model (Liedtke et al., 2013) such as
central hepatocytes damage (ballooning) and necrosis with steatosis and a
mixed inflammatory cells infiltrate, with variable intensity and extent (by
confluent bridging) that were scored as follows:
0: Normal liver. 1: Minimal centrilobular steatosis and hepatocytic changes. 2: Centrilobular steatosis with occasional bridges. 3: Frequent centro-central and centro-portal bridges without complete lobulation. 4: Extense lobulation.
17. Statistical analysis
Means ± standard error of the mean (S.E.M) were used to describe each of
the variables analysed. When only one experiment was shown, data have been
represented as the mean value ± standard deviation (S.D.). An unpaired
Student´s t-test or one-way ANOVA followed by the Bonferroni post hoc test
were used to compare different variables between two or more experimental
groups, respectively. Longitudinal studies were performed using paired or
unpaired Student´s t-test as appropriate. For all analysis, p values below 0.05
were considered statistically significant and were indicated in each figure. All
statistical analyses were performed using GraphPad Prism 8 software.

8. Results

95
1. TGF-β induces partial EMT in oval cells
TGF-β participates in different stages of chronic liver disease, having a critical role in the development of liver fibrosis. In this context, TGF-β-induced EMT is believed to be very important (Watsky et al., 2010; Zeisberg et al., 2007). On the other hand, HGF/Met signaling has been shown to be crucial for an efficient liver regenerative response, both hepatocyte and oval cell-mediated (Huh et al., 2004; Ishikawa et al., 2012). However, whether oval cells are an important target for TGF-β during liver fibrosis and whether HGF/Met signaling could modulate oval cell response to TGF-β in this context need to be clarified.
As indicated in background section, previous experiments performed in our laboratory (Almale et al., 2019) indicated that acute treatment with TGF-β induces EMT in oval cells and that loss of Met tyrosine kinase activity does not interfere with such response. Further studies also showed that under chronic treatment with TGF-β, oval cells with a functional Met receptor acquire a stable EMT phenotype and functional advantages, like apoptosis resistance and glycolytic shift. Taken all this into consideration, we decided to further characterize the effect of TGF-β-induced EMT on oval cell biology and function and to investigate the potential relevance of the crosstalk between TGF-β and HGF/Met pathways for oval cells in the context of an EMT.
1.1. TGF-β induces phenotypic changes in oval cells
First, we performed a detailed characterization of the phenotypic changes induced in oval cells in response to chronic TGF-β treatment. For this, oval cells were treated with 1 ng/ml TGF-β for 48 hours followed by continuous subculture in the presence of TGF-β 0.5 ng/ml. We used untreated oval cells as control and oval cells treated with 1 ng/ml TGF-β for 48 hours (acute treatment) as a reference for acute TGF-β treatment. Hereinafter, oval cells chronically treated with TGF-β will be referred to as TGF-β treated oval cells (TβT-OC) to distinguish them from untreated oval cells.
RT-qPCR analysis of Snai1 (Snail) and its target Cdh1 (E-cadherin) was performed. Snai1 is one of the most relevant EMT-inducing TF and Cdh1 (E-cadherin) is a cell-to-cell contact protein of the cadherin family considered as an epithelial cell marker (Cano et al., 2000). Results showed an important induction of Snai1 together with a decrease in the expression of Cdh1 after acute treatment with TGF-β respect to untreated oval cells. Chronically treated cells maintained Snai1 induction although lower than acutely treated cells, however, Cdh1 expression was heterogeneous, being low in some cell lines while in others was even higher than in parental oval cells (Figure 26)

96
We next analyzed the protein levels of E-CADHERIN and other EMT markers by western blot and/or immunocytochemistry. Consistent with RT-qPCR data, we found a decrease in E-CADHERIN levels during acute treatment together with a heterogeneous profile in chronically treated cells with TβT-OC lines showing either low or high E-CADHERIN levels (Figure 27a, b and c). As additional epithelial markers we chose L-CADHERIN, another member of the cadherin superfamily of proteins whose expression is restricted to epithelial cells of the gastrointestinal system (Liu et al., 2009); and OCCLUDIN, a protein component of tight junctions. While L-CADHERIN showed a decrease after acute TGF-β treatment, OCCLUDIN did not show significant changes. However, both were downregulated in TβT-OC lines (Figure 27a and b). Contrarily, analysis of N-CADHERIN and VIMENTIN, two mesenchymal markers, showed an increased expression in TβT-OC lines (Figure 27a, b and c).
In parallel, we analyzed ZO-1 expression pattern by confocal microscopy as other component of the tight junctions. ZO-1 protein displayed a change from cell to cell contact sites to a diffuse intracellular distribution (Figure 27c), a phenomenon commonly observed during EMT (Polette et al., 2007).
Altogether, these results would indicate that chronic treatment with TGF-β induces an EMT in oval cells as it mediates the loss or reorganization of some epithelial markers and the gain of mesenchymal markers. The fact that the phenotypic change is not associated with E-cadherin loss suggests a partial rather than a full EMT response.
Figure 26. Analysis of the expression of Snai1 and Cdh1 in oval cells treated with TGF-β. Total RNA was isolated from oval cells untreated (Ut) or treated with TGF-β (1 ng/ml) in 0% FBS medium for 48 hours (Acute) or oval cells chronically treated with TGF-β (cultured in 0% FBS medium for 48 hours) (Chronic). Snai1 and Cdh1 mRNA levels were determined by RT-qPCR and normalized to Gusb. Data are expressed relative to the untreated group and are mean ± S.E.M. of 11 independent experiments. ** = p < 0.01, *** = p < 0.001 versus untreated oval cells. Five different TGF-β chronically treated cell lines were used.

97
1.2. TGF-β-induced EMT in oval cells is associated with decreased
stemness
Evidence in the literature supports the concept the EMT process induced by TGF-β in epithelial cells correlates with a less differentiated phenotype and acquisition of stem cell properties (Abell and Johnson, 2014; Jayachandran et
Figure 27. Epithelial and mesenchymal markers in oval cells treated with TGF-β. a) Total proteins were extracted from oval cells untreated (Ut) or treated with TGF-β (1 ng/ml) in 0% FBS medium for 48 hours (Acute) or oval cells chronically treated with TGF-β cultured in 0% FBS medium for 48 hours (Chronic). Western blot assay was performed for the analysis of the indicated proteins using β-ACTIN as loading control. A representative experiment using three different TβT-OC lines (designated #1, #2 and #3) is shown. b) Optical density values relative to loading control were calculated. Data are expressed relative to untreated (Ut) oval cells and are mean ± S.E.M. of 3-5 independent experiments (n=3-18). * = p < 0.05, ** = p < 0.01 versus untreated oval cells. c) Untreated and TGF-β chronically treated oval cells maintained in 10% FBS medium were fixed and stained with specific primary antibodies for the indicated proteins and a fluorescent secondary antibody. Nuclei were counterstained with DAPI. Representative confocal microscopy images from 2-3 independent experiments are shown. Scale bar=20 μm. At least three different TβT-OC lines were used in both analyses.

98
al., 2016). We therefore analyzed if TGF-β-induced EMT somehow affected oval cell stemness.
We first checked the mRNA levels of different stem cell markers, Epcam, Cd44 and Prom1 (CD133), in oval cells and TβT-OC. Our data revealed a downregulation of Epcam and Prom1 in TβT-OC, markers usually associated with epithelial cells (Malfettone et al., 2017), with no significant changes in Cd44 (Figure 28a). In parallel to the RT-qPCR analysis, we also studied EPCAM and CD44 protein levels by flow cytometry. EPCAM-positive oval cells, measured both as percentage of positive cells and mean of fluorescence intensity, decreased in TβT-OC (Figure 28b and c). However, CD44-positive cells did not change between OC and TβT-OC (Figure 28b and c). Therefore, flow cytometry analyses confirmed RT-qPCR results.
Figure 28. Analysis of stem cell markers in oval cells and TβT-OC. a) Oval cells and TβT-OC were maintained in 0% FBS medium for 48 hours, and total RNA was isolated. Epcam, Prom1 and Cd44 mRNA levels were determined by RT-qPCR and normalized to Gusb. Data are expressed relative to oval cells and are mean ± S.E.M. of 4-6 independent experiments performed in triplicate. *** = p < 0.001 versus oval cells. b-c) Oval cells and TβT-OC maintained in 10% FBS medium were stained with specific antibodies for EPCAM and CD44 or with isotype controls, and analyzed by flow cytometry. b) Representative histograms are shown. c) Percentage of positive cells and fluorescence intensity (F.I.) values are mean ± S.E.M. of 2 independent experiments (n=2-6). Three different TβT-OC lines were used in both analyses.

99
Additionally, we performed clonogenic and sphere formation assays under anchorage-independent conditions. This could help us to determine if there were any alterations in the clonogenic and self-renewal capacity, typical stem cells properties (Cao et al., 2011; Pastrana et al., 2011) that are observed in oval cells, in TβT-OC.
Clonogenic assay revealed a decrease in the clonal growth capacity of TβT-
OC in comparison to oval cells (Figure 29a). Interestingly, colonies formed by TβT-OC were bigger than oval cell colonies and morphologically different. Consistent with the acquisition of a mesenchymal and more migratory phenotype upon EMT, TβT-OC loosed cell adhesion, occupied a larger cell spreading area and grew in a more disorganized manner overall resulting in less tight colonies. This phenomenon was very clear at the colonies periphery where cells become very loose. This was opposed to what was seen with oval cells, which showed stronger cell-cell adhesions and formed tightly packed colonies
Figure 29. Analysis of stem cell properties in oval cells and TβT-OC. a) Oval cells and TβT-OC were seeded at low density and maintained in 10% FBS medium for up to 8-10 days and number of colonies were counted. Data are expressed relative to oval cells and are mean ± S.E.M. of 3 experiments performed in triplicate. ** = p < 0.01 versus oval cells. b) Representative images of the whole plate and phase contrast microscopy images of individual colonies (border areas) are shown. Scale bar=100 μm. c) Oval cells and TβT-OC were seeded in ultra-low-attachment plates in 0% FBS medium supplemented with factors for up to 15 days. Graph shows the number of spheroids per well, distributed according to their diameter. Data are mean ± S.E.M. of 2 independent experiments (n=2-5). d) Representative phase contrast microscopy images of formed spheroids are shown. Scale bar=50 μm. At least two different TβT-OC lines were used in both analyses.

100
with more defined borders (Figure 29b). Concerning the spheroid formation assay, culture was maintained over time and once per week we took pictures of the spheres formed by each cell line. Number and diameter of spheres were measured to control the evolution of the spheres. The assay failed to reveal significant differences in the ability to form spheres between TβT-OC and oval cells, although TβT-OC showed a tendency to form bigger spheres (Figure 29c and d).
Collectively, these data suggest that EMT induced in oval cells by chronic treatment with TGF-β does not result in acquisition of stem cell properties.
1.3. TGF-β-induced EMT in oval cells is associated with alterations in hepatic lineage markers
Since Epcam is also a marker of hepatic progenitor cells (Chen et al., 2017; Itoh and Miyajima, 2014), and showed a decreased expression in TβT-OC, we further explored the effects of EMT on the intrinsic lineage features of oval cells.
We first analyzed the expression of CK19 and ALBUMIN, two commonly used markers of oval cells (Chen et al., 2017).
Figure 30. Analysis of oval cells markers in oval cells and TβT-OC. a) Oval cells and TβT-OC were maintained in 0% FBS medium for 48 hours, and total proteins were isolated. Western blot assay was performed for the indicated proteins using β-ACTIN as loading control. A representative experiment using three different TβT-OC lines (designated #1, #2 and #3) is shown. b) Optical density values relative to loading control were calculated. Data are expressed relative to oval cells and are mean ± S.E.M. of 2 independent experiments (n=2-10). c) Oval cells and TβT-OC maintained in 10% FBS medium were fixed and stained with specific primary antibodies for the indicated proteins and a fluorescent secondary antibody. Nuclei were counterstained with DAPI. Representative confocal microscopy images out of 2-3 independent experiments are shown. Scale bar=20 μm. At least two different TβT-OC lines were used in both analyses.

101
Western blot analysis showed no changes in CK19 expression levels in TβT-OC as compared to oval cells whereas ALBUMIN showed a slight increase (Figure 30a and b). Same results were obtained by confocal microscopy analysis (Figure 30c).
To characterize in more detail the phenotype of TβT-OC, we studied the expression of other hepatocyte and biliary epithelial cell lineage markers including members of the hepatocyte nuclear factors family (HNF) since oval cells are bipotential progenitor cells that can differentiate into both hepatocytes and cholangiocytes.
We found a sharp decrease in Hnf1b, Onecut1 (Hnf6) mRNA levels of TβT-OC when compared to oval cells (Figure 31). All of these genes are predominantly expressed in biliary epithelial cells and are required for the normal development of biliary tract (Clotman et al., 2002; Limaye et al., 2008; Nagy et al., 1994). Gamma-glutamyltransferase (Ggt), a biliary epithelial cell marker expressed in oval cell, was also downregulated in TβT-OC (Figure 31). On the other hand, Hnf4a, a transcription factor that is essential for the differentiation into hepatocytes (Watt et al., 2003), and alpha-fetoprotein (Afp), a marker of immature hepatocytes, were upregulated in TβT-OC (Figure 31).
Based on these results, we could state that chronic treatment of oval cells with TGF-β results in a decrease of biliary epithelial cell markers and increase in hepatocyte markers. These data suggest that EMT could be associated with a step forward in the hepatocyte lineage differentiation of oval cells.
Figure 31. Analysis of biliary epithelial and hepatocyte lineage markers in oval cells and TβT-OC. Oval cells and TβT-OC were maintained in 0% FBS medium for 48 hours, and total RNA was isolated. Hnf1b, Onecut1, Ggt, Hnf4a and Afp mRNA levels were determined by RT-qPCR and normalized to Gusb. Data are expressed relative to oval cells and are mean ± S.E.M. of 3-7 independent experiments. * = p < 0.05, *** = p < 0.001 versus oval cells. At least two TβT-OC lines were used.
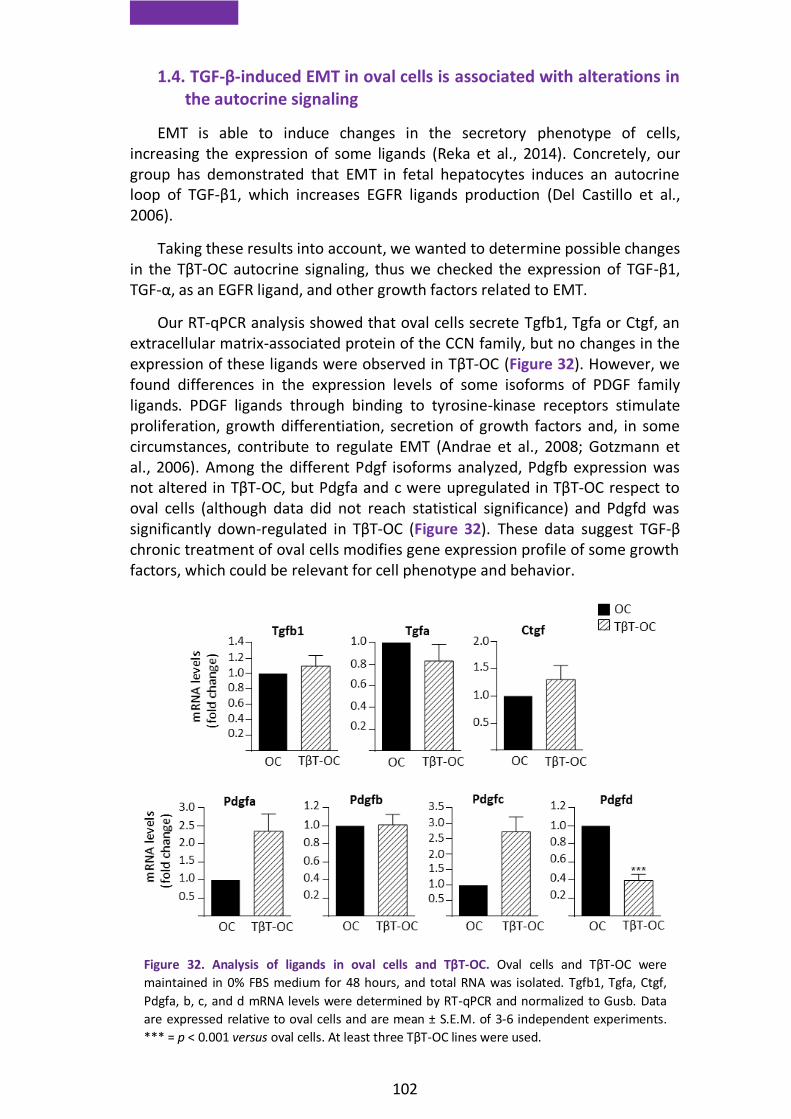
102
1.4. TGF-β-induced EMT in oval cells is associated with alterations in the autocrine signaling
EMT is able to induce changes in the secretory phenotype of cells, increasing the expression of some ligands (Reka et al., 2014). Concretely, our group has demonstrated that EMT in fetal hepatocytes induces an autocrine loop of TGF-β1, which increases EGFR ligands production (Del Castillo et al., 2006).
Taking these results into account, we wanted to determine possible changes in the TβT-OC autocrine signaling, thus we checked the expression of TGF-β1, TGF-α, as an EGFR ligand, and other growth factors related to EMT.
Our RT-qPCR analysis showed that oval cells secrete Tgfb1, Tgfa or Ctgf, an extracellular matrix-associated protein of the CCN family, but no changes in the expression of these ligands were observed in TβT-OC (Figure 32). However, we found differences in the expression levels of some isoforms of PDGF family ligands. PDGF ligands through binding to tyrosine-kinase receptors stimulate proliferation, growth differentiation, secretion of growth factors and, in some circumstances, contribute to regulate EMT (Andrae et al., 2008; Gotzmann et al., 2006). Among the different Pdgf isoforms analyzed, Pdgfb expression was not altered in TβT-OC, but Pdgfa and c were upregulated in TβT-OC respect to oval cells (although data did not reach statistical significance) and Pdgfd was significantly down-regulated in TβT-OC (Figure 32). These data suggest TGF-β chronic treatment of oval cells modifies gene expression profile of some growth factors, which could be relevant for cell phenotype and behavior.
Figure 32. Analysis of ligands in oval cells and TβT-OC. Oval cells and TβT-OC were
maintained in 0% FBS medium for 48 hours, and total RNA was isolated. Tgfb1, Tgfa, Ctgf,
Pdgfa, b, c, and d mRNA levels were determined by RT-qPCR and normalized to Gusb. Data
are expressed relative to oval cells and are mean ± S.E.M. of 3-6 independent experiments.
*** = p < 0.001 versus oval cells. At least three TβT-OC lines were used.

103
1.5. TGF-β-induced EMT in oval cells confers functional advantages
It is widely established that cells that have undergone an EMT acquire growth, survival, migratory and invasive advantages (Brabletz et al., 2018; Kim et al., 2017a). We therefore investigated if TβT-OC have gained any of these functional changes.
First, we analyzed cell growth capacity in response to the mitogenic signals present in the serum. In these conditions, we found that TβT-OC showed identical cell growth rate than parental cells (Figure 33a). When we performed this assay in the absence of serum, oval cells displayed a significant decrease in cell number, because of the apoptotic response elicited by serum withdrawal (del Castillo et al., 2008b). However, TβT-OC showed an increase in cell number (Figure 33b), indicating that TβT-OC have acquired an intrinsic growth capacity.
We next examined the invasive capacity of TβT-OC in comparison with oval cells. To address this question, we plated cells on matrigel-coated transwells. Due to their invasive cell capacity, cells passed through the matrigel to the other side of the membrane in the absence of exogenous stimuli. Quantitative analysis of cell invasion assays showed that TβT-OC have acquired invasive advantages as compared to oval cells (Figure 34a and b).
Figure 33. Analysis of cell growth in oval cells and TβT-OC. a) Oval cells and TβT-OC were maintained in 10% FBS medium for different periods of time up to 7 days and were counted. Data are expressed respect to zero time and are mean ± S.E.M. of 2-7 independent experiments performed in triplicate. b) Oval cells and TβT-OC were maintained in 0% FBS medium for 48 hours and were counted. Data are expressed respect to zero time and are mean ± S.E.M. of 14 independent experiments performed in triplicate. *** = p < 0.001 versus zero time or as indicated. At least three different TβT-OC lines were used in both analyses.

104
The role of MMPs in the extracellular matrix degradation during cell
migration/invasion is well recognized (Kessenbrock et al., 2010). Particularly,
results of our group have demonstrated the involvement of some MMPs in the
pro-invasive activity triggered by HGF/Met in oval cells (Suarez-Causado et al.,
2015). This prompted us to analyze a potential implication of MMPs in the TβT-
OC invasive phenotype.
Hence, we analyzed in oval cells and TβT-OC the mRNA levels of Mmp2, 9, 10 and 13 and Timp1 and 3. As shown in figure 35a, Mmp2, 10 and 13 were significantly increased in TβT-OC. However, chronic EMT in oval cells did not modify the Mmp9 mRNA expression. With respect to TIMPs, while Timp1 was downregulated, Timp3 mRNA levels were higher in TβT-OC (Figure 35a).
Additionally, we measured the gelatinase activity by performing gelatin zymography, and found that MMP9, whose expression hardly changes in TβT-OC, showed an increased activity in TβT-OC, as compared to oval cells (Figure 35b), suggesting post-transcriptional regulation of MMP9. Besides, despite the increase in Timp3 expression in TβT-OC, zymography assays demonstrated MMPs activity in TβT-OC.
These results show that chronic EMT induces changes in MMPs and TIMPs expression in oval cells, which likely participate in the TβT-OC invasive capacity. A specific role for MMP9 is suggested.
Figure 34. Analysis of the invasive capacity in oval cells and TβT-OC. a) Oval cells and TβT-OC were plated in 0% FBS medium in the upper 24-transwell units coated with matrigel. Cells were allowed to pass through matrigel-coated filters for 24 hours and then were fixed in PFA and stained with crystal violet and counted by phase contrast microscope (14 random fields). Data are expressed relative to oval cells and are mean ± S.E.M. of 9 independent experiments performed in triplicate. *** = p < 0.001 versus oval cells. b) Representative phase contrast microscopy images of invading cells are shown. Scale bar=100 μm. Five different TβT-OC lines were used.
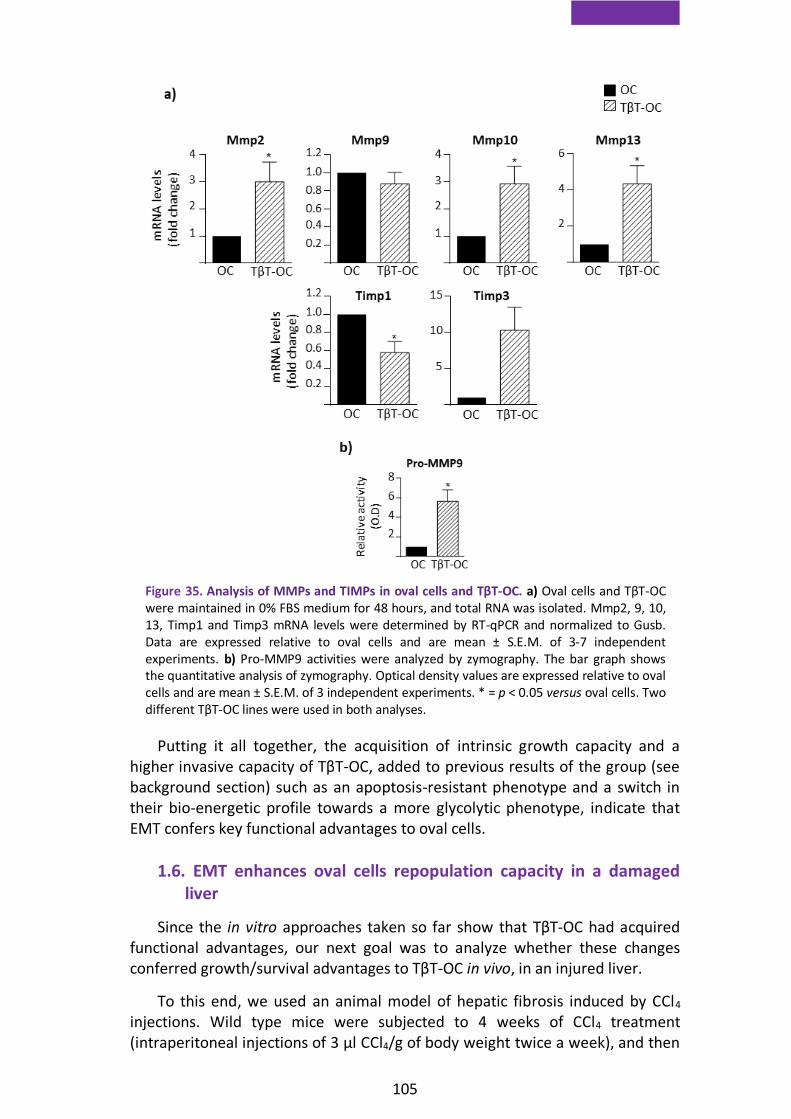
105
Putting it all together, the acquisition of intrinsic growth capacity and a higher invasive capacity of TβT-OC, added to previous results of the group (see background section) such as an apoptosis-resistant phenotype and a switch in their bio-energetic profile towards a more glycolytic phenotype, indicate that EMT confers key functional advantages to oval cells.
1.6. EMT enhances oval cells repopulation capacity in a damaged liver
Since the in vitro approaches taken so far show that TβT-OC had acquired functional advantages, our next goal was to analyze whether these changes conferred growth/survival advantages to TβT-OC in vivo, in an injured liver.
To this end, we used an animal model of hepatic fibrosis induced by CCl4 injections. Wild type mice were subjected to 4 weeks of CCl4 treatment (intraperitoneal injections of 3 μl CCl4/g of body weight twice a week), and then
Figure 35. Analysis of MMPs and TIMPs in oval cells and TβT-OC. a) Oval cells and TβT-OC were maintained in 0% FBS medium for 48 hours, and total RNA was isolated. Mmp2, 9, 10, 13, Timp1 and Timp3 mRNA levels were determined by RT-qPCR and normalized to Gusb. Data are expressed relative to oval cells and are mean ± S.E.M. of 3-7 independent experiments. b) Pro-MMP9 activities were analyzed by zymography. The bar graph shows the quantitative analysis of zymography. Optical density values are expressed relative to oval cells and are mean ± S.E.M. of 3 independent experiments. * = p < 0.05 versus oval cells. Two different TβT-OC lines were used in both analyses.

106
we performed intrasplenic injection of parental oval cells and TβT-OC, previously transduced with GFP (OC-GFP, TβT-OC-GFP), and PBS as control. CCl4 treatment was maintained after transplantation and mice were sacrificed 1 week or 8 weeks after transplantation as depicted in figure 36.
First, we analyzed the engraftment of oval cells and TβT-OC in the liver of
transplanted mice by two different approaches.
Figure 36. Scheme of CCl4-induced liver fibrosis model and cell transplantation assay.
Figure 37. Detection of transplanted cells in host livers. a) Immunofluorescence staining was
performed using a specific anti-GFP antibody in liver sections 1 week after transplantation.
Nuclei were stained with DAPI. Representative confocal microscopy images of one mouse and
two mice transplanted with OC-GFP and TβT-OC-GFP, respectively are shown. Arrowheads
indicate GFP-positive cells corresponding to engrafted OC-GFP and TβT-OC-GFP. b) Genomic
DNA was isolated from livers of mice injected with PBS, OC-GFP and TβT-OC-GFP 1 and 8
weeks after transplantation. DNA was used for PCR analysis of the floxed allele. DNA from
cultured oval cells and water were used as a positive (Pos.) and negative (Neg.) control,
respectively.

107
On the one hand, we performed immunofluorescence staining with anti-GFP antibody on liver sections to visualize GFP-positive cells engrafted in the liver parenchyma after 1 week of transplantation (Figure 37a). Interestingly, GFP-positive cells are more abundant and form larger cell clusters in livers from mice transplanted with TβT-OC when compared to those transplanted with oval cells, suggesting a better engraftment or enhanced cell survival and/or proliferation upon engraftment. Unfortunately, we were not able to detect GFP-positive cells 8 weeks after transplantation using this approach, so we decided to run a PCR for detection of the floxed allele carried by oval cells and TβT-OC to confirm the presence of transplanted cells in the liver, obtaining positive results at both time points (Figure 37b).
Once we had confirmed that oval cells and TβT-OC were integrated in host livers, we evaluated the impact of transplanted cells on damaged liver. We measured liver function parameters in serum, in particular aspartate aminotransferase (AST) (Figure 38a) and alanine aminotransferase (ALT) (Figure 38b), which are elevated during liver damage. TβT-OC-transplanted animals showed a reduction in the increase of AST and ALT provoked by CCl4 treatment, in comparison to mice that received PBS only or those transplanted with oval cells. In the case of AST, differences were statistically significant.
To reinforce these data we analyzed the collagen deposition by Sirius red staining as a way to measure the grade of fibrosis. As expected, 1 week after transplantation (e.g. after 5 weeks of treatment with CCl4) PBS-injected livers presented a high-degree of fibrosis, compared with untreated mice, which was not altered in livers of mice transplanted with oval cells and TβT-OC (Figure 39a). However, results corresponding to 8 weeks after transplantation support those obtained from liver function test, being the livers from TβT-OC-transplanted mice the ones that display the lowest fibrosis degree. Interestingly, oval cell transplanted animals also showed a trend to present a decreased liver fibrosis (Figure 39b and c).
Figure 38. Analysis of liver function parameters in mice transplanted with oval cells and TβT-OC. a-b) Analysis of AST and ALT serum levels in untreated mice, CCl4-treated mice and mice transplanted with OC-GFP, TβT-OC-GFP and PBS 8 weeks after transplantation. Data are expressed respect to untreated mice and are mean ± S.E.M. of 4-9 animals per group. * = p < 0.05, ** = p < 0.01 versus untreated group or as indicated.
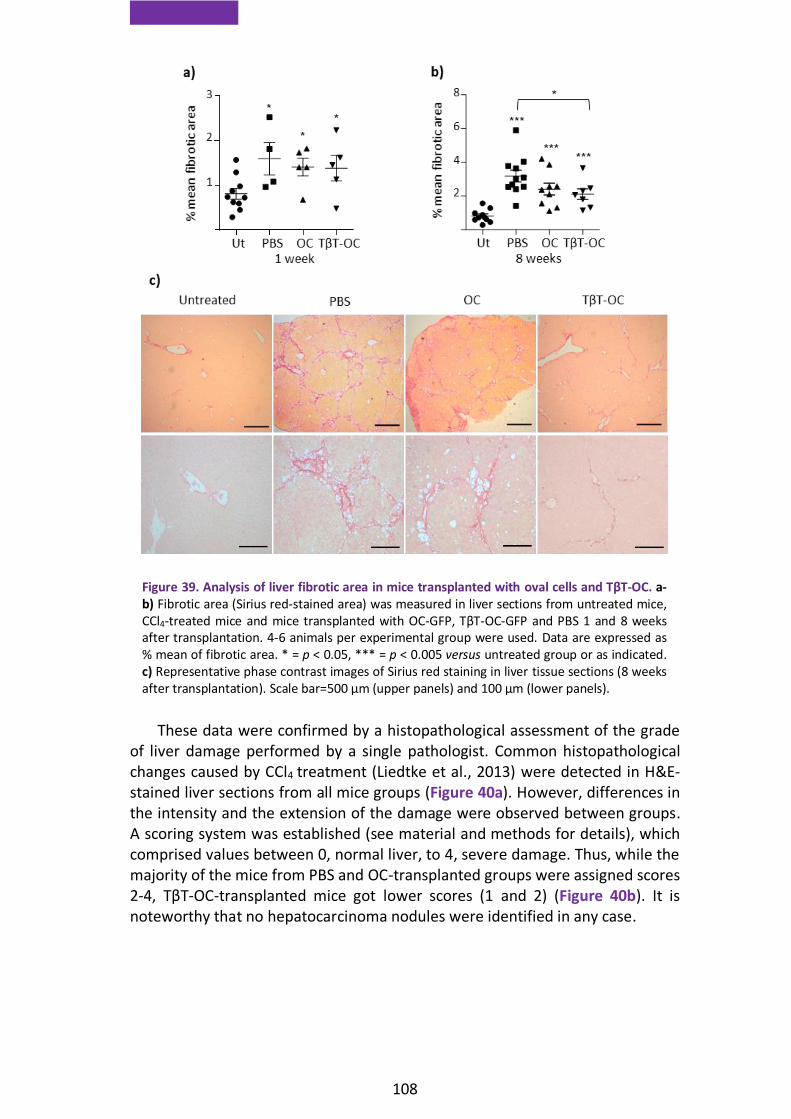
108
These data were confirmed by a histopathological assessment of the grade of liver damage performed by a single pathologist. Common histopathological changes caused by CCl4 treatment (Liedtke et al., 2013) were detected in H&E-stained liver sections from all mice groups (Figure 40a). However, differences in the intensity and the extension of the damage were observed between groups. A scoring system was established (see material and methods for details), which comprised values between 0, normal liver, to 4, severe damage. Thus, while the majority of the mice from PBS and OC-transplanted groups were assigned scores 2-4, TβT-OC-transplanted mice got lower scores (1 and 2) (Figure 40b). It is noteworthy that no hepatocarcinoma nodules were identified in any case.
Figure 39. Analysis of liver fibrotic area in mice transplanted with oval cells and TβT-OC. a-b) Fibrotic area (Sirius red-stained area) was measured in liver sections from untreated mice, CCl4-treated mice and mice transplanted with OC-GFP, TβT-OC-GFP and PBS 1 and 8 weeks after transplantation. 4-6 animals per experimental group were used. Data are expressed as % mean of fibrotic area. * = p < 0.05, *** = p < 0.005 versus untreated group or as indicated. c) Representative phase contrast images of Sirius red staining in liver tissue sections (8 weeks after transplantation). Scale bar=500 μm (upper panels) and 100 μm (lower panels).

109
These results, all together, provide evidence supporting that transplanted TβT-OC improve liver function in CCl4-damaged livers, therefore, treatment with TGF-β confers unique properties to oval cells that improve their regenerative potential, ultimately resulting in a reduction of liver damage.
In order to understand the molecular mechanisms that could explain how TβT-OC could attenuate liver fibrosis, we analyzed mRNA levels of Hgf, a well-known anti-fibrotic and pro-regenerative factor. Livers 8 weeks post-transplantation showed higher expression levels of Hgf in mice transplanted with OC and TβT-OC when compared to PBS infusion, reaching the highest levels with TβT-OC, although differences are not significant (Figure 41). Additionally, based on the results showing a step forward in the hepatocyte lineage in oval cells after EMT (Figure 31), we checked Cytochrome P450 7a1 (Cyp7a1) expression, as a marker of liver maturation. Cyp7a1 showed the same pattern observed for Hgf expression, with the highest levels in livers from TβT-OC-transplanted mice (Figure 41).
These results serve as evidence of a regeneration process taking place in transplanted livers and suggest a role of HGF in this process.
Figure 40. Histopathological assessment of liver damage in mice transplanted with oval cells and TβT-OC. a-b) H&E staining of liver sections from untreated mice, CCl4-treated mice and mice transplanted with OC-GFP, TβT-OC-GFP and PBS 8 weeks after transplantation were evaluated. a) Representative phase contrast images. Scale bar=100 μm. b) Number of mice with a particular score in each experimental condition (n=4-6) is indicated.

110
2. Relevance of HGF/Met pathway in TGF-β-induced-EMT in oval cells
As described in background section, previous results of our group using oval
cells expressing a mutant Met receptor lacking tyrosine kinase activity (Met-/-) showed that Met-/- oval cells undergo an acute EMT by TGF-β treatment in a similar manner to their normal counterparts, Metflx/flx oval cells (Almale et al., 2019). These data indicate that absence of Met kinase activity does not interfere with acute induction of EMT by TGF-β in oval cells. However, whether Met signaling could somehow be involved in the chronic EMT response triggered by TGF-β was not clear. So, we decided to explore this question.
2.1. Lack of Met tyrosine kinase activity induces replicative senescence and impedes oval cell expansion after chronic EMT
Following the same experimental protocol used to generate TβT-OC Metflx/flx
lines, we tried to generate TβT-OC from Met-/- oval cells (Figure 42a and b).
As expected, the behavior of the two cell lines, Metflx/flx and Met-/-, was similar during the acute treatment with TGF-β except for the higher apoptosis rate of Met-/- oval cells compared to Metflx/flx. However, after the first passage differences between cell lines emerged. Metflx/flx oval cells maintained a typical mesenchymal phenotype and after a brief interval of time they acquired a growth rate similar to that of untreated cells (prior to TGF-β treatment). Thus, subsequence passages lead to establishment of a stable TβT-Metflx/flx oval cell line. However, Met-/- oval cells acquired senescent cell-like appearance after the first passage. They became large flat cells with a big cytoplasm, which were not able to progress in culture (Figure 42b). Phenotypical appearance of Met-/- oval
Figure 41. Analysis of the expression of Hgf and Cyp7a1 in hepatic tissue from mice transplanted with oval cells and TβT-OC. Total RNA was isolated from CCl4-treated mice and mice transplanted with OC-GFP, TβT-OC-GFP and PBS 8 weeks after transplantation. Hgf and Cyp7a1 mRNA levels were determined by RT-qPCR and normalized to Gusb. Data are expressed respect to PBS group and are mean ± S.E.M. of 4-6 animals per group. * = p < 0.05, ** = p < 0.01 versus PBS group.
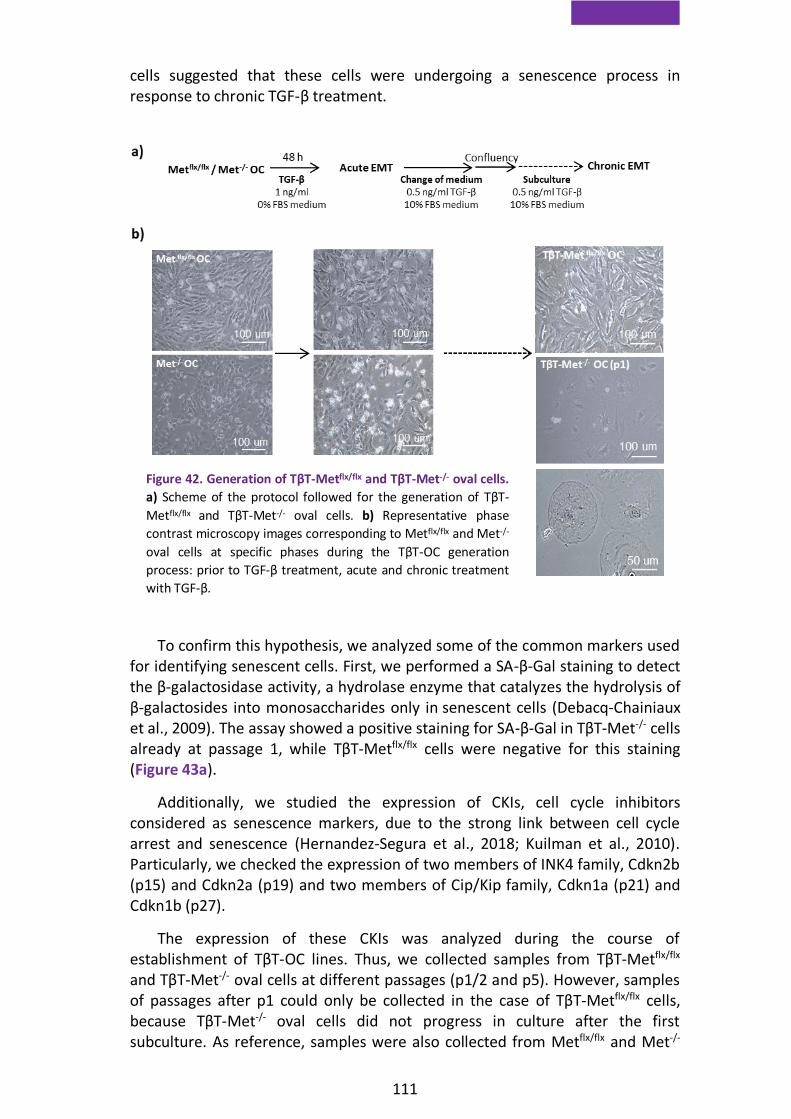
111
cells suggested that these cells were undergoing a senescence process in response to chronic TGF-β treatment.
To confirm this hypothesis, we analyzed some of the common markers used for identifying senescent cells. First, we performed a SA-β-Gal staining to detect the β-galactosidase activity, a hydrolase enzyme that catalyzes the hydrolysis of β-galactosides into monosaccharides only in senescent cells (Debacq-Chainiaux et al., 2009). The assay showed a positive staining for SA-β-Gal in TβT-Met-/- cells already at passage 1, while TβT-Metflx/flx cells were negative for this staining (Figure 43a).
Additionally, we studied the expression of CKIs, cell cycle inhibitors considered as senescence markers, due to the strong link between cell cycle arrest and senescence (Hernandez-Segura et al., 2018; Kuilman et al., 2010). Particularly, we checked the expression of two members of INK4 family, Cdkn2b (p15) and Cdkn2a (p19) and two members of Cip/Kip family, Cdkn1a (p21) and Cdkn1b (p27).
The expression of these CKIs was analyzed during the course of establishment of TβT-OC lines. Thus, we collected samples from TβT-Metflx/flx and TβT-Met-/- oval cells at different passages (p1/2 and p5). However, samples of passages after p1 could only be collected in the case of TβT-Metflx/flx cells, because TβT-Met-/- oval cells did not progress in culture after the first subculture. As reference, samples were also collected from Metflx/flx and Met-/-
Figure 42. Generation of TβT-Metflx/flx and TβT-Met-/- oval cells.
a) Scheme of the protocol followed for the generation of TβT-
Metflx/flx and TβT-Met-/- oval cells. b) Representative phase
contrast microscopy images corresponding to Metflx/flx and Met-/-
oval cells at specific phases during the TβT-OC generation
process: prior to TGF-β treatment, acute and chronic treatment
with TGF-β.

112
oval cells untreated and acutely treated with TGF-β. In agreement with the SA-β-Gal staining results (Figure 43a), TβT-Met-/- cells at p1/2 showed a significantly higher expression of Cdkn2b (p15), Cdkn2a (p19), Cdkn1a (p21) and Cdkn1b (p27) than TβT-Metflx/flx (Figure 43b), further demonstrating the senescent phenotype.
Figure 43. Analysis of senescence markers after chronic treatment of oval cells with TGF-β. a) SA-β-Gal staining in TβT-Metflx/flx and TβT-Met-/- oval cells. Bright-field microscopy images are shown. Scale bar=50µm. b) Total RNA was isolated from Metflx/flx and Met-/- oval cells treated or not (Ut) with TGF-β (1 ng/ml) in 0% FBS medium for 48 hours. Metflx/flx and Met-/- oval cells were chronically treated with TGF-β in 10% FBS medium and total RNA was isolated at different passage number (p1/p2 and p5). mRNA levels of the CKIs p15, p19, p21 and p27 were determined by RT-qPCR and normalized to Gusb. Data are expressed relative to untreated Metflx/flx oval cells and are mean ± S.E.M. (n=2-8). * = p < 0.05, ** = p < 0.01, *** = p < 0.001 versus untreated oval cells or as indicated.

113
Next, we wanted to confirm that the senescence response of Met-/- oval cells to chronic TGF-β treatment was a direct consequence of the lack of Met tyrosine kinase activity. Thus, we used the Met inhibitor PHA665752, an ATP competitive inhibitor of the tyrosine kinase activity, to chemically mimic the behavior of Met-/- oval cells. First, we confirmed PHA665752 activity in Metflx/flx oval cells as it completely abolished HGF-induced activation of its downstream target ERKs (Figure 44a). Then, we proceed to generate TβT-OC from Metflx/flx oval cells in the presence of PHA665752. Interestingly, the treatment with Met inhibitor phenocopied Met-/- oval cells. Thus, cells displayed the same senescent-like phenotype observed in Met-/- cells upon subculture with TGF-β and stopped dividing (Figure 44b). This served to prove that the senescence response in oval cells was a consequence of the absence of a functional Met receptor.
Altogether, these data evidence that Met-/- oval cells undergo cellular senescence after chronic treatment with TGF-β while highlighting that Met kinase catalytic activity is critical to allow oval cell expansion after TGF-β-induced EMT.
2.2. Met tyrosine kinase activity is essential for oval cell expansion and contributes to TβT-OC properties
To further explore the role of Met in oval cell expansion after an EMT process, we focused our efforts on the study of the role of Met tyrosine kinase activity on the functional and phenotypic properties of TβT-OC.
Figure 44. Generation of TβT-Metflx/flx oval cells in the presence of PHA665752. a) Metflx/flx oval cells were serum starved and treated or not with HGF (40 ng/ml) for 10 minutes in the absence or presence of the Met inhibitor PHA665752 (5 µM, 1 hour-pretreatment), and total proteins were isolated. Western blot assay was performed for the indicated proteins. A representative experiment is shown. b) Representative phase contrast microscopy images of Metflx/flx and TβT-Metflx/flx oval cells during the TβT-OC generation process in the presence of PHA665752 (5 µM) are shown.

114
Since we had previously identified an autocrine HGF/Met loop in oval cells (del Castillo et al., 2008b), as previously mentioned, we wondered if this signaling loop was still operative in TβT-OC. We performed an analysis of the expression of Hgf by RT-qPCR and we observed that TβT-OC expressed higher levels of Hgf than oval cells in basal conditions, i.e. in the absence of exogenous stimulation (Figure 45a). To provide additional evidence of the HGF/Met autocrine signaling loop, we studied MET tyrosine phosphorylation by running immunoprecipitation assays in oval cells and TβT-OC in basal conditions. Our results confirmed MET phosphorylation, that is MET activation, in both cell lines (Figure 45b), proving that an autocrine HGF/Met signaling remains operative in oval cells after EMT.
To further clarify the role of Met signaling in oval cell expansion and properties post-EMT, we used PHA665752 Met inhibitor. TβT-OC were pre-treated with the inhibitor for 2 weeks prior to the experiments and during the course of experiment in order to mimic Met-/- oval cell conditions (Figure 42). PHA665752 inhibitory activity in TBT-OC was confirmed at the same dose used in oval cell. Indeed, pretreatment for 2 weeks with PHA665752 completely abolished HGF-induced MET phosphorylation and activation of its downstream target AKT (Figure 46a).
Importantly, long-term exposure of TβT-OC to PHA665752 inhibitor resulted
in a reduced cell growth capacity. In other words, pharmacological inhibition of Met signaling inhibited the intrinsic TβT-OC growth capacity (Figure 46b). This, together with the cell cycle arrest observed in Met-/- oval cells after chronic treatment with TGF-β (Figure 43) support the existence of an autocrine loop
Figure 45. Analysis of autocrine HGF/Met signaling in oval cells and TβT-OC. a) Oval cells
and TβT-OC were maintained in 0% FBS medium for 48 hours, and total RNA was isolated.
Hgf mRNA levels were determined by RT-qPCR and normalized to Gusb. Data are expressed
relative to oval cells and are mean ± S.D. of one representative experiment using three
different TβT-OC lines. b) Oval cells and TβT-OC (designated #1, #2 and #3) were maintained
in 0% FBS medium for 16 hours, and total proteins were isolated. Protein extracts were used
for MET immunoprecipitation (IP). Phosphorylation was detected by immunoblotting (IB)
with anti P-tyrosine antibody. Western blot assay for MET was used as a loading control.
Control IP (without antibody) and Mock IP (without proteins) were used as controls. A
representative experiment out of 4 is shown.

115
through HGF/Met, which sustains TβT-OC growth and it is essential to allow oval cells expansion after EMT.
Besides, our data clearly showed that under PHA665752 treatment, TβT-OC cell number decreased below baseline (i.e. number of TβT-OC after 48 hours culture in the absence of serum was lower that number of cells at zero time) (Figure 46b). These data evidence that PHA665752 sensitizes TβT-OC to serum deprivation. This hypothesis was further confirmed with the analysis of apoptotic cell death. Indeed, results in Figure 46c show that treatment with PHA665752 increased TβT-OC apoptotic index under serum withdrawal.
Figure 46. Analysis of Met tyrosine kinase inhibition in functional TβT-OC properties. a-d) TβT-OC were treated with Met inhibitor PHA665752 (5 μM) for 2 weeks. a) PHA665752 treated TβT-OC were serum starved and treated with HGF (40 ng/ml) for 10 minutes, and total proteins were isolated. Western blot assay was performed for the analysis of the indicated proteins using β-ACTIN as loading control. A representative experiment is shown. b) TβT-OC and PHA665752 treated TβT-OC were maintained in 0% FBS medium for 48 hours and counted. Data are expressed respect to zero time and are mean ± S.E.M. of 9 independent experiments performed in triplicate. c) TβT-OC and PHA665752 treated TβT-OC were maintained in 0% FBS medium for 24 hours and number of apoptotic nuclei after PI staining were counted under a fluorescence microscope (15 random fields). Data are expressed relative to untreated TβT-OC and are mean ± S.E.M. of 6 independent experiments performed in triplicate. d) TβT-OC and PHA65752 treated TβT-OC were plated in 0% FBS medium in the upper 24-transwell units coated with collagen. Cells were allowed to pass through collagen-coated filters for 24 hours and stained with crystal violet and counted by phase contrast microscope (14 random fields). Data are expressed relative to untreated TβT-OC and are mean ± S.E.M. of 5 independent experiments performed in triplicate. * = p < 0.05; ***, = p < 0.001 versus untreated TβT-OC. At least three TβT-OC lines were used in all analyses.

116
In addition to this, TβT-OC treated with PHA665752 underwent a moderate but significant decrease in their invasive capacity, as demonstrated by the decrease in the number of cells that pass through collagen-coated transwells (Figure 46d).
Interestingly, besides the differences in cell functional capabilities, in the presence of Met inhibitor TβT-OC showed changes in the expression of epithelial (E-CADHERIN) and mesenchymal (VIMENTIN) markers consistent with acquisition of a more mesenchymal phenotype (Figure 47a and b).
All together, results indicate that HGF/Met autocrine loop critically
regulates the phenotypic and functional properties acquired by oval cells after TGF-β-induced EMT.
On the other hand, it is worth highlighting a change in cell response to HGF after EMT. We and others have previously demonstrated that HGF is a mitogenic factor for oval cells (del Castillo et al., 2008b). However, treatment of TβT-OC with HGF did not increase their proliferation over the intrinsic cell growth capacity (Figure 48a).
A similar trend is observed in in vitro invasion assays. Our previous data showed that HGF increased the invasive capacity of oval cells (Suarez-Causado et al., 2015). In contrast, HGF failed to increase TβT-OC invasive capacity, which once again was higher than that observed in parental oval cells (Figure 48b).
Figure 47. Analysis of Met tyrosine kinase inhibition in TβT-OC phenotype. a) TβT-OC were treated with Met inhibitor PHA665752 (5 μM) for 2 weeks. TβT-OC and PHA65752 treated TβT-OC were maintained in 0% FBS medium for 48 hours, and total proteins were isolated. Western blot assay was performed for the indicated protein using TUBULIN as loading control. A representative experiment using three different TβT-OC lines (designated #1, #2 and #3) is shown. b) Optical density values relative to loading control were calculated. Data are expressed relative to untreated TβT-OC and are mean ± S.E.M. of 2-4 independent experiments (n=6-9). *** = p < 0.001 versus untreated TβT-OC.
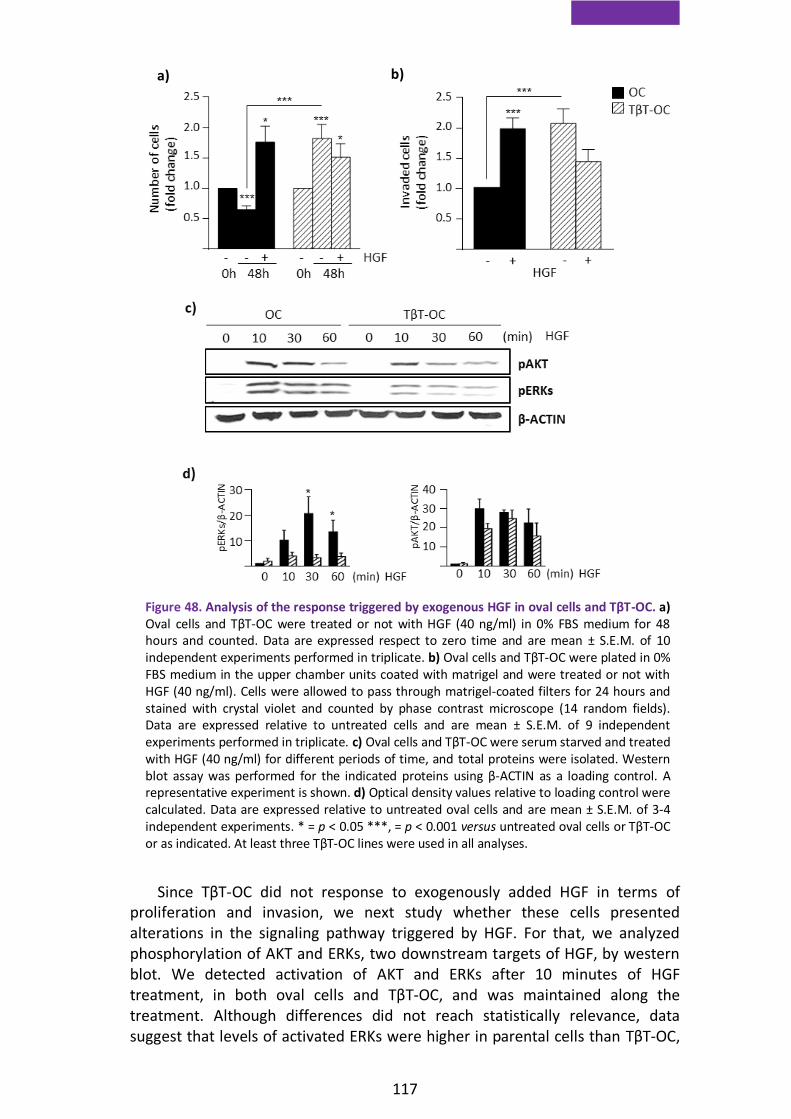
117
Since TβT-OC did not response to exogenously added HGF in terms of proliferation and invasion, we next study whether these cells presented alterations in the signaling pathway triggered by HGF. For that, we analyzed phosphorylation of AKT and ERKs, two downstream targets of HGF, by western blot. We detected activation of AKT and ERKs after 10 minutes of HGF treatment, in both oval cells and TβT-OC, and was maintained along the treatment. Although differences did not reach statistically relevance, data suggest that levels of activated ERKs were higher in parental cells than TβT-OC,
a) b)
Figure 48. Analysis of the response triggered by exogenous HGF in oval cells and TβT-OC. a) Oval cells and TβT-OC were treated or not with HGF (40 ng/ml) in 0% FBS medium for 48 hours and counted. Data are expressed respect to zero time and are mean ± S.E.M. of 10 independent experiments performed in triplicate. b) Oval cells and TβT-OC were plated in 0% FBS medium in the upper chamber units coated with matrigel and were treated or not with HGF (40 ng/ml). Cells were allowed to pass through matrigel-coated filters for 24 hours and stained with crystal violet and counted by phase contrast microscope (14 random fields). Data are expressed relative to untreated cells and are mean ± S.E.M. of 9 independent experiments performed in triplicate. c) Oval cells and TβT-OC were serum starved and treated with HGF (40 ng/ml) for different periods of time, and total proteins were isolated. Western blot assay was performed for the indicated proteins using β-ACTIN as a loading control. A representative experiment is shown. d) Optical density values relative to loading control were calculated. Data are expressed relative to untreated oval cells and are mean ± S.E.M. of 3-4 independent experiments. * = p < 0.05 ***, = p < 0.001 versus untreated oval cells or TβT-OC or as indicated. At least three TβT-OC lines were used in all analyses.

118
and a similar trend, although less pronounced, was also observed in AKT activation (Figure 48c and d). These data could suggest that EMT results in a decreased activation of the HGF/Met pathway, which might explain the absence of proliferative and invasive response in TβT-OC upon HGF stimulus.
2.3. EMT-induced senescence in Met deficient oval cells is
associated with oxidative stress and decreased Twist expression
Cumulative evidence support the concept that there is a strong association between cellular senescence, oxidative stress and ROS production (Chandrasekaran et al., 2017; Hernandez-Segura et al., 2018).
Previous results of our group indicated that TGF-β induces oxidative stress in oval cells, which is impaired by antioxidant signals triggered by the HGF/Met signaling axis (Martinez-Palacian et al., 2013). Therefore, we hypothesized that oxidative stress might be the driving force of the senescence response observed in Met-/- oval cells undergoing EMT.
To analyze this possibility, we first analyzed intracellular levels of ROS at the early stages of chronic TGF-β treatment in Metflx/flx and Met-/- respect to untreated oval cells. For that, we employed DCFH-DA, a fluorescent probe used for the detection of intracellular peroxide content, and analyzed fluorescence intensity by flow cytometry and confocal microscopy. Both approaches revealed an exacerbated oxidative stress in Met-/- oval cells in comparison with Metflx/flx oval cells after chronic treatment with TGF-β (Figure 49a and b).
Additionally, given that Nox4, a member of the Nox family of NADPH oxidases, is involved in TGF-β-induced ROS production (Carmona-Cuenca et al., 2008; Martinez-Palacian et al., 2013), we studied Nox4 expression. We found higher basal mRNA levels as well as a stronger upregulation of Nox4 during acute and chronic TGF-β treatment in Met-/- than in Metflx/flx, in parallel with the increase in ROS intracellular levels (Figure 49c).
These data suggest that an exacerbated oxidative stress in Met-/- oval cells after chronic treatment with TGF-β could be the cause of the senescence and growth arrest.

119
One of the proteins that have been linked to abrogation of cellular senescence programs is Twist (Zhao et al., 2017). Twist has been also described as an antioxidant factor (Floc'h et al., 2013). Thus, as we aimed to further characterize the mechanisms underneath the senescence process that occurs in our cellular model, we decide to analyze Twist levels in cells chronically treated with TGF-β. Western blot analysis revealed higher levels of TWIST in TβT-OC cells than in their normal counterparts (Figure 50a and b). Moreover, Twist was downregulated in Met-/- compared to Metflx/flx oval cells, both at the mRNA and protein levels (Figure 50c, d and e).
Figure 49. Analysis of oxidative stress in Metflx/flx and Met-/- oval cells chronically treated with TGF-β. a-b) Metflx/flx and Met-/- oval cells (Ut) were cultured in 0% FBS medium for 48 hours. Metflx/flx and Met-/--TβT-OC were maintained in 10% FBS medium and analysed at different passages (p1 and p2) during chronic treatment. Cells were incubated for 30 minutes with DCFH-DA (5 µM) and cellular fluorescence intensity was analysed. a) Confocal microscopy images from one experiment out of 2 are shown. Scale bar=20 μM. b) DCFH-DA fluorescence intensity measured by flow cytometry. Data are expressed relative to untreated oval cells and are mean ± S.D. (n=3) from one representative experiment. c) Total RNA was isolated from Metflx/flx and Met-/- oval cells treated or not (Ut) with TGF-β (1 ng/ml) in 0% FBS medium for 48 hours or from Metflx/flx and Met-/- oval cells chronically treated with TGF-β in 10% FBS medium (TβT-OC) at different passages (p1/p2 and p5). Nox4 mRNA levels were determined by RT-qPCR and normalized to Gusb. Data are expressed relative to untreated Metflx/flx oval cells and are mean ± S.E.M. (n=3-6). * = p < 0.05, ** = p < 0.01, *** = p < 0.001 versus untreated cells or as indicated.

120
Next, we tested whether HGF/Met was responsible for the upregulation of Twist levels as previously published in other cell types (Wang et al., 2015a; Yoshida et al., 2014). We demonstrated that HGF treatment increases Twist1 mRNA levels in Metflx/flx oval cells at different time points. To confirm that this effect was specifically dependent on the signaling triggered by HGF/Met, we submitted Metflx/flx oval cells to Met inhibitor (PHA65752). In the presence of PHA65752, Metflx/flx oval cells showed a decrease in basal Twist1 mRNA levels. Furthermore, combined treatment of PHA665752 and HGF abolished the expression of Twist1 induced by HGF (Figure 51a). We also studied Twist2 mRNA levels. Results showed the same tendency, although they were less
Figure 50. Analysis of Twist expression in Metflx/flx and Met-/- oval cells and TβT-OC. a) Oval cells and TβT-OC were cultured in 0% FBS or 10% FBS medium for 24 hours, and total proteins were isolated. Western blot assay was performed for the analysis of TWIST using β-ACTIN as loading control. A representative experiment using two different TβT-OC lines (designated #1 and #2) is shown. b) Optical density values relative to loading control were calculated. Data are expressed relative to oval cells and are mean ± S.E.M. of 2 independent experiments (n=2-7). Three different TβT-OC lines were used. c) Metflx/flx and Met-/- oval cells were cultured in 0% FBS medium for 24 hours, and total proteins were isolated. Western blot assay was performed for the analysis of TWIST using β-ACTIN as loading control. A representative experiment is shown. d) Optical density values relative to loading control were calculated. Data are expressed relative to Metflx/flx oval cells and are mean ± S.E.M. of 2 independent experiments (n=6). e) Metflx/flx and Met-/- oval cells were cultured in 0% FBS medium for 48 hours, and total RNA was isolated. Twist1, 2 mRNA levels were determined by RT-qPCR and normalized to Gusb. Data are expressed relative to Metflx/flx oval cells and are mean ± S.E.M. of (n=3-5). * = p < 0.05, ** = p < 0.01, *** = p < 0.001 versus Metflx/flx.
e)

121
robust (Figure 51a). Parallel analyses by western blot confirmed the results showed in Figure 51a, thus TWIST protein levels were upregulated in response to HGF, effect that was abolished by chemical inhibition of Met (Figure 51b and c). These data demonstrate that HGF regulates Twist expression in oval cells.
Based on these results, we decided to perform a silencing-based approach to further confirm the involvement of Twist in cell response to chronic TGF-β treatment. We transiently knocked-down Twist, using a Twist1-targeted siRNA, in Metflx/flx oval cells. Then, we treated cells with TGF-β following the protocol shown in results section 2.1. We checked Twist1 levels by RT-qPCR analysis and data showed that a 70% reduction of Twist1 levels was achieved (Figure 52a). When we analyzed the expression levels of cell cycle inhibitors, we observed a strong upregulation of cdkn2b (p15) and cdkn2a (p19) suggesting that Twist silencing results in activation of a senescence process. Furthermore, Twist1 transient knockdown led to an upregulation of Nox4 levels after treatment with TGF-β (Figure 52b).
Figure 51. Analysis of Twist induction in response to HGF in oval cells. a) Metflx/flx oval cells were treated or not with HGF (40 ng/ml) ± PHA665752 (5 μM) in 0% FBS medium for different periods of time, and total RNA was isolated. Twist1, 2 mRNA levels were determined by RT-qPCR and normalized to Gusb. Data are expressed relative to untreated Metflx/flx oval cells and are mean ± S.E.M. of 6 different experiments performed in triplicate. Data were compared as follows: untreated vs HGF, * = p < 0.05, ** = p < 0.01, *** = p < 0.005; untreated vs PHA665752, # = p < 0.05; untreated vs PHA665752+HGF, && = p < 0.01. b) Metflx/flx oval cells were treated or not with HGF (40 ng/ml) ± PHA665752 (5 μM) in 0% FBS medium for 48 hours, and total proteins were isolated. Western blot assay was performed for the analysis of TWIST using β-ACTIN as a loading control. A representative experiment is shown. c) Optical density values relative to loading control were calculated. Data are expressed relative to untreated Metflx/flx oval cells and are mean ± S.E.M. of 3 independent experiments (n=8-9).

122
Collectively, these data support that HGF is able to induce Twist expression in oval cells and that Twist silencing promotes a senescence program in oval cell through the upregulation of Nox4
Figure 52. Analysis of the effects of Twist1 silencing on Metflx/flx oval cells. a-b) Oval cells were transiently transfected with targeting negative control siRNA (NT) or Twist1 targeting siRNA (siTwist1). a) Twist1 mRNA levels were determined by RT-qPCR. Data are expressed respect to NT. b) NT and siTwist1 oval cells were maintained in 0% FBS medium for 48 hours. NT and siTwist1 were chronically treated with TGF-β in 10% FBS medium and were analyzed at passage 1 (p1 TβT-OC) of chronic treatment. Total RNA was isolated and Cdkn2b, Cdkn2a and Nox4 mRNA levels were determined by RT-qPCR and normalized to Gusb. Data are expressed relative to NT oval cells and are mean ± S.E.M. of 2 different experiments performed in duplicated. * = p < 0.05, ** = p < 0.01 as indicated.

123
3. Relevance of the crosstalk between HGF/Met and TGF-β in hepatocellular carcinoma
Both Met and TGF-β pathways are known to play a critical role in HCC. Although there are some evidences of crosstalk between these pathways in liver cells, e.g. results included in this thesis and published work from our laboratory and others (del Castillo et al., 2008b; Martinez-Palacian et al., 2013), there is hardly any information about the potential relevance of a functional interaction between Met and TGF-β in HCC (Amicone et al., 2002; Liang et al., 2018). For this reason, we thought it would be interesting to study this crosstalk in a context of liver cancer.
To this aim, we used the following in vivo and in vitro approaches, generated and available at Dr. Maina´s laboratory (Fan et al., 2017) : i) a conditional mouse model of overexpression of Met in the liver (Alb-R26Met), which has been shown to lead to spontaneous development of liver tumors with a progenitor-like phenotype, and ii) HCC cell lines isolated from these tumors, with different levels of expression of Met (low and high).
3.1. TGF-β signaling pathway is activated prior to tumor appearance and during tumor development in Alb-R26Met mice
First, we analyzed the activation of TGF-β-triggered signaling pathway in WT and Alb-R26Met liver sections (pre-neoplastic stage, before 40 weeks old Alb-R26Met), and in HCC samples (neoplastic stage, from 40 to 67 weeks old Alb-R26Met mice which have developed tumors), by detecting the phosphorylated form of SMAD2, the TGF-β canonical signaling mediator, by immunohistochemistry. A quantitative analysis of the immunohistochemistry assay showed enhanced nuclear staining of pSMAD2 in Alb-R26Met mice, which is higher in HCC samples (Figure 53a and b).
These results evidence an interesting over-activation of the TGF-β pathway in livers with Met overexpression, both in pre-neoplastic and neoplastic stages. This suggests a role for TGF-β signaling during HCC development and in the regulation of the properties of these tumors.

124
3.2. Activation of TGF-β signaling pathway inversely correlates with Met expression levels in HCC lines derived from Alb-R26Met mice
Considering these results, we decided to take in vitro approaches that allowed us to study more in detail the interplay TGF-β/Met and how it could affect HCC properties in a context of liver cancer driven by overexpression of Met.
We selected two HCC lines with different expression levels of Met, established from liver tumors developed in Alb-R26Met mice: HCC1 and HCC3 cell lines. As shown in Figure 54a and b, HCC1 cells, displayed about two fold higher levels of MET (HCC1HMet) than HCC3 (HCC3LMet), levels that were not modified neither in presence of exogenous TGF-β nor HGF in both cell lines. In terms of activation of MET, analyzed by the detection of its phosphorylated form (pMET) (Figure 54a and b), the receptor was constitutively phosphorylated in HCC1HMet and remained unaltered regardless of HGF and/or TGF-β treatment. However, activation of MET in HCC3LMet was only observed upon HGF stimulus. Interestingly, TGF-β prevented HGF-induced MET activation in HCC3LMet, which could indicate that TGF-β interferes with HGF/Met pathway.
Figure 53. Analysis of TGF-β/Smad signaling activation in WT and Alb-R26Met mice. a-b) Immunohistochemistry staining was performed using a specific anti-pSMAD2 antibody on liver section of WT, Alb-R26Met mice and HCC samples. a) Representative bright-field images of WT, Alb-R26Met mice and HCC sample are shown. Magnification=20X. b) Intensity of nuclear staining per area in WT, Alb-R26Met and HCC was measured in at least 8 areas per mice. Data are expressed relative to WT group and are mean ± S.E.M. of 4 animals per group. * = p < 0.05, ** = p < 0.01 versus WT group.

125
Additionally, we analyzed the activation of HGF/Met pathway through the phosphorylation levels of GAB1 (pGAB1), a Met´s adaptor protein that mediates many of the Met-initiated signals (Organ and Tsao, 2011; Trusolino et al., 2010) (Figure 54a and b). Similar to MET, GAB1 was constitutively activated in HCC1HMet, but in this case, pGAB1 levels were further increased in the presence of HGF, regardless of the presence or absence of TGF-β. These results suggest that basal activation of MET only triggers a partial activation of its major adaptor. In HCC3LMet cells, we only detected pGAB1 in response to exogenous addition of HGF. TGF-β had no effect on HGF activation of GAB1.
Once we had done a basic characterization of MET expression and activation in HCC1HMet and HCC3LMet cells, we wondered if differential expression/activation of MET could affect to TGF-β signaling activation in HCC
Figure 54. Analysis of canonical and non-canonical TGF-β and HGF/Met pathways in HCC1HMet and HCC3LMet cells. a) HCC1HMet and HCC3LMet cells were treated or not with TGF-β (2 ng/ml) ± HGF (40 ng/ml) in 10% FBS medium for 30 minutes and total proteins were isolated. Western blot assay was performed for the analysis of the indicated protein using β-ACTIN as a loading control. A representative experiment out of 2 is shown. b) Optical density values were calculated. Data are expressed relative to untreated HCC1HMet cells or as total protein levels and are mean ± S.E.M. of 2 independent experiments.

126
cells. Interestingly, although differences did not reach statistical significance, western blot analysis revealed a stronger activation of SMAD2 triggered by TGF-β treatment in cells with low Met levels, HCC3LMet, than in HCC1HMet. The presence of exogenous HGF did not significantly affect the activation of the TGF-β pathway (Figure 54a and b). Both the increased activation of SMAD2 in HCC3LMet cells and the decreased activation of Met in HCC3LMet cells in the presence of TGF-β suggest a negative functional crosstalk between TGF-β and HGF/Met pathways in HCC Alb-R26Met lines.
In an attempt to further characterize this interaction, we next analyzed an additional downstream signaling pathway, ERK-MAPKs, activated by both TGF-β and HGF. ERK-MAPKs is one of the signaling pathways that mediates the downstream response to Met activation and is considered a non-canonical pathway for TGF-β (Massague, 2012; Trusolino et al., 2010). Active ERKs (pErks) were only detected after HGF treatment, both in HCC1HMet and HCC3LMet, but levels tended to be higher in HCC3LMet cells, particularly under TGF-β and HGF combined treatment (Figure 54a and b). These results suggest that different levels of Met in HCC cells could affect MAPKs activation induced by HGF or TGF-β.
3.3. TGF-β-dependent transcriptional activity is enhanced in HCC cells with low levels of Met
Signaling studies performed evidenced that lower levels of Met expression and activation in mouse HCC cells correlate with a higher activation of TGF-β canonical pathway. Next, we ought to determine if differential SMAD activation results in changes in the expression of well-known Smad transcriptional targets. Specifically, we analyzed the expression of Tgfb1, Tgfbr1, Smad6, Smad7 and plasminogen activator inhibitor 1 (Pai1). As a way to prove the specificity of the effects induced by TGF-β and HGF/Met, we treated cells with some specific inhibitors of Met and TGF-β receptor, PHA665752 and SB431542, respectively.
Upregulation of Tgfb1 mRNA levels was observed by RT-qPCR only under TGF-β treatment in both HCC1HMet and HCC3Lmet with no obvious differences between the two cell lines. Neither combined treatment with HGF or with Met inhibitor had a significant effect on Tgfb1-mediated induction. Likewise, treatment with Met inhibitor alone did not affect baseline levels of Tgfb1 expression. In other words, activation of HGF/Met pathway, in mouse HCC cell lines, either basal or by stimulation with HGF, did not affect Tgfb1 expression (Figure 55).
Interestingly, a strong upregulation of the mRNA levels of Tgfbr1, Smad6, Smad7 and Pai1 were observed in response to TGF-β treatment in HCC3LMet, whereas in HCC1HMet was either null or very mild. Among all these genes, Pai1 was the one showing significant changes between HCC3LMet and HCC1HMet. Again, neither co-treatment with HGF or with Met inhibitor altered TGF-β-mediated induction with the exception of Smad6 and 7 where Met inhibitor seemed to increase the basal expression in HCC1HMet (Figure 55).
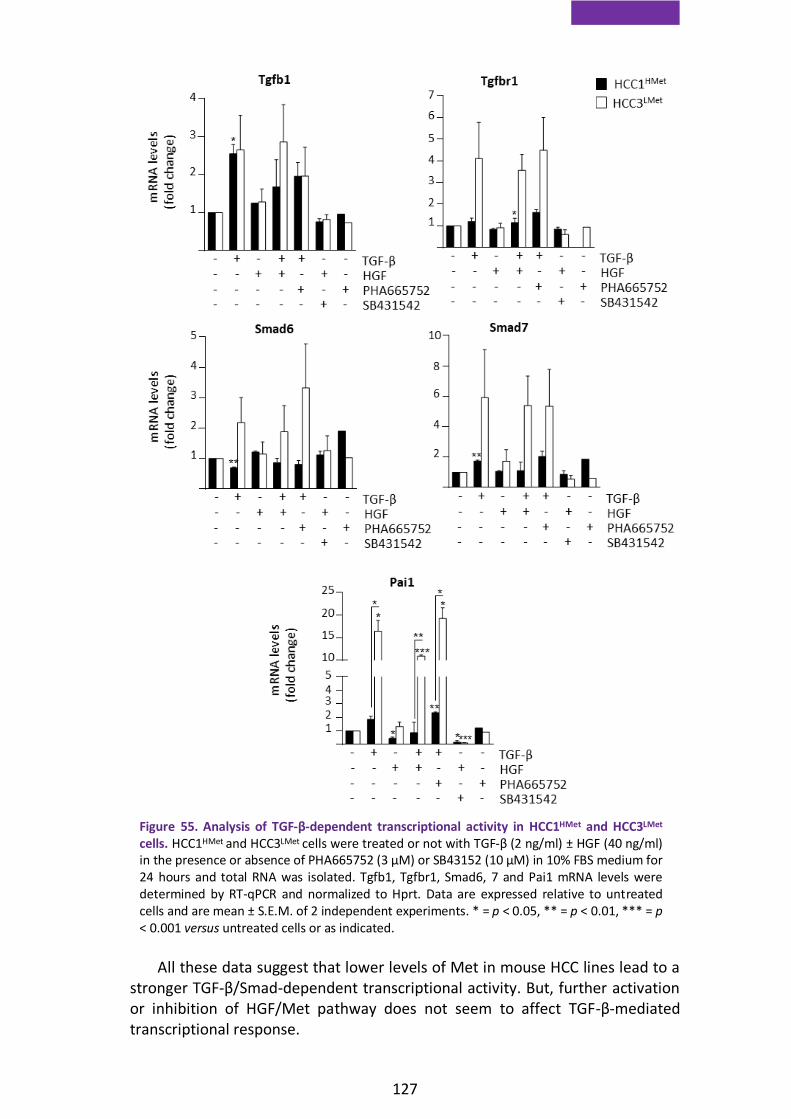
127
All these data suggest that lower levels of Met in mouse HCC lines lead to a stronger TGF-β/Smad-dependent transcriptional activity. But, further activation or inhibition of HGF/Met pathway does not seem to affect TGF-β-mediated transcriptional response.
Figure 55. Analysis of TGF-β-dependent transcriptional activity in HCC1HMet and HCC3LMet cells. HCC1HMet and HCC3LMet cells were treated or not with TGF-β (2 ng/ml) ± HGF (40 ng/ml) in the presence or absence of PHA665752 (3 µM) or SB43152 (10 µM) in 10% FBS medium for 24 hours and total RNA was isolated. Tgfb1, Tgfbr1, Smad6, 7 and Pai1 mRNA levels were determined by RT-qPCR and normalized to Hprt. Data are expressed relative to untreated cells and are mean ± S.E.M. of 2 independent experiments. * = p < 0.05, ** = p < 0.01, *** = p < 0.001 versus untreated cells or as indicated.

128
3.4. HCC lines with low levels of Met are more sensitive to anti-proliferative and apoptotic effects of TGF-β
TGF-β plays a dual role in tumorigenesis. Thus, TGF-β can promote cell cycle arrest and apoptosis or on the contrary, induce cell motility, invasion, EMT and cell stemness (Seoane and Gomis, 2017). Since we found that HCC cells with low levels of Met, HCC3LMet cells, show stronger activation of TGF-β signaling pathway than HCC1HMet, we next explored whether this differential response to TGF-β led to differences in terms of cell growth and death.
Analysis of cell growth capacity revealed that HCC1HMet present a higher growth rate than HCC3LMet. HCC1HMet did not show difference in the cell number when treated with TGF-β. However, HCC3LMet displayed a slight decrease in cell number in response to TGF-β (Figure 56).
In parallel, we performed an immunofluorescence assay to detect active caspase-3, a crucial mediator of programmed cell death, as a way to specifically analyze if the HCC cell lines displayed an apoptotic response to TGF-β. HCC1HMet
cells showed an increase in the levels of active caspase-3 after TGF-β treatment. In HCC3LMet cells we did not observe response at 6 hours, however, a strong peak of caspase-3 activation was seen at 16 hours, notably higher than that seen in HCC1HMet at the same time point (Figure 57a and b).
Figure 56. Analysis of cell growth capacity in HCC1HMet and HCC3LMet cells. HCC cells were treated or not with TGF-β (2 ng/ml) in 10% FBS medium for 6 and 24 hours and then counted. Dara are expressed respect to zero time and are mean ± S.D. (n=3) from one representative experiment performed in triplicate.

129
To further test if the differential expression and activation of Met could account for the differential cell response seen in terms of cell number and apoptosis, we run similar experiments but in the absence or presence of HGF and/or the Met inhibitor PHA665752. We focused on the 16 hours-time point since it seemed to be the more appropriate timing to detect the peak of apoptosis and the differences between cell lines. HCC1HMet cells treated with TGF-β showed a moderate increase in caspase-3 activity however in combination with PHA665752, TGF-β induced a sharp drop in cell number together with a strong increase in caspase-3 activity as compared to TGF-β alone (Figure 58a and b). It is noteworthy that PHA665752 alone was able to trigger apoptosis in HCC1HMet cells, although at a lesser extent than in combination with TGF-β (Figure 58b). Exogenous HGF had no apparent effect neither in cell number nor in caspase-3 activity (Figure 58a and b). These results suggest that HCC1HMet are dependent on autocrine Met signaling for protection against TGF-B induced apoptosis.
Parallel experiments were run in HCC3LMet cells. These cells responded to TGF-β with a slight decrease in cell number and activation of caspase-3. Interestingly, despite not showing a basal activation of Met, combined treatment with TGF-β and PHA665752 resulted in an amplified response to TGF-β, both in terms of decrease in cell number and activation of caspase-3 (Figure 58c and d). It is worth noting that the levels of active caspase-3 in HCC3LMet cells are much higher than those reached in HCC1HMet, which is consistent with a higher sensitivity to apoptosis (Figure 58d). In contrast to HCC1HMet, HCC3LMet cells showed no apoptotic response when treated with PHA665752 alone. Similarly to HCC1HMet, exogenous HGF had no effect on cell number but reduced active caspase-3 levels (Figure 58c and d).
Figure 57. Analysis of active caspase-3 in HCC1HMet and HCC3LMet in response to TGF-β. a-b) HCC1HMet and HCC3LMet cells were treated or not with TGF-β (2 ng/ml) in 10% FBS medium for 6 and 16 hours and then fixed and stained with a specific primary antibody for caspase-3 and a fluorescent secondary antibody. Nuclei were counterstained with DAPI. a) Fluorescence intensity was measured in at least 6 fields per condition. Data are expressed relative to untreated cells and are mean ± S.E.M. of 2 independent experiments. b) Representative apoptome microscopy images from 2 independent experiments are shown. Magnification=10X.

130
Collectively, all these results evidence a pro-survival activity of Met in HCC cells. HCC cells with high levels of Met and endogenous activation of Met become dependent of Met catalytic activity for survival. But, Met activity protects HCC cells against TGF-β independently of Met levels since inactivation of Met sensitizes both HCC1HMet and HCC3LMet cells to TGFβ-induced apoptosis.
Figure 58. Analysis of cell growth capacity and active caspase-3 levels in HCC1HMet and HCC3LMet cells. a and c) HCC1HMet and HCC3LMet were treated or not with TGF-β (2 ng/ml) ± HGF (40 ng/ml) in the absence or presence of PHA665752 (3 µM) in 10% FBS medium for 24 hours and then counted. Data are expressed relative to untreated cells. A representative experiment performed in triplicate is shown. b and d) HCC1HMet and HCC3LMet were treated or not with TGF-β (2 ng/ml) ± HGF (40 ng/ml) in the absence or presence of PHA665752 (3 µM) in 10% FBS medium for 16 hours. Then, cells were fixed and stained with a specific primary antibody for caspase-3 and a fluorescent secondary antibody. Fluorescence intensity was measured in at least 6 fields per condition. Data are expressed relative to untreated cells and are mean ± S.E.M. of 2 independent experiments.

9. Discussion

133
1. HGF/Met signaling is essential to allow oval cells expansion after TGF-β-induced EMT
The purpose of this study was to characterize the TGF-β-induced EMT in oval cells, how it could affect cell function and fate in vivo, and the potential relevance of a TGF-β-HGF crosstalk in this context.
It is recognized that HPCs/oval cells a bipotential hepatic progenitors population participate in the regenerative process accompanying chronic liver injury. It has been established that these cells can either contribute to re-establish liver function (Riehle et al., 2011) or contribute to the progression of liver fibrosis (Kuramitsu et al., 2013; Williams et al., 2014) and even become tumor-initiating cells (Kohn-Gaone et al., 2016). These opposite effects show us the plasticity of HPCs/oval cells and the importance of understanding the mechanisms controlling their behavior. This would allow us to modulate or favor their pro-regenerative activity, providing new therapeutic approaches for the treatment of CLDs. TGF-β and HGF are among the key signals involved in liver fibrosis and regeneration and are components of HPC/oval cell niche that regulate HPC/oval cell biology (Giannelli et al., 2016; Nakamura et al., 2011), what makes them interesting signals in the study of HPC/oval cell fate in CLD.
Several groups have reported that TGF-β induces EMT in rat HPCs/oval cells in vitro and increases expression of HSC or myofibroblast markers, being able to contribute to the progression of liver fibrosis and cirrhosis (Chen et al., 2015; Deng et al., 2011; Wang et al., 2009) or to convert them into tumor-initiating cells (Wu et al., 2018). Co-expression of epithelial and mesenchymal proteins has been found in HPCs/oval cells isolated from a rat model of liver disease (Yovchev et al., 2008). Interestingly, other authors suggest that active HSCs could undergo mesenchymal to epithelial transition (MET) and originate HPCs/oval cells (Deng et al., 2011) supported by the fact that markers of active HSCs and HPCs/oval cells were observed simultaneously in HPCs/oval cells (Tennakoon et al., 2015). These findings might indicate a role for EMT-MET in regulation of HPC/oval cell biology although its precise contribution and mechanisms involved need to be clarified. According to these previous evidences of EMT in HPCs/oval cells, our results show that chronic treatment with TGF-β in oval cells induces an EMT process that is maintained over time. Thus, TGF-β represses the expression of some epithelial markers (L-CADHERIN, OCCLUDIN), increases the expression of mesenchymal markers (N-CADHERIN, VIMENTIN) and promotes a change in the subcellular localization of ZO-1 (Figure 27). However, the co-expression of E-Cadherin with mesenchymal markers, led us to think that TGF-β treatment induces a partial rather than a full EMT in oval cells (Figure 26 and 27). These results might be not surprising, considering that EMT is seen nowadays as a broad spectrum of transitional states with multiple and dynamic intermediary phases (Nieto et al., 2016). In support of the hypothesis of a partial EMT induction in oval cells chronically treated with TGF-β
134
(TβT-OC), we found coexistence of ALBUMIN and CK19, markers of liver epithelial cells (hepatocyte and cholangiocyte, respectively) (Figure 30), and Cd44 (Figure 28), considered as a critical regulator of TGF-β-mediated EMT in HCC cells (Fernando et al., 2015; Gao et al., 2015; Malfettone et al., 2017; Mima et al., 2012). Our data are also in line with the finding of partial EMT states HPCs/oval cells derived cell lines LE/6 and WB-F344, states that were at least partly maintained by autocrine TGF-β and activin A/Smad signaling (Wu et al., 2018). CD44, CD133 and EPCAM are all stem cell markers. However, unlike Cd44, Cd133 (prom1) and Epcam show a decreased expression in TβT-OC (Figure 28). It is widely accepted that EMT induces the expression of stem cell markers and enhances stem cell properties in epithelial cells (Fabregat et al., 2016a). Indeed, it has been demonstrated that TGF-β treatment in rat and human hepatocytes, induces a less differentiated and a more mesenchymal phenotype with loss of expression of hepatic genes and acquisition of specific stem cell markers (Caja et al., 2011; Sanchez et al., 1999). However, our results do not fit this model. Partial EMT in oval cells does not result in an increase of stem cell markers (Figure 28) nor increases the clonogenic capacity or the sphere formation capacity of the cells (Figure 29). EMT in oval cells instead of favoring a stem cell phenotype, lean cells forward along the hepatic lineage, as deduced from the increase in some hepatocyte markers (Hnf4a and Afp) and the decrease in biliary epithelial markers (Hnf1b, Onecut1, Ggt) in TβT-OC (Figure 31). In this sense, our group has previously demonstrated that TGF-β besides inducing EMT also promotes a more differentiated phenotype in hepatocytes, particularly in the presence of HGF or EGF, resulting in a mixed phenotype in which hepatocytes co-express liver specific genes and epithelial and mesenchymal marker genes (Pagan et al., 1997; Pagan et al., 1999; Sanchez et al., 1995; Sanchez et al., 1998). Therefore, EMT and a differentiated phenotype are not mutually exclusive. Likewise, HPCs/oval cells from human fetal liver display a phenotype consistent with mesenchymal-epithelial transitional cells (Dan et al., 2006). Furthermore, recent findings show that a sequential EMT-MET process drives differentiation of human embryonic stem cells toward hepatocytes, and that TGF-β and SNAI1 induction plays a key role not only in EMT but also in definitive endoderm induction (Li et al., 2017).
Among other phenotypic changes, EMT results in changes in the secretory phenotype of cells, increasing the expression of growth factors and cytokines (Reka et al., 2014) that could be critical for phenotype acquisition or maintenance, thus controlling the mesenchymal state and properties (Del Castillo et al., 2006; Jahn et al., 2012; Scheel et al., 2011). An increase in the mRNA levels of Ctgf together with changes in the mRNA of specific members of the Pdgf family, specifically upregulation of Pdgfa and c and downregulation of Pdgfd, are seen in TβT-OC (Figure 32). Interestingly, CTGF, protein is upregulated in many fibrotic disorders and promotes fibrogenesis, and it has been described to directly bind TGF-β in the extracellular space and enhance receptor binding and signaling (Abreu et al., 2002). Regarding the modulation of PDGF family members, it is important to highlight that PDGF family ligands have an important role in EMT having been correlated with cell survival and invasiveness in human mammary carcinomas and chemoresistance in HCC

135
(Jechlinger et al., 2006; Wang et al., 2015b). Upregulation of PDGFA and PDGF receptors in p19 null hepatocytes after TGF-β-induced EMT provides in vitro adhesive and migratory properties and proliferative stimuli during tumor formation (Fischer et al., 2007). On the contrary, a reduction in the expression of PDGFD in lung fibrosis correlates with the production of TGF-β, so that downregulation of PDGFD by TGF-β might serve as a negative feedback regulation of cytokines that control fibrosis (Charni Chaabane et al., 2014). These observations support the idea of a role for these factors in cell phenotype regulation. Nevertheless, if these signals are somehow involved in the chronic EMT triggered by TGF-β in our cellular model needs to be further investigated.
Further in this regard, our results show that TβT-OC autocrinely produce HGF. Our group has already shown that oval cells have an HGF autocrine loop that exerts antioxidant and anti-apoptotic actions (del Castillo et al., 2008b; Martinez-Palacian et al., 2013). Now, we demonstrate that HGF autocrine loop remains operative in TβT-OC (Figure 45). Strikingly, although TβT-OC express higher Hgf levels, they do not display higher Met activation. Further studies are needed to clarify this result, but one possible explanation is that the amount of ligand is greater than that of Met receptor due to either limiting expression or enhanced degradation of the receptor, so that it is not able to bind the available ligand. In any event, HGF autocrine loop counterbalances the TGF-β-induced EMT maintaining and/or promoting their epithelial properties (Figure 47). Evidences in the literature suggest the capacity of HGF to induce EMT. Indeed, HCC cells secret HGF which contribute to maintain a mesenchymal phenotype, favoring invasion, proliferation and metastasis in vivo (Ding et al., 2010). Likewise, HGF induces down-regulation of cell junctions in HCC cells through Snail induction via MAPK/ early growth response factor-1 activation, which have critical roles in HGF-induced cell scattering, migration and invasion (Grotegut et al., 2006). Contrarily, we had reported that HGF/Met does not induce EMT in oval cells despite enhancing oval cell migration/invasion capacities (Suarez-Causado et al., 2015), and results presented here go in the same direction. Recapitulating, our results provide further evidence of the HPC/oval cell plasticity and the importance of dynamic phenotypic transitional states of liver cells during liver injury, while pointing to an important functional cooperation between the TGF-β and HGF signaling pathways in its regulation.
Partial EMT in oval cells not only has consequences on phenotypic properties, but additionally confer cells some advantages in terms of invasion capacity in vitro (Figure 34). These results are in agreement with other studies performed in epithelial cells in which EMT enhance invasiveness (Brabletz et al., 2018; Thiery et al., 2009; Zhang and Weinberg, 2018). The increase in the invasive capacity after EMT in oval cells correlated with an increase in the expression of some MMPs (Mmp2, Mmp10 and Mmp13) (Figure 35). Although non-parenchymal cells are the main source of MMPs in the liver, they are also produced by hepatocytes and cholangiocytes; and we have shown expression of some MMPs in oval cells as well (Suarez-Causado et al., 2015). This is not surprising since these proteinases are crucial not only for fibrosis development but also for healing, and play an active role in modulation of stem cell niches

136
(Hemmann et al., 2007; Roderfeld, 2018). In fact, it is well known that HPC/oval cell-mediated regenerative response involves ECM degradation and deposition, processes in which MMPs participate (Williams et al., 2014). Interestingly, upregulation of MMP2 and MMP13 has been associated with resolution of liver fibrosis (Fallowfield et al., 2007; Radbill et al., 2011). Although Mmp9 expression is not altered in TβT-OC, these cells show higher MMP9 activity than untreated oval cells (Figure 35). This lack of relationship between MMP9 expression and activity should be investigated in detail but the existence of a wide range of MMPs regulatory mechanisms at different levels including transcriptional, epigenetic and post-transcriptional levels may help explain it (Chernov and Strongin, 2011; Chicoine et al., 2002; Hadler-Olsen et al., 2011; Piedagnel et al., 1999). We also observe changes in Timps expression upon TGF-β-induced EMT, specifically an increase in Timp3 and a decrease in Timp1 (Figure 35). MMP activity is controlled by TIMPs under physiological conditions having this regulation an important role in normal degradation of ECM to maintain liver homeostasis. However, alterations in MMPs-TIMPs balance have been linked to chronic liver pathologies, where MMPs and TIMPs play anti- and/or pro-fibrotic roles. MMP9 has been involved in the early stage of liver fibrosis, specifically promoting TGF-β release; but on the other hand, MMP9 can promote HSCs apoptosis in the presence of low TIMP1 levels (Duarte et al., 2015). Evidence endow TIMPs overexpression a pro-fibrotic action. Concretely, an enhancement in CCl4-induced hepatic fibrosis was demonstrated by TIMP1 overexpression (Yoshiji et al., 2000). So, the changes in the expression of Mmps and Timps in TβT-OC after EMT might be a reflection of what occurs in a context of liver injury and fibrosis and might indicate an anti-fibrotic profile whose relevance in a regenerative process remains open for further investigation.
Interestingly, our group has demonstrated that HGF/Met through PI3K and p38MAPK activation induces a complex and specific migratory response in oval cells that involves MMPs (Suarez-Causado et al., 2015). Based on these results, and on the reduction of the invasive capacity of TβT-OC by inhibiting Met (Figure 46); we hypothesize that the autocrine HGF/Met loop operating in TβT-OC could be in part responsible for Mmps induction and therefore, for the invasive phenotype. Nonetheless, additional experiments are required to establish a direct relationship between Mmps induction and HGF/Met axis in TβT-OC.
In terms of cell growth, although EMT does no result in an increased growth capacity in the presence of serum, it enhances oval cell proliferation and resistance to pro-apoptotic stimuli in the absence of serum (Figure 33). A link between EMT and apoptosis resistance has been previously proposed by other authors (Robson et al., 2006; Valdes et al., 2002). We prove here that autocrine HGF/Met significantly contributes to TβT-OC growth and survival properties, as it does to cell invasive capacity (Figure 46). But, it is worth mentioning that HGF/Met autocrine signaling might not be the only autocrine pathway active in TβT-OC, since we have shown upregulation of other signaling ligands (Figure 32).

137
Interestingly, although HGF autocrine signaling plays a relevant role in TβT-OC properties, exogenous HGF has lost its ability to increase proliferation and invasion over cell intrinsic capacities (Figure 48), as it does in oval cells (del Castillo et al., 2008b; Suarez-Causado et al., 2015). Additionally, we see a weaker activation of some key downstream targets under HGF stimulation (Figure 48). One possible explanation could be that the autocrine HGF/Met signaling leads to maximum proliferative and invasive capacities. This is in line with the observation that a higher HGF expression in TβT-OC does not result in a higher activation of Met receptor.
So far, this study has allowed us to elucidate the biological consequences of a partial EMT induction by TGF-β in oval cells in vitro. Next step is to clarify the consequences for oval cell fate in vivo, in a context of liver damage. Although some authors defend EMT could be responsible for the pro-fibrotic action of HPCs/oval cells (Wang et al., 2009), we found that transplantation of TβT-OC reduce liver fibrosis grade and improve liver function in CCl4-treated mice more efficiently than oval cells which have not underwent EMT process (Figure 38, 39 and 40). In other words, our work support that EMT-induced traits improve and/or accelerate the regenerative potential of oval cells, thus facilitating the restoration of liver function upon injury. It is worth emphasizing that in our experimental model, oval cells, independently of the EMT, did not enhance liver fibrosis either, but rather contributed to ameliorate it, although differences did not reach significance, perhaps due to sample size limitations. This would be in agreement with different works published in the literature supporting a pro-regenerative role for HPCs/oval cells (Awan et al., 2017; Espanol-Suner et al., 2012; Lu et al., 2015) .
We have not yet provided a mechanism for the pro-regenerative/anti-fibrotic effect of TβT-OC. However, based on results from GFP immunohistochemistry at 1 week after transplantation, we hypothesize that an improved engraftment or enhanced cell survival and/or proliferation could certainly make a difference and enhance the effects of the transplanted cells on the injured liver (Figure 37). Based on our in vitro findings it is feasible to hypothesize that the improved regenerating capacity is the result of a combination of cell advantageous traits. Thus, increased Mmps expression and greater invasive capacity could contribute to enhance oval cell regenerative activity, since MMPs are known to be important for such activity (Van Hul et al., 2009; Vestentoft et al., 2013). Additionally, data pointing to a switch to a more mature hepatic phenotype in TβT-OC (Figure 30 and 31) may suggest that TβT-OC have an enhanced hepatocyte differentiating capacity in vivo, which would result in an enhanced capacity to restore liver functionality. Although further research is needed to demonstrate this hypothesis, we have preliminary data that indirectly support it. Cyp7a1, a known transcriptional target of HNF4α and a common marker of hepatocyte maturation and functionality (Asahina et al., 2004; Cai et al., 2007), shows the highest levels in livers from TβT-OC-transplanted mice (Figure 41). Certainly, Cyp7a1 expression could come from endogenous hepatocytes or from newly-formed OC- and TβT-OC-derived hepatocytes. In any event, data are overall consistent with an improved liver
138
function and decreased damage in livers from TβT-OC-transplanted mice. Finally, the highest levels of HGF in TβT-OC transplanted mice suggest a participation of this growth factor in this process (Figure 41). This finding is in line with a higher HGF expression in TβT-OC (Figure 45) in vitro. Thus, upon transplantation, TβT-OC could release HGF in the liver driving autocrine and paracrine actions on oval cells and other liver cell populations, respectively. The pro-regenerative and anti-fibrotic effects of HGF in the liver are well-known. Among others, HGF could promote survival and maturation in transplanted HPCs/oval cells and hepatocytes and inhibit the growth of activated HSCs (del Castillo et al., 2008b; Huh et al., 2004; Ishikawa et al., 2012; Kim et al., 2005; Li et al., 2008).
Our work points to a fundamental activity of HGF/Met to allow oval cell expansion after EMT. In the absence of Met activity (Met-/- oval cells or pharmacological inhibition of Met), oval cells submitted to chronic treatment with TGF-β enter into senescence, as demonstrated by phenotypical changes, the presence of β-Gal activity and an increase in the expression of cell cycle inhibitors (Figure 42, 43 and 44). In other words, HGF/Met signaling pathway is essential to bypass senescence and to allow oval cell survival and expansion during TGF-β-induced EMT.
It has already been reported that senescence and EMT, two processes initially considered independent, could be mechanistically linked. Indeed, there are numerous examples in the literature that show how Twist and Zeb1, two EMT-TF, impact on cell cycle machinery and suppress cellular senescence. For example, mouse embryonic fibroblasts from Zeb1-null mice show diminished replicative capacity in culture and undergo replicative senescence associated with Cdkn2b (p15) and Cdkn1 (p21) (Liu et al., 2008). Twist is responsible for the sustained proliferation of immortalized prostate epithelial cells through p14ARF down-regulation, which consequently suppresses cellular senescence caused by genomic damage (Kwok et al., 2007). Likewise, silencing of Twist in oncogene-driven tumors results in growth inhibition and activation of oncogene-induced senescence program and in some cases apoptosis (Burns et al., 2013; Tran et al., 2012). Twist 1 and 2 block the suppressor proteins pRB and p53, cooperating with oncoproteins such as H-Ras to induce a full EMT and cell invasion (Ansieau et al., 2008). Our data is in line with these findings and support the concept that overcoming senescence is a critical step for cell expansion upon EMT induction, highlighting a role for HGF/Met in this process.
But what are the mechanisms underlying the senescence process in our cell model? TGF-β induces senescence in tumor cells and other cell types (Lyu et al., 2018; Wu et al., 2009). TGF-β also induces ROS production in different cells (Krstic et al., 2015), including oval cells. The source of ROS in oval cells involves the NADPH oxidase, Nox4 although we can not discard the mitochondria as an additional source of ROS (Almale et al., 2019; Martinez-Palacian et al., 2013). Oxidative stress drives senescence and interestingly, TGF-β is able to induce senescence via increase of ROS in bone marrow mesenchymal cells and HCC cells (Senturk et al., 2010; Wu et al., 2014). In agreement with these findings,

139
here we show that during the establishment of TβT-OC very high levels of Nox4 mRNA and intracellular ROS are observed in oval cells lacking Met tyrosine kinase activity (Figure 49). Awaiting further experiments mechanistically connecting the oxidative stress with the induction of senescence, these results suggest that TGF-β induces senescence in oval cells by an oxidative stress-dependent way.
In an effort to understand how the HGF/Met axis exerts its anti-senescent role in oval cells, we found that oval cells lacking Met tyrosine kinase activity have lower levels of Twist (Figure 50). Indeed, HGF upregulates Twist in oval cells (Figure 51). It has been already demonstrated that HGF/Met can induce Twist expression. Thus, HGF-driven Twist upregulation results in cell motility in canine mammary cell line and HGF triggers EMT in melanoma cells by inducing Twist (Koefinger et al., 2011; Yoshida et al., 2014). However, our results appear to contradict the established idea of Twist as an EMT-inducing TF since HGF/Met signaling in TβT-OC help maintain epithelial properties while upregulating Twist (Figure 47). In this regard, studies in bone metastatic and parental breast carcinoma cells revealed that induction of a MET process by HGF involves E-cadherin upregulation via activation of a Twist program. Notably, a coordinated action of HGF and TGF-β is also reported in this context (Bendinelli P, 2015). So, the scenario is far more complex than initially thought. The fact that Twist knockdown in TβT-OC leads to increase in Nox4 and cell cycle inhibitors expression (Figure 52) supports the hypothesis that HGF/Met through upregulation of Twist would contain TGF-β-induced oxidative stress, which would in turn overcome cell senescence and allow cell survival and expansion. In this regard, it is well established that Met exerts a powerful antioxidant activity in hepatocytes and oval cells (Gomez-Quiroz et al., 2008; Martinez-Palacian et al., 2013). Less is known about Twist antioxidant activity, which is mainly linked to its anti-apoptotic effects (Floc'h et al., 2013). It is worth noting that we provide here the first evidence of a role for Twist in HGF/Met-driven antioxidant activity. In conclusion, our data provide evidence that the balance between HGF and TGF-β signaling pathways might be critical for oval cell fate and outcome of liver regeneration. We propose a scenario where HGF/Met signaling restrains TGF-β effects. This allows maintaining a controlled oxidative stress and apoptotic response thereby promoting the expansion of oval cells and overall improving the regenerative potential of oval cells.
140
2. Interaction between HGF and TGF-β in HCC. A pro-survival role for the HGF/Met axis
In the second part of this thesis, we run a small preliminary study on the
relevance of the crosstalk between HGF/Met and TGF-β in hepatocellular carcinoma.
Through a collaboration with Dr. Maina we had access to a mouse model recently generated in his laboratory that demonstrate that a subtle increase in wild type Met expression is sufficient to drive liver carcinogenesis. Using this model we aimed to answer the question of whether TGF-β could have any role in the development and/or progression of Met overexpression-driven HCC.
Although there are not many studies in the literature that relate TGF-β and HGF/Met pathways during tumor development and more specifically HCC, we have found some direct or indirect evidence of this interaction. TGF-β suppresses tumor emergence in certain epithelial tissues by inhibiting fibroblast-mediated production of growth factors involved in the regulation of cell survival, proliferation and motility, such as HGF (Massague, 2008). β-catenin in hepatocytes aggravates HCC development driven by an oncogenic β-catenin in combination with Met due to, among others events, an upregulation of pro-tumorigenic cytokines such as TGF-β (Liang et al., 2018) Co-expression of transgenic Met and c-Myc leads to the emergence of HCC. In this scenario, TβRII expression was down-regulated in tumors indicating that an impairment of TGF-β1-induced growth inhibition is required for an acceleration of hepatocarcinogenesis (Amicone et al., 2002). In our work, we provide preliminary results of the activation of TGF-β canonical signaling pathway in HCC from Alb-R26Met mice (Figure 53). This result goes in opposite direction to that of Amicone et al, although the consequences of Smad activation in Alb-R26Met HCCs are not yet clear. Several opposing hypotheses can be drawn. Activation of TGF-β signaling could cooperate with HGF/Met signaling for tumor development, or alternatively, could be trying to restrain or inhibit HGF/Met pro-tumorigenic action. Indeed, our results show that HCC cells are able to respond to TGF-β, as demonstrated by phosphorylation of SMAD, but interestingly, the response is different depending on Met levels (Figure 54). High levels of Met and its constitutive activation (demonstrated by phosphorylation of MET and its signaling adaptor GAB1) in HCC cells attenuates TGF-β signal, that is, decreases the levels of phosphorylated SMAD2 (Figure 54) and Smad-dependent transcriptional activity (Figure 55). This is not the first evidence of the ability of HGF to block TGF-β-induced biological responses at the transcriptional level. In fact, TGF-β-induced EMT in kidney epithelial cells and TGF-β profibrotic action in mesangial cells were inhibited by HGF through upregulation or stabilization of Smad transcriptional co-repressors SnoN or TGIF, respectively (Dai, 2004; Yang et al., 2005). However, it should be pointed out

141
that chemical inhibition of Met is not able to modulate significantly the transcriptional response elicited by TGF-β (Figure 55). There are several potential explanations that include (i) a non-optimal experimental design, (ii) differences are not Met-dependent, (iii) HCC cells have turned on additional pathways and eventually became independent on the upstream driver, in this case Met activity, a known phenomenon in carcinogenesis (Qi et al., 2011; Singh et al., 2017).In the same direction, combined treatment with HGF and TGF-β do not seem to affect in a significant manner the TGF-β-triggered transcriptional response (Figure 55). So, somehow, cells are not responsive to modulation of the HGF/Met pathway, at least in terms of Smad-mediated transcriptional activity. This is an interesting finding that should be further analyzed.
From the other side, TGF-β is able to decrease or inhibit MET phosphorylation only in HCC cells with lower levels of Met (Figure 54), an additional evidence of the dose-dependent counteracting effect of Met on TGF-β. However, the activation of the GAB1 adaptor protein is not modified by TGF-β suggesting that in this case, the TGF-β action occurs at a different time point or that the interaction between TGF-β and HGF is independent of GAB1. Negative control of the HGF/Met pathway by TGF-β has been described in glioblastoma cells where TGF-β inhibits Met phosphorylation and as a result, inhibits stemness (Papa et al., 2017). Additionally, authors propose ERK1/2 pathway as the major mediator of the crosstalk between TGF-β and HGF. Remarkably, we observe a stronger activation of ERKs under combined treatment with HGF and TGF-β in both cell lines, although this phenomenon seems more robust in cells with lower levels of Met (Figure 54). Results do not reach statistical significance probably due to the limited number of experiments performed, but for now, results provide a potentially interesting candidate for the mechanism mediating the functional crosstalk between TGF-β and HGF in this model of Met-driven HCC that should be further evaluated.
Could the interplay TGF-β/HGF contribute somehow to tumor cell properties? The expression and/or activation of survival signaling pathways in HCC have been described to confer resistance to apoptosis. That is the case for EGFR signaling (Sancho et al., 2009) and Met signaling. Regarding the latest, it was shown that HGF through the activation of PI3K/AKT suppresses Fas-induced cell death in HCC cells (Suzuki et al., 2000). In the same line, our results evidence a proliferative and survival role for Met that counteracts the TGF-β growth inhibitory and pro-apoptotic activity. Thus, HCC cells with higher levels of Met show enhanced proliferative capacity and decreased sensitivity to TGF-β-induced apoptosis (Figures 56 and 57). We demonstrate Met dependence of cell proliferative and survival properties as Met inhibition results in sharp decrease in cell number and a strong increase in caspase-3 activity in both cell lines (Figure 58). Furthermore, in low-Met, but not high-Met HCC cells, co-treatment with HGF decreases the apoptotic response triggered by TGF-β (Figure 58) evidencing that the former cells are still able to respond to paracrine HGF. Besides, the lack of effect of HGF on cell number (Figure 58), suggests that HGF/Met signaling mainly drives survival. Nonetheless, if HGF/Met is able to block TGF-β-induced growth inhibition in this model of Met-driven HCC needs to

142
be clarified. Literature in this respect is also not fully clarifying since early works showed that HGF does not induce but rather inhibits proliferation in HCC (Tajima, 1991). Inhibitory effect on HCC development was also seen in HGF/TGF-α double transgenic mice with respect to TGF-α transgenic mice (Shiota et al., 1992). However, more recent findings demonstrate that treatment of HCC cell lines with PHA665752 Met inhibitor inhibits cell proliferation and induces apoptosis (You et al., 2011). Likewise, suppressing the Met/Ras/Raf/ERK signaling pathway (Cheng et al., 2018).
In summary, preliminary results presented here provide evidence that TGF-β signaling pathway is able to interfere with HGF/Met and viceversa. More in detail, Met exerts a negative regulation on TGF-β signaling, that leads to blockage of its apoptotic activity. TGF-β is also able to decrease Met activation, but this regulatory activity is lost when Met is constitutively active. This opens the door to future studies to analyze the implications of these and other potential effects in tumor development and progression.
3. General discussion There are numerous studies about the key roles of HGF and TGF-β signaling
pathways in liver pathophysiology, liver regeneration and hepatocarcinogenesis. However, much less is known about how these two signaling axes could interfere or interact with each other to control oval cell behavior during a regenerative process and its relevance in the development and progression of liver tumors.
On the one hand, in the present study, we deeply characterize the TGF-β-induced EMT in oval cells, process that leads to the acquisition of in vitro invasion, survival and proliferation advantages, but rather than promoting stemness it induces a more mature hepatic phenotype. The consequence of all these changes is an enhancement in oval cell regenerative capacity in vivo. Interestingly, HGF/Met signaling pathway has an essential role during EMT induction, counteracting TGF-β oxidative activity and allowing oval cells to overcome the senescence process activated during chronic treatment with TGF-β, and therefore, promoting oval cell expansion. Moreover, we reveal a role for Twist as a downstream mediator of Met-mediated antioxidant activity. HGF/Met signaling pathway also contributes to the induction and/or maintenance of the phenotypic and functional properties of oval cells after EMT.
On the other hand, we show preliminary results of an activation of the TGF-β pathway in livers with moderate Met overexpression and in subsequently developed tumors, which suggest a role of TGF-β in the development of the disease as well as a potential interaction between HGF and TGF-β signaling pathways in this context. Indeed, studies in HCC lines derived from these tumors show negative feedback loops of reciprocal regulation between HGF/Met and TGF-β. Although analysis of the functional relevance of such cross-regulation in

143
vivo is still pending, we provide evidence that Met activity in HCC cells is critical for cell survival and protection against TGF-β-induced apoptosis.
This work contributes to improve our understanding of the mechanisms that
regulate oval cell biology and fate in a liver regeneration process, which could
be useful for the development of new therapies for CLDs. Besides, it opens new
paths in the study of liver cancer pathogenic mechanisms.


10. Conclusions


147
1. Chronic treatment of oval cells with TGF-β leads to a stable and partial EMT phenotype.
2. TGF-β-induced EMT in oval cells does not increase stemness but rather promotes differentiation along the hepatic lineage, while conferring proliferation, survival and invasion advantages in vitro.
3. Oval cells chronically treated with TGF-β attenuate CCl4-induced liver
damage and fibrosis upon transplantation.
4. HGF/Met signaling activation is required to overcome the oxidative stress-induced senescence and allow oval cell expansion after TGF-β-induced EMT.
5. Twist is a downstream target of HGF/Met in oval cells that mediates the antioxidant activity driven by HGF/Met signaling and prevents cell senescence.
6. HGF/Met signaling modulates TGF-β-induced EMT phenotype in oval cells contributing to cell proliferation, survival and invasive advantages while counterbalancing the mesenchymal phenotypic switching.
7. HCC cell lines derived from Alb-R26Met mice show negative regulatory circuits between HGF and TGF-β signaling pathways. Thus, HCC cells with high levels of Met show an attenuation of TGF-β-triggered Smad signaling, whereas TGF-β is able to decrease Met phosphorylation but only in HCC cells with low levels of Met.
8. HCC cell lines derived from Alb-R26Met mice show dependence on Met signaling for cell survival and protection against TGF-β.


11. References


151
Abell, A.N., and Johnson, G.L. (2014). Implications of Mesenchymal Cells in Cancer Stem Cell Populations: Relevance to EMT. Curr Pathobiol Rep 2, 21-26. Abreu, J.G., Ketpura, N.I., Reversade, B., and De Robertis, E.M. (2002). Connective-tissue growth factor (CTGF) modulates cell signalling by BMP and TGF-beta. Nat Cell Biol 4, 599-604. Aiello, N.M., Maddipati, R., Norgard, R.J., Balli, D., Li, J., Yuan, S., Yamazoe, T., Black, T., Sahmoud, A., Furth, E.E., Bar-Sagi, D., and Stanger, B.Z. (2018). EMT Subtype Influences Epithelial Plasticity and Mode of Cell Migration. Dev Cell 45, 681-695 e684. Akhurst, R.J., and Hata, A. (2012). Targeting the TGFbeta signalling pathway in disease. Nat Rev Drug Discov 11, 790-811. Almale, L., Garcia-Alvaro, M., Martinez-Palacian, A., Garcia-Bravo, M., Lazcanoiturburu, N., Addante, A., Roncero, C., Sanz, J., de la, O.L.M., Bragado, P., Mikulits, W., Factor, V.M., Thorgeirsson, S.S., Casal, J.I., Segovia, J.C., Rial, E., Fabregat, I., Herrera, B., and Sanchez, A. (2019). c-Met signaling is essential for mouse adult liver progenitor cells expansion after TGF-beta-induced EMT and regulates cell phenotypic switch. Stem Cells. Amicone, L., Terradillos, O., Calvo, L., Costabile, B., Cicchini, C., Della Rocca, C., Lozupone, F., Piacentini, M., Buendia, M.A., and Tripodi, M. (2002). Synergy between truncated c-Met (cyto-Met) and c-Myc in liver oncogenesis: importance of TGF-beta signalling in the control of liver homeostasis and transformation. Oncogene 21, 1335-1345. Andrae, J., Gallini, R., and Betsholtz, C. (2008). Role of platelet-derived growth factors in physiology and medicine. Genes Dev 22, 1276-1312. Ansieau, S., Bastid, J., Doreau, A., Morel, A.P., Bouchet, B.P., Thomas, C., Fauvet, F., Puisieux, I., Doglioni, C., Piccinin, S., Maestro, R., Voeltzel, T., Selmi, A., Valsesia-Wittmann, S., Caron de Fromentel, C., and Puisieux, A. (2008). Induction of EMT by twist proteins as a collateral effect of tumor-promoting inactivation of premature senescence. Cancer Cell 14, 79-89. Apte, U., Thompson, M.D., Cui, S., Liu, B., Cieply, B., and Monga, S.P. (2008). Wnt/beta-catenin signaling mediates oval cell response in rodents. Hepatology 47, 288-295. Aravinthan, A.D., and Alexander, G.J.M. (2016). Senescence in chronic liver disease: Is the future in aging? J Hepatol 65, 825-834. Asahina, K., Fujimori, H., Shimizu-Saito, K., Kumashiro, Y., Okamura, K., Tanaka, Y., Teramoto, K., Arii, S., and Teraoka, H. (2004). Expression of the liver-specific gene Cyp7a1 reveals hepatic differentiation in embryoid bodies derived from mouse embryonic stem cells. Genes Cells 9, 1297-1308. Awan, S.J., Baig, M.T., Yaqub, F., Tayyeb, A., and Ali, G. (2017). In vitro differentiated hepatic oval-like cells enhance hepatic regeneration in CCl4 -induced hepatic injury. Cell Biol Int 41, 51-61.

152
Barrow-McGee, R., and Kermorgant, S. (2014). Met endosomal signalling: in the right place, at the right time. Int J Biochem Cell Biol 49, 69-74. Benyon, R.C., and Arthur, M.J. (2001). Extracellular matrix degradation and the role of hepatic stellate cells. Semin Liver Dis 21, 373-384. Bertran, E., Caja, L., Navarro, E., Sancho, P., Mainez, J., Murillo, M.M., Vinyals, A., Fabra, A., and Fabregat, I. (2009). Role of CXCR4/SDF-1 alpha in the migratory phenotype of hepatoma cells that have undergone epithelial-mesenchymal transition in response to the transforming growth factor-beta. Cell Signal 21, 1595-1606. Best, J., Dolle, L., Manka, P., Coombes, J., van Grunsven, L.A., and Syn, W.K. (2013). Role of liver progenitors in acute liver injury. Front Physiol 4, 258. Bird, T.G., Lorenzini, S., and Forbes, S.J. (2008). Activation of stem cells in hepatic diseases. Cell Tissue Res 331, 283-300. Bladt, F., Riethmacher, D., Isenmann, S., Aguzzi, A., and Birchmeier, C. (1995). Essential role for the c-met receptor in the migration of myogenic precursor cells into the limb bud. Nature 376, 768-771. Boix, L., Rosa, J.L., Ventura, F., Castells, A., Bruix, J., Rodes, J., and Bartrons, R. (1994). c-met mRNA overexpression in human hepatocellular carcinoma. Hepatology 19, 88-91. Borowiak, M., Garratt, A.N., Wustefeld, T., Strehle, M., Trautwein, C., and Birchmeier, C. (2004). Met provides essential signals for liver regeneration. Proc Natl Acad Sci U S A 101, 10608-10613. Bouattour, M., Raymond, E., Qin, S., Cheng, A.L., Stammberger, U., Locatelli, G., and Faivre, S. (2018). Recent developments of c-Met as a therapeutic target in hepatocellular carcinoma. Hepatology 67, 1132-1149. Brabletz, T., Kalluri, R., Nieto, M.A., and Weinberg, R.A. (2018). EMT in cancer. Nat Rev Cancer 18, 128-134. Braun, L., Goyette, M., Yaswen, P., Thompson, N.L., and Fausto, N. (1987). Growth in culture and tumorigenicity after transfection with the ras oncogene of liver epithelial cells from carcinogen-treated rats. Cancer Res 47, 4116-4124. Bria, A., Marda, J., Zhou, J., Sun, X., Cao, Q., Petersen, B.E., and Pi, L. (2017). Hepatic progenitor cell activation in liver repair. Liver Res 1, 81-87. Budi, E.H., Duan, D., and Derynck, R. (2017). Transforming Growth Factor-beta Receptors and Smads: Regulatory Complexity and Functional Versatility. Trends Cell Biol 27, 658-672. Burns, T.F., Dobromilskaya, I., Murphy, S.C., Gajula, R.P., Thiyagarajan, S., Chatley, S.N., Aziz, K., Cho, Y.J., Tran, P.T., and Rudin, C.M. (2013). Inhibition of TWIST1 leads to activation of oncogene-induced senescence in oncogene-driven non-small cell lung cancer. Mol Cancer Res 11, 329-338.
153
Cai, J., Zhao, Y., Liu, Y., Ye, F., Song, Z., Qin, H., Meng, S., Chen, Y., Zhou, R., Song, X., Guo, Y., Ding, M., and Deng, H. (2007). Directed differentiation of human embryonic stem cells into functional hepatic cells. Hepatology 45, 1229-1239. Caja, L., Bertran, E., Campbell, J., Fausto, N., and Fabregat, I. (2011). The transforming growth factor-beta (TGF-beta) mediates acquisition of a mesenchymal stem cell-like phenotype in human liver cells. J Cell Physiol 226, 1214-1223. Caja, L., Ortiz, C., Bertran, E., Murillo, M.M., Miro-Obradors, M.J., Palacios, E., and Fabregat, I. (2007). Differential intracellular signalling induced by TGF-beta in rat adult hepatocytes and hepatoma cells: implications in liver carcinogenesis. Cell Signal 19, 683-694. Cano, A., Perez-Moreno, M.A., Rodrigo, I., Locascio, A., Blanco, M.J., del Barrio, M.G., Portillo, F., and Nieto, M.A. (2000). The transcription factor snail controls epithelial-mesenchymal transitions by repressing E-cadherin expression. Nat Cell Biol 2, 76-83. Cao, L., Zhou, Y., Zhai, B., Liao, J., Xu, W., Zhang, R., Li, J., Zhang, Y., Chen, L., Qian, H., Wu, M., and Yin, Z. (2011). Sphere-forming cell subpopulations with cancer stem cell properties in human hepatoma cell lines. BMC Gastroenterol 11, 71. Carmona-Cuenca, I., Roncero, C., Sancho, P., Caja, L., Fausto, N., Fernandez, M., and Fabregat, I. (2008). Upregulation of the NADPH oxidase NOX4 by TGF-beta in hepatocytes is required for its pro-apoptotic activity. J Hepatol 49, 965-976. Chandrasekaran, A., Idelchik, M., and Melendez, J.A. (2017). Redox control of senescence and age-related disease. Redox Biol 11, 91-102. Charni Chaabane, S., Coomans de Brachene, A., Essaghir, A., Velghe, A., Lo Re, S., Stockis, J., Lucas, S., Khachigian, L.M., Huaux, F., and Demoulin, J.B. (2014). PDGF-D expression is down-regulated by TGFbeta in fibroblasts. PLoS One 9, e108656. Chen, J., Chen, L., Zern, M.A., Theise, N.D., Diehl, A.M., Liu, P., and Duan, Y. (2017). The diversity and plasticity of adult hepatic progenitor cells and their niche. Liver Int 37, 1260-1271. Chen, J., Zhang, X., Xu, Y., Li, X., Ren, S., Zhou, Y., Duan, Y., Zern, M., Zhang, H., Chen, G., Liu, C., Mu, Y., and Liu, P. (2015). Hepatic Progenitor Cells Contribute to the Progression of 2-Acetylaminofluorene/Carbon Tetrachloride-Induced Cirrhosis via the Non-Canonical Wnt Pathway. PLoS One 10, e0130310. Cheng, J., Wu, L.M., Deng, X.S., Wu, J., Lv, Z., Zhao, H.F., Yang, Z., and Ni, Y. (2018). MicroRNA-449a suppresses hepatocellular carcinoma cell growth via G1 phase arrest and the HGF/MET c-Met pathway. Hepatobiliary Pancreat Dis Int 17, 336-344. Cheng, J.Y.-K., and Wong, G.L.-H. (2017). Advances in the diagnosis and treatment of liver fibrosis. Hepatoma Research 3. Chernov, A.V., and Strongin, A.Y. (2011). Epigenetic regulation of matrix metalloproteinases and their collagen substrates in cancer. Biomol Concepts 2, 135-147.

154
Chicoine, E., Esteve, P.O., Robledo, O., Van Themsche, C., Potworowski, E.F., and St-Pierre, Y. (2002). Evidence for the role of promoter methylation in the regulation of MMP-9 gene expression. Biochem Biophys Res Commun 297, 765-772. Chobert, M.N., Couchie, D., Fourcot, A., Zafrani, E.S., Laperche, Y., Mavier, P., and Brouillet, A. (2012). Liver precursor cells increase hepatic fibrosis induced by chronic carbon tetrachloride intoxication in rats. Lab Invest 92, 135-150. Clotman, F., Lannoy, V.J., Reber, M., Cereghini, S., Cassiman, D., Jacquemin, P., Roskams, T., Rousseau, G.G., and Lemaigre, F.P. (2002). The onecut transcription factor HNF6 is required for normal development of the biliary tract. Development 129, 1819-1828. Clouston, A.D., Powell, E.E., Walsh, M.J., Richardson, M.M., Demetris, A.J., and Jonsson, J.R. (2005). Fibrosis correlates with a ductular reaction in hepatitis C: roles of impaired replication, progenitor cells and steatosis. Hepatology 41, 809-818. Colak, S., and Ten Dijke, P. (2017). Targeting TGF-beta Signaling in Cancer. Trends Cancer 3, 56-71. Coppe, J.P., Desprez, P.Y., Krtolica, A., and Campisi, J. (2010). The senescence-associated secretory phenotype: the dark side of tumor suppression. Annu Rev Pathol 5, 99-118. Crosas-Molist, E., Bertran, E., and Fabregat, I. (2015). Cross-Talk Between TGF-beta and NADPH Oxidases During Liver Fibrosis and Hepatocarcinogenesis. Curr Pharm Des 21, 5964-5976. Crosas-Molist, E., and Fabregat, I. (2015). Role of NADPH oxidases in the redox biology of liver fibrosis. Redox Biol 6, 106-111. Czaja, A.J. (2014). Hepatic inflammation and progressive liver fibrosis in chronic liver disease. World J Gastroenterol 20, 2515-2532. Dai, C. (2004). Hepatocyte Growth Factor Antagonizes the Profibrotic Action of TGF- 1 in Mesangial Cells by Stabilizing Smad Transcriptional Corepressor TGIF. Journal of the American Society of Nephrology 15, 1402-1412. Dan, Y.Y., Riehle, K.J., Lazaro, C., Teoh, N., Haque, J., Campbell, J.S., and Fausto, N. (2006). Isolation of multipotent progenitor cells from human fetal liver capable of differentiating into liver and mesenchymal lineages. Proc Natl Acad Sci U S A 103, 9912-9917. Darwiche, H., Oh, S.H., Steiger-Luther, N.C., Williams, J.M., Pintilie, D.G., Shupe, T.D., and Petersen, B.E. (2011). Inhibition of Notch signaling affects hepatic oval cell response in rat model of 2AAF-PH. Hepat Med 3, 89-98. Davalos, A.R., Coppe, J.P., Campisi, J., and Desprez, P.Y. (2010). Senescent cells as a source of inflammatory factors for tumor progression. Cancer Metastasis Rev 29, 273-283. Daveau, M., Scotte, M., Francois, A., Coulouarn, C., Ros, G., Tallet, Y., Hiron, M., Hellot, M.F., and Salier, J.P. (2003). Hepatocyte growth factor, transforming growth factor

155
alpha, and their receptors as combined markers of prognosis in hepatocellular carcinoma. Mol Carcinog 36, 130-141. De Minicis, S., Seki, E., Paik, Y.H., Osterreicher, C.H., Kodama, Y., Kluwe, J., Torozzi, L., Miyai, K., Benedetti, A., Schwabe, R.F., and Brenner, D.A. (2010). Role and cellular source of nicotinamide adenine dinucleotide phosphate oxidase in hepatic fibrosis. Hepatology 52, 1420-1430. Debacq-Chainiaux, F., Erusalimsky, J.D., Campisi, J., and Toussaint, O. (2009). Protocols to detect senescence-associated beta-galactosidase (SA-betagal) activity, a biomarker of senescent cells in culture and in vivo. Nat Protoc 4, 1798-1806. del Castillo, G., Alvarez-Barrientos, A., Carmona-Cuenca, I., Fernandez, M., Sanchez, A., and Fabregat, I. (2008a). Isolation and characterization of a putative liver progenitor population after treatment of fetal rat hepatocytes with TGF-beta. J Cell Physiol 215, 846-855. del Castillo, G., Factor, V.M., Fernandez, M., Alvarez-Barrientos, A., Fabregat, I., Thorgeirsson, S.S., and Sanchez, A. (2008b). Deletion of the Met tyrosine kinase in liver progenitor oval cells increases sensitivity to apoptosis in vitro. Am J Pathol 172, 1238-1247. Del Castillo, G., Murillo, M.M., Alvarez-Barrientos, A., Bertran, E., Fernandez, M., Sanchez, A., and Fabregat, I. (2006). Autocrine production of TGF-beta confers resistance to apoptosis after an epithelial-mesenchymal transition process in hepatocytes: Role of EGF receptor ligands. Exp Cell Res 312, 2860-2871. Delire, B., Starkel, P., and Leclercq, I. (2015). Animal Models for Fibrotic Liver Diseases: What We Have, What We Need, and What Is under Development. J Clin Transl Hepatol 3, 53-66. Deng, H., Wang, H.F., Gao, Y.B., Jin, X.L., and Xiao, J.C. (2011). Hepatic progenitor cell represents a transitioning cell population between liver epithelium and stroma. Med Hypotheses 76, 809-812. Derynck, R., and Budi, E.H. (2019). Specificity, versatility, and control of TGF-beta family signaling. Sci Signal 12. Derynck, R., and Zhang, Y.E. (2003). Smad-dependent and Smad-independent pathways in TGF-beta family signalling. Nature 425, 577-584. Dewidar, B., Soukupova, J., Fabregat, I., and Dooley, S. (2015). TGF-β in Hepatic Stellate Cell Activation and Liver Fibrogenesis: Updated. Current Pathobiology Reports 3, 291-305. Dhanasekaran, R., Bandoh, S., and Roberts, L.R. (2016). Molecular pathogenesis of hepatocellular carcinoma and impact of therapeutic advances. F1000Res 5. Dimitroulis, D., Damaskos, C., Valsami, S., Davakis, S., Garmpis, N., Spartalis, E., Athanasiou, A., Moris, D., Sakellariou, S., Kykalos, S., Tsourouflis, G., Garmpi, A., Delladetsima, I., Kontzoglou, K., and Kouraklis, G. (2017). From diagnosis to treatment of

156
hepatocellular carcinoma: An epidemic problem for both developed and developing world. World J Gastroenterol 23, 5282-5294. Ding, W., You, H., Dang, H., LeBlanc, F., Galicia, V., Lu, S.C., Stiles, B., and Rountree, C.B. (2010). Epithelial-to-mesenchymal transition of murine liver tumor cells promotes invasion. Hepatology 52, 945-953. Ding, X.X., Zhu, Q.G., Zhang, S.M., Guan, L., Li, T., Zhang, L., Wang, S.Y., Ren, W.L., Chen, X.M., Zhao, J., Lin, S., Liu, Z.Z., Bai, Y.X., He, B., and Zhang, H.Q. (2017). Precision medicine for hepatocellular carcinoma: driver mutations and targeted therapy. Oncotarget 8, 55715-55730. Dooley, S., Hamzavi, J., Ciuclan, L., Godoy, P., Ilkavets, I., Ehnert, S., Ueberham, E., Gebhardt, R., Kanzler, S., Geier, A., Breitkopf, K., Weng, H., and Mertens, P.R. (2008). Hepatocyte-specific Smad7 expression attenuates TGF-beta-mediated fibrogenesis and protects against liver damage. Gastroenterology 135, 642-659. Dooley, S., and ten Dijke, P. (2012). TGF-beta in progression of liver disease. Cell Tissue Res 347, 245-256. Duarte, S., Baber, J., Fujii, T., and Coito, A.J. (2015). Matrix metalloproteinases in liver injury, repair and fibrosis. Matrix Biol 44-46, 147-156. Dumble, M.L., Croager, E.J., Yeoh, G.C., and Quail, E.A. (2002). Generation and characterization of p53 null transformed hepatic progenitor cells: oval cells give rise to hepatocellular carcinoma. Carcinogenesis 23, 435-445. Duncan, A.W., Dorrell, C., and Grompe, M. (2009). Stem cells and liver regeneration. Gastroenterology 137, 466-481. Ebrahimi, H., Naderian, M., and Sohrabpour, A.A. (2016). New Concepts on Pathogenesis and Diagnosis of Liver Fibrosis; A Review Article. Middle East J Dig Dis 8, 166-178. Espanol-Suner, R., Carpentier, R., Van Hul, N., Legry, V., Achouri, Y., Cordi, S., Jacquemin, P., Lemaigre, F., and Leclercq, I.A. (2012). Liver progenitor cells yield functional hepatocytes in response to chronic liver injury in mice. Gastroenterology 143, 1564-1575 e1567. Fabregat, I., Fernando, J., Mainez, J., and Sancho, P. (2014). TGF-beta signaling in cancer treatment. Curr Pharm Des 20, 2934-2947. Fabregat, I., Malfettone, A., and Soukupova, J. (2016a). New Insights into the Crossroads between EMT and Stemness in the Context of Cancer. J Clin Med 5. Fabregat, I., Moreno-Caceres, J., Sanchez, A., Dooley, S., Dewidar, B., Giannelli, G., Ten Dijke, P., and Consortium, I.-L. (2016b). TGF-beta signalling and liver disease. FEBS J 283, 2219-2232. Factor, V.M., Seo, D., Ishikawa, T., Kaposi-Novak, P., Marquardt, J.U., Andersen, J.B., Conner, E.A., and Thorgeirsson, S.S. (2010). Loss of c-Met disrupts gene expression program required for G2/M progression during liver regeneration in mice. PLoS One 5.

157
Fallowfield, J.A., Mizuno, M., Kendall, T.J., Constandinou, C.M., Benyon, R.C., Duffield, J.S., and Iredale, J.P. (2007). Scar-Associated Macrophages Are a Major Source of Hepatic Matrix Metalloproteinase-13 and Facilitate the Resolution of Murine Hepatic Fibrosis. The Journal of Immunology 178, 5288-5295. Fan, Y., Arechederra, M., Richelme, S., Daian, F., Novello, C., Calderaro, J., Di Tommaso, L., Morcrette, G., Rebouissou, S., Donadon, M., Morenghi, E., Zucman-Rossi, J., Roncalli, M., Dono, R., and Maina, F. (2017). A phosphokinome-based screen uncovers new drug synergies for cancer driven by liver-specific gain of nononcogenic receptor tyrosine kinases. Hepatology 66, 1644-1661. Fausto, N. (2004). Liver regeneration and repair: hepatocytes, progenitor cells, and stem cells. Hepatology 39, 1477-1487. Fausto, N., and Campbell, J.S. (2003). The role of hepatocytes and oval cells in liver regeneration and repopulation. Mech Dev 120, 117-130. Fausto, N., Laird, A.D., and Webber, E.M. (1995). Liver regeneration. 2. Role of growth factors and cytokines in hepatic regeneration. FASEB J 9, 1527-1536. Fernando, J., Malfettone, A., Cepeda, E.B., Vilarrasa-Blasi, R., Bertran, E., Raimondi, G., Fabra, A., Alvarez-Barrientos, A., Fernandez-Salguero, P., Fernandez-Rodriguez, C.M., Giannelli, G., Sancho, P., and Fabregat, I. (2015). A mesenchymal-like phenotype and expression of CD44 predict lack of apoptotic response to sorafenib in liver tumor cells. Int J Cancer 136, E161-172. Fischer, A.N., Fuchs, E., Mikula, M., Huber, H., Beug, H., and Mikulits, W. (2007). PDGF essentially links TGF-beta signaling to nuclear beta-catenin accumulation in hepatocellular carcinoma progression. Oncogene 26, 3395-3405. Floc'h, N., Kolodziejski, J., Akkari, L., Simonin, Y., Ansieau, S., Puisieux, A., Hibner, U., and Lassus, P. (2013). Modulation of oxidative stress by twist oncoproteins. PLoS One 8, e72490. Forner, A., Llovet, J.M., and Bruix, J. (2012). Hepatocellular carcinoma. Lancet 379, 1245-1255. Gal, A., Sjoblom, T., Fedorova, L., Imreh, S., Beug, H., and Moustakas, A. (2008). Sustained TGF beta exposure suppresses Smad and non-Smad signalling in mammary epithelial cells, leading to EMT and inhibition of growth arrest and apoptosis. Oncogene 27, 1218-1230. Gao, Y., Ruan, B., Liu, W., Wang, J., Yang, X., Zhang, Z., Li, X., Duan, J., Zhang, F., Ding, R., Tao, K., and Dou, K. (2015). Knockdown of CD44 inhibits the invasion and metastasis of hepatocellular carcinoma both in vitro and in vivo by reversing epithelial-mesenchymal transition. Oncotarget 6, 7828-7837. Gherardi, E., Birchmeier, W., Birchmeier, C., and Vande Woude, G. (2012). Targeting MET in cancer: rationale and progress. Nat Rev Cancer 12, 89-103. Ghouri, Y.A., Mian, I., and Rowe, J.H. (2017). Review of hepatocellular carcinoma: Epidemiology, etiology, and carcinogenesis. J Carcinog 16, 1.
158
Giannelli, G., Mikulits, W., Dooley, S., Fabregat, I., Moustakas, A., ten Dijke, P., Portincasa, P., Winter, P., Janssen, R., Leporatti, S., Herrera, B., and Sanchez, A. (2016). The rationale for targeting TGF-beta in chronic liver diseases. Eur J Clin Invest 46, 349-361. Giebeler, A., Boekschoten, M.V., Klein, C., Borowiak, M., Birchmeier, C., Gassler, N., Wasmuth, H.E., Muller, M., Trautwein, C., and Streetz, K.L. (2009). c-Met confers protection against chronic liver tissue damage and fibrosis progression after bile duct ligation in mice. Gastroenterology 137, 297-308, 308 e291-294. Gilgenkrantz, H., and Collin de l'Hortet, A. (2018). Understanding Liver Regeneration: From Mechanisms to Regenerative Medicine. Am J Pathol 188, 1316-1327. Giordano, S., and Columbano, A. (2014). Met as a therapeutic target in HCC: facts and hopes. J Hepatol 60, 442-452. Gomez-Quiroz, L.E., Factor, V.M., Kaposi-Novak, P., Coulouarn, C., Conner, E.A., and Thorgeirsson, S.S. (2008). Hepatocyte-specific c-Met deletion disrupts redox homeostasis and sensitizes to Fas-mediated apoptosis. J Biol Chem 283, 14581-14589. Gonzalez-Meljem, J.M., Apps, J.R., Fraser, H.C., and Martinez-Barbera, J.P. (2018). Paracrine roles of cellular senescence in promoting tumourigenesis. Br J Cancer 118, 1283-1288. Gonzalez, D.M., and Medici, D. (2014). Signaling mechanisms of the epithelial-mesenchymal transition. Sci Signal 7, re8. Gotzmann, J., Fischer, A.N., Zojer, M., Mikula, M., Proell, V., Huber, H., Jechlinger, M., Waerner, T., Weith, A., Beug, H., and Mikulits, W. (2006). A crucial function of PDGF in TGF-beta-mediated cancer progression of hepatocytes. Oncogene 25, 3170-3185. Grotegut, S., von Schweinitz, D., Christofori, G., and Lehembre, F. (2006). Hepatocyte growth factor induces cell scattering through MAPK/Egr-1-mediated upregulation of Snail. EMBO J 25, 3534-3545. Guo, M. (2017). Cellular senescence and liver disease: Mechanisms and therapeutic strategies. Biomed Pharmacother 96, 1527-1537. Hadler-Olsen, E., Fadnes, B., Sylte, I., Uhlin-Hansen, L., and Winberg, J.O. (2011). Regulation of matrix metalloproteinase activity in health and disease. FEBS J 278, 28-45. Haynes, J., Srivastava, J., Madson, N., Wittmann, T., and Barber, D.L. (2011). Dynamic actin remodeling during epithelial-mesenchymal transition depends on increased moesin expression. Mol Biol Cell 22, 4750-4764. He, S., and Sharpless, N.E. (2017). Senescence in Health and Disease. Cell 169, 1000-1011. Heldin, C.H., and Moustakas, A. (2016). Signaling Receptors for TGF-beta Family Members. Cold Spring Harb Perspect Biol 8.

159
Hemmann, S., Graf, J., Roderfeld, M., and Roeb, E. (2007). Expression of MMPs and TIMPs in liver fibrosis - a systematic review with special emphasis on anti-fibrotic strategies. J Hepatol 46, 955-975. Herbst, H., Frey, A., Heinrichs, O., Milani, S., Bechstein, W.O., Neuhaus, P., and Schuppan, D. (1997). Heterogeneity of liver cells expressing procollagen types I and IV in vivo. Histochem Cell Biol 107, 399-409. Hernandez-Segura, A., Nehme, J., and Demaria, M. (2018). Hallmarks of Cellular Senescence. Trends Cell Biol 28, 436-453. Herrera, B., Alvarez, A.M., Sanchez, A., Fernandez, M., Roncero, C., Benito, M., and Fabregat, I. (2001). Reactive oxygen species (ROS) mediates the mitochondrial-dependent apoptosis induced by transforming growth factor (beta) in fetal hepatocytes. FASEB J 15, 741-751. Higgins GM, A. R. (1931). "Experimental pathology of the liver." Arch Pathol Lab Med 12: 186-202. Huang, J., Qiu, M., Wan, L., Wang, G., Huang, T., Chen, Z., Jiang, S., Li, X., Xie, L., and Cai, L. (2018). TGF-beta1 Promotes Hepatocellular Carcinoma Invasion and Metastasis via ERK Pathway-Mediated FGFR4 Expression. Cell Physiol Biochem 45, 1690-1699. Huang, S., and He, X. (2011). The role of microRNAs in liver cancer progression. Br J Cancer 104, 235-240. Huebert, R.C., and Rakela, J. (2014). Cellular therapy for liver disease. Mayo Clin Proc 89, 414-424. Huh, C.G., Factor, V.M., Sanchez, A., Uchida, K., Conner, E.A., and Thorgeirsson, S.S. (2004). Hepatocyte growth factor/c-met signaling pathway is required for efficient liver regeneration and repair. Proc Natl Acad Sci U S A 101, 4477-4482. Huse, M., Muir, T.W., Xu, L., Chen, Y.G., Kuriyan, J., and Massague, J. (2001). The TGF beta receptor activation process: an inhibitor- to substrate-binding switch. Mol Cell 8, 671-682. Iidaka, T., Tsukamoto, T., Totsuka, Y., Hirata, A., Sakai, H., Shirai, N., Yamamoto, M., Wakabayashi, K., Yanai, T., Masegi, T., Donehower, L.A., and Tatematsu, M. (2005). Lack of elevated liver carcinogenicity of aminophenylnorharman in p53-deficient mice. Cancer Lett 217, 149-159. Ikeda, M., Morizane, C., Ueno, M., Okusaka, T., Ishii, H., and Furuse, J. (2018). Chemotherapy for hepatocellular carcinoma: current status and future perspectives. Jpn J Clin Oncol 48, 103-114. Inagaki, Y., Higashi, K., Kushida, M., Hong, Y.Y., Nakao, S., Higashiyama, R., Moro, T., Itoh, J., Mikami, T., Kimura, T., Shiota, G., Kuwabara, I., and Okazaki, I. (2008). Hepatocyte growth factor suppresses profibrogenic signal transduction via nuclear export of Smad3 with galectin-7. Gastroenterology 134, 1180-1190.

160
Inokawa, Y., Inaoka, K., Sonohara, F., Hayashi, M., Kanda, M., and Nomoto, S. (2016). Molecular alterations in the carcinogenesis and progression of hepatocellular carcinoma: Tumor factors and background liver factors. Oncol Lett 12, 3662-3668. Ishikawa, T., Factor, V.M., Marquardt, J.U., Raggi, C., Seo, D., Kitade, M., Conner, E.A., and Thorgeirsson, S.S. (2012). Hepatocyte growth factor/c-met signaling is required for stem-cell-mediated liver regeneration in mice. Hepatology 55, 1215-1226. Itoh, S., and ten Dijke, P. (2007). Negative regulation of TGF-beta receptor/Smad signal transduction. Curr Opin Cell Biol 19, 176-184. Itoh, T., and Miyajima, A. (2014). Liver regeneration by stem/progenitor cells. Hepatology 59, 1617-1626. Iwaisako, K., Jiang, C., Zhang, M., Cong, M., Moore-Morris, T.J., Park, T.J., Liu, X., Xu, J., Wang, P., Paik, Y.H., Meng, F., Asagiri, M., Murray, L.A., Hofmann, A.F., Iida, T., Glass, C.K., Brenner, D.A., and Kisseleva, T. (2014). Origin of myofibroblasts in the fibrotic liver in mice. Proc Natl Acad Sci U S A 111, E3297-3305. Jahn, S.C., Law, M.E., Corsino, P.E., Parker, N.N., Pham, K., Davis, B.J., Lu, J., and Law, B.K. (2012). An in vivo model of epithelial to mesenchymal transition reveals a mitogenic switch. Cancer Lett 326, 183-190. Jayachandran, A., Dhungel, B., and Steel, J.C. (2016). Epithelial-to-mesenchymal plasticity of cancer stem cells: therapeutic targets in hepatocellular carcinoma. J Hematol Oncol 9, 74. Jechlinger, M., Sommer, A., Moriggl, R., Seither, P., Kraut, N., Capodiecci, P., Donovan, M., Cordon-Cardo, C., Beug, H., and Grunert, S. (2006). Autocrine PDGFR signaling promotes mammary cancer metastasis. J Clin Invest 116, 1561-1570. Kai, K., Iwamoto, T., Zhang, D., Shen, L., Takahashi, Y., Rao, A., Thompson, A., Sen, S., and Ueno, N.T. (2018). CSF-1/CSF-1R axis is associated with epithelial/mesenchymal hybrid phenotype in epithelial-like inflammatory breast cancer. Sci Rep 8, 9427. Kanemura, H., Iimuro, Y., Takeuchi, M., Ueki, T., Hirano, T., Horiguchi, K., Asano, Y., and Fujimoto, J. (2008). Hepatocyte growth factor gene transfer with naked plasmid DNA ameliorates dimethylnitrosamine-induced liver fibrosis in rats. Hepatol Res 38, 930-939. Karkampouna, S., Ten Dijke, P., Dooley, S., and Julio, M.K. (2012). TGFbeta signaling in liver regeneration. Curr Pharm Des 18, 4103-4113. Kato, T. (2017). Biological roles of hepatocyte growth factor-Met signaling from genetically modified animals. Biomed Rep 7, 495-503. Kermorgant, S., and Parker, P.J. (2005). c-Met signalling: spatio-temporal decisions. Cell Cycle 4, 352-355. Kessenbrock, K., Plaks, V., and Werb, Z. (2010). Matrix metalloproteinases: regulators of the tumor microenvironment. Cell 141, 52-67.

161
Kim, D.H., Xing, T., Yang, Z., Dudek, R., Lu, Q., and Chen, Y.H. (2017a). Epithelial Mesenchymal Transition in Embryonic Development, Tissue Repair and Cancer: A Comprehensive Overview. J Clin Med 7. Kim, E.S., and Salgia, R. (2009). MET pathway as a therapeutic target. J Thorac Oncol 4, 444-447. Kim, J.H., Kim, H.S., Kim, B.J., Jang, H.J., and Lee, J. (2017b). Prognostic value of c-Met overexpression in hepatocellular carcinoma: a meta-analysis and review. Oncotarget 8, 90351-90357. Kim, W.H., Matsumoto, K., Bessho, K., and Nakamura, T. (2005). Growth inhibition and apoptosis in liver myofibroblasts promoted by hepatocyte growth factor leads to resolution from liver cirrhosis. Am J Pathol 166, 1017-1028. Knight, B., Lim, R., Yeoh, G.C., and Olynyk, J.K. (2007). Interferon-gamma exacerbates liver damage, the hepatic progenitor cell response and fibrosis in a mouse model of chronic liver injury. J Hepatol 47, 826-833. Koefinger, P., Wels, C., Joshi, S., Damm, S., Steinbauer, E., Beham-Schmid, C., Frank, S., Bergler, H., and Schaider, H. (2011). The cadherin switch in melanoma instigated by HGF is mediated through epithelial-mesenchymal transition regulators. Pigment Cell Melanoma Res 24, 382-385. Kohn-Gaone, J., Gogoi-Tiwari, J., Ramm, G.A., Olynyk, J.K., and Tirnitz-Parker, J.E. (2016). The role of liver progenitor cells during liver regeneration, fibrogenesis, and carcinogenesis. Am J Physiol Gastrointest Liver Physiol 310, G143-154. Kong, X., Feng, D., Wang, H., Hong, F., Bertola, A., Wang, F.S., and Gao, B. (2012). Interleukin-22 induces hepatic stellate cell senescence and restricts liver fibrosis in mice. Hepatology 56, 1150-1159. Kordes, C., Sawitza, I., Gotze, S., Herebian, D., and Haussinger, D. (2014). Hepatic stellate cells contribute to progenitor cells and liver regeneration. J Clin Invest 124, 5503-5515. Koyama, Y., Xu, J., Liu, X., and Brenner, D.A. (2016). New Developments on the Treatment of Liver Fibrosis. Dig Dis 34, 589-596. Krizhanovsky, V., Yon, M., Dickins, R.A., Hearn, S., Simon, J., Miething, C., Yee, H., Zender, L., and Lowe, S.W. (2008). Senescence of activated stellate cells limits liver fibrosis. Cell 134, 657-667. Krstic, J., Trivanovic, D., Mojsilovic, S., and Santibanez, J.F. (2015). Transforming Growth Factor-Beta and Oxidative Stress Interplay: Implications in Tumorigenesis and Cancer Progression. Oxid Med Cell Longev 2015, 654594. Kuilman, T., Michaloglou, C., Mooi, W.J., and Peeper, D.S. (2010). The essence of senescence. Genes Dev 24, 2463-2479. Kuramitsu, K., Sverdlov, D.Y., Liu, S.B., Csizmadia, E., Burkly, L., Schuppan, D., Hanto, D.W., Otterbein, L.E., and Popov, Y. (2013). Failure of fibrotic liver regeneration in mice

162
is linked to a severe fibrogenic response driven by hepatic progenitor cell activation. Am J Pathol 183, 182-194. Kuwahara, R., Kofman, A.V., Landis, C.S., Swenson, E.S., Barendswaard, E., and Theise, N.D. (2008). The hepatic stem cell niche: identification by label-retaining cell assay. Hepatology 47, 1994-2002. Kwok, W.K., Ling, M.T., Yuen, H.F., Wong, Y.C., and Wang, X. (2007). Role of p14ARF in TWIST-mediated senescence in prostate epithelial cells. Carcinogenesis 28, 2467-2475. Lamouille, S., Xu, J., and Derynck, R. (2014). Molecular mechanisms of epithelial-mesenchymal transition. Nat Rev Mol Cell Biol 15, 178-196. Lee, J.S., Heo, J., Libbrecht, L., Chu, I.S., Kaposi-Novak, P., Calvisi, D.F., Mikaelyan, A., Roberts, L.R., Demetris, A.J., Sun, Z., Nevens, F., Roskams, T., and Thorgeirsson, S.S. (2006). A novel prognostic subtype of human hepatocellular carcinoma derived from hepatic progenitor cells. Nat Med 12, 410-416. Lee, S.J., Kim, K.H., and Park, K.K. (2014). Mechanisms of fibrogenesis in liver cirrhosis: The molecular aspects of epithelial-mesenchymal transition. World J Hepatol 6, 207-216. Li, F., Sun, J.Y., Wang, J.Y., Du, S.L., Lu, W.Y., Liu, M., Xie, C., and Shi, J.Y. (2008). Effect of hepatocyte growth factor encapsulated in targeted liposomes on liver cirrhosis. J Control Release 131, 77-82. Li, Q., Hutchins, A.P., Chen, Y., Li, S., Shan, Y., Liao, B., Zheng, D., Shi, X., Li, Y., Chan, W.Y., Pan, G., Wei, S., Shu, X., and Pei, D. (2017). A sequential EMT-MET mechanism drives the differentiation of human embryonic stem cells towards hepatocytes. Nat Commun 8, 15166. Liang, Y., Feng, Y., Zong, M., Wei, X.F., Lee, J., Feng, Y., Li, H., Yang, G.S., Wu, Z.J., Fu, X.D., and Feng, G.S. (2018). beta-catenin deficiency in hepatocytes aggravates hepatocarcinogenesis driven by oncogenic beta-catenin and MET. Hepatology 67, 1807-1822. Liedtke, C., Luedde, T., Sauerbruch, T., Scholten, D., Streetz, K., Tacke, F., Tolba, R., Trautwein, C., Trebicka, J., and Weiskirchen, R. (2013). Experimental liver fibrosis research: update on animal models, legal issues and translational aspects. Fibrogenesis Tissue Repair 6, 19. Limaye, P.B., Alarcon, G., Walls, A.L., Nalesnik, M.A., Michalopoulos, G.K., Demetris, A.J., and Ochoa, E.R. (2008). Expression of specific hepatocyte and cholangiocyte transcription factors in human liver disease and embryonic development. Lab Invest 88, 865-872. Liu, L.X., Lee, N.P., Chan, V.W., Xue, W., Zender, L., Zhang, C., Mao, M., Dai, H., Wang, X.L., Xu, M.Z., Lee, T.K., Ng, I.O., Chen, Y., Kung, H.F., Lowe, S.W., Poon, R.T., Wang, J.H., and Luk, J.M. (2009). Targeting cadherin-17 inactivates Wnt signaling and inhibits tumor growth in liver carcinoma. Hepatology 50, 1453-1463. Liu, M., Jiang, L., and Guan, X.Y. (2014). The genetic and epigenetic alterations in human hepatocellular carcinoma: a recent update. Protein Cell 5, 673-691.

163
Liu, M.L., Mars, W.M., and Michalopoulos, G.K. (1995). Hepatocyte growth factor inhibits cell proliferation in vivo of rat hepatocellular carcinomas induced by diethylnitrosamine. Carcinogenesis 16, 841-843. Liu, Y., El-Naggar, S., Darling, D.S., Higashi, Y., and Dean, D.C. (2008). Zeb1 links epithelial-mesenchymal transition and cellular senescence. Development 135, 579-588. Llovet, J.M., Zucman-Rossi, J., Pikarsky, E., Sangro, B., Schwartz, M., Sherman, M., and Gores, G. (2016). Hepatocellular carcinoma. Nat Rev Dis Primers 2, 16018. Lowes, K.N., Brennan, B.A., Yeoh, G.C., and Olynyk, J.K. (1999). Oval cell numbers in human chronic liver diseases are directly related to disease severity. Am J Pathol 154, 537-541. Lu, W.Y., Bird, T.G., Boulter, L., Tsuchiya, A., Cole, A.M., Hay, T., Guest, R.V., Wojtacha, D., Man, T.Y., Mackinnon, A., Ridgway, R.A., Kendall, T., Williams, M.J., Jamieson, T., Raven, A., Hay, D.C., Iredale, J.P., Clarke, A.R., Sansom, O.J., and Forbes, S.J. (2015). Hepatic progenitor cells of biliary origin with liver repopulation capacity. Nat Cell Biol 17, 971-983. Lukacs-Kornek, V., and Lammert, F. (2017). The progenitor cell dilemma: Cellular and functional heterogeneity in assistance or escalation of liver injury. J Hepatol 66, 619-630. Lyu, G., Guan, Y., Zhang, C., Zong, L., Sun, L., Huang, X., Huang, L., Zhang, L., Tian, X.L., Zhou, Z., and Tao, W. (2018). TGF-beta signaling alters H4K20me3 status via miR-29 and contributes to cellular senescence and cardiac aging. Nat Commun 9, 2560. Malfettone, A., Soukupova, J., Bertran, E., Crosas-Molist, E., Lastra, R., Fernando, J., Koudelkova, P., Rani, B., Fabra, A., Serrano, T., Ramos, E., Mikulits, W., Giannelli, G., and Fabregat, I. (2017). Transforming growth factor-beta-induced plasticity causes a migratory stemness phenotype in hepatocellular carcinoma. Cancer Lett 392, 39-50. Mallat, A., and Lotersztajn, S. (2013). Cellular mechanisms of tissue fibrosis. 5. Novel insights into liver fibrosis. Am J Physiol Cell Physiol 305, C789-799. Mao, S.A., Glorioso, J.M., and Nyberg, S.L. (2014). Liver regeneration. Transl Res 163, 352-362. Marquardt, J.U., Seo, D., Gomez-Quiroz, L.E., Uchida, K., Gillen, M.C., Kitade, M., Kaposi-Novak, P., Conner, E.A., Factor, V.M., and Thorgeirsson, S.S. (2012). Loss of c-Met accelerates development of liver fibrosis in response to CCl(4) exposure through deregulation of multiple molecular pathways. Biochim Biophys Acta 1822, 942-951. Marquardt, J.U., and Thorgeirsson, S.S. (2010). Stem cells in hepatocarcinogenesis: evidence from genomic data. Semin Liver Dis 30, 26-34. Martinez-Palacian, A., del Castillo, G., Suarez-Causado, A., Garcia-Alvaro, M., de Morena-Frutos, D., Fernandez, M., Roncero, C., Fabregat, I., Herrera, B., and Sanchez, A. (2013). Mouse hepatic oval cells require Met-dependent PI3K to impair TGF-beta-induced oxidative stress and apoptosis. PLoS One 8, e53108.

164
Massague, J. (2008). TGFbeta in Cancer. Cell 134, 215-230. Massague, J. (2012). TGFbeta signalling in context. Nat Rev Mol Cell Biol 13, 616-630. Massague, J., and Gomis, R.R. (2006). The logic of TGFbeta signaling. FEBS Lett 580, 2811-2820. Massague, J., Seoane, J., and Wotton, D. (2005). Smad transcription factors. Genes Dev 19, 2783-2810. Matsuda, Y., Matsumoto, K., Yamada, A., Ichida, T., Asakura, H., Komoriya, Y., Nishiyama, E., and Nakamura, T. (1997). Preventive and therapeutic effects in rats of hepatocyte growth factor infusion on liver fibrosis/cirrhosis. Hepatology 26, 81-89. Mazzocca, A., Fransvea, E., Lavezzari, G., Antonaci, S., and Giannelli, G. (2009). Inhibition of transforming growth factor beta receptor I kinase blocks hepatocellular carcinoma growth through neo-angiogenesis regulation. Hepatology 50, 1140-1151. Meyer, C., Dzieran, J., Liu, Y., Schindler, F., Munker, S., Muller, A., Coulouarn, C., and Dooley, S. (2013). Distinct dedifferentiation processes affect caveolin-1 expression in hepatocytes. Cell Commun Signal 11, 6. Michalopoulos, G.K. (2007). Liver regeneration. J Cell Physiol 213, 286-300. Michalopoulos, G.K. (2010). Liver regeneration after partial hepatectomy: critical analysis of mechanistic dilemmas. Am J Pathol 176, 2-13. Michalopoulos, G.K. (2014). Advances in liver regeneration. Expert Rev Gastroenterol Hepatol 8, 897-907. Mima, K., Okabe, H., Ishimoto, T., Hayashi, H., Nakagawa, S., Kuroki, H., Watanabe, M., Beppu, T., Tamada, M., Nagano, O., Saya, H., and Baba, H. (2012). CD44s regulates the TGF-beta-mediated mesenchymal phenotype and is associated with poor prognosis in patients with hepatocellular carcinoma. Cancer Res 72, 3414-3423. Miyazawa, K., Tsubouchi, H., Naka, D., Takahashi, K., Okigaki, M., Arakaki, N., Nakayama, H., Hirono, S., Sakiyama, O., Takahashi, K., and et al. (1989). Molecular cloning and sequence analysis of cDNA for human hepatocyte growth factor. Biochem Biophys Res Commun 163, 967-973. Morandi, A., Taddei, M.L., Chiarugi, P., and Giannoni, E. (2017). Targeting the Metabolic Reprogramming That Controls Epithelial-to-Mesenchymal Transition in Aggressive Tumors. Front Oncol 7, 40. Morikawa, M., Derynck, R., and Miyazono, K. (2016). TGF-beta and the TGF-beta Family: Context-Dependent Roles in Cell and Tissue Physiology. Cold Spring Harb Perspect Biol 8. Munoz-Espin, D., and Serrano, M. (2014). Cellular senescence: from physiology to pathology. Nat Rev Mol Cell Biol 15, 482-496.
165
Nagy, P., Bisgaard, H.C., and Thorgeirsson, S.S. (1994). Expression of hepatic transcription factors during liver development and oval cell differentiation. J Cell Biol 126, 223-233. Nakamura, T. (1989). [Growth factor and growth inhibitor for hepatocyte proliferation]. Gan To Kagaku Ryoho 16, 481-488. Nakamura, T., and Mizuno, S. (2010). The discovery of hepatocyte growth factor (HGF) and its significance for cell biology, life sciences and clinical medicine. Proc Jpn Acad Ser B Phys Biol Sci 86, 588-610. Nakamura, T., Sakai, K., Nakamura, T., and Matsumoto, K. (2011). Hepatocyte growth factor twenty years on: Much more than a growth factor. J Gastroenterol Hepatol 26 Suppl 1, 188-202. Naldini, L., Weidner, K.M., Vigna, E., Gaudino, G., Bardelli, A., Ponzetto, C., Narsimhan, R.P., Hartmann, G., Zarnegar, R., Michalopoulos, G.K., and et al. (1991). Scatter factor and hepatocyte growth factor are indistinguishable ligands for the MET receptor. EMBO J 10, 2867-2878. Neuzillet, C., Tijeras-Raballand, A., Cohen, R., Cros, J., Faivre, S., Raymond, E., and de Gramont, A. (2015). Targeting the TGFbeta pathway for cancer therapy. Pharmacol Ther 147, 22-31. Nguyen, L.N., Furuya, M.H., Wolfraim, L.A., Nguyen, A.P., Holdren, M.S., Campbell, J.S., Knight, B., Yeoh, G.C., Fausto, N., and Parks, W.T. (2007). Transforming growth factor-beta differentially regulates oval cell and hepatocyte proliferation. Hepatology 45, 31-41. Nickel, J., Ten Dijke, P., and Mueller, T.D. (2018). TGF-beta family co-receptor function and signaling. Acta Biochim Biophys Sin (Shanghai) 50, 12-36. Nieto, M.A., Huang, R.Y., Jackson, R.A., and Thiery, J.P. (2016). Emt: 2016. Cell 166, 21-45. Nitta, T., Kim, J.S., Mohuczy, D., and Behrns, K.E. (2008). Murine cirrhosis induces hepatocyte epithelial mesenchymal transition and alterations in survival signaling pathways. Hepatology 48, 909-919. Ocana, O.H., Corcoles, R., Fabra, A., Moreno-Bueno, G., Acloque, H., Vega, S., Barrallo-Gimeno, A., Cano, A., and Nieto, M.A. (2012). Metastatic colonization requires the repression of the epithelial-mesenchymal transition inducer Prrx1. Cancer Cell 22, 709-724. Ogasawara, H., Hiramoto, J., Takahashi, M., Shirahama, K., Furusaka, A., Hiyane, S., Nakada, T., Nagayama, K., and Tanaka, T. (1998). Hepatocyte growth factor stimulates DNA synthesis in rat preneoplastic hepatocytes but not in liver carcinoma cells. Gastroenterology 114, 775-781. Ogunwobi, O.O., and Liu, C. (2011). Hepatocyte growth factor upregulation promotes carcinogenesis and epithelial-mesenchymal transition in hepatocellular carcinoma via Akt and COX-2 pathways. Clin Exp Metastasis 28, 721-731.

166
Okano, J.-i., Shiota, G., Matsumoto, K., Yasui, S., Kurimasa, A., Hisatome, I., Steinberg, P., and Murawaki, Y. (2003). Hepatocyte growth factor exerts a proliferative effect on oval cells through the PI3K/AKT signaling pathway. Biochemical and Biophysical Research Communications 309, 298-304. Okano, J., Shiota, G., and Kawasaki, H. (1999). Expression of hepatocyte growth factor (HGF) and HGF receptor (c-met) proteins in liver diseases: an immunohistochemical study. Liver 19, 151-159. Organ, S.L., and Tsao, M.S. (2011). An overview of the c-MET signaling pathway. Ther Adv Med Oncol 3, S7-S19. Ozaki, I., Zhao, G., Mizuta, T., Ogawa, Y., Hara, T., Kajihara, S., Hisatomi, A., Sakai, T., and Yamamoto, K. (2002). Hepatocyte growth factor induces collagenase (matrix metalloproteinase-1) via the transcription factor Ets-1 in human hepatic stellate cell line. J Hepatol 36, 169-178. Pagan, R., Martin, I., Llobera, M., and Vilaro, S. (1997). Growth and differentiation factors inhibit the migratory phenotype of cultured neonatal rat hepatocytes induced by HGF/SF. Exp Cell Res 235, 170-179. Pagan, R., Sanchez, A., Martin, I., Llobera, M., Fabregat, I., and Vilaro, S. (1999). Effects of growth and differentiation factors on the epithelial-mesenchymal transition in cultured neonatal rat hepatocytes. J Hepatol 31, 895-904. Paik, Y.H., Kim, J., Aoyama, T., De Minicis, S., Bataller, R., and Brenner, D.A. (2014). Role of NADPH oxidases in liver fibrosis. Antioxid Redox Signal 20, 2854-2872. Panebianco, C., Oben, J.A., Vinciguerra, M., and Pazienza, V. (2017). Senescence in hepatic stellate cells as a mechanism of liver fibrosis reversal: a putative synergy between retinoic acid and PPAR-gamma signalings. Clin Exp Med 17, 269-280. Papa, E., Weller, M., Weiss, T., Ventura, E., Burghardt, I., and Szabo, E. (2017). Negative control of the HGF/c-MET pathway by TGF-beta: a new look at the regulation of stemness in glioblastoma. Cell Death Dis 8, 3210. Parikh, P.K., and Ghate, M.D. (2018). Recent advances in the discovery of small molecule c-Met Kinase inhibitors. Eur J Med Chem 143, 1103-1138. Park, D.Y., and Suh, K.S. (1999). Transforming growth factor-beta1 protein, proliferation and apoptosis of oval cells in acetylaminofluorene-induced rat liver regeneration. J Korean Med Sci 14, 531-538. Parola, M., and Pinzani, M. (2019). Liver fibrosis: Pathophysiology, pathogenetic targets and clinical issues. Mol Aspects Med 65, 37-55. Pastrana, E., Silva-Vargas, V., and Doetsch, F. (2011). Eyes wide open: a critical review of sphere-formation as an assay for stem cells. Cell Stem Cell 8, 486-498. Petritsch, C., Beug, H., Balmain, A., and Oft, M. (2000). TGF-beta inhibits p70 S6 kinase via protein phosphatase 2A to induce G(1) arrest. Genes Dev 14, 3093-3101.

167
Piedagnel, R., Murphy, G., Ronco, P.M., and Lelongt, B. (1999). Matrix metalloproteinase 2 (MMP2) and MMP9 are produced by kidney collecting duct principal cells but are differentially regulated by SV40 large-T, arginine vasopressin, and epidermal growth factor. J Biol Chem 274, 1614-1620. Pinzani, M. (2015). Pathophysiology of Liver Fibrosis. Dig Dis 33, 492-497. Polette, M., Mestdagt, M., Bindels, S., Nawrocki-Raby, B., Hunziker, W., Foidart, J.M., Birembaut, P., and Gilles, C. (2007). Beta-catenin and ZO-1: shuttle molecules involved in tumor invasion-associated epithelial-mesenchymal transition processes. Cells Tissues Organs 185, 61-65. Preisegger, K.H., Factor, V.M., Fuchsbichler, A., Stumptner, C., Denk, H., and Thorgeirsson, S.S. (1999). Atypical ductular proliferation and its inhibition by transforming growth factor beta1 in the 3,5-diethoxycarbonyl-1,4-dihydrocollidine mouse model for chronic alcoholic liver disease. Lab Invest 79, 103-109. Puisieux, A., Brabletz, T., and Caramel, J. (2014). Oncogenic roles of EMT-inducing transcription factors. Nat Cell Biol 16, 488-494. Qi, J., McTigue, M.A., Rogers, A., Lifshits, E., Christensen, J.G., Janne, P.A., and Engelman, J.A. (2011). Multiple mutations and bypass mechanisms can contribute to development of acquired resistance to MET inhibitors. Cancer Res 71, 1081-1091. Radbill, B.D., Gupta, R., Ramirez, M.C., DiFeo, A., Martignetti, J.A., Alvarez, C.E., Friedman, S.L., Narla, G., Vrabie, R., Bowles, R., Saiman, Y., and Bansal, M.B. (2011). Loss of matrix metalloproteinase-2 amplifies murine toxin-induced liver fibrosis by upregulating collagen I expression. Dig Dis Sci 56, 406-416. Reka, A.K., Chen, G., Jones, R.C., Amunugama, R., Kim, S., Karnovsky, A., Standiford, T.J., Beer, D.G., Omenn, G.S., and Keshamouni, V.G. (2014). Epithelial-mesenchymal transition-associated secretory phenotype predicts survival in lung cancer patients. Carcinogenesis 35, 1292-1300. Richter, K., and Kietzmann, T. (2016). Reactive oxygen species and fibrosis: further evidence of a significant liaison. Cell Tissue Res 365, 591-605. Riehle, K.J., Dan, Y.Y., Campbell, J.S., and Fausto, N. (2011). New concepts in liver regeneration. J Gastroenterol Hepatol 26 Suppl 1, 203-212. Robson, E.J., Khaled, W.T., Abell, K., and Watson, C.J. (2006). Epithelial-to-mesenchymal transition confers resistance to apoptosis in three murine mammary epithelial cell lines. Differentiation 74, 254-264. Rockey, D.C., Caldwell, S.H., Goodman, Z.D., Nelson, R.C., Smith, A.D., and American Association for the Study of Liver, D. (2009). Liver biopsy. Hepatology 49, 1017-1044. Roderfeld, M. (2018). Matrix metalloproteinase functions in hepatic injury and fibrosis. Matrix Biol 68-69, 452-462. Roskams, T. (2006). Liver stem cells and their implication in hepatocellular and cholangiocarcinoma. Oncogene 25, 3818-3822.

168
Roskams, T.A., Theise, N.D., Balabaud, C., Bhagat, G., Bhathal, P.S., Bioulac-Sage, P., Brunt, E.M., Crawford, J.M., Crosby, H.A., Desmet, V., Finegold, M.J., Geller, S.A., Gouw, A.S., Hytiroglou, P., Knisely, A.S., Kojiro, M., Lefkowitch, J.H., Nakanuma, Y., Olynyk, J.K., Park, Y.N., Portmann, B., Saxena, R., Scheuer, P.J., Strain, A.J., Thung, S.N., Wanless, I.R., and West, A.B. (2004). Nomenclature of the finer branches of the biliary tree: canals, ductules, and ductular reactions in human livers. Hepatology 39, 1739-1745. Rowe, I.A. (2017). Lessons from Epidemiology: The Burden of Liver Disease. Dig Dis 35, 304-309. Rowe, R.G., Lin, Y., Shimizu-Hirota, R., Hanada, S., Neilson, E.G., Greenson, J.K., and Weiss, S.J. (2011). Hepatocyte-derived Snail1 propagates liver fibrosis progression. Mol Cell Biol 31, 2392-2403. Rygiel, K.A., Robertson, H., Marshall, H.L., Pekalski, M., Zhao, L., Booth, T.A., Jones, D.E., Burt, A.D., and Kirby, J.A. (2008). Epithelial-mesenchymal transition contributes to portal tract fibrogenesis during human chronic liver disease. Lab Invest 88, 112-123. Sakata, H., Takayama, H., Sharp, R., Rubin, J.S., Merlino, G., and LaRochelle, W.J. (1996). Hepatocyte growth factor/scatter factor overexpression induces growth, abnormal development, and tumor formation in transgenic mouse livers. Cell Growth Differ 7, 1513-1523. Salvi, A., Arici, B., Portolani, N., Giulini, S.M., De Petro, G., and Barlati, S. (2007). In vitro c-met inhibition by antisense RNA and plasmid-based RNAi down-modulates migration and invasion of hepatocellular carcinoma cells. Int J Oncol 31, 451-460. Sanchez-Capelo, A. (2005). Dual role for TGF-beta1 in apoptosis. Cytokine Growth Factor Rev 16, 15-34. Sanchez-Valle, V., Chavez-Tapia, N.C., Uribe, M., and Mendez-Sanchez, N. (2012). Role of oxidative stress and molecular changes in liver fibrosis: a review. Curr Med Chem 19, 4850-4860. Sanchez, A., Alvarez, A.M., Benito, M., and Fabregat, I. (1995). Transforming growth factor beta modulates growth and differentiation of fetal hepatocytes in primary culture. J Cell Physiol 165, 398-405. Sanchez, A., Alvarez, A.M., Benito, M., and Fabregat, I. (1996). Apoptosis induced by transforming growth factor-beta in fetal hepatocyte primary cultures: involvement of reactive oxygen intermediates. J Biol Chem 271, 7416-7422. Sanchez, A., Alvarez, A.M., Lopez Pedrosa, J.M., Roncero, C., Benito, M., and Fabregat, I. (1999). Apoptotic response to TGF-beta in fetal hepatocytes depends upon their state of differentiation. Exp Cell Res 252, 281-291. Sanchez, A., Pagan, R., Alvarez, A.M., Roncero, C., Vilaro, S., Benito, M., and Fabregat, I. (1998). Transforming growth factor-beta (TGF-beta) and EGF promote cord-like structures that indicate terminal differentiation of fetal hepatocytes in primary culture. Exp Cell Res 242, 27-37.

169
Sancho, P., Bertran, E., Caja, L., Carmona-Cuenca, I., Murillo, M.M., and Fabregat, I. (2009). The inhibition of the epidermal growth factor (EGF) pathway enhances TGF-beta-induced apoptosis in rat hepatoma cells through inducing oxidative stress coincident with a change in the expression pattern of the NADPH oxidases (NOX) isoforms. Biochim Biophys Acta 1793, 253-263. Santoni-Rugiu, E., Preisegger, K.H., Kiss, A., Audolfsson, T., Shiota, G., Schmidt, E.V., and Thorgeirsson, S.S. (1996). Inhibition of neoplastic development in the liver by hepatocyte growth factor in a transgenic mouse model. Proc Natl Acad Sci U S A 93, 9577-9582. Sato, K., Marzioni, M., Meng, F., Francis, H., Glaser, S., and Alpini, G. (2019). Ductular Reaction in Liver Diseases: Pathological Mechanisms and Translational Significances. Hepatology 69, 420-430. Scheel, C., Eaton, E.N., Li, S.H., Chaffer, C.L., Reinhardt, F., Kah, K.J., Bell, G., Guo, W., Rubin, J., Richardson, A.L., and Weinberg, R.A. (2011). Paracrine and autocrine signals induce and maintain mesenchymal and stem cell states in the breast. Cell 145, 926-940. Schmidt, C., Bladt, F., Goedecke, S., Brinkmann, V., Zschiesche, W., Sharpe, M., Gherardi, E., and Birchmeier, C. (1995). Scatter factor/hepatocyte growth factor is essential for liver development. Nature 373, 699-702. Schuster, N., and Krieglstein, K. (2002). Mechanisms of TGF-beta-mediated apoptosis. Cell Tissue Res 307, 1-14. Sell, S. (1993). Cellular Origin of Cancer: Dedifferentiation or Stem Cell Maturation Arrest? Environmental Health Perspectives 101. Senturk, S., Mumcuoglu, M., Gursoy-Yuzugullu, O., Cingoz, B., Akcali, K.C., and Ozturk, M. (2010). Transforming growth factor-beta induces senescence in hepatocellular carcinoma cells and inhibits tumor growth. Hepatology 52, 966-974. Seoane, J., and Gomis, R.R. (2017). TGF-beta Family Signaling in Tumor Suppression and Cancer Progression. Cold Spring Harb Perspect Biol 9. Shen, Y., Wei, Y., Wang, Z., Jing, Y., He, H., Yuan, J., Li, R., Zhao, Q., Wei, L., Yang, T., and Lu, J. (2015). TGF-beta regulates hepatocellular carcinoma progression by inducing Treg cell polarization. Cell Physiol Biochem 35, 1623-1632. Shi, Y., and Massagué, J. (2003). Mechanisms of TGF-β Signaling from Cell Membrane to the Nucleus. Cell 113, 685-700. Shiota, G., Kunisada, T., Oyama, K., Udagawa, A., Nomi, T., Tanaka, K., Tsutsumi, A., Isono, M., Nakamura, T., Hamada, H., Sakatani, T., Sell, S., Sato, K., Ito, H., and Kawasaki, H. (2000). In vivo transfer of hepatocyte growth factor gene accelerates proliferation of hepatic oval cells in a 2-acetylaminofluorene/partial hepatectomy model in rats. FEBS Lett 470, 325-330. Shiota, G., Rhoads, D.B., Wang, T.C., Nakamura, T., and Schmidt, E.V. (1992). Hepatocyte growth factor inhibits growth of hepatocellular carcinoma cells. Proc Natl Acad Sci U S A 89, 373-377.

170
Siegel, P.M., and Massague, J. (2003). Cytostatic and apoptotic actions of TGF-beta in homeostasis and cancer. Nat Rev Cancer 3, 807-821. Singh, D.K., Kollipara, R.K., Vemireddy, V., Yang, X.L., Sun, Y., Regmi, N., Klingler, S., Hatanpaa, K.J., Raisanen, J., Cho, S.K., Sirasanagandla, S., Nannepaga, S., Piccirillo, S., Mashimo, T., Wang, S., Humphries, C.G., Mickey, B., Maher, E.A., Zheng, H., Kim, R.S., Kittler, R., and Bachoo, R.M. (2017). Oncogenes Activate an Autonomous Transcriptional Regulatory Circuit That Drives Glioblastoma. Cell Rep 18, 961-976. Skrypek, N., Goossens, S., De Smedt, E., Vandamme, N., and Berx, G. (2017). Epithelial-to-Mesenchymal Transition: Epigenetic Reprogramming Driving Cellular Plasticity. Trends Genet 33, 943-959. Smit, M.A., and Peeper, D.S. (2010). Epithelial-mesenchymal transition and senescence: two cancer-related processes are crossing paths. Aging (Albany NY) 2, 735-741. Smogorzewska, A., and de Lange, T. (2002). Different telomere damage signaling pathways in human and mouse cells. EMBO J 21, 4338-4348. Stoker, M., Gherardi, E., Perryman, M., and Gray, J. (1987). Scatter factor is a fibroblast-derived modulator of epithelial cell mobility. Nature 327, 239-242. Suarez-Causado, A., Caballero-Diaz, D., Bertran, E., Roncero, C., Addante, A., Garcia-Alvaro, M., Fernandez, M., Herrera, B., Porras, A., Fabregat, I., and Sanchez, A. (2015). HGF/c-Met signaling promotes liver progenitor cell migration and invasion by an epithelial-mesenchymal transition-independent, phosphatidyl inositol-3 kinase-dependent pathway in an in vitro model. Biochim Biophys Acta 1853, 2453-2463. Suzuki, A., Hayashida, M., Kawano, H., Sugimoto, K., Nakano, T., and Shiraki, K. (2000). Hepatocyte growth factor promotes cell survival from fas-mediated cell death in hepatocellular carcinoma cells via Akt activation and Fas-death-inducing signaling complex suppression. Hepatology 32, 796-802. Tahmasebi Birgani, M., and Carloni, V. (2017). Tumor Microenvironment, a Paradigm in Hepatocellular Carcinoma Progression and Therapy. Int J Mol Sci 18. Tajima, H., Matsumoto, K., and Nakamura, T. (1991). Hepatocyte growth factor has potent anti-proliferative activity in various tumor cell lines. FEBS Lett 291, 229-232. Takami, T., Kaposi-Novak, P., Uchida, K., Gomez-Quiroz, L.E., Conner, E.A., Factor, V.M., and Thorgeirsson, S.S. (2007). Loss of hepatocyte growth factor/c-Met signaling pathway accelerates early stages of N-nitrosodiethylamine induced hepatocarcinogenesis. Cancer Res 67, 9844-9851. Tanaka, M., Itoh, T., Tanimizu, N., and Miyajima, A. (2011). Liver stem/progenitor cells: their characteristics and regulatory mechanisms. J Biochem 149, 231-239. Tarlow, B.D., Pelz, C., Naugler, W.E., Wakefield, L., Wilson, E.M., Finegold, M.J., and Grompe, M. (2014). Bipotential adult liver progenitors are derived from chronically injured mature hepatocytes. Cell Stem Cell 15, 605-618.

171
Tennakoon, A.H., Izawa, T., Wijesundera, K.K., Katou-Ichikawa, C., Tanaka, M., Golbar, H.M., Kuwamura, M., and Yamate, J. (2015). Analysis of glial fibrillary acidic protein (GFAP)-expressing ductular cells in a rat liver cirrhosis model induced by repeated injections of thioacetamide (TAA). Exp Mol Pathol 98, 476-485. Thenappan, A., Li, Y., Kitisin, K., Rashid, A., Shetty, K., Johnson, L., and Mishra, L. (2010). Role of transforming growth factor beta signaling and expansion of progenitor cells in regenerating liver. Hepatology 51, 1373-1382. Thiery, J.P., Acloque, H., Huang, R.Y., and Nieto, M.A. (2009). Epithelial-mesenchymal transitions in development and disease. Cell 139, 871-890. Tran, P.T., Shroff, E.H., Burns, T.F., Thiyagarajan, S., Das, S.T., Zabuawala, T., Chen, J., Cho, Y.J., Luong, R., Tamayo, P., Salih, T., Aziz, K., Adam, S.J., Vicent, S., Nielsen, C.H., Withofs, N., Sweet-Cordero, A., Gambhir, S.S., Rudin, C.M., and Felsher, D.W. (2012). Twist1 suppresses senescence programs and thereby accelerates and maintains mutant Kras-induced lung tumorigenesis. PLoS Genet 8, e1002650. Trusolino, L., Bertotti, A., and Comoglio, P.M. (2010). MET signalling: principles and functions in development, organ regeneration and cancer. Nat Rev Mol Cell Biol 11, 834-848. Uehara, Y., Minowa, O., Mori, C., Shiota, K., Kuno, J., Noda, T., and Kitamura, N. (1995). Placental defect and embryonic lethality in mice lacking hepatocyte growth factor/scatter factor. Nature 373, 702-705. Ueki, T., Fujimoto, J., Suzuki, T., Yamamoto, H., and Okamoto, E. (1997). Expression of hepatocyte growth factor and its receptor c-met proto-oncogene in hepatocellular carcinoma. Hepatology 25, 862-866. Ueki, T., Kaneda, Y., Tsutsui, H., Nakanishi, K., Sawa, Y., Morishita, R., Matsumoto, K., Nakamura, T., Takahashi, H., Okamoto, E., and Fujimoto, J. (1999). Hepatocyte growth factor gene therapy of liver cirrhosis in rats. Nat Med 5, 226-230. Valdes, F., Alvarez, A.M., Locascio, A., Vega, S., Herrera, B., Fernandez, M., Benito, M., Nieto, M.A., and Fabregat, I. (2002). The epithelial mesenchymal transition confers resistance to the apoptotic effects of transforming growth factor Beta in fetal rat hepatocytes. Mol Cancer Res 1, 68-78. Van Hul, N.K., Abarca-Quinones, J., Sempoux, C., Horsmans, Y., and Leclercq, I.A. (2009). Relation between liver progenitor cell expansion and extracellular matrix deposition in a CDE-induced murine model of chronic liver injury. Hepatology 49, 1625-1635. Vega, S., Morales, A.V., Ocana, O.H., Valdes, F., Fabregat, I., and Nieto, M.A. (2004). Snail blocks the cell cycle and confers resistance to cell death. Genes Dev 18, 1131-1143. Venepalli, N.K., and Goff, L. (2013). Targeting the HGF-cMET Axis in Hepatocellular Carcinoma. Int J Hepatol 2013, 341636. Vestentoft, P.S., Jelnes, P., Andersen, J.B., Tran, T.A., Jorgensen, T., Rasmussen, M., Bornholdt, J., Grovdal, L.M., Jensen, C.H., Vogel, L.K., Thorgeirsson, S.S., and Bisgaard,

172
H.C. (2013). Molecular constituents of the extracellular matrix in rat liver mounting a hepatic progenitor cell response for tissue repair. Fibrogenesis Tissue Repair 6, 21. Viticchie, G., and Muller, P.A.J. (2015). c-Met and Other Cell Surface Molecules: Interaction, Activation and Functional Consequences. Biomedicines 3, 46-70. Wang, L., Lin, L., Chen, X., Sun, L., Liao, Y., Huang, N., and Liao, W. (2015a). Metastasis-associated in colon cancer-1 promotes vasculogenic mimicry in gastric cancer by upregulating TWIST1/2. Oncotarget 6, 11492-11506. Wang, P., Liu, T., Cong, M., Wu, X., Bai, Y., Yin, C., An, W., Wang, B., Jia, J., and You, H. (2009). Expression of extracellular matrix genes in cultured hepatic oval cells: an origin of hepatic stellate cells through transforming growth factor beta? Liver Int 29, 575-584. Wang, R., Ferrell, L.D., Faouzi, S., Maher, J.J., and Bishop, J.M. (2001). Activation of the Met receptor by cell attachment induces and sustains hepatocellular carcinomas in transgenic mice. J Cell Biol 153, 1023-1034. Wang, R., Li, Y., Hou, Y., Yang, Q., Chen, S., Wang, X., Wang, Z., Yang, Y., Chen, C., Wang, Z., and Wu, Q. (2015b). The PDGF-D/miR-106a/Twist1 pathway orchestrates epithelial-mesenchymal transition in gemcitabine resistance hepatoma cells. Oncotarget 6, 7000-7010. Watsky, M.A., Weber, K.T., Sun, Y., and Postlethwaite, A. (2010). New Insights into the Mechanism of Fibroblast to Myofibroblast Transformation and Associated Pathologies. In, pp. 165-192. Watt, A.J., Garrison, W.D., and Duncan, S.A. (2003). HNF4: a central regulator of hepatocyte differentiation and function. Hepatology 37, 1249-1253. Weiskirchen, R., and Tacke, F. (2016). Liver Fibrosis: From Pathogenesis to Novel Therapies. Dig Dis 34, 410-422. Weiskirchen, R., Weiskirchen, S., and Tacke, F. (2018). Recent advances in understanding liver fibrosis: bridging basic science and individualized treatment concepts. F1000Res 7. Wells, R.G. (2008). Cellular sources of extracellular matrix in hepatic fibrosis. Clin Liver Dis 12, 759-768, viii. Wendt, M.K., Allington, T.M., and Schiemann, W.P. (2009). Mechanisms of the epithelial-mesenchymal transition by TGF-beta. Future Oncol 5, 1145-1168. Whittaker, S., Marais, R., and Zhu, A.X. (2010). The role of signaling pathways in the development and treatment of hepatocellular carcinoma. Oncogene 29, 4989-5005. Wiemann, S.U., Satyanarayana, A., Tsahuridu, M., Tillmann, H.L., Zender, L., Klempnauer, J., Flemming, P., Franco, S., Blasco, M.A., Manns, M.P., and Rudolph, K.L. (2002). Hepatocyte telomere shortening and senescence are general markers of human liver cirrhosis. FASEB J 16, 935-942. Williams, M.J., Clouston, A.D., and Forbes, S.J. (2014). Links between hepatic fibrosis, ductular reaction, and progenitor cell expansion. Gastroenterology 146, 349-356.

173
Wu, J., Niu, J., Li, X., Wang, X., Guo, Z., and Zhang, F. (2014). TGF-beta1 induces senescence of bone marrow mesenchymal stem cells via increase of mitochondrial ROS production. BMC Dev Biol 14, 21. Wu, S., Hultquist, A., Hydbring, P., Cetinkaya, C., Oberg, F., and Larsson, L.G. (2009). TGF-beta enforces senescence in Myc-transformed hematopoietic tumor cells through induction of Mad1 and repression of Myc activity. Exp Cell Res 315, 3099-3111. Wu, X.Z., and Chen, D. (2006). Origin of hepatocellular carcinoma: role of stem cells. J Gastroenterol Hepatol 21, 1093-1098. Wu, Y., Ding, Z.Y., Jin, G.N., Xiong, Y.X., Yu, B., Sun, Y.M., Wang, W., Liang, H.F., Zhang, B., and Chen, X.P. (2018). Autocrine transforming growth factor-beta/activin A-Smad signaling induces hepatic progenitor cells undergoing partial epithelial-mesenchymal transition states. Biochimie 148, 87-98. Xia, J.L., Dai, C., Michalopoulos, G.K., and Liu, Y. (2006). Hepatocyte growth factor attenuates liver fibrosis induced by bile duct ligation. Am J Pathol 168, 1500-1512. Xie, B., Xing, R., Chen, P., Gou, Y., Li, S., Xiao, J., and Dong, J. (2010). Down-regulation of c-Met expression inhibits human HCC cells growth and invasion by RNA interference. J Surg Res 162, 231-238. Xie, L., Law, B.K., Chytil, A.M., Brown, K.A., Aakre, M.E., and Moses, H.L. (2004). Activation of the Erk pathway is required for TGF-beta1-induced EMT in vitro. Neoplasia 6, 603-610. Xie, Q., Liu, K.D., Hu, M.Y., and Zhou, K. (2001). SF/HGF-c-Met autocrine and paracrine promote metastasis of hepatocellular carcinoma. World J Gastroenterol 7, 816-820. Xu, J., Lamouille, S., and Derynck, R. (2009). TGF-beta-induced epithelial to mesenchymal transition. Cell Res 19, 156-172. Yan, X., Liu, Z., and Chen, Y. (2009). Regulation of TGF-beta signaling by Smad7. Acta Biochim Biophys Sin (Shanghai) 41, 263-272. Yang, J., Dai, C., and Liu, Y. (2005). A novel mechanism by which hepatocyte growth factor blocks tubular epithelial to mesenchymal transition. J Am Soc Nephrol 16, 68-78. Yang, L., Pang, Y., and Moses, H.L. (2010). TGF-beta and immune cells: an important regulatory axis in the tumor microenvironment and progression. Trends Immunol 31, 220-227. Yang, S., Koteish, A., Lin, H., Huang, J., Roskams, T., Dawson, V., and Diehl, A.M. (2004). Oval cells compensate for damage and replicative senescence of mature hepatocytes in mice with fatty liver disease. Hepatology 39, 403-411. Yang, W., Wang, C., Lin, Y., Liu, Q., Yu, L.X., Tang, L., Yan, H.X., Fu, J., Chen, Y., Zhang, H.L., Tang, L., Zheng, L.Y., He, Y.Q., Li, Y.Q., Wu, F.Q., Zou, S.S., Li, Z., Wu, M.C., Feng, G.S., and Wang, H.Y. (2012). OV6(+) tumor-initiating cells contribute to tumor progression and invasion in human hepatocellular carcinoma. J Hepatol 57, 613-620.

174
Yang, W., Yan, H.X., Chen, L., Liu, Q., He, Y.Q., Yu, L.X., Zhang, S.H., Huang, D.D., Tang, L., Kong, X.N., Chen, C., Liu, S.Q., Wu, M.C., and Wang, H.Y. (2008). Wnt/beta-catenin signaling contributes to activation of normal and tumorigenic liver progenitor cells. Cancer Res 68, 4287-4295. Yao, P., Zhan, Y., Xu, W., Li, C., Yue, P., Xu, C., Hu, D., Qu, C.K., and Yang, X. (2004). Hepatocyte growth factor-induced proliferation of hepatic stem-like cells depends on activation of NF-kappaB. J Hepatol 40, 391-398. Yildiz, G., Arslan-Ergul, A., Bagislar, S., Konu, O., Yuzugullu, H., Gursoy-Yuzugullu, O., Ozturk, N., Ozen, C., Ozdag, H., Erdal, E., Karademir, S., Sagol, O., Mizrak, D., Bozkaya, H., Ilk, H.G., Ilk, O., Bilen, B., Cetin-Atalay, R., Akar, N., and Ozturk, M. (2013). Genome-wide transcriptional reorganization associated with senescence-to-immortality switch during human hepatocellular carcinogenesis. PLoS One 8, e64016. Yilmaz, M., and Christofori, G. (2009). EMT, the cytoskeleton, and cancer cell invasion. Cancer Metastasis Rev 28, 15-33. Yoshida, K., Choisunirachon, N., Saito, T., Matsumoto, K., Saeki, K., Mochizuki, M., Nishimura, R., Sasaki, N., and Nakagawa, T. (2014). Hepatocyte growth factor-induced up-regulation of Twist drives epithelial-mesenchymal transition in a canine mammary tumour cell line. Res Vet Sci 97, 521-526. Yoshiji, H., Kuriyama, S., Miyamoto, Y., Thorgeirsson, U.P., Gomez, D.E., Kawata, M., Yoshii, J., Ikenaka, Y., Noguchi, R., Tsujinoue, H., Nakatani, T., Thorgeirsson, S.S., and Fukui, H. (2000). Tissue inhibitor of metalloproteinases-1 promotes liver fibrosis development in a transgenic mouse model. Hepatology 32, 1248-1254. You, H., Ding, W., Dang, H., Jiang, Y., and Rountree, C.B. (2011). c-Met represents a potential therapeutic target for personalized treatment in hepatocellular carcinoma. Hepatology 54, 879-889. You, W.K., and McDonald, D.M. (2008). The hepatocyte growth factor/c-Met signaling pathway as a therapeutic target to inhibit angiogenesis. BMB Rep 41, 833-839. Yovchev, M.I., Grozdanov, P.N., Zhou, H., Racherla, H., Guha, C., and Dabeva, M.D. (2008). Identification of adult hepatic progenitor cells capable of repopulating injured rat liver. Hepatology 47, 636-647. Zarnegar, R. (1995). Regulation of HGF and HGFR gene expression. EXS 74, 33-49. Zeisberg, M., Yang, C., Martino, M., Duncan, M.B., Rieder, F., Tanjore, H., and Kalluri, R. (2007). Fibroblasts derive from hepatocytes in liver fibrosis via epithelial to mesenchymal transition. J Biol Chem 282, 23337-23347. Zhang, Y., Alexander, P.B., and Wang, X.F. (2017). TGF-beta Family Signaling in the Control of Cell Proliferation and Survival. Cold Spring Harb Perspect Biol 9. Zhang, Y., and Weinberg, R.A. (2018). Epithelial-to-mesenchymal transition in cancer: complexity and opportunities. Front Med 12, 361-373.

175
Zhang, Y., Xia, M., Jin, K., Wang, S., Wei, H., Fan, C., Wu, Y., Li, X., Li, X., Li, G., Zeng, Z., and Xiong, W. (2018). Function of the c-Met receptor tyrosine kinase in carcinogenesis and associated therapeutic opportunities. Mol Cancer 17, 45. Zhang, Y.E. (2009). Non-Smad pathways in TGF-beta signaling. Cell Res 19, 128-139. Zhao, B., and Chen, Y.G. (2014). Regulation of TGF-beta Signal Transduction. Scientifica (Cairo) 2014, 874065. Zhao, Z., Rahman, M.A., Chen, Z.G., and Shin, D.M. (2017). Multiple biological functions of Twist1 in various cancers. Oncotarget 8, 20380-20393. Zhou, W.C., Zhang, Q.B., and Qiao, L. (2014). Pathogenesis of liver cirrhosis. World J Gastroenterol 20, 7312-7324.


12. Annexes

c-Met Signaling Is Essential for Mouse Adult LiverProgenitor Cells Expansion After TransformingGrowth Factor-β-Induced Epithelial–MesenchymalTransition and Regulates Cell Phenotypic Switch
LAURA ALMALÉ,a MARÍA GARCÍA-�ALVARO,a ADORACIÓN MARTÍNEZ-PALACIÁN,a
MARÍA GARCÍA-BRAVO,b,c,d NEREA LAZCANOITURBURU,a ANNALISA ADDANTE,a CESÁREO RONCERO,a
JULIÁN SANZ,e MARÍA DE LA O LÓPEZ,a PALOMA BRAGADO,a WOLFGANG MIKULITS,f
VALENTINA M. FACTOR,g SNORRI S. THORGEIRSSON,g,h J. IGNACIO CASAL,i JOSÉ-CARLOS SEGOVIA,b,c,d
EDUARDO RIAL,j ISABEL FABREGAT,k,l BLANCA HERRERA,a,† ARÁNZAZU SÁNCHEZ a,†
Key Words. HGF/c-Met • Oval cell • TGF-β • EMT
ABSTRACT
Adult hepatic progenitor cells (HPCs)/oval cells are bipotential progenitors that participate inliver repair responses upon chronic injury. Recent findings highlight HPCs plasticity and impor-tance of the HPCs niche signals to determine their fate during the regenerative process, favoringeither fibrogenesis or damage resolution. Transforming growth factor-β (TGF-β) and hepatocytegrowth factor (HGF) are among the key signals involved in liver regeneration and as componentof HPCs niche regulates HPCs biology. Here, we characterize the TGF-β-triggered epithelial–mesenchymal transition (EMT) response in oval cells, its effects on cell fate in vivo, and the regu-latory effect of the HGF/c-Met signaling. Our data show that chronic treatment with TGF-βtriggers a partial EMT in oval cells based on coexpression of epithelial and mesenchymalmarkers. The phenotypic and functional profiling indicates that TGF-β-induced EMT is not associ-ated with stemness but rather represents a step forward along hepatic lineage. This phenotypictransition confers advantageous traits to HPCs including survival, migratory/invasive and meta-bolic benefit, overall enhancing the regenerative potential of oval cells upon transplantation intoa carbon tetrachloride-damaged liver. We further uncover a key contribution of the HGF/c-Metpathway to modulate the TGF-β-mediated EMT response. It allows oval cells expansion afterEMT by controlling oxidative stress and apoptosis, likely via Twist regulation, and it counterbal-ances EMT by maintaining epithelial properties. Our work provides evidence that a coordinatedand balanced action of TGF-β and HGF are critical for achievement of the optimal regenerativepotential of HPCs, opening new therapeutic perspectives. STEM CELLS 2019;00:1–11
SIGNIFICANCE STATEMENT
The findings from this study support that a balanced action of transforming growth factor-β and
hepatocyte growth factor could determine liver progenitor’s fate and the outcome of liver
regeneration, and open possibilities for targeted therapies oriented at improving the regenera-
tive capacity of these cells in chronic liver diseases.
INTRODUCTION
Adult hepatic progenitor cells (HPCs), known in
rodent as oval cells, expand in situations of chronic
liver damage or diseases in which hepatocyte pro-
liferation and function are impaired and thus be-
coming a critical asset to orchestrate liver repair
response [1, 2]. The progenitor-associated liver re-
generation and supporting signals are still not well
characterized. A good understanding of the regula-
tion of HPCs is crucial not only because their
regenerative potential makes them interesting
therapeutic targets in liver pathologies, but also
because increasing evidence points to a role of
oval cells in progression of liver fibrosis [3, 4], leav-
ing the question on the role of oval cells in the con-
text of chronic liver disease (CLD) open.
Transforming growth factor-β (TGF-β) is a
central regulator in CLD contributing to seem-
ingly all stages of disease [5, 6]. Once TGF-β is
activated upon damage, it triggers crucial cellu-
lar events that drive disease progression. Thus,
it promotes hepatic stellate cell (HSC) trans-
differentiation into myofibroblast, the main
aDepartment of Biochemistry andMolecular Biology, Faculty ofPharmacy, Complutense Universityof Madrid, Health ResearchInstitute of the Hospital Clínico SanCarlos, Madrid, Spain; bCellDifferentiation and CytometryUnit, Hematopoietic InnovativeTherapies Division, Centro deInvestigaciones Energéticas,Medioambientales y Tecnológicas(CIEMAT), Madrid, Spain; cCentrode Investigación Biomédica en Redde Enfermedades Raras (CIBERER),Madrid, Spain; dAdvancedTherapies Mixed Unit, CIEMAT/IISFundación Jiménez Díaz, Madrid,Spain; eDepartment of Pathology,Hospital Clínico San Carlos, Madrid,Spain; fDepartment of Medicine I,Institute of Cancer Research,Comprehensive Cancer Center,Medical University of Vienna,Vienna, Austria; gLaboratory ofExperimental Carcinogenesis,National Cancer Institute, NationalInstitutes of Health, Bethesda,Maryland, USA; hLaboratory ofHuman Carcinogenesis, Center forCancer Research, National CancerInstitute, National Institutes ofHealth, Bethesda, Maryland;iDepartment of FunctionalProteomics, Centro deInvestigaciones Biológicas (CIB-CSIC), Madrid, Spain; jDepartmentof Cellular and MolecularMedicine, Centro deInvestigaciones Biológicas (CIB-CSIC), Madrid, Spain; kTGF-β andCancer Group, Oncobell Program,Bellvitge Biomedical ResearchInstitute (IDIBELL) and University ofBarcelona, L’Hospitalet deLlobregat, Barcelona, Spain;lOncology Program, CIBEREHD,National Biomedical ResearchInstitute on Liver andGastrointestinal Diseases, Institutode Salud Carlos III, Madrid, Spain
Correspondence: Aránzazu
Sánchez, Ph.D., Department of
Biochemistry and Molecular
Biology, Faculty of Pharmacy,
Complutense University of
Madrid, Plaza Ramón y Cajal S/N,
28040 Madrid, Spain. Telephone:
34913941855; e-mail:
Received October 23, 2018;
accepted for publication
April 29, 2019; first published
online May 20, 2019.
http://dx.doi.org/
10.1002/stem.3038
†Co-senior authors.
The data that support the
findings of this study are
available from the corresponding
author upon reasonable request.
STEM CELLS 2019;00:1–11 www.StemCells.com ©AlphaMed Press 2019
TISSUE-SPECIFIC STEM CELLS
![6 Inmunomodulaci n [Modo de compatibilidad] Inmunomodulación.pdf · reguladores. Linfocitos reguladores favorecen la liberación de la citoquina TGF-ß ( acción inhibidora de la](https://static.fdocuments.mx/doc/165x107/5b584d967f8b9a655d8bc72d/6-inmunomodulaci-n-modo-de-compatibilidad-inmunomodulacionpdf-reguladores.jpg)


![दई शदु - Belauri · 2019. 12. 10. · jflif{s gu/ ljsf; of]hgf 1 दई शदु नेपालको सुदरपिचमु भेगको सुदरपिचमु](https://static.fdocuments.mx/doc/165x107/61199df2542d657e1f36444c/aa-aaa-belauri-2019-12-10-jflifs-gu-ljsf-ofhgf-1-aa-aaa.jpg)
![ofno ; 'wf/ of ]hgf lgdf {0f ;xof]uL–k 'l:tsf · g]kfn ;/sf/ lzIff dGqfno lzIff ljefu ljb\ofno ; 'wf/ of ]hgf lgdf {0f;xof]uL–k 'l:tsf g]kfn ;/sf/ lzIff dGqfno lzIff ljefu c;f]h](https://static.fdocuments.mx/doc/165x107/60207cfa74f69d16c53444a6/ofno-wf-of-hgf-lgdf-0f-xofulak-l-gkfn-sf-lziff-dgqfno-lziff-ljefu.jpg)