Legge... · ˇ ˇˇ˚ˇ ˘ ˇ #˝˝ ˘ ˇ ˘ #ˇ ˇ ˘ ˝ ˇ # ˚ ˚ˇ ˘ ˇ ˜ ˙ˇ # ˇ ˇ˙ ˜4 ˚ ˇˇ
2013������31���������� ��������1960����� ����

����������
����� ������������������� ��� ���� �
��������� ��� ��� ���� �
��������������������������� ��� �� � �
�������������������������� ��� �� � �
� ��� ���������������������� ��� �� � ��
����� �������� ���� ���������

����� ������������������� ������� �

������ �)1960 ( �"�
("���")
���� ��� ���� ��������
� ������� ����� ��/� ���� � ����� ���� ���� ����� � ��� ���"� " ����� ���� ����� � ������� ��
�� �����2012 ") ���������� (" ����� �� ����� ���������� �� �� ����� ���� ��1:
1.����� 1.9 ���� ������ ���� �����- ����� ������ ������ ������ ������
����8.5.2013 ����� ����� �� � ���� ����� � ���� ������ ����� ���� ����� ����� ,
���� ��� ����� ������12.5.2013 � ������ ���� � � �� � ���� ���� ������ ,����� ,�����
���� ������� ������ �������� ����� ���� ����������� ��������18.3.2013 ���� ���
������� ������� �� ����� ���� ����� ������ ������ �� ��� �� ������ ���� �� � �����
���� .�� ����9.5.2013 � ����� ���� �� ����� ���� �� � ���� ����� ���� ����19.5.2013
��� � � ������ ������ ���� �� � ����� ���� :���� � �� ����� ���� � ����� �� � ���
�� �) ��� ����� ������ ���� ��� ���� ����� ��� � ��� ����� (��� �� ��) ���� �����12 � (
��� , ��� ������ ������� ���� ����� � �� ��� ���� � ���� �� ���� ����� ) �� �12(
���� �) ��� �� ���� �� ������26.7.2013.(
��� ��� ���� ��� ,����� ������ ����� ����� �8.5.2013 :������ '��)2013-01-057256� ( -
9.5.2013 :������ '��)2013-01-058957����� �� �� ������ ��� ������ �� ,(.
����13.5.2013 ������� ����� ���� �� �� �� �) ���� ������12����� � ( ���� �� �
������ ��� ����� ��� � ���� ���� ����� ) �� �12( ���� ������ ����� ��� �� ��� ,
31.5.2013, ����17.6.2013 . ������ '��) � ���� ���� � ��� ����� ������2013-01-061825 �� (
����� �� �� ������ �� ������.
����17.5.2013 ���� � ���� ����� ������ ������ ����� ����� ���� ���� ����� ����� �
���� ����� �������19.5.2013 .���� ��� ����� �������� � ��� ���� ����� ����� ��
17.5.2013 ������ '��)2013-01-063592( �����19.5.2013 ������ '��)2013-01-063898 �� (
����� �� �� ������ �� ������.
����19.5.2013 ���� ������ ����� ���� ����� ����� � ���� �� �� � �� �� ����� �
��� ����� � ���� ����� ������ � ������ ������ ����� � � �� ������ ����� �� ����
������ '��) � ���� ���� � ��� ����� ������ .��� �� �� ��� ������2013-01-064339 �� (
.����� �� �� ������ �� ������
1 ��� � ��� ����� ���� ���� �����39� ���� �������� ���� ) ��� ����� ����� ���"�� ,(�-1970. ���� ��� �� ���
�� � ��� ������ ������ ���� �� �� � ������ ��������� ������ ��� ,���� ����� ���� � ��� ����� �� ����� �� ����� � �������2012 ���� ����� ��28 ,����2012 :������)2013-01-021751.(

- 2 -
2.����� 1.9 ���� ������ ���� �����- ����� ������ ������ ������ ������������ 15.3.3 -
(� �����) ���� �� �����
����21 ,������2013 �� ��������� ��� ����� ������ �� �)4,��� ����� ( ����� ����� ����
�� �) ���� ������4 (- ������ �.�.� �� �� ����2007 �"�� �� ,� ���� '��3 ������ �� ���� ,
�� �) ���� ����� ������� ���� ��/� ����� ���� �� �� ��4 � ��� �� ������� �� ���� (
,�"��� ������������ ���� ��� ���� ������� �� �� ������ ������ �� �� �� ������� ��
��� ��� ������ ���� ���� ,�������� � ���� ��������.������ ����� �� � ���� �� �����
����� ��� ��� ���� ��� ,����� ������10.4.2013 :������ '��)2013-01-032932 ;(14.4.2013
:������ '��)2013-01-035992 ;(17.4.2013 ) '�� ������2013-01-035992� (- 21.4.2013 ) '��
������: 2013-01-040159 �- 2013-01-041107.(

- 3 -
3.� ����.27.6 ������ ���� ����� ����- ��� ������� ����� - �� ������� ������City Plaza
:����� ����� �������
��� ������ �������100% �� .��� ������- 74%
����31.3.2013 ����31.12.2012 ����31.12.2011 ����31.12.2010
��� ������� �����) ��� ����(������
51,960 54,94054,69054,400
���� ����� ����Wuest & Partner
Wuest & Partner
Wuest & PartnerWuest & Partner
?���� ���� ������ ����� �� �� �� ?���� ���� ���� �����������
���� ����� � ����� ����� ����� ������� ���� ������)
(����
31/3/201331/12/201231/12/201131/12/2010
���� ����� � ��DCF DCF DCF DCF ����� ����� ����� ����� ������� �������
���� ������ ���� ������-
Sales Comparison Approach
�� ��- ����
)Gross Leasable Area ��� (
����� �����(�"�)
12,74412,74412,74412,744
����� ����� ���� �� ��� ����-
����� ���� ��� �����
95%95%98% 98.2%
(����) ����� �� ������� ������� ����� ����� �"�� ���) ��� �����
(������
203203198 199
����� ����4.7% 4.4%4.6%4.8% NOI ����� �����
����) ��� �����(������ ���
2,415 2,4022,579 2,579
�� ���� ������ �����- NOI
��� � �����)NOI ���� ����
(��� ���
4.65% 4.37%4.7%4.8%
������� ������1% 1%1%1% ����� ����) ����� ������ �����
:(���� ���� ����� ���� ���� �����������
����� ����� � ����5%*55,558 57,69055,70054,400 � � ���5%49,362 52,20051,95051,680
����� ����� � ����5%55,558 57,69057,42057,120 � � ���5%49,362 52,20051,95051,680
����� �� �������
����
� ����5%55,558 57,69057,42057,120 � � ���5% 49,362 52,20051,95051,680
� ����� ����� *5% � ����� � ��- 100% .������ ���� ,�����

- 4 -
4. �����10.1.7 ������ ���� ����� ����- �����- .NSI N.V ")NSI("- ������
����26 ������2013 � ���� ����� ���� ����� ����NSI ���� � ��� �� ����� ��� �
�NSI���� , ����� ��� ��� )LTV � (NSI � ����- 55%, ��� � ����� ������ ��� � ����
85% �- 100% ��� ��� .������ ���� ������ ,������ ���������- LTV ����� ����- 55% � ���� -
60% � ����� ��� ����� ,50% �������� ������ ������. ��� ����- LTV �� ����60%
����� ��� ����� �50% ����� ������ �������� .
���� � ��� �� ��� ,����� ������29.4.2013 :������ '��)2013-01-047218 �� ������ �� ,(
.����� �� �� ������
5.������� 31.1.01 �- 15.6 ���� ������ ���� �����- ��� ����� ����- NSI ������� �
����� ,�������
) �� ����� ���� ���� �����Refinance (� ��� �� ���19 ,��������2012 ���Habas Tulip
B.V ��� �� � �� ��� � ���� � ���� ���� , � ����� ����� � � �� (�������) ��������
74% ")Habas Tulip("� ���� �� �� ���� ��������� �� ,- Habas Tulip ������ �����
�����NSI �������Habas Tulip ) ������ � ��� ����LtSV ������� ���� ��� ���� �� ���� ,(
���� � ������� ����� ���� ( ����� �� ���� ���� �����)NSI � ���� �� ,50%.
���� ����� ����������� � ���- 50% � � �� ����� ,Habas Tulip ����5 ,������2013� � �� , -
700 � � �� ��� �� ���� ���� ����� � ����) ���� ���� - 518 ������ ���� ����� (���� ����
� � �� �� ��� ����� �� ���� �� �� ����� ���� .������ � ��� ���� � ���� - 18,914,720
� ,����� ��� - LtSV � ���� ��49.93%.
����1.5.2013�������� ��� �� ,������ ���� �������� ���� ����� ����� , �� ��� �����
����� ����� ���� � �� ������ ��� �� ���� ������� ����� ����� ��� '� � �
NSI���� ������� ������ ���� ��� �� ,.
� �������� ��� ,������ � ����� �� ����� ��� �7.4.2013 :������ '��)2013-01-027499( � -
1.5.2013 :������ '��)2013-01-050569(� ������ �� ,�� .����� �� �� ������
6. �����10.2.2.2 ������ ���� ����� ����- ������ ����� ��� ������
����10 ������2013 �����- Habas Star B.V � ����� ����� � � �� ������� ����74%
")Habas Star(", ���� ������ ����� ��������)30%( �- HORN Three Management GmbH �-
HORN Three GmbH & Co. KG ����� ,��� ���� ��� �� ,����� �� � �� ��� � ����
� � ��� ������ ����- 1.27 � ��������� ,��� �� �� ��� ������ �����, �� � �� �- 0.27
��� ���� ���� �� ����� ���� ������ ��� ���� ����) ����� �������� (���� ��. �����
� ���� ���� ���� �� ����� - Habas Star ���� ������� � ����� ,�� ,����� ��� ����� ;
� � ��� ��� ������ ���� - 0.27 .���� ������
- 5 -
���� � ��� �� ��� ,����� ������11.4.2013 :������ '��)2013-01-033286 �� ������ �� ,(
.����� �� �� ������
7. �����13.2)1( ������ ���� ����� ����- ������ �����
���� 1 ����2013 ����Habas Star � ��� ���� ������1 ���� ������ ���� ���� ��� � ���� ��
") �"�� �"� (��) ���� � � �� �� "��� ����(" ���� �� �� ��� ������� ���� �� ��11 ,�������
2013 ")������� ����,���� .(" ���� �� �� �� ����� ������ ��� �������� ������� 31 ,����
2013 ) ���� ����� ����� ���� ����2.4.2013 ,���� ��� , ������ ��� ���� � �� �� ����� ��
���� �������31.3.2013 ����30.4.2013.(
����.5.201316 ����� ����� , ��Habas Star � � ��� ������� ���� �� ����-1.57 ���� ������
.(�� ��� � ���� ������ ���)
�� ��� ,����� �������� � ����� ����� �2.4.2013 '��) :������2013-01-022624(, 2.5.2013 '��)
:������2013-01-051835(� �- 16.5.2013 ������ '��)2013-01-062383( ,�� � �������� ������
����� �� ��.
8. �����15.3.3 ���� ������ ���� �����- (� �����) ���� �� ����� � �����15.6 - �������"
"�������) ������� ���� '��2 ���- ����� ����� �����-NSI(
�� �) ���� ����� �� ��� ��� �� ����� �� ������� �����4( ����� � ���� ������ ,2
������2013 .����� ��� �� ��� �� ��� "��� � ���"���� � ���� ���Habas Star
�� �) ���� ����� ����� �� �����4 ( �� ����� �� �� ���- 115.41%� ��� �� ��� ���� . -
"�������� ����" � �) ����� ��� �� ��� �� ��� ,120% � ��� ��� ���� ����� ,(60 ���
.� � �������� ���� �� ���� �� ������ ��� ������ ��� �� ���� ��� �����
���� � ��� �� ��� ,����� ������2.4.2013 ��) ' :������2013-01-022966( , �� ������ ��
����� �� �� ������.
9. �����19 ���� ������ ���� �����- ������� ������
�. ����22 ,������2013 ����� ��� ����� �����, ������ ������ ����� ��� ������� �����
���� ��� ���� ��� �� ��� �� ��� ������2011-2012 ������ ���� ����" ��
������ "� ������"�� ,������ ��� -1999������ ��� . ���� ���18 ,������2013 ������
��� ������ ���� ���� �������-���� ��� ����� ���� ���� ,����� ����� ���� �
������ � �������� �� ����� ����. ,�� � ���� ������ ��� �� � ��� ����� ����
.����� ����12.5.2013 ���� �� �� ��� ��� � ��� ����� � ���� ��� �� ���� ��� ����
����� � ����������� ���� ���� ������ ������ ����� ���� ���� �15.7.2013 ;
���� � ��� ,������� ����� ������ ���� ����7.9.2013, ���� �� ���� �� ���
����� ������ ,����� ������ ����� ���� ����� ���� � �� � ��� �� .���� ���� �� ,
.����� ���� ���� ������ ���� ��� ��� ���� ������� ����� �� ���� �� ,��
- 6 -
���� ����� � � ��� �� ��� ,����� ������23.4.2013 ) '�� :������2013-01-042601( ���
�����7.� . ���� ����� � ����� �� �31 ,����2013, ����� �� �� ������ ��� ������ �� .
�. ����28 ,������2013 ����� ��� ����� ����� , ,������� ������ ������ ����� ��� �����
�"��� ,��� ����� ��� ������ ����� ���� �����-1968 ����� ����� ��������� , ��
����� ���� � ��� �� �� ����� ������ � ���� ������ � � ��)Habas Star ( � ������ ������
�2012 – �� ��� �� ������ �� ������ ���������� ������� � ������ ����� ���� )�� �
4( .������ ���� ������ ���� ���� ������� ������ ���� ���� ���17 ,������2013 �� � �
�� �) ��� ������ ����� ����� ����� ���4����� � ( �� �) ���� ����� ���� �� ���)4 (
���� ����� �1 ,��������2012 ���� ��28 ,����2013 ����� ����� ��� ,����� � ,(
�� � ���� .����� �"��� ������ ���� ����� � �������� ,�� ��� �� � ��� �����
������� ����� ���� .����� ���� ����� �� ���� ���
����� ����� � ��� ��� ���� ��� ,����� ������25.4.2013 :������ '��)2013-01-044938 (
�- 28.4.2013 :������)2013-01-047014( ����� ���7.� . ���� ����� � ����� �� �31 ,����
2013����� ��� ������ �� ,����� �� �� �.
10. ����3 ,������2013 ,��� �� �� ����� ����� ) ����� ��� ����2005 ������ ����� ���� ,�"�� (
,��� ���� �� ,�� ����� ����� ��� ����� � ��������� � �"�� � ���� ����� �� � ���� ��
���� ������ �� �� ��� �� ������ ������ ��� �� ���� �� 1 ,������2013 ���� ������
30 ,����2013 �� � ��� �������� - 500,000 .�" ���� ����� � � ��� �� ��� ,����� ������
4.4.2013 :������ '��)2013-01-025882(.����� �� �� ������ �� ������ �� ,
����8 ,������2013 '��� ,����� � �������� ����� �"��� � ����� ���� �� ����� ��� ��
���� ��� ����� ���� �� ,���� �� 7 ,�����2013. ���� ����� � � ��� �� ��� ,����� ������
8.4.2013 :������ '��)2013-01-028993����� �� �� ������ �� ������ �� ,(.
����18 ,������2013 ����� ����� � ������ � ��� � ,����� �"�� ���� �� ������ ���� ���
(����� ������� ���� �������) ����� ��� ��. ���� ����� � � ��� �� ��� ,����� ������
18.4.2013 :������ '��)2013-01-038749.����� �� �� ������ �� ������ �� ,( ����� ������
����� ��� ����� ����� ��������� ��������� ����� �� ��9 ���� ����� � ������� ���� �
31.3.2013.
����13 ,����2013 ���� ���� ���� ,����� � ������ ������ ���� , � �� ������
��������� � ���� ,��� ���� �������� ������ ����� ������ ��) ��� ���� ��������
����� ����� ���� � ������ �� ����� ����� ���� ��� ����, �� ����� ����� �����
� ���� ��� ���( ������ ��� ������ ��/� ����� ���� �� ��/�� ����� � ����� ��//��� �
����� ����, ,�� ������ ��������� ���, � �������, ���� ���15 ,������2013 .
����� ����� � ��� ��� ���� ��� ,����� ������7.4.2013 :������ '��)2013-01-028624� ( -
13.5.2013 :������)2013-01-0611084.����� �� �� ������ ��� ������ �� ,(

- 7 -
27 ��� 2013
����� ) ������ �1960 (�"�
������� ���� ����� ��� ����:
��� ������������� � �"�� ,
����� �������� �"�� ,

�������� ��� ������� �

���������� ������� ������ ��� ��������31 ��� 2013
��������� ��� ) �����1960����) �"�� (: "�����(" ���� ���� ���� ����� ����� �� ��������� � �� � ��� ��� ����� ���� ���� ������ ����� ����� ����) �� �� ���� ������ " �������� (" ������
�� �� ��� � ����� ���� ������31 ���� 2013 " :����)����� �� �(" , ��� ������� �����48 � ���� (�� ���� �������� ���� ) ��� ����� �"�- 1970 " :����)���� ���� �(".
�� �� ������ �������� ���� ����� ������� ������� ����� ������� ������ ����31 ���� 2013 :����)"���� � �������(".
) ��������� ���� ���� ���� ����� ���� ������� ���� �IFRS����� ������ .(, ��� �� ����� �����2 �- 3 .������� ���� �
1. ����� ��������� ��� �� ������ �������� � �������"� ���" ���� 12 ����2013 � ���� ����� ���� �� �� �� ���� ��� �� �� ����� ����� ("���� � ���" :����)�
� � ���������� ��� ���2013 ,�� ���� �N.V. NSI ,���� ����� ���� ���� ������� ����� � �- 20.54% �� � � ������ " :����)NSI ������� ������� ����� �������� ����� ����� ���� ,("
,���� ���� ���� ��� ��� ���� .�� ������ ������ ������ ���� � ���� � ��� ��� �� ������� � ������� ������ �� ���� �� ����� �� ������� ���� ���� ����� ���� � ����NSI, ��� ���
� ������ ���� � ���� ��� �� ���� ,������� �NSI ��� ����� ����� ���� ����� ���� ��� .��� ����� ������ ������ ����� ���� ����
�� ��� �� ��� ,����� ���� �� � ���� ������ ������ ������ ������� ,��� �� � �������� ����� ������ ��� �� ���� ����� � ������� ���� ����� �� � ����� ������ ����� ����� �12 �- 4 �������
������� ��� �� ���2013 ���� ����� �� �� �� �� ���� ������ ����� ����� ��� ,����� ����� ..��������� ����� ���� ����� ������ ��� ����� �� ����� ����� ������
���� ����� ���� ,����� ��� �13 ���� 2013 ��� �� ���� ����� ������ ����� �������� ��� ��12 � - 4 ���� �� ,�� ����� ������ ����� ������� ������ ������ ���� �� ,���� ��� ,����� ������� ���� ,
����� �� ������ ��� �� ��� �� ,��������� ��� ����� ��� ��� ������� ��� ������ �� ������� �� ��� ���� ��� ���� , ��� ����� ��� ������ ����� ����� ,����� ������� ���� ������ ��
������ �� ��������� ��� ������ ����� ������� �� ��� .�� �� ������� ���� ����� ������� �����) ������ ����� ��� ���� ���� �� ���� ����� �����Margin Call���� ,( ������� ����� �� ��� ����
�����4 ����� ����� ����� ���� ��������� ��� .���� ������ ����� �� ���� ����� ��� ����� ��� ��� .� ;������ ����� �� ����� ����� ��� �� �� ���� .� :���� � ���� �� ������ ���� ���14 ���
��� ����� �� �� �� ����� ����� ������ ���� ����� ��� � �� ���� .� ;������ ����� �� ������ �� ��.���� ��� � � �� ���� �����
����� ������ ����� ���� ��� �� 12 �- 4 ,������� ���� 18 ���� 2013 ,���� ����� ��� ��� ��� �� ����� ���� ,�� ����� ����� � �� ����� �� ���� ��� ����� ��� �������� ��� ���� ���� ����� ����� .("������" :����)
����� ����� �� � ������� ����� ����� ����� �� ������ ������ �� ������ �������� � ������ ������ �� � ����� �� � ��� ���� ����� ,��������� ��� �� ���� � ����� ,�� ����� ��������
�������� ����� ���� �� � ���� ����� �� ����� �� ����� ������ ����� ���� ����� .����� �� ��� ������1 ,�6, 7 �- 9 ������� ���� �.
����13 ����2013 �� �) ���� ������ ���� �� �� �� ����� �����12 � ���� ���� �� � ����� � ( ������ ��� ����� ��� �� �) ��� ����� �12 ���� ������ ����� ��� �� ��� ,(31 ����2013 ���� ,17
����2013. ����19 ����2013������� , ���� � � �� ��� ����� ������ ����� ���� ������ ,����� ,����� ����
������� ������ �������� ����� ���� ����������� �������� �� � ���� ����18 ����2013 , ������ ���� ������� ������� �� ����� ���� ����� ������ ������ �� ��� �� ������ ���� �� � �����,
���� ����� ��� � ��� ����� (��� �� ��) ���� ����� ��� � � ������ ������ ���� �� � ����� ���� �� �) ��� ����� ������ ���� ���12 ( ������� ���� ����� � �� ��� ���� � ���� ����� , ��� ����� �
�� � �12 ���� �) ��� �� ���� �� ������26 �����2013.( �� �� ����� ���� ���� ��� �� ������ ��� �� ��� ��.
����� ������ ���� � ����� ,��� ��� ����� �������� � � ����� ,��� ���� 7 � ���� �������.
2
2. ���� ��
�. ����� ����
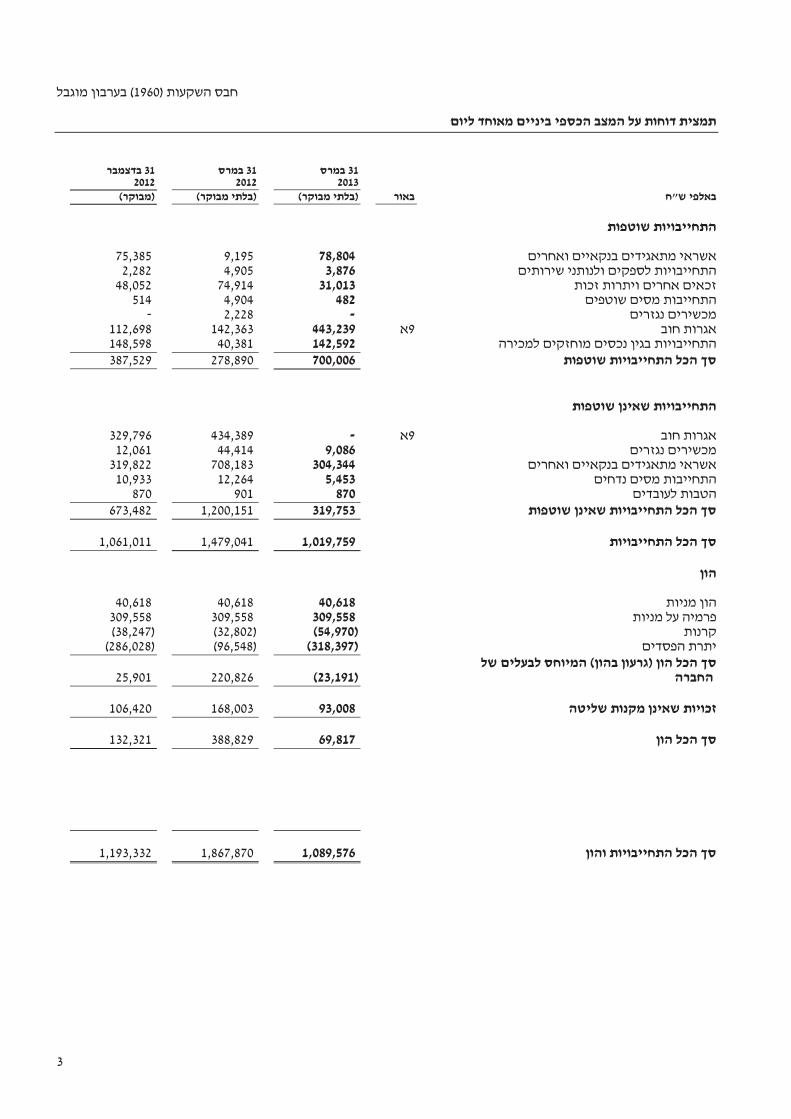
���� ������ � ����� ��31 ���� 2013 �������- 1,090 ������ ") �� � �� �����- 1,193 ������ " ����� 31 ���� �2012( .
���� ������ ���� �������� ������31 ���� 2012 ����� ������� ���31 ���� �2012 :���
����� ����� �������� ����- 3 ������ "� � � ���- 19 ������ ������) �" ��������", ����� ������ ������ ������ .(���� "
� � ��� ���� ������ ������ ����� �����- 35 ������ ����� ��� ,�" ������ � ��� ������30 ,�" ������
��� ����� ����� ������ ����� .���� ������ �����
����� � ���������� ���� ����� ������ � ������ ��� � ����� �������� �� �.
� ����� �� ����� � ��� �� ���� ������ ��� �- 26 ������ �"� � ���- 85 �" ������ ���� ��� ����������� .������ � �� ����� � ��� ����� , ���� ��� ������ ����5 �������� ���� .
������ ���� ������ � ��� ������� ������- 59 ������ � ���� ����� ����� ��� ,�" ������
� ����NSI � � ���- 21 �������" ���� �� ���)2.2 (���� , ��� ���� ����� � ������� �� � ����� � �����5.3% .�� � ������
. ����� ��������
���� ������ ���������� �� ��31 ���� 2013 � ������- 1,020 ������ �" )� � �� �����- 1,061 ������ "� ���� 31 ���� �2012(.
�������� ���������������� ���� ������31 ���� 2013 ����������������� � ���31 ���� �2012 :���
� � ��� ������ ����� �� ����� ����� ����� �����- 12 ������" ����� ��� ,� ����� ����� � ��� ��� �"��� ������� � �������� ����� � ������� ������� �������� ���� �������� �
������� � 5.3% �- 6.2% ������.
������ ����� �� ��� ,�� � ����� �� ������ �� � ���� ��� �� ����� � ��� ���� ��� ,���� � ����� ,������� �� ��� ������� ������ �� ����� ����� ������� �� ��� .� ,�� ���� ���� ����� � ��� ������
NSI � ������- Euronext NYSE Amsterdam �� � ������ ����� ������ ������� ���� ��� ���� ��� , �����NSI ���� � ������� ���� ����NSI (LtSV) � ���� ���31 ���� 2013 � ��� ������ ���� � ���
�- 18.2 .����� ���������� ����� ���� ������ � ,���� � ��� � �� �� ����� �� ���� ���� � ����- 18.7 .���� ������ ����� ������ ��� ����5 � ���� �������.
����� ������7 �� ������ ������ ����� ���� ��/� ������ ����� ������ ����� �� ����� ,������� ����
�� �) ��� ����� ������ �������4.� ��� ������ ���� ����� ��� ��� ����� ��� ��� ,( ����� ��� ,���� �� �) ���12 ����� � ���� �� � �� ����� ,� ��� ������ ���� ����� ��� ( ����� ����� ���� ���
,����� ����� .� ��� ������ � ���� .���� ��������� ��� ����� ���� ������������ ��� �� ����� ����� ������ ����� ���� ���7 ��.������� ����
� ��� ��� ������ ���������� ���� �� � � �� ������ ���� ����� ��� ��� ,����27 ���� 2013 , ������� ���� � ����- 126.
.� ����� �� ����
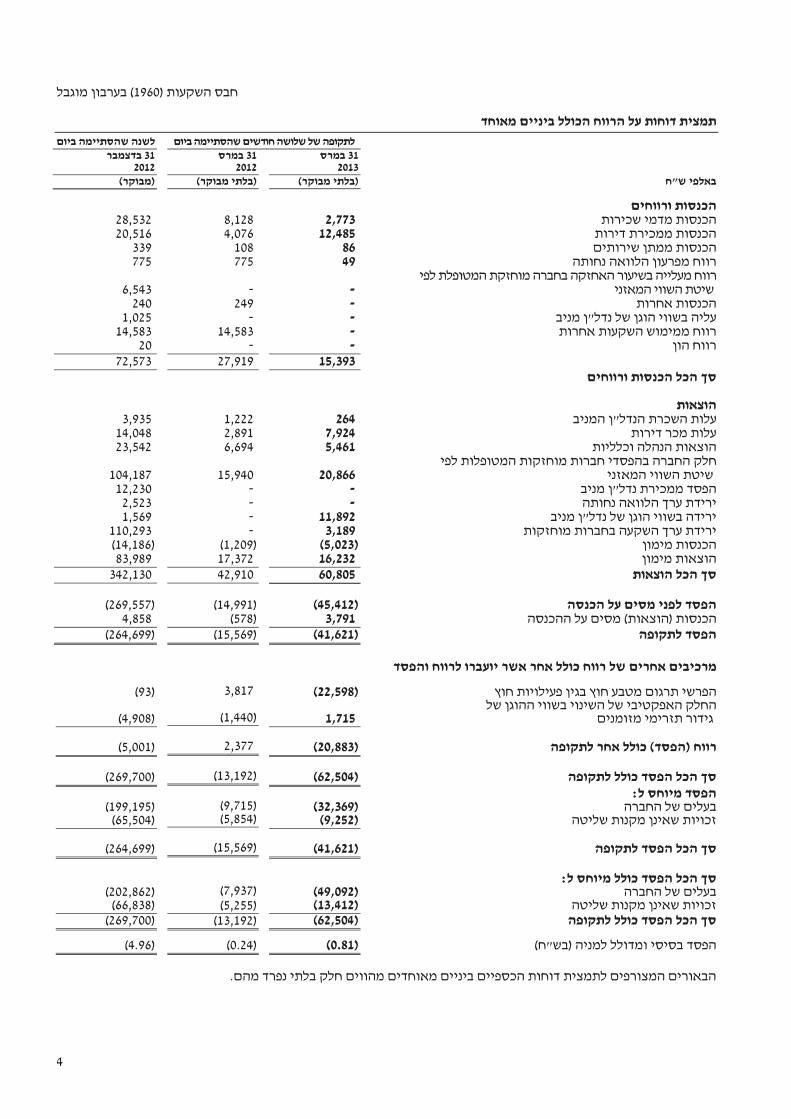
������ � ���� ���31 ���� 2013 � ������- 70 ������ ����� �" � �� �- 132 ������ ���� �"31 ���� �2012 . ���������� ����, ��� � �- 62 ������ "�, ��� �� ��� � ����� ������ ���� �� ������
� ������ ���) ������ ������"�(���� "��� .

3
.� ������� ������
1. ������
1.1 ����� �� � ����� �� � ������ ����� ������ ��� ����� �� � � ��� ��� �"� �- 3 ������ ������ .�"
����� ����� ��� ��� �������� � ��� ��� �"� �- 8 ������ " ������ .�� �2013 ��� ����� ������ ����� ���� ������ � ���� .����� ������ ����� ���� �"�
���� � ���� �2012.
1.2. ���� ������ ����� ��� � ����� ������ ������ ����������� ��� � ������ � ������Yoo Tel Aviv � ����- 12.5 ������ "�.
2. ������
2.1 ������� ���� ������ �������� ����� ������ ����� � ����� �������- 5.5 ������ ������ .�" ��� ������
�� �������� ����� ������ ������- 6.7 .�" ������ ������ ��� ,������� � �- 1.2 ������������ �� ���� ���� ����� ��� ��� ������� � ���� ����� ��� �" .������ ����� ����
������ ������ ,���� ��� ,�������� ����� ������� �������� �������� ����� �������� ���� ���� � ��� . ��� ����9 .������� ���� �
2.2 ������ ���� ���� ������� �����
�� � ������ � � ��� ������� ����� � ���� ���� �� ������ ���- 21 ������ .�" ������ ��� , ��� ������� ������� ���� ��� � � ��� ������� �����- 16 ������
.�" ����� ������ � ������ ����� ����� ��� ������NSI � ������ ������ .NSI (Direct result) �� ������- 13.4 ������ ����� ��� ������� .���������� �� ��� )Indirect
result( � ����- 34.3 ������ ����, ������� ���� ��� � ���� ����� ( ���� �� �� �����) �� ���� � ����� ����� �����(Swap). ��� � ������� ������ ��NSI ��������� ����
.�������
2.3 ��� �"� � ���� ���� � ���
� � ��� ��� ������ ��� �� � ������- 12 �"� � �� � ����� ����� � ���� �" ������ ���� ����Dietikon .�����
2.4 ������� ���� ���� � ���
� � ��� ��� ������ ��� �� � ������- 3.2 ����� ����� � ���� �" ������ � �����
�� ������ .������ ������ ����� �9 .������� ���� � ������ �
2.5 ������ ������������� ,
�� � ������ ������������ ����� ����������� �� ��� ����� �- 8 ������ �" ������ . ���������� ���� ������ ����� ��� ��� ������� ������ ������ ������ �������
������� ������ � � ��� ����� ������ � �� � ������ �����- 5 �" ������. ������ ������ ,������ ����� ��� �������� ��� ������ ������ ���� � ��� ������
������� ����� ����� ��� ����� ���� ������.��� ��� ����� ���� ������ ���� ���� �� ��� .����� ����� ������ � ����� ����� �����
3. (����) ����� ����
���� � � ��� �� � ������ ����� ���� �����- 21 ����� ��� �" ������ ���� ����� ����� ���� ������ ������� � ��� ���� ����� ����� ����� ��� ������� ������ .- 2 ��� �" ������
���� ��� ���� ����� ����� �����.��� ������ �� ����� �� � ������ ����� ���� ��- 63 � .�" ������- 49 ������ ������� �� ���� �" ������
�� ����� �- 14 ������� ������� �" ������.���� ���� ���

4
.� ������, ���� ������ ������� ������
�� � ������ � �� ���� �����- 14 ������ " �� ������� ����� �� ������� ������ .����2012 �� ��� �� �����- 16 ������ �"�������� ����� .
������ ���� � � ��� ����� �� ��� �� ������ ������ �� ����- 2.5 �" ������ � ����� �������� ������� ���� Yoo Tel Aviv � � ���- 3 �" ������. � � ��� ����� ����� ������� ��� , ��- 13
� � ��� ������� ���� ������ ����� ,�" ������- 5.5 �" ������� � ��� ������ ����� ����� ����� ��������".
� � ������ �� ��� ����2012 ��� ����� �� ��� �� ������ ������ �� ���� ������ ����
� �- 7 �� ������� ���� ����� ��������� �" ����Yoo Tel Aviv � � ���- 4 �� ��� , �� .�" ���� �������� � ��� ����� �����- 13 ��� � ��� ������� ���� ������ ����� ,�" ����- 7 �� �" ����
� � ��� ������ ����� ����� ������- 5 �� .�" ����
���� ������� ��� ������� ����� � ����� �� �����- 8 ������ "� ����� �- 2 �������" ��� ���� ������� ������� ������� �2012. �� � ������ ���������� ����� ��� ���� ����� �����
� � ���- 9 � � � ���) �" ������- 30 � ��� ����� ���� �" ���������� � �� ����� LtSV ���� , �30 � � ����� ����� ������ ������ ����� ����� �" ������- 8 �" ������ ������ �� �� ����
���� ���� ���� (�����. � � ������ �� ��� ����2012 ������� ��� ����������� ��� � ��� ����� ���� ������
���� � �� ����� LtSV � � ��� ,- 11 �� �" ����� ��� ������ ����� ����� �"� ��� ������ ��� �� ����� ������- 10 ��.�" ����
�� � ������� ���� �����- 3 ������ " �� ����������� �� ����� ������� ����� �������� ������, �����53 ��� ������� ������ �" ������ � ����� ��� ����� �� �) ��� �����4( � � ���- 55 ������
�".
3. ����� ����� ��� ������ ����NSI
�� � ���� � ���� ����� ����� ��� ������ ��� ����� �� �� �� ���� ���� ����� ������ ����� ���� ����� ����� �� �8 �������� ���� ) ��� ����� ����� ���� ���� (� �"1970 .���� ����� ������
�� � ����� ����:
��� ������ ���� ����� ������NSI ����� ����� ���� 31.3.2013 ��� �� ������, ���� ������ ��� ��� ����
,������� ��� ����� ,�������� ������� ���� ������ ����� ���� ��� �� ������� ��� ��
����
132.6 ������ ���� ,��� ��� � 618.1 ������ �"
��� �� ������ ��� ����� ������ 132.6 ������ � ��� ��� ,���� 618.1 ������ �" ����� ������ ������� � ���� � ������ ���� � � �� �����Professor Israel Shaked.
Professor Shaked��� ����� ���� ���The Michael-Shaked Group ������ ,����� ,����� ��� � ����� ������ ���������� �- 30 � ����� .
� ���� ������ ������ ,�������� ���� ���� �� , ,��� ���� �� ���� ��� ����� ������� ������ �� ���� ������ ,�������� ������ ��� ������-
Securities Exchange Commission (SEC), the Internal Revenue Service (IRS), the Federal Deposit Insurance Corporation (FDIC), the Department of Labor (DOL), and the Pension Benefit Guarantee
Corporation (PBGC) .Professor Shaked ���� �������� �� ����� ������ �� �����- Boston University School of Management ���� ��� ���� ����� .
.����� � � �� ����� �������� ���� ������ ��� �� ��� ����� � �� ����� ���� ��� �- NAV ������� ������ ���� ���� � ���� ���� ��������
����� ����� ���� ����� ���� �� ������ ,����� � ��� ������� ������
�� ����� ������� ������ ���� ������� ��� �������
� ����� ��� ���� ��� ����� �� �� ������- Dietikon ��� ������ ��� ����� �� �� �� ���� ,�����
���� ��� ,������� ���� � ���� � ���� ����� �����3 .����� ���� ����� ��� ��� ��

5
4. ������ ����� ��� ������� ����
.� ����� ��� ������ ������ ������ ������NSI ����
���� ����� ������� � ��� ��� ,���� ��� ,����� ���� ����� ����� �� �����NSI ���� ��� ,������1.1 ����� ����1.������� ���� � �
. ������� ������ �������
����� ������� ����� ������� ���� ��� ����� �"��� ������ � ������� ,������� ������ ����� ,����� ������ ������� ������ ���� ���� ������ ������ �� ��� .������ ����� ���
�� ������ ����� ������ ��� ,������� ������ ������ �� �������� ����� ���� ����� .����� � �� �������� �"� � .������� �"� � ����� � �� ��� ����� � �� �� ������� ������� ������� ����
� ������� ����� ������� ,���� ��� ,���� ����� �� �� ������ ���� ,����� ����� ����� ����� ,���� .���� ���� ���� ������ ����� ,���������� �� ���� �� ������� ����� ����� � ��
��� ���� ��� ,����� ����� ������ ,�� �� � � �� ������ ������ ������ ���� ����� � .���� � ������ ������������ � �� ������ �����.����� � � � ������� ����� � ����� ,���� � ����� ���� ���
����� ����� ���� ������� ����� ����� � ��������� �� ���� ������ ����� ,���� �� ,���� ���.����� �������� � ����� ���� ����
�. ��������� ���� ������
��� ��� ����� ����� ������ ������� ��� ��� ������� �� � ����) �����48% ��� �����
�� ����� ���� ����� ��� ���� ���31 ���� 2013 �������� ����� ����� ����� ,�� ����� ��� .( . ���� ������ � �������� �� ����� ����� ����� �����
����� ��� ,������ ����� �� ��� ������ ������� ������ ������� ������ ���� ��� ������ ������� ������� �� ��� .� ��� ��������� ����� �� ������������� ���� �� �� ����� ����� ������
���� ����� ������ ������ � ����� ���� �� . �. ���� ��� ������
������� ������� �� ��� ��� ��� ��� ������ ����� ��� �"��� ������ ������ . �� �� ������ ����� � ���� .������ �� ���� ������ ���� ���� �� ��� ��������34% ���� ������ �� ����� ����� ���
���� ����� ��� ������31 ���� 2013 � ����� ����� ���14% ���� ������ �� ����� ����� ��� ���� ����� ��� ������31 ���� 2013 ��������� ���� .���� ������ ������ ������� ������� ,���
,����� ����� � ������� ���� ������ ����� ������ ������ �� ��� ������� ����� ����� . ����� � ��� ��� ����� ����� �� ���� ��� ������ � ������������ ����� ������ ���� ����� ���� ��
������ ����� � ������� ���� ������ ����� �� ��� ����� ����� ,���� .(��� ������ � ����� ���) �� ��� ����� ���� ����� ��� ����� �� �� ����� ������ .����� ������ ������� ������� �����
,����� ������ ������� ��������� ���� 8 �� ��� ������� ���� ��� 27 ������� ���� � ����� ��2012.
����� ����� ,��� ����� ����� ������ ���� � ����� ����, ���� �� ���� ����� �� ������ ����
������ �������- �� ��������� � �� � ����� ����� ��� ���2012.
6
5. ("� ����) ����� ���� ��
���� 31 ��� 2013��� ��������� �� ������ ��
�������� ���
�� ������������ ��������
���������
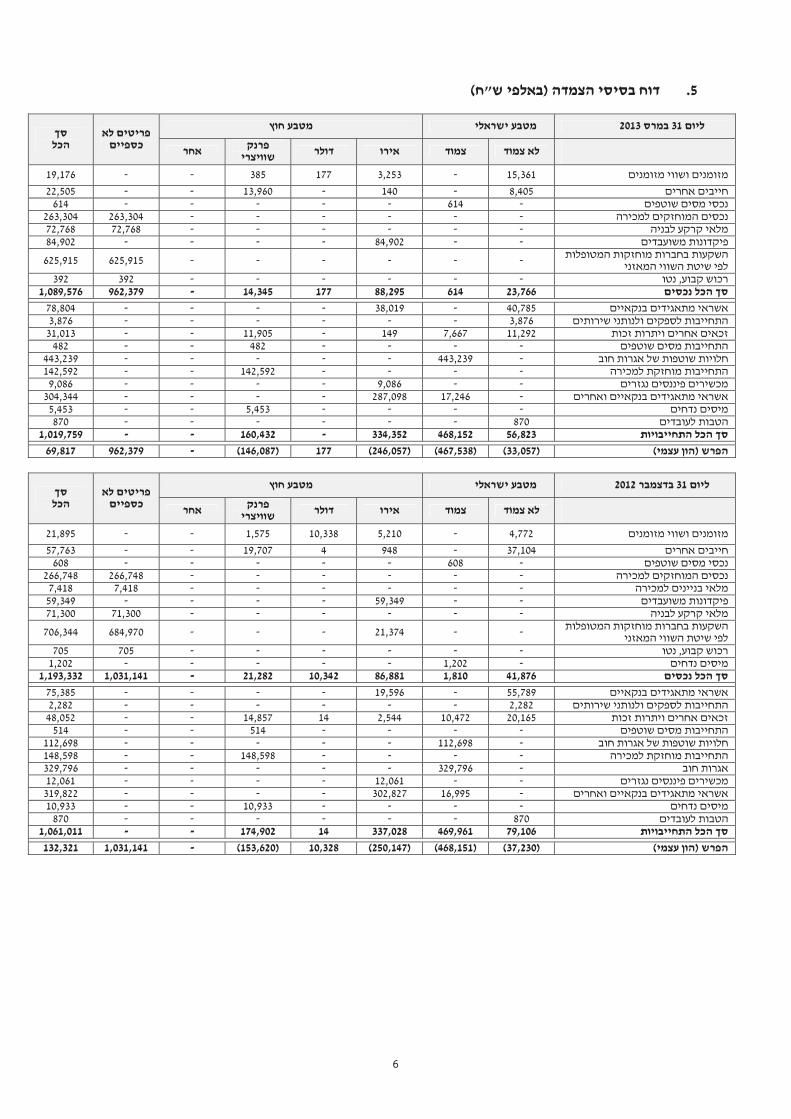
������ ���� ������15,361 -3,253 177385--19,176
������ ����� 8,405-140-13,960--22,505��� ���� ����� - 614 - - - - - 614
���� �������� ������ - - - - - - 263,304 263,304 ���� ���� ����------72,76872,768
��� ��� �� ���� - - 84,902 - - - - 84,902 ����� ������ ������� ��������
����� ���� ��� ��� --- ---625,915625,915
��� ���� ,��------392392�� ��� �����23,76661488,29517714,345-962,3791,089,576
���� �� ����� ������40,785-38,019----78,804 �������� ������ ����� ������ 3,876------3,876
����� ���� ������ ����� 11,2927,667149-11,905--31,013�������� ���� ����� - - - - 482 - - 482
������ ����� � ����� ��� - 443,239 - - - - - 443,239 �������� ������ ������ - - - - 142,592 - - 142,592
����� ����� ������ - - 9,086 - - - - 9,086 ���� �� ����� ������ ������ -17,246287,098 ----304,344����� ��� ----5,453--5,453����� �� ���� 870------870
�� ��� �������� 56,823468,152334,352-160,432--1,019,759
���� ��)����( )33,057()467,538()246,057(177)146,087(-962,37969,817
���� 31 ���� 2012��� ��������� �� ������ ��
�������� ���
�� ������������ ��������
���������
������ ���� ������4,772 -5,210 10,3381,575--21,895
������ ����� 37,104-948419,707--57,763��� ���� ����� - 608 - - - - - 608
���� �������� ������ - - - - - - 266,748 266,748 ���� ����� ������ - - - - - - 7,418 7,418
��� ��� �� ���� - - 59,349 - - - - 59,349 ���� ���� ����------71,30071,300
����� ������ ������� ������������� ���� ��� ���
--21,374 ---684,970706,344
��� ���� ,��------705705����� ��� -1,202-----1,202
�� ��� �����41,8761,81086,88110,34221,282-1,031,1411,193,332
���� �� ����� ������55,789-19,596----75,385 �������� ������ ����� ������ 2,282------2,282
����� ���� ������ ����� 20,16510,4722,5441414,857--48,052�������� ���� ����� - - - - 514 - - 514
������ ����� � ����� ��� - 112,698 - - - - - 112,698 �������� ������ ������ - - - - 148,598 - - 148,598
����� ��� - 329,796 - - - - - 329,796 ������ ����� ����� - - 12,061 - - - - 12,061
���� �� ����� ������ ������ -16,995302,827 ----319,822����� ��� ----10,933--10,933����� �� ���� 870------870
�� ��� �������� 79,106469,961337,02814174,902--1,061,011
���� ��)����( )37,230()468,151()250,147(10,328)153,620(-1,031,141132,321

7
6. :������ ���
.� ���� ������ �������� ������ ����� ���31 ��� 2013: 1. ����) ����� � ������� ��� ������ ����� ����"(�
��������� (����) ��� ��� ���� ��������� (����) ��� � �����
10% ��� � �������
�����
� ����� 5% ���
� ������������
4.6612
� � ���5% ���
� ������������
� � ���10% ���
� ������������
������ 325 163 3,253 )163( )325( *������ ������ �� ����� ���������� )31,719( )15,859( )317,185( 15,859 31,719
��� �� )31,393( )15,697( )313,932( 15,697 31,393 ����� ����� ��� ���������� ������ ��� ������ �� ������� ����� �� ��� ������ �� ����� ����������� � ����� ����� *
���� ������ ��������� ������31 ���� 2013. 2. ���� � ������� ��� ������ ����� ���� ����) �������"(�
��������� (����) ��� ��� ���� ��������� (����) ��� � �����
10% ��� � �������
�����������
� ����� 5% ���
� ������� ����
�������
3.8247
� � ���5% ���
� ������� ����
�������
� � ���10% ���
� ������� ����
������� ������ 39 19 385 )19( )39(
������ �� ����� ���������� )14,222( )7,111( )142,218( 7,111 14,222 ��� �� )14,183( )7,092( )141,833( 7,092 14,183
������ �� ������� ����� �� ��� ������ �� ����� ����������� � ����� ����� * ����� ����� ��� ���������� ������ ������� ������ ��������� ������ 31 ���� 2013.
3. ����) ����� ������ ������ ������ ����� ����"(�
��������� (����) ��� ��� ���� ��������� (����) ���
� �����10% ������
� �����5% ������
� � ���5% ������
� � ���10% ������
������ ������ �� ����� ���������� 170 85 43,031 )86( )173( ����� ����� ��� ���������� ������ ��� ������ �� ������� ����� �� ��� ������ �� ����� ����������� � ����� ����� *
���� ������ ��������� ������31 ���� 2013 4. ����) ������� ������ ����� ������ ������ ����� ����"(�
��������� (����) ��� ��� ���� ��������� (����) ���
� �����10% ������
� �����5% ������
� � ���5% ������
� � ���10% ������
������ �� ����� ���������� 880 440 142,218 )440( )884( ����� ����� ��� ���������� ������ ��� ������ �� ������� ����� �� ��� ������ �� ����� ����������� � ����� ����� *
���� ������ ��������� ������31 ���� 2013. 5. ����) �������� ����� ������ ������ ����� ����"(�
��������� (����) ��� ��� ���� ��������� (����) ���
� �����10% ������
� �����5% ������
� � ���5% ������
� � ���10% ������
������ ������ �� ����� ���������� 5,886 2,966 317,185 )3,024( )6,106( ����� ����� ��� ���������� ������ ��� ������ �� ������� ����� �� ��� ������ �� ����� ����������� � ����� ����� *
���� ������ ��������� ������31 ���� 2013. 6. ����) (��� ����� ����) ������ ������ ������ ����� ����"(�
(����) ������������ ��� ���� ��������� (����) ���
� �����10% ������
� �����5% ������
� � ���5% ������
� � ���10% ������
��� ����� 1,799 917 206,664 )917( )1,834( ���� ���� ����� � ������� ���� ��� ����� ���� *31 ���� 2013.
8
. ����� ��� ���� ������ �������� ������31 ����2012: 1. ����) ����� � ������� ��� ������ ����� ����"(�
��������� (����) ��� ��� ���� ��������� (����) ��� � �����
10% ��� � �������
�����
� ����� 5% ���
� ������������
4.9206
� � ���5% ���
� ������������
� � ���10% ���
� ������������
������ 270 135 2,702 )135( )270( *������ ������ �� ����� ���������� )33,429( )16,715( )334,291( 16,715 33,429
��� �� )33,159( )16,579( )331,589( 16,579 33,159 ����� ����� ��� ���������� ������ ��� ������ �� ������� ����� �� ��� ������ �� ����� ����������� � ����� ����� *
���� ������ ��������� ������31 ����� 2012. 2. ����) ������� ���� � ������� ��� ������ ����� ����"(�
(����) ������������ ��� ���� ��������� (����) ��� � �����
10% ��� � �������
�����������
� ����� 5% ���
� ������� ����
�������
4.0766
� � ���5% ���
� ������� ����
�������
� � ���10% ���
� ������� ����
������� ������ 158 79 1,575 )79( )158(
������ �� ����� ���������� )15,364( )7,682( )153,643( 7,682 15,364 ��� �� )15,206( )7,603( )152,068( 7,603 15,206
������ �� ������� ����� �� ��� ������ �� ����� ����������� � ����� ����� * ����� ����� ��� ���������� ������ ������� ������ ��������� ������ 31 ����� 2012.
3. ����) ����� ������ ������ ������ ����� ����"(�
��������� (����) ��� ��� ���� ��������� (����) ���
� �����10% ������
� �����5% ������
� � ���5% ������
� � ���10% ������
������ ������ �� ����� ���������� 191 96 72,784 )97( )194( ����� ����� ��� ���������� ������ ��� ������ �� ������� ����� �� ��� ������ �� ����� ����������� � ����� ����� *
���� ������ ��������� ������31 ���� �2012 4. ����) ������� ������ ����� ������ ������ ����� ����"(�
��������� (����) ��� ��� ���� ��������� (����) ���
� �����10% ������
� �����5% ������
� � ���5% ������
� � ���10% ������
������ �� ����� ���������� 913 461 153,643 )461( )921( ����� ����� ��� ���������� ������ ��� ������ �� ������� ����� �� ��� ������ �� ����� ����������� � ����� ����� *
���� ������ ��������� ������31 ����� 2012. 5. ����) �������� ����� ������ ������ ����� ����"(�
��������� (����) ��� ��� ���� ��������� (����) ���
� �����10% ������
� �����5% ������
� � ���5% ������
� � ���10% ������
������ ������ �� ����� ���������� 6,403 3,234 334,304 )3,286( )6,638( ����� ����� ��� ���������� ������ ��� ������ �� ������� ����� �� ��� ������ �� ����� ����������� � ����� ����� *
���� ������ ��������� ������31 ����� 2012. 6. ����) (��� ����� ����) ������ ������ ������ ����� ����"(�
(����) ������������ ��� ���� ��������� (����) ���
� �����10% ������
� �����5% ������
� � ���5% ������
� � ���10% ������
��� ����� 3,164 1,613 363,495 )1,613( )3,226( ���� ���� ����� � ������� ���� ��� ����� ���� *31 ���� �2012.

9
7. ���������������������
��������� �������������� ������������������� .������������������ � ������� � �������� ���������� � ,������������� � ��������������� ��������� �, ���� ��� ��� ��� ��� ����� ��������� � ����� ��� �� ���� ��� ��� .��� �����,�������������� �� ����� ������
��/� ����� �"�����"� ������� ����� � ��� ���� �� ������� ������������������ � ������� ���������������� �� ," :�� ����� ����) ����� � ������� ���� � ����� � ��� .� ��� ,("
�� ���� �� ���� ������ .����� �� � ����� ������ ���� ���� ���� ����� ,��������� � � � ������ ����� ,����� � ����� ����� ���� ����� ,����� �� � ����� ����� ���� ��� ��� ,� ���
.����� �� � ��� ��������� � ������ �� � ���
.����� � ������� � �� ��� ,� ����� �:�� � ��� ���� .������ ���� �������� ��� � ��� ���� ���� ���� ��- .� ��� �"��� ����� ������
����� �� ���� ��- .����� ������ ���� ���� ��- .������
������ ������ ������� ���� ��� � ��� ���� �� ��� ��� �� �� �������3 ����) ������ �����
� ������ ������� ��� ������ � ������ �"��� ,(������� ����� ��� ������ �� �����- 2005 ������ . ������ ����� ,���������� ����� �� ����� ����� ��� �� ����� � ������� �� �2012 ������ .
������ ���� ������ ����� ��� ������ ����� ,������� ��� � ����� ����� ��� ���� ,���� �" �������� ���� ���� ���� ���� .������� ������ �� ������ ������ ���� ���� ����� ,����� ������
������ ,��������� � ���� ���� ,� ��� � ����� ������ �������� ,��� ������ �������� ���������� �������� � .���� � ������ ������ ����� ������� �������� ���� ������ �������� �
�������� �������������� ���������� �������������� ���� � ������� .������� � ����� ,��������������������� �������� .�� ������ ���� ��� ��������� � ���� ���� ��������
.������ ������ �� � ���� ���� ������31 ����2013 :���� ������ ����� ��� ���� ���
.� " :����) ������� ���� � ����� � ��� ����� ��� ���� ("23 ���� 2013 ����� ���� ��� ��� �� ,
����� �� � �����, ��� ��� �� ����� � ������� ����� �� ,� ��� ���� � ���� ���� ��� ����� .����� � ����� ����� ���� ,����� �� ���� ��� ���� ���� �� ,���� ���� ,����� ����� ������
� �����, ���� ��� "���- ,� ���� �"�� ���� ����� .����� ������� ����� ����� ,���� ���,��������� � �"�� ,��� ���� �� �� ����� ,������ ,��� ���� �� �� ,����� �"�� ,����� ��� ��
���� ����� �� ������ �� ,����� �� ,���� �� ��� ����� � ������ �"��� ,����� ��� ������� �� ,���� ��� ,� ��� ��� ����� ����� .���� � � �� ����� ��� �� �� ����
������� ����� ��� ������ ������ ��� ���� � ������ ���� �� ,������� ���� � �������� � ������ ����� �������� . ���� �� ����� �� �� �� ����� ���� � � �� � ��� �� �� ,�� ���
,������ ����� � ���������� ����� �� ��� � � ��� � ������� �� � ������ ����� ��� ��2012. �� � �� ��� ����� ��������� � ����� � ��� ���� ����� ������ ������� .
���� ��������� � ����� ���� ������ ������23 ���� 2013.
.� ����� ��������� ������� ������� ��� 27 ���� 2013 , ������� ��������� � ,���� ��� ,�����.� ��� ������� ����� ���� ,��������� � ���� ��� ����� ���� ���� ����� � �����
��������� � �� ���� � ��� ����� �� ���� ����� ��������� ����� ����� ���� .������� � � ����� ������2013.
10
8. ��� ������� �����
����� �� ������ ����� �� � ����� ������ ����� ����� � ������ �� � ��������� � ������� ��� �� ���� �����12 �- 4 ������� ��� �� ��� �������2013 ���� ��� ,1 ��� ���� ����1 ���� � ������ �
�������.
� ����� � ����� ������� ����� ����������� ���� ,����� � ("����") ��� ����� � ��� �� ������ ���� �������9�"�� ,(��� ���� �������� ���� ) ��� ����� ����� �-1970 .
������� ������ � ����� ����� .� :����� ������� ����� ���� ����� ������� ����� �� �� ����� ��������� ����� � ������ ��� ���� ����� ��� ����� �� � ���� ��� .� .�� ���� ����� ��� �� �
���� ����� ������ ����� �� ����� ���� ����� .� .��� ����� �� ����� ����,���� ��� , ���� �� ������ ����� ���� ����� ������ ����� �� �� ����� , ����� ������ ���� ������� ���� ������� .
����� �� ���� ������ ����� ����� � ������ �� � ���� �� � �� �������� ����� ��� ��������� ���� ����� ������ ����� �� �� �����, ��� ��������� ��� ����� ��������� ������� �����
.������ � ��� ������� �� ����� ����� ���� ����� �� � ,����������� ��� ������� �� � ����� ����� ��� ������� ����� ����������� ������� ����� ��� ���������� �� ��� ��� �� ,��� ���
��� ������ �������� ��� ��� ������� ������� ������ ����� ����� ,����� . ����� ��� �� ����� ��� ��� ���� ����� � ��� ������� ��� ����� ����� �� ����� �� ����� ���� ���� ��� ��� ��� ������� ��
.��� �������� �������� �����
1 ������2013 �
31 ���� 4201
1 ������2014 �
31 ���� 5201
�����
���� ����
14,703
)51,078(
)1(
���� ������
����� ������� ������� ����� - - ���� ������� ������� ����� - -
����� ������� ������� ����� - -
������ ���� ������
�������� ���� �������- ��� - 48,529 )2( �������� ���� �������- ������ ���� 6,560 59,905 )3(
�������� ����� �������- ������ ���� - - �������� ���� �������- ������ ���� 73,887 23,490 )4(
(������ �������) ������ ��������
��� ������
)11,843(
)9,726(
���� ������� ������� �����
��� ����� ������ ����� )134,385( )128,466( )5( ������ ������� ������ ����� - -
���������� ������� �������
�������� ���� �������- ������ ��� - -
����� ����
)51,078(
)56,896(
)1( ���� ����� � ������� ����31 ����2013. )2( ������� �� ����� ������� ���� � ,�"�� ���� �� ������� ����� � � �� ���� �� ������
�� .����� � �� ����.����� �"�� ���� ��� ��� ����� �� ����� ����� ����� ���� �������� ������ ���� � ����� � � �� ����"�� ���� ��.
)3(� ���� ������: (�) ����� ���� ���� �� �������� ��� -N.V. NSI ���� ���- NSI �� �� ����50% .����� ���� �� , ��� � ������ ������ ���������20.54% �����N.V. NSI
������ � � �� �Habas Tulip B.V � ���� ������ �� ����Habas Star B.V. (�) . ������ ��� ����� ��� ������ ��� ����� ����� ��� ������1 . �������� �� ����� ������ ���� (�) :

11
���� ����� � �� ���� �"�� ���� ���� ������� ����� ��� (�) .������ ���� �� ��������� ��� - NSI N.V. �� �� ���� ���� ��� ,100% �� , ��� � ������ ������ ���������
.����� ���� )4(� ��������� � � ��� ����� ��� (�) : ������ �������� ����� ������ ���� �������- ��
���� (�� �� ���) ������� ��� ���� ��� ������� ���� � ��� ������� ���� ��������Dietikon �� �� �� �� � � �� ����� ���� ��� ������� ���� � ��� ������� ���� �������� �� ;�����
) ������1997) �"�� (�� :��" �� ������,(" � ����� ������� �� ����100% �� .����� � � �� � � �� ����� ����� ��������Habas Swiss Investments A.G. � ���� ������ �� ����Habas
Star B.V. (�) .� ������ ����) ������ ����� ������ ������ �����Mainstreet � � �� �������� (HRGI I B.V. �- HRGI II B.V. � ���� ������ �����Habas Star B.V. �� ���� ��� ���� (�) .
���� ���������� ����� ���� �����N.V. NSI ���� ����� ���� ��)����� ��- 6 (���� .����� � : (�) ���� ���� �� ���� ��� ����� ������ ���� ���� �����NSI N.V. ��)
���� ����� ���� �����- 7 (����(�) . � ������ ���� ���� ����� ������ ������ �����) ������Mainstreet(.
���� ����� ����NSI N.V. � ������ �����- Euronext ����� �� ������ ���� ,� ������.����� � ����� �������
)5( ,����� ����� ��� ���� ����� �� ���� ������ ����� ����� � ������ �� � ���� � ��� ������ ���� �� ,����� ���� ����� ������ ����� �� �� ����� ������������
��������� ������� ,����� .������ � ��� ������� �� ����� ����� ���� ����� ������ ����� �������� � ������ �������� ��� ���� ����� ����� ��� ,����� .������� ������ ����� �����
��� .��� �������� �������� ����� ��� ������� �� ��� ��� ���� ����� �� ����� ��� �� ����� �� ����1.1 ����� ����16 ���� � ������������ ��2012.
� �� ���� � ��� ���� ������� ����� ����-
-.��� ��� (���� ������) ����� ����� �� ������ ������ �������� - ������� ����� ����� ��� ���� ������� � ������� ���� ������ ���� ��� ������
.(������ ��� ;����) -.����� ������� �� ������ ���� ��� ������ - ����� ����� ��.����� ������� ������ ��� ����� ��
, ��� �� ���� � �� ������ ������ �������� ����� ,�� ������ ����� ,����� ������� ����� �"��� ,��� ����� ���� ��� ���- 1968 .� �� ������� ,��� ���� ������ �� ,������ ����� ����
������ ������� �� � ��� � � �� ����� ,������� �� ����������� ����������� ���� ,������� ������� ������ � � ����� �������������� ������ ��� ����� , ���� � ����� �� ������������� ������� ����� ,�� ��� . ������� ������ ,������ �� ����) ����� ������ �� �����
��� � ��� ��� ������ ��� ����� ������ �� ����� ����� �� ������� ����� ������ ���� (�� �� ����� ,����� �� ���� �� ����� ��� ����� � �� �� ����� ��� .�� ���� ����� ������ �� ����� ,�� ��� .����� � � �� ��� ��� ����� ����� �� ����� ����� �� ,��� �����
����� ���� ����� ��� ,�� ����� ����� ����� ����� �� ����� � �� ���� ����� ������� ������ ������ ����� ��� ������ ���� �� ��/� ������ ������ ,���� ��� ,������ �� ������ �� �����
.��� ��� ����� ���� � � �� ����� ��� ,���� � ��� ���
���� ��� ,��������� � �"�� ����� ��� �"�� ,
27 ���� 3201 ������ �����

��������������������� ������� ��������

) ������ �1960�"� (
����������� ���� �����������
� ���31 ���2013
(������ ���)
) ����� ���1960 (����� ������
����� ���� ����� ������ ����31 ���2013 (������ ���)
�������� ���
����� ���� � ����� �� 2
����� ������ ��������� ���� ������31 ���2013 (������ ���):
���� ����� ����� ���� �� ���� ����� 3
������� �� ���� ����� ����� ����� �� 4
������� �� ���� ������ �� ���� ����� 5
������� ��������� ������ �� ���� ����� 7
� ������� ����� ���� ������� �� ���� ����� 9

������ ��� ����� 8000 684 03 ������ �� KPMG �������� 8444 684 03 ������ ����17 ���� �� ,609 ����� www.kpmg.co.il
���� ��61006
���� ����� ������� ������ ,������ ���KPMG ��
� ��� ��� ������ �����- KPMG International Cooperative ,(“KPMG International”) .�������� ����
2
) ������ � �� ������ ���� ������ ��� ���� �� ����� ��1960� ("� ����
���� �� � ��� ����� ������ ) ����� ��� �1960�� (" ����) �� ��� ������ �- �� ����� ,(������ ���� ����� ����� ����� ���� �� �� � �����31 ����2013 �� ����� ����� ��������� ���� � ��� ��
������� ���� ����� ,����� ����� ������� � ������ ��� �� �� ������� ����� �����. ��������� ������� ������ ������ ������ � � �� ����� �� ����� ������ ���� ������� ������ ����IAS 34
������� ���� ���� " ����� ���� � ' ��� ��� �� ����� ������ ���� � �� ������ ������ �� ��� ,"������"�� ,(��� ���� �������� ���� ) ���-1970. ������� ��� ����� ���� �� � �� ���� ������ ����� ��
�� ������ ������. � ��� �� ���� �� ����� ����� � ����� ������ ������� � ������ ����� ������� ����� �� � ���-
8% ���� �� ����� ����� ����31 ����2013 ���� ����� ���� ����� ����� ������� ��������� ,����� � ��� �� ���� �� ,�� ��� .����� ����� ������� �� �� ��� � ������ �� ����� ������
������� � ������ ������� ��� ��� ����� �� ����� ���� ��� ��� �������� ������� �����- 28,946 ���� �" ����31 ����2013 � ��� �������� ������ � �����- 706 ��� � ������ �" ����
����� ����� ������� �� ��. � ��� ����� ������������� ������ � ���� ����� � � �� ��� ���� ���� ����� ���� ������ ��� ������ �� ��� ,������ ��� ������� ������� ���� ���� ����
,����� ������ ���� �� ������ � ���� ����� ������. ���� ������ ���� �� ������ ����� ���� ����� 1 � ��� ���� ����� ���� �����" � � �� ���� ������� �����
����� �� � � ����� ���� ����� � ."����� ����� � � �� ���� ������� ������ ����� ,�������� ����� �� ��� ������� ������ ,��������� ������� ������ ��� ����� ������� ������. ����� ���
������� ������ � ��� ���� ��� ������ ����� ����� ��������� � ������� ����� ������ ��� ����� �� ���� � ��� ������ ��� ������ ��������� ��� ������ ����� ������� ������. ����� ,���
��� �� ������ ���� �� � ������. ����
������ �� ������ ��� ���� ������ � ���� ���� ,����� �� ����� �� ���� �� ����� �� ����� � ��� ����� �"� ,���� ��� ��� ,�������� ������ ������� ������ ���� �����IAS 34.
����� �� �� ,����� ���� ���� � ������ ���� ��� ������ �� ������ ,�� ��� ������ ����� ������� ��� �"� ����� � ��� ����� �� ����� �� ���� ' ��� ��� ������ ������ ��� ,�������� ������ ��� ,��"�� ,(��� ���� �������� ���� ) ��� ����� ���� �- 1970.
�� ����� ��������� :����� ��� ���� �� ���� �� ,�"�
.� ����� �����1 � ����� ������ ���� ������ � ������ �� � �������� ����� �� � ����� ����� ��� �� ���� ����� � ������� ���� ����� �� � ����� ������12 �- 4 ��� �� ��� �������
�������2013 �������� ����� ������� ,�"� ����� �������� ����� ������ �� �� ,��� ������ .�� �� ���� �� ������� ���� � ."�� ���"� ����� � ����� ��� �� � ����� ���� ���� ,����
."�� ���"� ������ ����� ���� �� ����� �� ���� ������ ���� ,������� ����� � ������������
.� ����� �����5 ����� ������ ���� ������ ����� ������ ���� �� �NSI ��� ������� ������ ���� ,� ����� � ���� ����� ,����� ���� ��� ���NSI .������ �� �������� ������� �� � ������ ������
.� �������� �����7� �-7 ������ ����� ����� � ���� ������ �� � ����� ������ ���� ������ �
.�������� �������
�� ����,
������ ���� ���� ����
27 ����2013
) ����� ���1960 (����� ������
���� ���� ����� ����� ��� �� ���� �����
31��� 31��� 31 ���� 2013 2012 2012
"� ���� ��� (���� ���) (���� ���) (����)
������ �����
������ ���� ������ 19,176 182,149 21,895
����������� 22,505 37,572 57,763 ����� ���� ��� 614 2,641 608
������ ����� ���� - 17,945 7,418 ������ �������� ���� 263,304 101,994 266,748
������ ����� ��� �� 305,599 342,301 354,432
���� ���� ���� 72,768 65,360 71,300
��� ���� ��� � 84,902 - 59,349
���� ���� ����� ����� - 4,097 -
������� ������ �������������
����� ���� ��� ��� 5 625,915 897,728 706,344
��� �"� - 554,947 -
���� ��� 392 1,210 705
������ ���� - 2,227 1,202
������ ��� ����� ��� �� 783,977 1,525,569 838,900
����� ��� �� 1,089,576 1,867,870 1,193,332
���� ��� ����� ��� ����� ��
��������� � �"�� ���� ��� �"��� �����
:������� ���� � ���� �����27 ����2013 �.��� �� ���� ��� ������ �� ���� ����� ������� ���� ������ �������� ������
3
) ����� ���1960 (����� ������
���� ���� ����� ����� ��� �� ���� �����
31��� 31��� 31 ���� 2013 2012 2012
"� ���� ��� (���� ���) (���� ���) (����)
������ ��������
������ �� ����� ���������� 78,804 9,195 75,385
������ ����� ������ ���������� 3,876 4,905 2,282 ����� ��������� ������ 31,013 74,914 48,052
������������� ���� 482 4,904 514 ����� ������ - 2,228 -
��� ����� 9� 443,239 142,363 112,698 ����������������� ���� ���� ������ 142,592 40,381 148,598
������ �������� ��� �� 700,006 278,890 387,529
���������� ��������
��� ����� 9� - 434,389 329,796 ����� ������ 9,086 44,414 12,061
����������� �� ���� ������ 304,344 708,183 319,822 ����������� ���� 5,453 12,264 10,933
�� ���� ����� 870 901 870 �� ���� �������� ��� ������ 319,753 1,200,151 673,482
�������� ��� �� 1,019,759 1,479,041 1,061,011
��
���� ��� 40,618 40,618 40,618
���� �� ����� 309,558 309,558 309,558 ���� )54,970( )32,802( )38,247( ������ ��� )318,397( )96,548( )286,028(
�� ��� �� ( �� ����) �� ����� ����� ��� )23,191( 220,826 25,901
����� ����� ���� ������ 93,008 168,003 106,420
��� �� �� 69,817 388,829 132,321
�� �������� ��� �� � 1,089,576 1,867,870 1,193,332
4
) ����� ���1960 (����� ������
��������� ����� ���� �� ���� �����
��� �������� ����� ����� �� ������ ��� �������� ����
31��� 31��� 31 ���� 2013 2012 2012
"� ����(���� ���) (���� ���) (����)
������ ������ ����� �� � ����� 2,773 8,128 28,532
���� ������ ����� 12,485 4,076 20,516 ������ ���� ����� 86 108 339
���� ������ ������ ���� 49 775 775 ����� ������ ����� ��������� ������� ������ ����
�������� ���� - - 6,543 ����� ����� - 249 240
��� �"� � ���� ���� ���� - - 1,025 ����� ����� ����� ���� - 14,583 14,583
��� ���� - - 20 15,393 27,919 72,573
������ ������ ��� ��
������ �� �������� �"� � �� 264 1,222 3,935
���� ��� ���� 7,924 2,891 14,048 ������� ���� ������ 5,461 6,694 23,542
��� �������� ������� ����� � ���� ����� ��� ����� ���� ��� 20,866 15,940 104,187
��� �"� ������ ��� - - 12,230 ���� ������ ��� � ��� - - 2,523
��� �"� � ���� ���� � ��� 11,892 - 1,569 ������� ������ ���� ��� � ��� 3,189 - 110,293
����� ����� )5,023( )1,209( )14,186( ����� ������ 16,232 17,372 83,989
������ ��� �� 60,805 42,910 342,130
����� �� ���� ���� ���� )45,412( )14,991( )269,557( ) �����������( ����� �� ���� 3,791 )578( 4,858
������ ���� )41,621( )15,569( )264,699(
�� ���� ��� �� ���� ����������� ���� ����� ���
� ������� �������� ���� ��� ���� ���� )22,598( 3,817 )93( � ����� ���� ���� � �������� ����
������ ������ �� �� 1,715 )1,440( )4,908(
��� (����) ������ �� ���� )20,883( 2,377 )5,001(
������ ���� ���� ��� �� )62,504( )13,192( )269,700( :� ���� ����
����� � ����� )32,369( )9,715( )199,195( ���� ���� ��� ������ )9,252( )5,854( )65,504(
���� ��� �� ������ )41,621( )15,569( )264,699(
�� ��� ���� :� ���� ����
����� � ����� )49,092( )7,937( )202,862( ���� ���� ��� ������ )13,412( )5,255( )66,838(
������ ���� ���� ��� �� )62,504( )13,192( )269,700(
(�"�) ���� ��� �� ����� ��� )0.81( )0.24( )4.96(
�� ���� ��� ������ �� ���� ����� ������� ���� ������ �������� �������.���
5
) ����� ���1960 (����� ������
������� �� �� �������� ������ �����
���� ������
��� �� ����� ���� ����� ����� �� ��� ��
�� �� �� ��
����� �� ����� ��
�� ����� ������ �� ���� �� �� ���� ���� "� ����� �� ����� �� ����� ����� �� ������ ��� ��
�� ����������� �����
���������� �31���2013(���� ���)
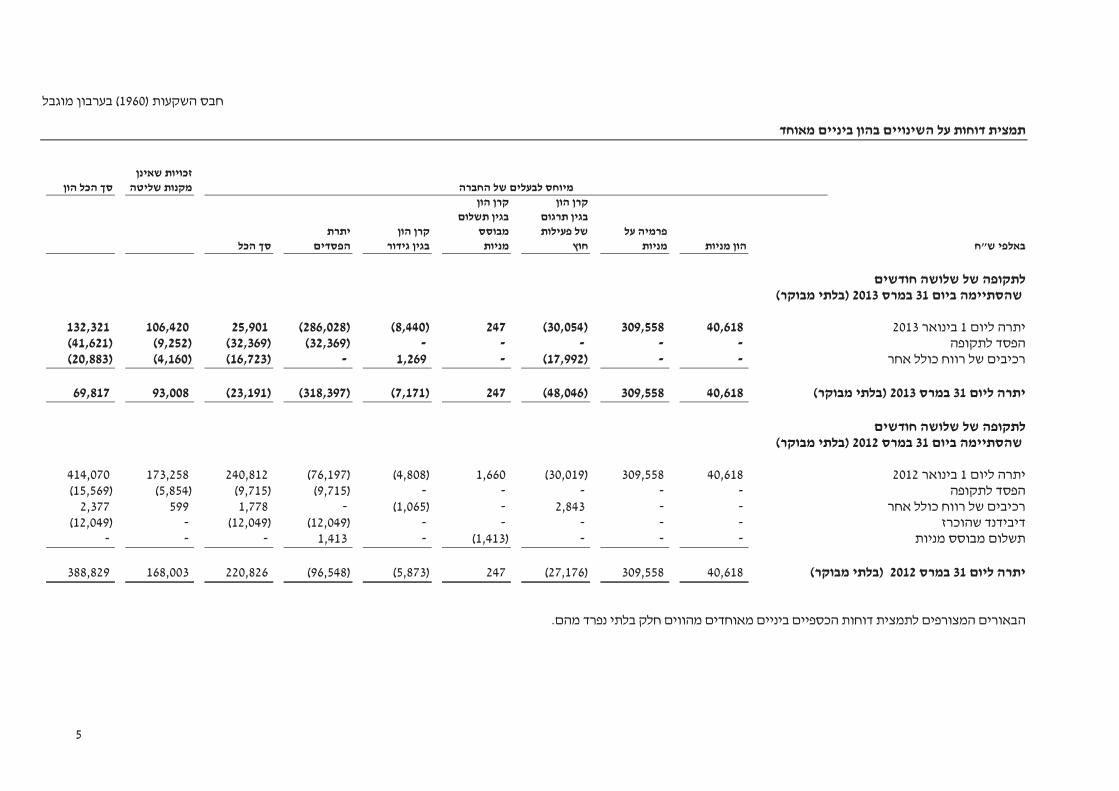
���� ����1�����2013 40,618 309,558 )30,054( 247 )8,440( )286,028( 25,901 106,420 132,321 ������ ��� - - - - - )32,369( )32,369( )9,252( )41,621(
��� ���� ���� � ������ - - )17,992( - 1,269 - )16,723( )4,160( )20,883(
���� ����31 ���2013 (���� ���) 40,618 309,558 )48,046( 247 )7,171( )318,397( )23,191( 93,008 69,817
�� ����������� ����� ���������� �31���2012(���� ���)
���� ����1�����2012 40,618 309,558 )30,019( 1,660 )4,808( )76,197( 240,812 173,258 414,070
������ ��� - - - - - )9,715( )9,715( )5,854( )15,569( ��� ���� ���� � ������ - - 2,843 - )1,065( - 1,778 599 2,377
����� ��� - - - - - )12,049( )12,049( - )12,049( ���� ����� ���� - - - )1,413( - 1,413 - - -
���� ����31 ���2012 (���� ���) 40,618 309,558 )27,176( 247 )5,873( )96,548( 220,826 168,003 388,829
�.��� �� ���� ��� ������ �� ���� ����� ������� ���� ������ �������� ������
6
) ����� ���1960����� ������ (
(����) ���� ����� �� �������� �� ���� �����
���� ������ ��� �� ��� �� ����� ���� ����� ����� �� �� �� �� �� ����� ������� �� �� ����� ����� ��������� ����
"� ���� ����� ��������� ����� ����� �� ������ ��� ��
��� �������� ����31����2012 (����)
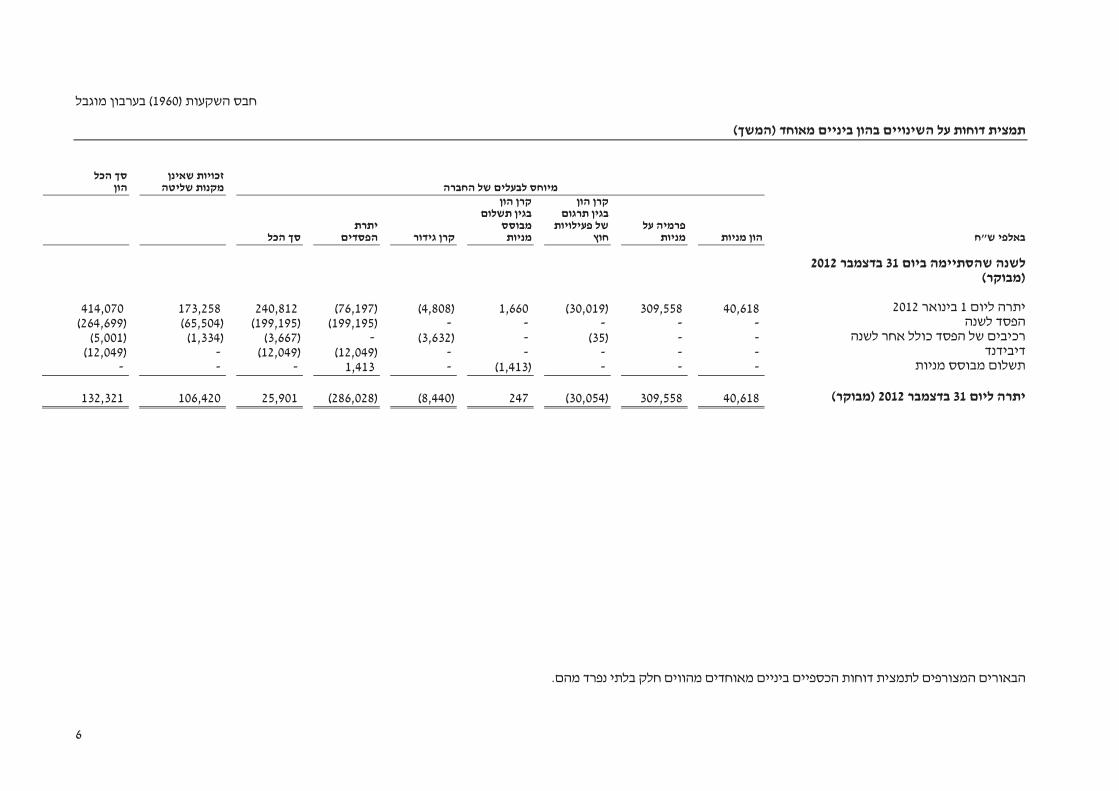
���� ����1�����2012 40,618 309,558 )30,019( 1,660 )4,808( )76,197( 240,812 173,258 414,070
��� �� - -- -- )199,195( )199,195( )65,504()264,699( ��� � ��������� ������ - -)35( -)3,632( -)3,667( )1,334()5,001(
��� - -- -- )12,049()12,049( -)12,049( ���� ����� ���� - - - )1,413( - 1,413 - - -
���� ����31����2012(����) 40,618 309,558 )30,054( 247)8,440( )286,028( 25,901 106,420 132,321
������� ��������� ����� ������� ���� �� ���� �����.��� �� ���� ��� ������
7
) ����� ���1960 (����� ������
������� ���������� ������ �� ���� �����
��� �������� ����� ����� �� ������ ��� �������� ���� 31��� 31��� 31 ����
2013 2012 2012 "� ���� (���� ���) (���� ���) (����)
������� ������������ ������
������ ��� )41,621( )15,569( )264,699(
������: ���� ���� ����� ����� � ���� ���� ��� - 579 2,150
���� ��� - )8( )20( � ���� ����� �������� ��� �������� ����������
����� ���� 20,866 15,940 104,187 ������� ������ ���� ��� � ��� 3,189 - 110,293
���� ������ ��� � ��� - - 2,523 ��� 320 97 375
��� �"� � ����� ���� ��� 11,892 - 544 ����� ����� ����� ���� - )14,583( )14,583(
(�����)���� �� ����� ������ )3,791( 578 )4,858( ��� �"� ������ ��� - - 12,230
���� ������ ������ ���� )49( )775( )775( ������ ���� ���� � ����� ����� ����
������������ ���� ��� ��� - )241( )240( ��� ������� ������ ����� ����� ����� ������ ����
����� ���� ��� - - )6,543( �� ,����� ������ 11,209 15,584 67,653
43,636 17,171 272,936
������ ����� ����� ��� 6,775 )2,248( 290 � ������� ���� ���� )1,468( )2,204( )8,144(
��� ����������� ������ ����� 4,496 )7( 3,048 �� ���� ������ ��� - - )31(
� ���������� �������� ������ ���� 1,594 )630( )3,253( ���� ������ ����� ������ ��� )13,958( )1,536( )5,221(
)2,561( )6,625( )13,311(
���� ����� )13,419( )13,096( )55,920(
���� ��� - - 25,521 �� ,���� ���� �� )6( 2,269 4,302
)13,425( )10,827( )26,097(
���� ����������� ������� ������ , )13,971( )15,850( )31,171(
������� ������������ ������
���� ��� ����� ����� - 30 294 ,�� ����� ���� ���� ����� ����� ������ 49 9,710 4,999
��� �"� ������ ����� - - 381,371 ���� ��� ���� )2( )14( )38(
�� ,�� ���� ��� ��� (����) ����� 8,744 )11,124( )121,774( ����� ���� ��� ��� �������� ������� ������ ���� )588( - )30,535(
������ ����� ������ ����� - 40 74 ��� �"� � ���� - )336( )336(
�� ��������, (������� ������) ������� ��������� 8,203 )1,694( 234,055
� ��������� ������ ����� ������� ���� �� ���� �����.��� �� ���� ��� ������

8
) ����� ���1960 (����� ������
������� ���������� ������ �� (����) ���� ����� ��� �������� ����� ����� �� ������ ��� �������� ���� 31��� 31��� 31 ����
2013 2012 2012 "� ���� (���� ���) (���� ���) (����)
������� ������� ���� ������
��� ����� ����� ����� - 54,922 54,922
��� ����� ����� - - )146,574( ���� �� ��� - - )12,049(
����� ������ ����� ���� ���������� 4,266 - 11,731 ����� ������� ����� ���� ���������� )5,022( )1,027( )291,936(
����� ��� ���� ���� �������� , 3,632 )764( 54,249
,��� ������� ���� (������� ������) ������� ���� 2,876 53,131 )329,657(
( ����) ����� ,���������� ����� ������� )2,892( 35,587 )126,773(
������� ������ ������ ���� ����� 21,895 147,161 147,161
������ ����� �� ������� ��� �� �� ���� ���� ������ 173 )599( 1,507
������ ���� ������� ����� ������� 19,176 182,149 21,895
�.��� �� ���� ��� ������ �� ���� ����� ������� ���� ������ �������� ������
) ����� ���1960����� ������ (
(������ ���) ������ ����� ������� ����� ������ �����
9
���1 - ����
.� ������ �����
) ����� ���1960 �"��� ���� ��� ����� ������� ����� � ���� �� ���� ��� ("�����" :����) �"�� (18 ��- ���� ������ � �� ����� ������� ���� � ����� .����31 ����2013 �� ����� � ��� �� ������ ,
.������ ������ ������ ������ �� ��� ,("������" : �� ����) �� ���� ������ ,����� ����� ������ ��� � ����� ���� ,������ ,����� ����� ������ �� ��� ���� ���� ,����
����� ����� ����� � ���� ����� .�"� �� ��� �������� ������ �"� � ����� �������� � ������.���� ��� ��� ������ ������
. "� ���"� ��� �� ����� ���� �� ��������� �����
����12 ����2013 �� ����� ����� ("���� � ���" :����)� ��� ���� ����� ���� �� �� �� ���� ��� � � ���
������� ��� ���2013 ,�� ����� N.V. NSI� � ����� ������� ���� ���� ����� ���� ,- 20.54% ��" :����) ������ � �NSI(" ��� �� ������� ������� ������� ����� �������� ����� ����� ���� ,
���� � ��� ,���� ���� ���� ��� ��� ���� .�� ������ ������ ������ ���� � ���� � ���� ���� ����� � ������� ������ �� ���� �� ����� �� ������� ����NSI ��� �� ���� ,������� � ��� ��� ,
� ������ ���� � ����NSI ��� ����� ����� ���� ����� ���� ��� ������ ������ ����� ���� ���� .��� �����
�� � �������� ����� ����� ,������� ������ ������ ������ ���� � �� ���� ����� ,��� �� ��� �� ��� �� ���� ����� � ������� ���� ����� �� � ����� ������ ����� ����� � ������12 �- 4 �������
�� ��� �� ��� �����2013 ���� ����� �� �� �� �� ���� ������ ����� ����� ��� ,����� ����� ..��������� ����� ���� ����� ������ ��� ����� �� ����� ����� ������
���� ����� ���� ,����� ��� �13 ���� 2013 ��� �� ���� ����� ������ ����� �������� ��� ��12 �- 4 ,
� ����� ���� �� ,�� ����� ������ ����� ������� ������ ������ ���� �� ,���� ��� ,����� ������� ������������ ��� ����� ��� ��� ������� ��� ������ ��, �� �� �� ����� �� ������ ��� �� ��� ��
����� ��� ������ ����� ����� ,����� ������� ���� ������ ���, ����� ��� ���� ��� ���� ����� ����� ������ �� ��������� ��� ������ ����� ������� �� ��� .�� �� ������� ���� ����� �������
) ������ ����� ��� ���� ���� �� ����Margin Call ���� ���) (17� ����� ���� � �� ��� ���� ���� ,(��� ������� ����� ��4 ����� ���� ��������� ��� .���� ������ ����� �� ���� ����� ��� ����� ���
.� ;������ ����� �� ����� ����� ��� �� �� ���� .� :���� � ���� �� ������ ���� ��� ����� ����� ���14 � ;������ ����� �� ������ �� ����� ����� �� �� �� ����� ����� ��� ���� ����� ��� � �� ���� .
.���� ��� � � �� ���� ����� ������
��� �� ���� ����� ������ �����12 �- 4 ���� ������� ,18 ����2013 ����� ��� �� ��� ��� ����� ���� , ���� ���� ��� �������� ��� ����� ��� ���� �� ����� �� � ����� ����� �� ,���� ����� �����
.("������" :����) ������ ������ � �������� ������ �� ������ ������ �� ����� ����� ����� ������� �� � ����� ����� �������� �������� ����� �� ,����� � ���� �� ��� ��������� ,����� ���� ��� �� � ����� �� �
���� �� � ���� ����� ������ ��� �� ����� .����� ���� ����� ������ ����� �� �� ����� �����6 ,7 �-9.
����13 ����2013 �� �) ���� ������ ���� �� �� �� ����� �����12 ��� � ���� ���� �� � ����� � ( �� �) ��� ����� � ������ ��� �����12�� ������ ����� ��� �� ��� ,( ��31 ����2013 ���� ,17 ����2013.
���� 19 ����2013 , ����������� � � �� ��� ����� ������ ����� ���� ���� ������ ,����� ,����� ����
���� ������� ������ �������� ����� ���� ����������� �������� �� �18 ����2013, ����� ����� ������ ���� �� ��� ���� ������� ������� �� ����� ���� ����� ������ ������ �� ��� �, ����
���� ��� ���� ����� ��� � ��� ����� (��� �� ��) ���� ����� ��� � � ������ ������ ���� �� � ����� �� �) ��� ����� ������12�� , ��� ����� � (������� � �� ��� ���� � ���� � ���� �� � � �������
12 ���� �� ������ ������ �) ��� �� 26 �����2013.( ��� �� � �� �� ����� ���� ���� ��� �� ������� ��� .
���� ������ ������� ."�� ���"� ����� � ����� ��� �� � �������� ����� �������
���� ����� �� ���� ������ ����� ���� ��� ,����� ���7.
���� �� ����� �� ,���� ������ ���� ������������ ����� ���� ���� ������ �� ���� �� ������� ���� �
."�� ���"� ������ �����
) ����� ���1960����� ������ (
(������ ���) ������ ����� ������� ����� ������ �����
10
���2 - ������� ����� ����� ���
.� ��������� ���� ���� ���� ����� �� �����
����� ���� � ������ ����� ���� �� ����� ������ ��- 34 IAS����� ������� ���� ���� , ���� ���� ������� ���� � �� ��� ���� ����� � .����� ���� ������ ���� � � � � ��� �� �� �����
���� ������� ���31 ���� �2012 �� ���� ��� ���� ,�� ��� .("����� ���� �" :����) ��� �"�� ,(��� ���� �������� ���� ) ��� ����� ����� ' ��� �������- 1970.
���� ����� ��������� � � �� ������ ���� �� ����� ������ ������� ���� � �����27 ����2013.
. ��� ������ ������� �����
� ����� ������ ���� � ������ �� ����� ������ ������- IFRS �� ,������� ����� �
���� � ������� ��� ���� �� ���� �� ������ �� ����� �� ��� ,������� �� ����� .������� ����� ,����������� �� ���� ��� ����� ������ ����� ������� ��������.
� ������� ���� �� ���� ��� ,����� � �� � ���� ������� ��� �������� ������ ������
.����� ������� ���� � ��� ��� �� ������ ��� ,��� �� ��� �������
���3 - ������� �������� �����
��� ,��� �� ���� ����� ������ ���� ������ ������ � ������� ���� �� ,���� ������� ������ ���� ���� ��.����� ���� � ����
:������ ��� �� ���� ����� ������ ���� ������ ������� ���� �� ��� ������ ���� ����� ����
���� ����� �� ������� �����
���� ���1 �����2013 :���� �������� �������� �� �� ����� �� ������ ����� )1( � ����- 1 IAS, ��������� ���� �
����� ���� ��� ���� ���� ����� �� ,������� ���� � ��� ���� ���� ����� � ����� ���� �� �� ������ ����� ������ �� ����� ��� ���� ���� ������ ��� ����� , ���� ����� ������ ����� ����� ������ �����
. ����
���� ����� �� ������ ����� .������� ���� � �� ������ )2( ���� ������ ������ �� �������� ������� ������ ,������ ���� ���� ���� ����� �� ��� �����
������� ���� ���� ��IFRS 10 ,������ ������ ����
� ������ ��� ���� ,������ ��� � ��� ������ � ���� � �� ���� ���� ����� ,���� ����� .������� .���� ���� ����� ������� �������� ���� � ����� �� ,���� ����� ����� ����� ����� "���� � " ������ �� ��� ,�������� �� ����������� ������ ������ �� ����� ����� ,���� � ����� ������ ,����
��� ����� ���������� �����.� ��� ��
.������� ���� � �� ������ ���� ����� �� ���� �����
.(����� ������� ������� ����� ����) ����� ��� ����
������� ���� ���� ��IFRS 13 ��� ���� �����
�� � ����� ����� ����� � ����� �� ����� ����� � �������� � ����� ���� � � � ���.�� �"� � �� ������ �� ���� ��� ��� ����� ������� ������ ��� ����� �"� � ���� ��� � � � ������ � � �� ����� ����� ����� ����� �� ������ �� ,��� ������� ���� ��� ���� �������� �������
.� � �� ���� ���
) ����� ���1960����� ������ (
(������ ���) ������ ����� ������� ����� ������ �����
11
���3 - ������� �������� ����� �)(���
���� ����� �� ������� ����� (����) )2( ���� ������ ������ �� �������� ������� ������ ,������ ���� ���� ���� ����� �� ��� �����
(����)
������� ���� ���� ��IFRS 13 ��� ���� ����� )����(
� ���� � ���� ���� �� � ��������� �� ��� ��) ���� ���bid price���� ����� ����� ( )ask price ,(.���� ��� � �� � � �� ������ ���� ��� ����� ���� ����� ����� ����� ����� ���� �����
��� ��� ������� ������ � �� �� ����� �� ���� � ������ ���� ��� ���������� ����� ���� ���������� �����.�
�� ���� ���������� ������� ���� � �� ������ ����.
���4 - ����� ����
����� ���� ��� ��� ������ ������ ����23 .���� ����� ���� ,����� ���� � ������ ����� �� �
� ��� �2012:���� � ��� ��� ������ ��� ��� ������ ,
��� �"� - ,����.������ ����� ����� ����� ������ �� ��� ���� ��� � ����� ���� ������ �"� - .����� ������ �"� � ����� �������� � ������ ���� ,���� ,�����
�"� ��� �����- .������ ����� �"� �� ��� ������
�� ���2013 ������ ������ ��� ���� ��� ����� ����� ��� �� ������ ������ ,����� .�"� � ������ ��� ���.���� �� ����� �� ������
���� ��� ������� ������ �� ����� ������ ����� ���� �� ���� ��� ���� �� ������ � ������ �����
.������� ������
� ��� ��� ������� ������� � ������� ���� �� ����� �����3 .����� ���� �
.�� ���� ������ ���� ����� ����� ,������ ������ ,������� ��������� ������ ������
.� ���� �� ������ ����� ����
"� ���� ��� "��������� "��������� �"��
����� ����� �� ������ ��� ��������31 ���2013
(���� ���)
�������� ������� ����� �� 2,773 12,485 135 15,393
������� ( ���) ���� )9,383( 4,561 )5,326( )10,148(
����� � �� ,�� ���� ��� ��� ��� �������� �������
����� ���� )20,866( - - )20,866( ������ ����� ���� ��� � ��� )3,189( - - )3,189(
����� ( ���) ���� �� )33,438( 4,561 )5,326( )34,203(
) ����� ���1960����� ������ (
(������ ���) ������ ����� ������� ����� ������ �����
12
���4 - (����) ����� ����
.� (����) ���� �� ������ ����� ���� "� ���� � ������
��� "��������� "���"��� ������ �"��
����� ����� �� ������ ��� ��������31 ���2012
(���� ���)
�������� ������� ����� �� 8,368 4,085 775 108 13,336
������� ( ���) ����6,319 1,244 688 )5,722( 2,529
� �� ,�� ���� �������� ��� ��� �������� �������
����� ���� )15,940( - - - )15,940(
����� ( ���) ���� �� )9,621( 1,244 688 )5,722( )13,411(
"� ���� � ������ ��� "��������� "��� "��� ������ �"��
��� �������� ����
31 ����2012 (����)
�������� ������� ����� �� 36,340 20,516 775 359 57,990
������� ( ���) ����13,805 6,468 )2,815( )17,315( 143
����� � �� ,�� ���� ���
��� ��� �������� ������� ����� ���� )104,187( - - - )104,187(
������ ����� ���� ��� � ��� )110,293( - - - )110,293(
����� ( ���) ���� �� )200,675( 6,468 )2,815( )17,315( )214,337(
����� ��� �� ���� �� ������ � ������
��� �������� ����� ����� �� ������ ������ ������ 31 ��� 31 ��� ���31 ���� 20132012 2012
"� ���� (���� ���) (���� ���) (����)
���� ��� ������ ���� ������� ���� ��)34,203( )13,411( )214,337( ����� �� ���� - 14,583 14,583
�� ,����� ������ )8,169( )16,163( )69,803(
���� �� ���� ��� ���� ��� )42,372( )14,991( )269,557(
) ����� ���1960����� ������ (
(������ ���) ������ ����� ������� ����� ������ �����
13
���5 - ������ ����� ���� ��� �������� ������ ���
� ������ ������� ���� � ����� �� ��� �� ���� ����� ������ ���� ������ ����� ������NSI .
� ���� � ���� ����NSI .����� ��� , �� ��� ��� ���� ����� � ������� ��31 ����2013 ���4.6612.
:���� � ������ ����� � ������� ���� ��� ���� ����� ����
����� ��� ����� �� %
:���� ������� �� �� ��� � ������ 31 ����2013 )5.27( 31 ����2012 0.40
���� ������� ��31���� �2012)0.35(
����NSI � ������ �����- Euronext NYSE Amsterdam ("������" :����). � ����� ����- NSI ���� ����� � ���� ��� ����� ����� �� ��� ��� .����� ���� ��� ��� �����
� �����NSI��� � � ���� ����� . ����� ���� ����� � ��� .��� � ��� �� �� ���� ����� ���� �� .����� � ���� �� ���� �� ������ ���� ������� ��� ������ �������
����� ������ ����11 ���� ����� ���� � ��� ������ ,����� ���� � NSI �� � ����������� �����
����� ������ ���� ����� ��28 � ���� ����� ����� ��� � ���� ����NSI ����31 ����2013 , ���� ��� �� ,�� �� � ����� �� ,���� ������ ������ ����� ���� ���� ����� ��� ����� �������
�� ��� ��� � ���� ����� ���� ,��� � ����2012 ����� ����� � ���� �� ����� .NSI � ���31 ����2013 ���618,073 ,�" ���� ��� � ��� ��� ������ ����� ���� :�����- 722,551 ����� �" ����
� ��� � ���� ����104,478 �� � ��� ������ ����� ���� �� ,�" ����618,073 �� ������ �" ����� ������ � ����-NAV � (�� ��� ���)NSI ��� �- 132.6 .���� ������
������ ,�� � ������������� � ��� �� ���� �NSI�� ,B.V. Habas Tulip " :����)Habas Tulip(" ����
, ���� ����� � ����� � ���� ����� �� ������ ���� ���� �����- Habas Tulip ������ �� ����� ������NSI ����� ������)17� �� ������ �� ����� � �� ���� ,������� ������� �� ��� ,(
������ � ��� ��� � �����LtSV.
� � ��� ���� ������ ���� � ��� �� � ������ ,�� ������- 6.1 �) ���� ������- 30 ���� ��� �� (�" ������31 ����2013� ��� ����� �� ��� ���� ,- 18.2 ���� ������ �)- 85 � ���� ���� � ���� ��� .(�" ������-
LtSV ���51.40% ����� ���� �� ������ ������ � ��� ��� ���� � ��� �� ���� .)Waiver letter ( �����Habas Tulip ���� ,25 ����2013 ��� ������ ����� ���� ,������ ����� ��� ,25 ����2013 ��5 ������
2013 � ��� ("������ �����" :����)- LtSV �� ��Habas Tulip ����� �� ������� ����� ����� ���� �� ���� �� ,������55% ���)50% ��� ����� ����� ��� ������ ������ ����� (������� ����� �����
� ���� ������ ������ ��/� ���� �� ���� ����� ������ ���� ����� .������ ���� � ��� ���� � ��� ����� � ��� ����� �� ����- 18.7 �) ���� ������- 87 .(�" ������
:����� ���� ��� ��� ,���� ����� ����� �� ���� �� ��
�. � � ��� �������- 3.8 � ����� ���� ������ ���� ������- Habas Star �����11 �������2013 �- 14
����2013 ���� ��� �� ����� .6.�
�. ����� �������Habas Star ���) ������ �����-(��� ����21 ����2013�) ����� � ���� .- 0.9 ������ ���� ����� (���� ���� ����� ��� �� �����12 �- 4 ���� ����� ��� ��21 ����2013 ������ �� ,
� ��� �� ����� � ���� ����� ������ ����� ���� ������ � ������ ����� � ����� �� ����� ��� ����.
) ����� ���1960����� ������ (
(������ ���) ������ ����� ������� ����� ������ �����
14
���5 - ������ ����� ���� ��� �������� ������ ��� (����)
�. ����� �������Habas Star ���) ������ �����-(��� ����5 ������2013�) ����� � ���� .- 0.5 ������ ���� ����� (���� ���� ����� ��� �� �����12 �- 4 ���� ����� ��� ��5 ������2013 ������ �� ,
������ ����� � ����� �� ����� ��� � ��� �� ����� � ���� ����� ����� ���� ������ �����.
������ �� ��� ����� ���� �� ��� �� ������ ���������� ���� ����� ������21 ����2013 ���� ��� ,1.�
���� � ���� ,��� ������ ���� ����� ���� �����NSI ��� �� �� ����� ,������ � � �� ��������
��� ,����� � �������79 �) ���� ������- 377 .(�" ������
� ���� ,�� � ����� ���� ���- LtSV � ���- 45.8%.
���6 - � ���������� ����
.� ����4 ����2013 ��� ��� ����� ���� ���" :����) ����� � � �� ������ ������� ���� ,�"�� ("������� ���� � ��� ��� ��� '��� ��� � ���� ������ ����� ������ ������� ���� ���-
� ��� ���� ���� ������ ("���" :����) ����15 � �" ������ � ����� ��� ������ � � �����8.3% ���� �� ����� ������ ����� ������� ��� .������ ��� ���� ������ .������ ������ � ���
������ .��� ��� ���� �� ������� ����� ������ ������� �� ������ ����� .������� ������ ����� ���� ��� � ��� ,������� ������ ���� ����� .��� �������� �� ,���� ��� � ���� �����
��������������� ��� ������ ����.
.� ����� ������ ����5 �� � ������ , �����Habas Star � ����� � ����� ������� ��- Habas Star � ����� ����� �������)- Habas Star���� � ,("����" :����) (:
)1( � � ��� �����2.5 ,���� ������ ���� ������11 �������2013 ������� .�� ����� ��� �����
�12% � ��� ���� ������31 ����2013 ) ���� �� ������� ����� ��� ,���� ������30 ����2013� ����� ����� .(� ������ ���� ������� ����� ���� �� ����� ������� ,����� �� ��
����� �� ���� ��������� ����� ����� �� ���� ����� �� ���� �� ���� ���� ����� ����� ���� �� ������ ����� � ����- Habas Star �� ��� .��� ��� �� ����� ������
�������Habas Star ����� ���� �� ������ ����� �� �� ������Habas Star��� �� , ����� � ���� � ��� (������ ���) ������� ���� ���� ����� ��� ��� �� ���� ������
����� ,����� ����Habas Star � ��� ������ ����4 ����� ������� ����� .���� ������ ���������Habas Star ����� ������������ � ���� �����74% ��� ��� �� �� ��������
�� � �Habas Star ���� ���� ������� ������ ��� � ���� ��� �� �� ,7 ���� ����� ��� .������� ������
����1 ����2013 ����Habas Star � ��� ������� � ���� ������1 ��� ����� ��� ���� ������
���� � ������� ���� ������ ��� ���� �� �� ��31 ����2013 . ����13 ����2013 ����Habas Star � �� ��� ������� ���� ��- 1.57 �) ���� ������- 7.4 ��� � ���� ������ ���) (�" ������.(��
) ����� ���1960����� ������ (
(������ ���) ������ ����� ������� ����� ������ �����
15
���6 - ��� ����� ������� (����)
.� (���)
)2( ������ � ���1.3 ���� ������ ���� ������ ,14 ����2013 , � � ������90 ��� ���� ,��� ���� � ������13 ����2013 � ����� ��� ����� ��� ,("������� ������ ���" :����)12%
��� ���� ���� ������� ("������" :����)("����� ����" :����) ���� � ,�: ���� ��� �� ������� � ��� ����NSI ������Euronext � �� �� ,5.36 ���� ��� .����
���� � ������ �� �����NSI ����� �� ���� ��� ������� ����� ��� ���� ,���������� ���" :����) ����� �������NSI � ���� ���� ,("����� ������� ����- 5.36 ���� ,���� ����
�� ����� ����242,537 � ���� �� ��)1.3 ���� ���� ������5.36 :��� ���� ����� (���� ���� ���� ��� (�)NSI � ����� ����� ������� ����- (�)5.36 ���� ��� �� ����� .NSI ������� ����
� ��� ���� �����- 5.36 .��� �� ����� ���� ���� ,���� � ��� ,������� ���� ���� ���� ���� �� ������ ���� �� ��� ����� ����� ������ �� ���� ���
���� (��� ����� ���� ���� ��) ������� ������ ����242,537 ���� ���� ����NSI �������� � ��Habas Tulip � �������- 1.7% � �������� ���Habas Tulip �- NSI .
�� ,(����� ����� ������ �����) ������� ������ ���� � ������� ����� �� ��� ��� ���� � � ����� ��� ������� ����� ,����� ���� ������� ������ ������ �������5% . ���
������� ,������� ����� �����Habas Star ����� ���� �� ������ ����� �� ��Habas Star ,
���� ��� ���� ��� �� ��) ���� ������� ���� ���� ����� ������ ��� ��.(�� ���� ���� �� ��� ����� ,� ��� ������� ����� ������� ���� ������ ���� �� ���NSI
� � �� ��������Habas Tulip.� ��� ������� ���� ����� ,����� � � �� ,
�. ������� ���2012 ���� �� ��� � � ����� ������� � ���� ���� ,�"��- 64% ��) ����� � � �� :�� � ��� ���� ����� ������ ("���� ��"25,500 ���� ��� ������� �� �� ����� ������) �" ����13 �
� � �� ���� ��� � ���� ������ �������� ��� ������� �� �"� ������� ���� .(����� ���� ������ ����� � � �� � ���� ������ ������� ������ ��� ��� ���) � � ���Ltd Investments Coronell
�� �������- 21% " :����) ���� �� �����Coronell"(( ���� �� ��������� � � �� ����� ����� ����� ����28 ����2013 ,���� ������ ����� ������ ������ ������ ���� �� ����� ���� �� ���� ��
��� �� ��� ����� ��� ���� �� ������ ������� ���� ����� ���� �� �� �� ��� ���� ��� �� ���� Coronell � ���� �� ���� � ���� ���- Coronell .���� ��� ��� ,����� ����� ���� ��
� �� ,���� ,"����� �����"8.5 ������ ������� ������ �� ����� �� � ���� ����� ������ �"��� ������� ���� �� ���� �� ���� �� ��- Coronell ��� ���) ����� ������� ������� �����
���� ��� ����� ������� ���� ��� ��� ���� ���� ,���� ,"����� ������� �������" .(���� '�� ����� � ������ ��� ����1 ����) ����� ���� �����7 �������2010 �� �� �� ( ���� �� ����
��� ����7 �������2010 ��/� ���� ��� ���� ��� ����� ����� ��/� ����� ������� ������ ��/� ����� ������� �� �� ��� ������� ������� ��� ,������ ����� ���� ����� ����� �����
� �� ����� ����� �����6% �� ���� ��� �� ��� ���� ��� ���� ���� �� �� ��� �� ����� ��� �� ������ �� ����� ����� ,����� ����� ������� ������� ����� ����� .(����� ���) ����� �� ���� ����� � � �� ���� ������ �����) ����� ����� ��� ���� �� ��/� ���� �� ���� �����
� ��� ����� ����� ���� �� � ���� � � �� ���� ����� �� (����� ����� ���� ��� ���Coronell , .����� ���� ���� ������ ��� ���� ��� ����� ������ ������� �� ��� ���� �����Coronell ��
.������ ������ ��� ����� ����� ����� ���� � ����� ��� ����
� ����� ����� ���� ������ ���� ��� �� - Coronell ����� ������ ��� �� ���� �� ���� ,����� ��/� ����� � ���� ��/� � ���� ������ ������� � �������Coronell ���) ���� ��� - ��� (���
.��� ����
,��� ����� ����� ����� ����� ����� �� , ���� ����� ���� �� ��������� � � �� ����� �� ����� �� ����� ����� �� ���� ���� ���� ,����� ��-14 ���� ,����� ������ ���� ���� ����� ���
����� ,�������� ��Coronell � ��� ����� ,������� �� ���� ��� � ��� ��� �� ,8.5 ������ �"���� ���� �� ���� ����� .����� ������� �� ��� ���� �� �- Coronell ����� .�����

) ����� ���1960����� ������ (
(������ ���) ������ ����� ������� ����� ������ �����
16
���6 - ��� ����� ������� (����) .� (���)
���� ����� ��� ����� ��Coronell '�� �����" :����) ����� ���� ���� � ��� ������ ����� �� ,2 �� ("������� �� �� �� ����� ���� ���� ���� ������ ���� Coronell �� ��- �"�� ������ ����
�������) �- 15% " :����) ���� �� ������� �� (("- 10% �� ,���� �� � ����� ����� ���� ���������� ,��� Coronell �� �� ��� ����� �� �� ��� ����� ��������� � ����� ������ ���� �����
��� � ���� ��� �� ���� ����� ���� ��� ���� ��� ����� ��� �� ����� ���� �� ��� .������ ��� ����� �� ����� ��� �� ����� ���� ���� �� �����- 10% ��� ����� � ����� ����� ���� �����
���� '�� ����� �� �� �� ������ �� ��� .����� ��������� � ����� �� ������ ���� �����2 ����� ����� ����� ���� ������ ��� ���� ��� ���� ��������� � ���� ����� ��� ���� ,���� ���� ���
.����� � ����� ����� ���� ���� ��� ����� ��� � �������� ����� ����� ��� ������� ����� '�� ����� � ��� ���� ����� ���� �� ��������� ����� � ����� ,�� ��2 ����� ���� ���������
���� ���� ����� . ����� � ���� ����� ������ ����� � ���� � ����� ���� ���� �� ���� ��7 ������2013, '�� ������ ��������� � ����� ����2 �� �������� �����- Coronell ������� �� � ���
'�� ����� �� �� �� ����1 .�� �� �� ��� ����� ���� ������ ���� � ����� ���� � ���� ����� ��� ���������.�� � ������ ����� ����� ����� .
���7 - �����
.� ����17 ����2013 ������� ������ ������ ����� ��� ������� ����� ,����� ��� ����� �����:����) ����� � ��� ������ ������ ����� ����� ����� � � �� ,("����� ����" :����) .("������"
���� ���� ����� ����14 ����2013 ,����� � ,���� ��� ������ ���� ���� ������� ��������������� � �"�� .("������" :����) ����� �"���
���� ����� �� ��� ,���� ��� ������� ����7 ����2013 ,����� ���� ���� ��� .("�� ���" :����)
������ ������ ���� ,�� ���� .����� � � �� �������� ������� ������ ������ ���� �� ��� ���� ���� �� ,�� ��� ��� �� �� ���� ����� � ,������ ,��� ���� �� �� ������ �� �� ������
�� ��� ,�� ��� ������ ,������ ���� .����� �� ���� ����� �� �� ������ ,������ �� ��� ,���� ���� ����� � ��� ����� ,����� ������10 ����2013 � ��- 12 ����2013 �� ,������ ,� �����
���� ����� ������ �� �� �� ���� ��� ,������ ���� ,���� ,������ ���� ,����� ��� ����� ���� ���� ,��� �� ����� ���� ��� ����� �12 ����2013�� , � �� ���� ��� �������� ����� ������
.���� ����� � ������� ������� �� � ���� ���
� ���� ����� ���� �� �� ������� ������ ������ �� ��� ���� ������ ,����� ���� ���� ��� ���� �����10 ����2013 ���� ��12 ����2013��� � ���� ����� ���� �� , �� � ��� ���� ��
��� �� �� � �� ����� ����� ��� ����� ,���� �� ,������ ,�����12 ����2013 ������ �� ��� , �� � �� ����� ����� ��� ����� ���� �� �� ,������ ,����� �� � ��� ���� ����� � ���� �����
.("������" :����)
� ������� ,���� ��� ,���� ������ � ������ ���� ����� ����� ,��� ���� ���� � ���� ��� �� ��� � ��� ����� ������ ,����� ��� ,��������� ������- 10 ����� ���� ���� ,(����� ���) �" ������
. "�� �"�� .����� ���� ����� �� ���� ���� ,����� ���� ������ ��� �� � ��� �����
.� �� ��22 ������2013 :���) ���� ������ ������ ����� ��� ������� ����� ,����� ��� ����� �����
���� ���� ����� ���� .("����� ����"18 ������ 2013 ��� ������ ���� ���� ������� ��������������) ��� ����� ��� ���� ,��� ���� �"� ����� ����� ���� � ,���� ��/� ������ ,�����
��.���) ����� ���� ���� ,("����� ����" :����) (����� ������� ������ ����� ������� ������� ���� ���� �� ���� ���� �� ,("�"� �� ���" :����) ((�"�� ���� ���� ����� :� ��� ����) �"�� �"�
����� ����� ���� ����� ��� ����� ������ � :����) ����� ����� ����� �� �������� ���.("������"
��� ��� ����� ����� ����� ��� ����� ���� ��� ��� ����� ���� � ����2011-2012 , �� �) ��� ����� �����) ���� ���� ��12 �����" � �� ��� ��� �� ��� ������ (����� � (
�� ��� "������"�� ,������ ���� �-1999 .("�� ��� � �����" :����)

) ����� ���1960����� ������ (
(������ ���) ������ ����� ������� ����� ������ �����
17
���7 - ����� (����)
.� (���)
���� ,���� ���� �"� �� ���� ,����� ����� ������ ���� ��� ���� ,����� ���� ���� ��� � �� ����� �����42,046,056 � ����� ������ ����� ,���� ���� ,�� �" �� ����� ��� �� ���
� ��� ����� ����� ��� ,������ ,��� �������� � ������67,072,865 �� ��� � ����� ���� ,�" ��� �"� �� ��� ,����� ���� �� �� ��� � ���� ��� � ����� ��� ,��� ���� ����� �������
,�� ��� .��� ����� �������� � ������ ,����. "�� ���� ��� ��� ������ ����� ����� ���� �� ����� ����� ���� ���� ����� ���� ����� �� ��� � ������ �� ���� ����
.����� ���� ������� �� ���� �� ����� ������� ����� ���� ����� �� ���� ���� ,����� ���� ������ ��� �� � ��� �������� ����� . ���
���� ����� �� ����� ���� ����� ���� ��� ,���� �� �� ��15 �����2013.
�. ���� 24 ������ 2013 ���� ����� ��� �� �� ��� ��� ����� ,�� ����� ����� ��� ,����� ������ �"��� ������ ���� ����� � �������� ) ���� ����� ������ ��28 ������2013,( �����
������� ��� ����� ������ ������ ������� ) :����"���� ����� ,("�� � � ��� ����� ����� ����� ������ ��� )�� � 4 (� ����� ) :����"���� .("
��� ���� ���� ����� ,���� ���� ����� �� ,����� ,���� �� ������ ������ ������� �� ���� ������ ��� ����� ��� ,���"�-1968 ������ ����� ����� ���� �� �� ����� ���� � ��� �� ��
����� ����� ����� ,��� ������ ���� )�� � 4 .(���� ���� ,������ � ������� �� ����� �� 2012 � ����� ��� �� �� ��� �� 2012 � Habas Star ,���� �� ����� ������ ������ � � 2012 ���� Habas Star ����� ���� ,������ ����� ��� � 14,843 ���� ���� )����� ,���� ���� ,���� �
����� ��� 10,984 ���� ���� ,(��� ����� ������ ,������ ,����� ������� � ������ ����� ���� )�� � 4.(
��� ���� ���� ����� ,���� ��� ��� �� ������ ������ ������� �� �� ���� ����� ���� )�� � 4 (� ����� ���� 1 �������� 2012 �� ���� 28 ���� 2013 ) :����"������� .("
���� ���� ��� ��� � 16,385 "� ������ ���� � ��� ������ ���� ���� ����� ���� �� � � �� ����� ����� �������� ,������ ���� ������� ,����� ��� � ���� ������ "� ,��� ���� ����� ������ ��� ���� ��" .
������ ��� �� � ��� ������.����� ���� ����� �� ���� ���� ,����� ���
. ����17 ������2013 ��� ��� ����� �� ����� ��� ����� �����- ���� ������ ����) �"�� � ������ ���� � � ���� ������� ��� � ���� � � �� ("� ����" :����) ���-���� .� ���� � � �� �� ��
����� ���� ������ ����� ������� ����� ����� ,��� ��� � �������� ������� ������ � ����� � ��� ����� ������� ���� ������ .� ������ ����� �������- 550,000 ��� ��� �� ��� .�"
��� ��� ��� � ����� ����� ��� ��� ����� ���� .����� �������� ��� ���� �� ���� �� ��� � ��� ���� � ���� �� ����� � ������� ������ ������ ,���� ������- 150,000 � ����� �"
�� ��� �� ������ ��� ����� ��� �� ����� ���� ���� ������� �� ����� �� ����� ������ ���� .������ ��
���8 - �������� �������
��� ����
.� ����� ���� ������ ��� ����
������ ,������ ,������ ���� ������ ����� ������� ������ ����������� ������ ���� � ������ ����� ,�����.��� ����� ���� ���� �� ���� ,����� ������ ����� ��� �� ,��� ���� ����� ����
��� ,����� ���� �� �� � ������� ������� ������� ������������ ������� ����� ��� � ����� ����:���� �
����31 ���2013
"� ���� ����� ���� ��� ����
� ������� 443,239 206,664 ������ ������ �� ����� ������� 514,232 535,370
957,471 742,034

) ����� ���1960����� ������ (
(������ ���) ������ ����� ������� ����� ������ �����
18
���8 - (����) �������� �������
. ��� ��� ���� �����
���� �� ���� ���� �� �� ������� ������� � ���� ����� ���� ������������� ��� ��� , ����� �.�������� ����� ���� ����� �����
:���� � �� ��� ���� �����
� ���1.���� ������� ���� ��� (������� ��) ������� ������ : � ���2 ���� ������ ��� ,������� �� ������ ,���� ���� :1 .���� � ���3.���� �� ��� �� ������ ��� ���� :
����31 � ��2013
"� ���� ���1 ���2 ���3 �"��
�� ��� ����� ����� -)20,594( -)20,594(
���9 - ����� ���� ��� �������
.� ����� ������ ����16)�4 ,����� ���� � ( ����� �� ��� ��� �� ����� �� ������� ����� �� �) ����4���� ����� � ( 29 �� ����2010 ���� ����) 26 �����2010 ����� 7 �����2011 ��" :����) ( ;("����� ����2 ������ ���" :����) �� ���� �� ����� ����� ��� �� ��� "��� � ���" ������
.("��� �� � ��� �� ������ �� ��� �� ���� �� ������ ,����� ��� �� ���� �� ����� ����� ����� ����)74% � ����� ����� ���� (Habas Star � ��� ��� �����Habas Star ����� �������� ��� ��� �����
� ������� ������� ���� � ����� ����Habas Star ����) 31 ���� �2012 ,(� ���- 392,051 .�" ���� �� ���� ��� ,��� ���� ���� ,�� ��������� ��� ) ���� �� �4� �� � �� ���� ��� ����� ������ (-
339,690 .�" ���� ��� ,��� �� ���� ��� ,�� ���� �� ����� ����� � ����� ��� ,�����115.41% " :����)��� ������ .("
���� ���31 ���� �2012 �� �� ������ ��� ,120.3% ��� �� ���� ������ ���� � ���� . ���
.��� ���� ����� � ������� �� ������
� ��� ��� ���� ����� ,����� �� ������� ����� �� �����60 ������ ��� �� ���� ��� ����� ���) ����� �� ������� ����� � � �������� ���� �� ���� �� ������ ���120% .(��� ���� �� ��
����� ���� ��� � 60 ��� ����� ���� ��� �� ,��� ���� ���� ��� ����� �� ����� ���� ������ � ���. ���� ,���� ���� ��� ����� �� ����� ���� )�� � 4 (������ � ��� ,��� ���� ����� �� ����� ������ ����� ������ �/�� ���� ����� ������ ������ ������� ������ ����� ���� ����� ���� ����� ���
����� �� ���� ������������� ���� ���� ����� ���� )�� � 4.( ����� ��� ����� ��� ��� ����� ���� ��� ����� ���� )�� � 12 (���� ���� ��� ����� ��
����� ���� )�� � 12 (������ � ��� ,��� ���� �� �� � ���� � ����� ��� ����� ����� � ���� ������ � ��� . .���� ��������� ��� ����� ���� ������������ ��� �� ����� ������ ,�� ������
�� �) ��� ������ ���� �� �� �����12 ��� ����� � ������� ���� ����� � ���� ���� �� � ( �� �)12 ���� ��� ,(1.� ����� ��� ������ ��� ,�� � ����� ����111.3%.
.� ���� 13 ������2013 ����� �����) ����� ��� ���� ��� �� ��2005 � ���� ������ ����� ���� ,�"�� (
) ��� ���� �� ,�� ����� ����� ��� ����� � ��������� � �"�� :����("����� ���" ,�� � ����� �� ����� ��� ����� ����� ����� ������ ��� �� ���� �� ���� ��� �� ������ ����� ��� ����
���� ������ �� �� 1 ������2013 ���� ������ 30 ����2013 � ("������ �����")���� ������� � �- 0.5 ������ �".��� ���� �� ����� ���� ��� ���� .
�� ����� �� ��� ����� ���� ��� ����� ��� ,������ ����� � ����� �� ,���� �� ������ ���� �.����� ���� ������� ����� ����
) ����� ���1960����� ������ (
(������ ���) ������ ����� ������� ����� ������ �����
19
���9 - (����) ����� ���� ��� �������
.� ����13 ����2013 ������ � �� ���� ���� ���� ,����� � ����� ���� � ������ ������ ���� ,����) ��� ���� �������� ������ ����� ������ ���� ,��������� � ���� ���� �������� �
��� ���� � ����� ����� ����� �� ,����� ����� ���� � ������ �� ����� ����� ���� ��� ,���� ����� � ��/� ����� � ����� ��/� ��� ������ ��/� ����� ���� �� ��/� ������ (���
�� ,� � ������ ,��� ��� ,�� ������ ������ ���� �15 ������2013 ������ �� ���� ���� ����� ��� ��� ������ ���� ���� ��� ���� �������� ������ ���� �� ������� . ��� �� �����
���� �� �� ����� ������15 ������2013 ��� ������ ������ ������ ���� ������� ��� � ����� �� ����14 ������2013 .��� � ���� �� �� ����� ����) ������� � �� ���� �� � ������ �� ����� �� �
���� � ����� ����� ������ ������ ����� �� ����� ��������� ��� (�����31 ����2013 ����� �� ���� � ����� ������ � ������ �"�� ������ ����14 ������2013 � ���� ����� ���� ��� ����
��� ����� ����� � ������ ������12 ���� ��� ����� �� �� ��15 ������2013 ���� ��13 ������2014 ���� � ������ ������ ���� ������ ����� ����� ,14 ������2014 � ������� ���� ���� ,
��� ����� � ���� ,����� ������� ���� ����14 ������2013 . ����� ��� ���� �� ��� ������ ������(Claims Made) � ������ �������5 ������� ����� ������ ��� ���� ����� �"��� ��� ������
� � ������ ��� ������20% � ��� ��� ������ ������ .������� �������98,000 �"��� ��� .��
. ���� ����� ,���� � ��� ���� ������� ("��������� �����" :����) �������� �������� ����� �
,���� �� ����� � ����� ���� �� ���������� ������� ���� �"��� ����� ����� � ���� , ���� ���7 �����2013 .
�� ��� ,��������� ����� ������ �� � ��� ���� ,����� � ������ � �� � � ���� ���� �� �� ,����� � ������ �"��� ��� ����� ��� �� ,����� �"�� �� ����� � ������� ������� ,�� �� � � ����� ��� �� ("����� �����" :����) (����� ������� ���� ����� �������) �����
����� �� ���� ���� ������� ���2013 � ���� ������ �� ������ �� ���2013 �����") (����) � ����� ���� ������ ���� ����� ,("���� �10% � �"��� ����- 20% ���� �� .������ �"��� ����
��� ������ ���) ����� ���� �� ������� ����� ���� ��/� ,���� ����� �� ���� ���� � �������� � ���� ��� ,(���� � ����� ��� ������ ��� ,����� ����� ������ ����� ����� ����� ,���� �
.����� � ������ � �� ����� ����� ��� �� ������� ��� .�� ������� ����
.� ���� 10 ������2013 �����Habas Star ) �������� ���� ������ �����30%� (- Horn Three GmbH & Co. KG �- Horn Three Management GmbH ���� ��� �� ,����� �� � �� ��� � ���� �����
� � ��� ������ ���� ,���- 1.27 � � �� �� �� �� ��� ������ ����� ��� ,���� ������- 0.27 ) ��� ���� ���� �� ����� ���� ������Real Estate Transfer Taxes ��� ���� ����) ����� ���� (
) (���� � � �� ���� :���� ����� ���� ��� ������� ������ �� �� ����� ������ .("���� ����" ���� ���11 ������ ���� � �� ����� �2012.
Habas Star � �������� ����� ����� �� �� �� ��� �� �� ��� ���� ,���� ����� ����� ��� �� ���� ����� ������4 �-12 ���� ����� ���� ���� ��������� ����� � � ,����� �13 ����
2013 ������ ����� ���� �����.
����� ����� �����- Habas Star ������ ����� ���� ������ � ����� ,��. �������� ������ ����� � ��� ��� ������- 0.23 .���� ������
��� ���� �� ,�������� ����� ������ �����11� ,����� ���� � ���� ����Horn Three GmbH & Co. KG � � �� �� ���� ���� ��� �������� ������ �������� ������� ��� ��Durango Munich
GmbH & Co. � � � �� ������� ����� ���) Habas Star � �����30%" :����) (Durango ,("��� Habas Star � � ��� ��� ���- 0.4 ���� ������ �)- 2 (�" ������ ����� ����� ��� ������ �����)
� �������� ����� ���� ����� ���- Durango.( .� ����� ������ ����11��� ��� ,����� ���� � � 2013 Tarcoola Shopping Centers GmbH ����
���� ���� ,����� � ���� ���� � �� ��� ����� ��� ������� ����� ��� �� ������ ����� ,�� ������� ��� ������� ����� ��� �� � ��� ������� �������2014.
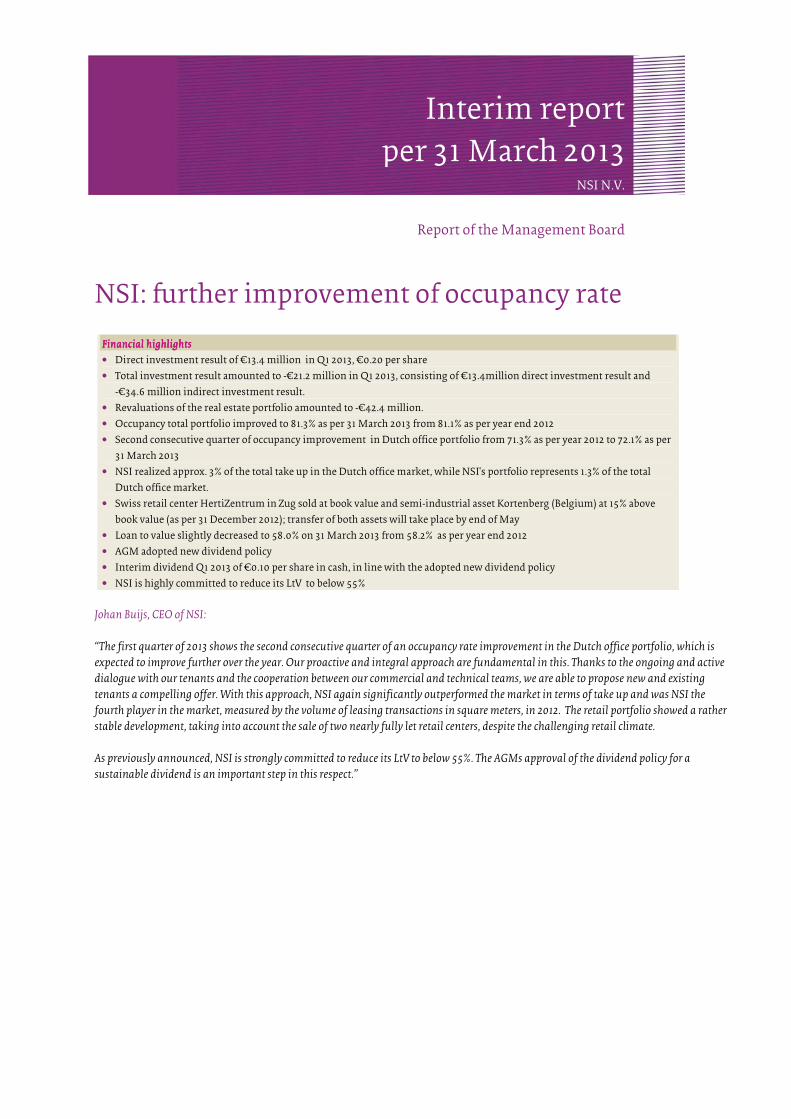
��
Interim report
per 31 March 2013NSI N.V.
Report of the Management Board
NSI: further improvement of occupancy rate
Financial highlights Financial highlights Financial highlights Financial highlights
• Direct investment result of €13.4 million in Q1 2013, €0.20 per share
• Total investment result amounted to -€21.2 million in Q1 2013, consisting of €13.4million direct investment result and
-€34.6 million indirect investment result.
• Revaluations of the real estate portfolio amounted to -€42.4 million.
• Occupancy total portfolio improved to 81.3% as per 31 March 2013 from 81.1% as per year end 2012
• Second consecutive quarter of occupancy improvement in Dutch office portfolio from 71.3% as per year 2012 to 72.1% as per
31 March 2013
• NSI realized approx. 3% of the total take up in the Dutch office market, while NSI's portfolio represents 1.3% of the total
Dutch office market.
• Swiss retail center HertiZentrum in Zug sold at book value and semi-industrial asset Kortenberg (Belgium) at 15% above
book value (as per 31 December 2012); transfer of both assets will take place by end of May
• Loan to value slightly decreased to 58.0% on 31 March 2013 from 58.2% as per year end 2012
• AGM adopted new dividend policy
• Interim dividend Q1 2013 of €0.10 per share in cash, in line with the adopted new dividend policy
• NSI is highly committed to reduce its LtV to below 55%
Johan Buijs, CEO of NSI:
“The first quarter of 2013 shows the second consecutive quarter of an occupancy rate improvement in the Dutch office portfolio, which is
expected to improve further over the year. Our proactive and integral approach are fundamental in this. Thanks to the ongoing and active
dialogue with our tenants and the cooperation between our commercial and technical teams, we are able to propose new and existing
tenants a compelling offer. With this approach, NSI again significantly outperformed the market in terms of take up and was NSI the
fourth player in the market, measured by the volume of leasing transactions in square meters, in 2012. The retail portfolio showed a rather
stable development, taking into account the sale of two nearly fully let retail centers, despite the challenging retail climate.
As previously announced, NSI is strongly committed to reduce its LtV to below 55%. The AGMs approval of the dividend policy for a
sustainable dividend is an important step in this respect.”
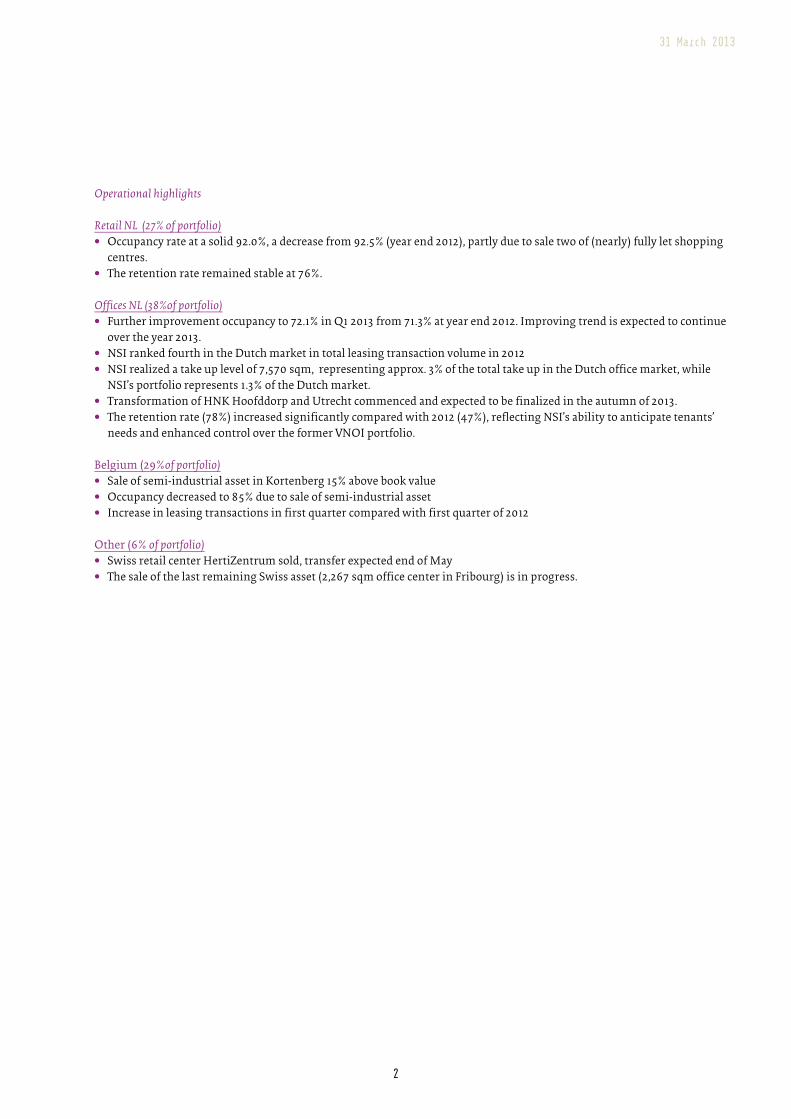
31 March 2013
� 2
Operational highlights
Retail NL (27% of portfolio)
• Occupancy rate at a solid 92.0%, a decrease from 92.5% (year end 2012), partly due to sale two of (nearly) fully let shopping
centres.
• The retention rate remained stable at 76%.
Offices NL (38%of portfolio)
• Further improvement occupancy to 72.1% in Q1 2013 from 71.3% at year end 2012. Improving trend is expected to continue
over the year 2013.
• NSI ranked fourth in the Dutch market in total leasing transaction volume in 2012
• NSI realized a take up level of 7,570 sqm, representing approx. 3% of the total take up in the Dutch office market, while
NSI’s portfolio represents 1.3% of the Dutch market.
• Transformation of HNK Hoofddorp and Utrecht commenced and expected to be finalized in the autumn of 2013.� • The retention rate (78%) increased significantly compared with 2012 (47%), reflecting NSI’s ability to anticipate tenants’
needs and enhanced control over the former VNOI portfolio.
Belgium (29%of portfolio)
• Sale of semi-industrial asset in Kortenberg 15% above book value
• Occupancy decreased to 85% due to sale of semi-industrial asset
• Increase in leasing transactions in first quarter compared with first quarter of 2012
Other (6% of portfolio)
• Swiss retail center HertiZentrum sold, transfer expected end of May
• The sale of the last remaining Swiss asset (2,267 sqm office center in Fribourg) is in progress.
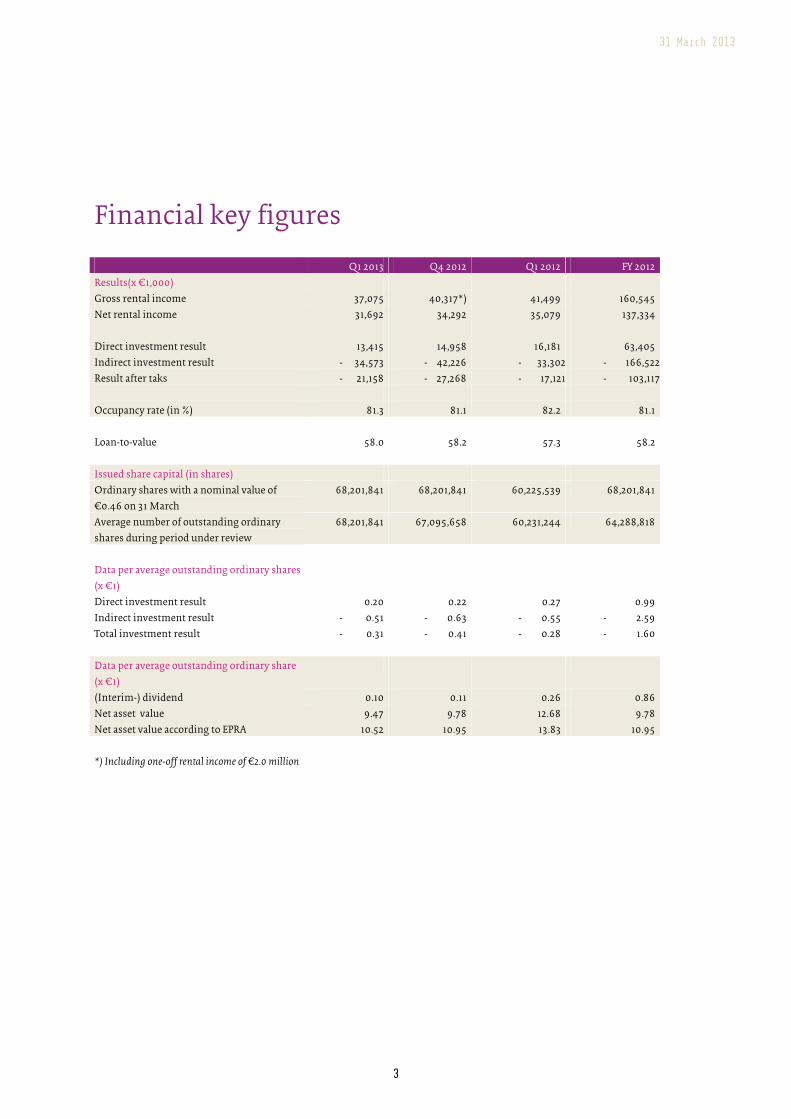
31 March 2013
� 3
Financial key figures
Q1 2013 Q4 2012 Q1 2012 FY 2012
Results(x €1,000)
Gross rental income 37,075 40,317*) 41,499 160,545
Net rental income 31,692 34,292 35,079 137,334
Direct investment result 13,415 14,958 16,181 63,405
Indirect investment result - 34,573 - 42,226 - 33,302 - 166,522
Result after taks - 21,158 - 27,268 - 17,121 - 103,117
Occupancy rate (in %) 81.3 81.1 82.2 81.1
Loan-to-value 58.0 58.2 57.3 58.2
Issued share capital (in shares)
Ordinary shares with a nominal value of
€0.46 on 31 March
68,201,841 68,201,841 60,225,539 68,201,841
Average number of outstanding ordinary
shares during period under review
68,201,841 67,095,658 60,231,244 64,288,818
Data per average outstanding ordinary shares
(x €1)
Direct investment result 0.20 0.22 0.27 0.99
Indirect investment result - 0.51 - 0.63 - 0.55 - 2.59
Total investment result - 0.31 - 0.41 - 0.28 - 1.60
Data per average outstanding ordinary share
(x €1)
(Interim-) dividend 0.10 0.11 0.26 0.86
Net asset value 9.47 9.78 12.68 9.78
Net asset value according to EPRA 10.52 10.95 13.83 10.95
� � � � �*) Including one-off rental income of €2.0 million � � �

31 March 2013
� 4
Outlook 2013
The economic environment remains challenging in 2013. The macro-economic indicators are pointing towards negative
economic growth in the Netherlands in 2013, and no recovery until 2014. In this environment, the distinctive and
operationally strong approach of NSIs remains, even more, crucial.
In 2013, NSI will specifically focus on:
Organisation
• NSI expands its Board of Management with a COO to further strengthen its active and innovative management of the
portfolio, in line with its strategic focus on operational excellence and creating a ‘best in class’ leasing platform. NSI
announced its intention to appoint Mark Siezen as COO as per 1 July 2013, subject to a yet to convene Extraordinary
General Meeting.
Offices:
• Further improvement of the occupancy in the office portfolio over the year in 2013. As a result of proactive management of
the expiration calendar in the previous years, only 11% (in value) of the contracts can expire in 2013, which will support the
improvement of the occupancy level.
• Further roll out of the HNK concept. NSI has commenced the conversion of two assets; in Utrecht and in Hoofddorp, to be
finalized in autumn 2013. The planned investment is approx. €2.3million.
• Through different business concepts and propositions, NSI aims to sustain the effective rent level, or even increase its
effective rent level by providing additional services and flexibility, like in the HNK concept.
Retail:
• NSI will continue to actively pursue the right mix in branches, including a further increase of the presence of
supermarkets.
Strategic focus:
• NSI will continue its disposal strategy of non-core assets and assets of which the value potential under NSI’s management
has been optimised. The sale of the last Swiss asset is in progress. Proceeds of asset sales will be used to strengthen the
balance sheet.
�Financing:
• NSI continues to work diligently on its refinancing requirements, including refinancing €186.3 million of debt that will
expire in 2013. NSIs largest syndicated loan facility (€243 million outstanding debt), maturing in 2013 and 2014 and
reflecting the majority of the debt maturing in 2013, is in an advanced stage of negotiation. In general, bank margins and
financings costs are increasing which will translate into higher financing costs in 2013 compared to 2012.
• NSI is highly committed to reduce its LtV to below 55% NSI expects for 2013 that the occupancy will continue to improve over the year, which will however not directly translate into higher financial results. Moreover, NSI will face higher financing costs and outflow of rental income of assets sold. As previously announced, NSI expects a direct result for the full year 2013 in the range of €50 to €56 million
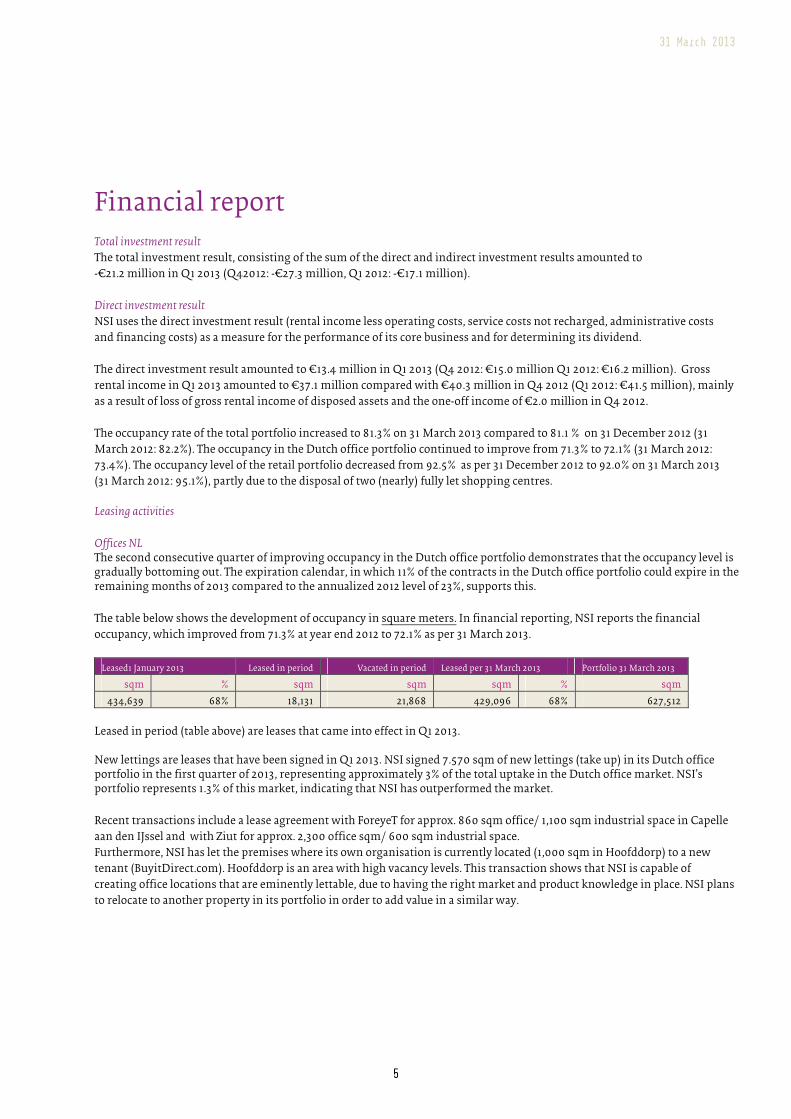
31 March 2013
� 5
Financial report
Total investment result
The total investment result, consisting of the sum of the direct and indirect investment results amounted to
-€21.2 million in Q1 2013 (Q42012: -€27.3 million, Q1 2012: -€17.1 million).
Direct investment result
NSI uses the direct investment result (rental income less operating costs, service costs not recharged, administrative costs
and financing costs) as a measure for the performance of its core business and for determining its dividend.
The direct investment result amounted to €13.4 million in Q1 2013 (Q4 2012: €15.0 million Q1 2012: €16.2 million). Gross
rental income in Q1 2013 amounted to €37.1 million compared with €40.3 million in Q4 2012 (Q1 2012: €41.5 million), mainly
as a result of loss of gross rental income of disposed assets and the one-off income of €2.0 million in Q4 2012.
The occupancy rate of the total portfolio increased to 81.3% on 31 March 2013 compared to 81.1 % on 31 December 2012 (31
March 2012: 82.2%). The occupancy in the Dutch office portfolio continued to improve from 71.3% to 72.1% (31 March 2012:
73.4%). The occupancy level of the retail portfolio decreased from 92.5% as per 31 December 2012 to 92.0% on 31 March 2013
(31 March 2012: 95.1%), partly due to the disposal of two (nearly) fully let shopping centres.
Leasing activities
Offices NL The second consecutive quarter of improving occupancy in the Dutch office portfolio demonstrates that the occupancy level is gradually bottoming out. The expiration calendar, in which 11% of the contracts in the Dutch office portfolio could expire in the remaining months of 2013 compared to the annualized 2012 level of 23%, supports this.
The table below shows the development of occupancy in square meters. In financial reporting, NSI reports the financial
occupancy, which improved from 71.3% at year end 2012 to 72.1% as per 31 March 2013.
Leased1 January 2013 Leased in period Vacated in period Leased per 31 March 2013 Portfolio 31 March 2013
sqm % sqm sqm sqm % sqm
434,639 68% 18,131 21,868 429,096 68% 627,512
Leased in period (table above) are leases that came into effect in Q1 2013. New lettings are leases that have been signed in Q1 2013. NSI signed 7.570 sqm of new lettings (take up) in its Dutch office portfolio in the first quarter of 2013, representing approximately 3% of the total uptake in the Dutch office market. NSI’s portfolio represents 1.3% of this market, indicating that NSI has outperformed the market.
Recent transactions include a lease agreement with ForeyeT for approx. 860 sqm office/ 1,100 sqm industrial space in Capelle
aan den IJssel and with Ziut for approx. 2,300 office sqm/ 600 sqm industrial space.
Furthermore, NSI has let the premises where its own organisation is currently located (1,000 sqm in Hoofddorp) to a new
tenant (BuyitDirect.com). Hoofddorp is an area with high vacancy levels. This transaction shows that NSI is capable of
creating office locations that are eminently lettable, due to having the right market and product knowledge in place. NSI plans
to relocate to another property in its portfolio in order to add value in a similar way.
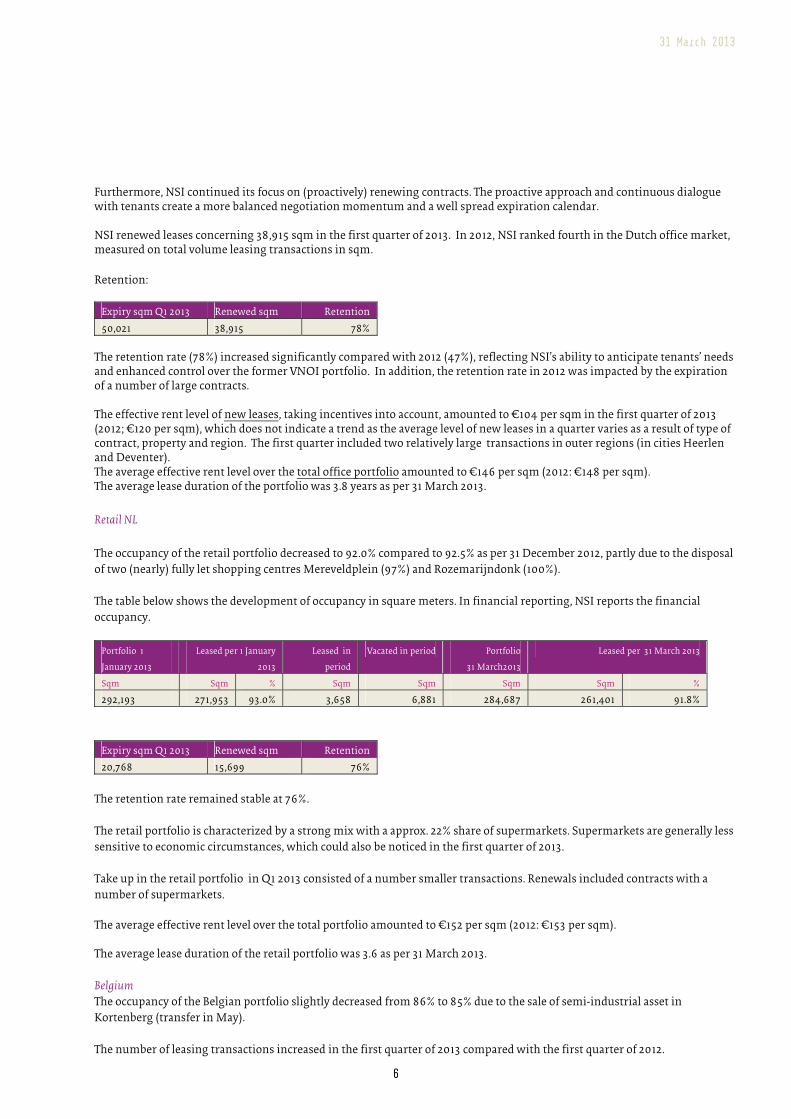
31 March 2013
� 6
Furthermore, NSI continued its focus on (proactively) renewing contracts. The proactive approach and continuous dialogue with tenants create a more balanced negotiation momentum and a well spread expiration calendar. NSI renewed leases concerning 38,915 sqm in the first quarter of 2013. In 2012, NSI ranked fourth in the Dutch office market, measured on total volume leasing transactions in sqm.
Retention:
Expiry sqm Q1 2013 Renewed sqm Retention
50,021 38,915 78%
The retention rate (78%) increased significantly compared with 2012 (47%), reflecting NSI’s ability to anticipate tenants’ needs and enhanced control over the former VNOI portfolio. In addition, the retention rate in 2012 was impacted by the expiration of a number of large contracts. The effective rent level of new leases, taking incentives into account, amounted to €104 per sqm in the first quarter of 2013 (2012; €120 per sqm), which does not indicate a trend as the average level of new leases in a quarter varies as a result of type of contract, property and region. The first quarter included two relatively large transactions in outer regions (in cities Heerlen and Deventer). The average effective rent level over the total office portfolio amounted to €146 per sqm (2012: €148 per sqm). The average lease duration of the portfolio was 3.8 years as per 31 March 2013.
Retail NL
The occupancy of the retail portfolio decreased to 92.0% compared to 92.5% as per 31 December 2012, partly due to the disposal
of two (nearly) fully let shopping centres Mereveldplein (97%) and Rozemarijndonk (100%).
The table below shows the development of occupancy in square meters. In financial reporting, NSI reports the financial
occupancy.
�Portfolio 1
January 2013
Leased per 1 January
2013
Leased in
period
Vacated in period Portfolio
31 March2013
Leased per 31 March 2013
Sqm Sqm % Sqm Sqm Sqm Sqm %
292,193 271,953 93.0% 3,658 6,881 284,687 261,401 91.8%
�
Expiry sqm Q1 2013 Renewed sqm Retention
20,768 15,699 76%
The retention rate remained stable at 76%.
The retail portfolio is characterized by a strong mix with a approx. 22% share of supermarkets. Supermarkets are generally less
sensitive to economic circumstances, which could also be noticed in the first quarter of 2013.
Take up in the retail portfolio in Q1 2013 consisted of a number smaller transactions. Renewals included contracts with a
number of supermarkets.
The average effective rent level over the total portfolio amounted to €152 per sqm (2012: €153 per sqm). The average lease duration of the retail portfolio was 3.6 as per 31 March 2013.
Belgium
The occupancy of the Belgian portfolio slightly decreased from 86% to 85% due to the sale of semi-industrial asset in
Kortenberg (transfer in May).
The number of leasing transactions increased in the first quarter of 2013 compared with the first quarter of 2012.
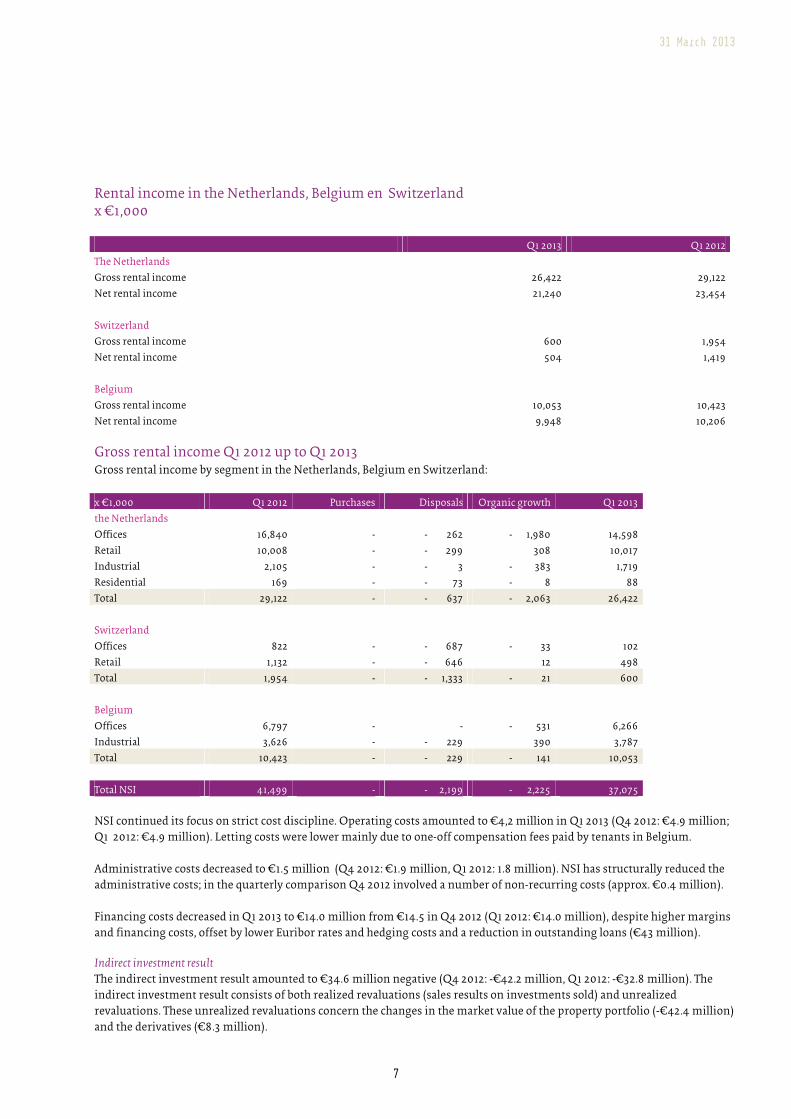
31 March 2013
� 7
Rental income in the Netherlands, Belgium en Switzerland x €1,000
Q1 2013 Q1 2012
The Netherlands
Gross rental income 26,422 29,122
Net rental income 21,240 23,454
Switzerland
Gross rental income 600 1,954
Net rental income 504 1,419
Belgium
Gross rental income 10,053 10,423
Net rental income 9,948 10,206
Gross rental income Q1 2012 up to Q1 2013 Gross rental income by segment in the Netherlands, Belgium en Switzerland:
x €1,000 Q1 2012 Purchases Disposals Organic growth Q1 2013
the Netherlands
Offices 16,840 - - 262 - 1,980 14,598
Retail 10,008 - - 299 308 10,017
Industrial 2,105 - - 3 - 383 1,719
Residential 169 - - 73 - 8 88
Total 29,122 - - 637 - 2,063 26,422
Switzerland
Offices 822 - - 687 - 33 102
Retail 1,132 - - 646 12 498
Total 1,954 - - 1,333 - 21 600
Belgium
Offices 6,797 - - - 531 6,266
Industrial 3,626 - - 229 390 3,787
Total 10,423 - - 229 - 141 10,053
Total NSI 41,499 - - 2,199 - 2,225 37,075
NSI continued its focus on strict cost discipline. Operating costs amounted to €4,2 million in Q1 2013 (Q4 2012: €4.9 million;
Q1 2012: €4.9 million). Letting costs were lower mainly due to one-off compensation fees paid by tenants in Belgium.
Administrative costs decreased to €1.5 million (Q4 2012: €1.9 million, Q1 2012: 1.8 million). NSI has structurally reduced the
administrative costs; in the quarterly comparison Q4 2012 involved a number of non-recurring costs (approx. €0.4 million).
Financing costs decreased in Q1 2013 to €14.0 million from €14.5 in Q4 2012 (Q1 2012: €14.0 million), despite higher margins
and financing costs, offset by lower Euribor rates and hedging costs and a reduction in outstanding loans (€43 million).
Indirect investment result
The indirect investment result amounted to €34.6 million negative (Q4 2012: -€42.2 million, Q1 2012: -€32.8 million). The
indirect investment result consists of both realized revaluations (sales results on investments sold) and unrealized
revaluations. These unrealized revaluations concern the changes in the market value of the property portfolio (-€42.4 million)
and the derivatives (€8.3 million).
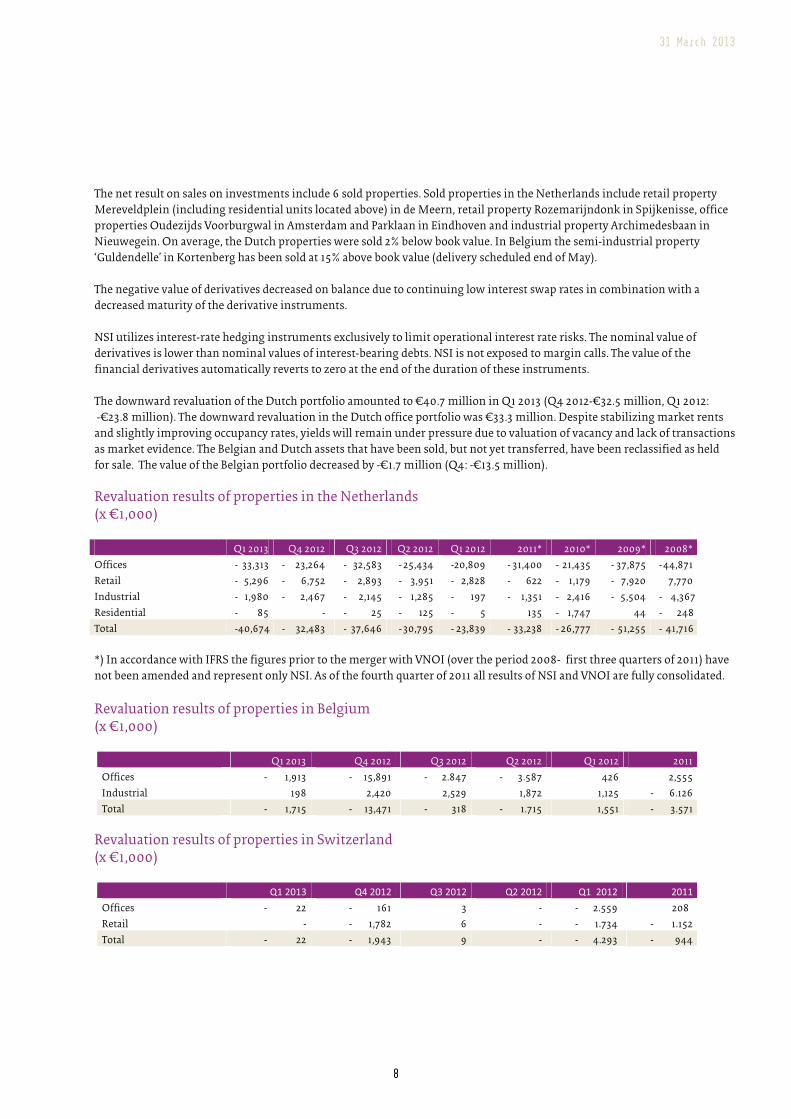
31 March 2013
� 8
The net result on sales on investments include 6 sold properties. Sold properties in the Netherlands include retail property
Mereveldplein (including residential units located above) in de Meern, retail property Rozemarijndonk in Spijkenisse, office
properties Oudezijds Voorburgwal in Amsterdam and Parklaan in Eindhoven and industrial property Archimedesbaan in
Nieuwegein. On average, the Dutch properties were sold 2% below book value. In Belgium the semi-industrial property
‘Guldendelle’ in Kortenberg has been sold at 15% above book value (delivery scheduled end of May).
The negative value of derivatives decreased on balance due to continuing low interest swap rates in combination with a
decreased maturity of the derivative instruments.
NSI utilizes interest-rate hedging instruments exclusively to limit operational interest rate risks. The nominal value of
derivatives is lower than nominal values of interest-bearing debts. NSI is not exposed to margin calls. The value of the
financial derivatives automatically reverts to zero at the end of the duration of these instruments.
The downward revaluation of the Dutch portfolio amounted to €40.7 million in Q1 2013 (Q4 2012-€32.5 million, Q1 2012:
-€23.8 million). The downward revaluation in the Dutch office portfolio was €33.3 million. Despite stabilizing market rents
and slightly improving occupancy rates, yields will remain under pressure due to valuation of vacancy and lack of transactions
as market evidence. The Belgian and Dutch assets that have been sold, but not yet transferred, have been reclassified as held
for sale. The value of the Belgian portfolio decreased by -€1.7 million (Q4: -€13.5 million).
Revaluation results of properties in the Netherlands (x €1,000)
Q1 2013 Q4 2012 Q3 2012 Q2 2012 Q1 2012 2011* 2010* 2009* 2008*
Offices - 33,313 - 23,264 - 32,583 - 25,434 -20,809 - 31,400 - 21,435 - 37,875 - 44,871
Retail - 5,296 - 6,752 - 2,893 - 3,951 - 2,828 - 622 - 1,179 - 7,920 7,770
Industrial - 1,980 - 2,467 - 2,145 - 1,285 - 197 - 1,351 - 2,416 - 5,504 - 4,367
Residential - 85 - - 25 - 125 - 5 135 - 1,747 44 - 248
Total -40,674 - 32,483 - 37,646 - 30,795 - 23,839 - 33,238 - 26,777 - 51,255 - 41,716
*) In accordance with IFRS the figures prior to the merger with VNOI (over the period 2008- first three quarters of 2011) have
not been amended and represent only NSI. As of the fourth quarter of 2011 all results of NSI and VNOI are fully consolidated.
Revaluation results of properties in Belgium (x €1,000)
Q1 2013 Q4 2012 Q3 2012 Q2 2012 Q1 2012 2011
Offices - 1,913 - 15,891 - 2.847 - 3.587 426 2,555
Industrial 198 2,420 2,529 1,872 1,125 - 6.126
Total - 1,715 - 13,471 - 318 - 1.715 1,551 - 3.571
Revaluation results of properties in Switzerland (x €1,000)
� �������� �������� �������� �������� ��������� �����Offices - 22 - 161 3 - - 2.559 208
Retail - - 1,782 6 - - 1.734 - 1.152
Total - 22 - 1,943 9 - - 4.293 - 944

31 March 2013
� 9
Yields in % at 31 March 2013 and 31 December 2012
gross yield*
31-03-2013
net yield**
31-03-2013
gross yield*
31-12-2012
net yield**
31-12-2012
Offices 10.4 8.6 10.3 8.6
Retail 7.9 7.0 7.8 6.7
Industrial 9.1 8.1 9.1 8.3
Residential 7.8 6.4 7.2 6.8
Total 9.5 8.1 9.4 8.0
* gross yield: the theoretical annual rent expressed as a percentage of the market value of the property.
** net yield: . the theoretical net rental income expressed as a percentage of the market value of the property.
gross yield*
31-03-2013
net yield**
31-03-2013
gross yield*
31-12-2012
net yield**
31-12-2012
The Netherlands 9.8 8.3 9.6 8.3
Switzerland 7.4 6.2 7.3 5.3
Belgium 8.9 8.8 9.0 8.7
Total 9.5 8.1 9.4 8.0
Balance sheet and financing The value of the real estate investments amounted to €2,039.7 million on 31 March 2013 (31 December 2012: €2,106.1 million).
This is the result of the balance of investments, disposals and revaluations.
The loan-to-value decreased to 58.0% at 31 March 2013 (year end 2012: 58.2%). NSI is highly committed to reduce its LtV (loan-
to-value) to below 55% and will continue to reduce its LtV by disposing non-core assets.
Debts to credit institutions amounted to €1,183.2 million as per 31 March 2013 (year end 2012: €1,226.4 million), reflecting a
€43 million debt repayment. NSI continues to work diligently on its refinancing requirements and improving its debt
maturity. Approx. €186.3 million will expire in 2013. Part of the 2013 refinancing requirement (€258.5 million) was already
covered in 2012 refinancing agreements. A €242 million syndicated loan facility, maturing in 2013 and 2014 and reflecting the
majority of the debt maturing in 2013, is in an advanced stage of negotiation
Equity NSI’s equity decreased to €771.8 million (31 December 2012: €789.8 million) as the result of the negative total investment
result in Q1 2013 of €21.2 million.
�The number of outstanding shares remained unchanged in the first quarter. The net asset value, including deferred tax and
the market value of the derivatives, amounted to €9.47 per share on 31 March 2013 (31 December 2012: €9.78). If the deferred
tax and the value of the derivatives are excluded (the net asset value according to EPRA), the net asset value amounts to €10.52
per share (31 December 2012: €10.95).
Financial ratios The funding available to the company under the credit facilities committed as at 31 March 2013 amounted to €84.0 million (31
December 2012: €71.3 million). NSI reduced it debts to credit institutions from €1,226.4 million as per 31 December 2012 to
€1,183.2 million as per 31 March 2013.
The average remaining maturity of the loans decreased from 2.3 years as per ultim0 2012 to 2.1 years as per 31 March 2013. The
variable interest part or the mortgaged loans decreased from 4.5% (ultimo 2012) to 3.1% as per 31 March 2013.

31 March 2013
� 10
Due to a higher awareness of financing partners in relation to real estate related risks, in combination with the overall
economic situation and changing regulations (Basel III/ Solvency II), NSI notes a general decreased availability of real estate
financing in the market. Processes of refinancing take materially longer to complete. Margins and costs have been rising
substantially since the beginning of the crisis as a result of before-mentioned trends. Loan covenants tend to become more
restrictive and are more diligently monitored to the effects of real estate valuations, property sales and development in
vacancy rates.
Average costs of debt funding increased from 4.8% (ultimo 2012)to 5.0%, mainly due to the refinancing of low interest loans at
higher margins that come into effect. This is based on the current – increased- interest margins by quarter end, which does
not reflect the average interest margin for the period. As a result of reduction in outstanding debt, the total financing costs
decreased. The interest coverage ratio amounted to 2.3 as per 31 March 2013 (ultimo 2012: 2.5)
Interim-dividend Q1 2013 The Annual General Meeting of Shareholders, held on 26 April 2013, adopted the new dividend policy. In line with this new
dividend policy, the Q1 interim dividend amounts to €0.10 per share in cash, which reflects a pay out of 50% of the direct
result, in accordance with the defined pay out at the current LtV level (58.0%)
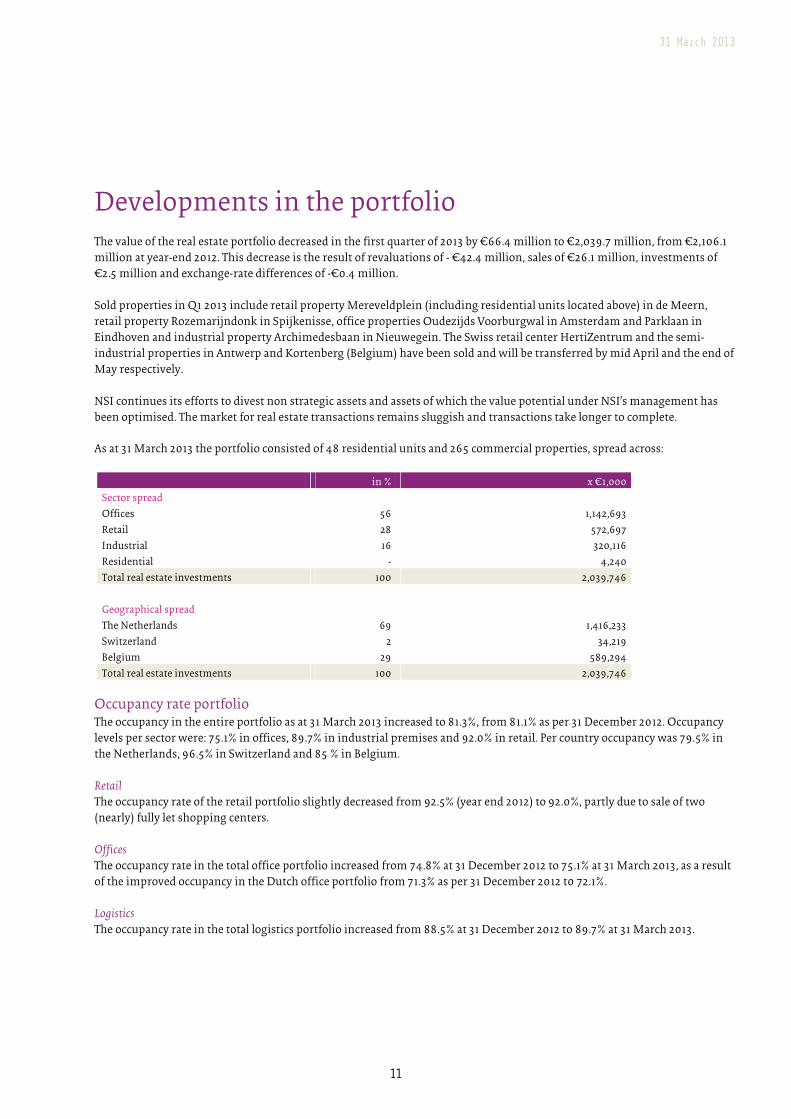
31 March 2013
� 11
Developments in the portfolio
The value of the real estate portfolio decreased in the first quarter of 2013 by €66.4 million to €2,039.7 million, from €2,106.1
million at year-end 2012. This decrease is the result of revaluations of - €42.4 million, sales of €26.1 million, investments of
€2.5 million and exchange-rate differences of -€0.4 million.
Sold properties in Q1 2013 include retail property Mereveldplein (including residential units located above) in de Meern,
retail property Rozemarijndonk in Spijkenisse, office properties Oudezijds Voorburgwal in Amsterdam and Parklaan in
Eindhoven and industrial property Archimedesbaan in Nieuwegein. The Swiss retail center HertiZentrum and the semi-
industrial properties in Antwerp and Kortenberg (Belgium) have been sold and will be transferred by mid April and the end of
May respectively.
NSI continues its efforts to divest non strategic assets and assets of which the value potential under NSI’s management has
been optimised. The market for real estate transactions remains sluggish and transactions take longer to complete.
As at 31 March 2013 the portfolio consisted of 48 residential units and 265 commercial properties, spread across:
in % x €1,000
Sector spread
Offices 56 1,142,693
Retail 28 572,697
Industrial 16 320,116
Residential - 4,240
Total real estate investments 100 2,039,746
Geographical spread
The Netherlands 69 1,416,233
Switzerland 2 34,219
Belgium 29 589,294
Total real estate investments 100 2,039,746
Occupancy rate portfolio The occupancy in the entire portfolio as at 31 March 2013 increased to 81.3%, from 81.1% as per 31 December 2012. Occupancy
levels per sector were: 75.1% in offices, 89.7% in industrial premises and 92.0% in retail. Per country occupancy was 79.5% in
the Netherlands, 96.5% in Switzerland and 85 % in Belgium.
Retail
The occupancy rate of the retail portfolio slightly decreased from 92.5% (year end 2012) to 92.0%, partly due to sale of two
(nearly) fully let shopping centers.
Offices
The occupancy rate in the total office portfolio increased from 74.8% at 31 December 2012 to 75.1% at 31 March 2013, as a result
of the improved occupancy in the Dutch office portfolio from 71.3% as per 31 December 2012 t0 72.1%.
Logistics
The occupancy rate in the total logistics portfolio increased from 88.5% at 31 December 2012 to 89.7% at 31 March 2013.
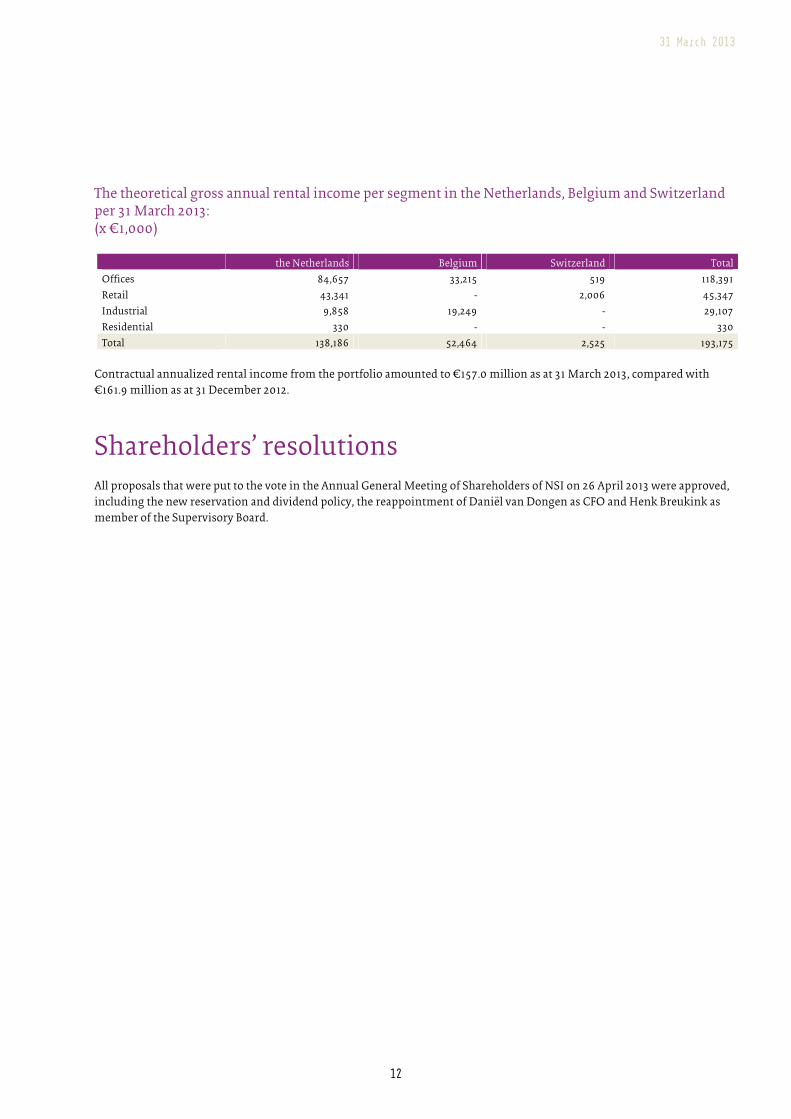
31 March 2013
� 12
The theoretical gross annual rental income per segment in the Netherlands, Belgium and Switzerland per 31 March 2013: (x €1,000)
the Netherlands Belgium Switzerland Total
Offices 84,657 33,215 519 118,391
Retail 43,341 - 2,006 45,347
Industrial 9,858 19,249 - 29,107
Residential 330 - - 330
Total 138,186 52,464 2,525 193,175
Contractual annualized rental income from the portfolio amounted to €157.0 million as at 31 March 2013, compared with
€161.9 million as at 31 December 2012.
Shareholders’ resolutions
All proposals that were put to the vote in the Annual General Meeting of Shareholders of NSI on 26 April 2013 were approved,
including the new reservation and dividend policy, the reappointment of Daniël van Dongen as CFO and Henk Breukink as
member of the Supervisory Board.
� �
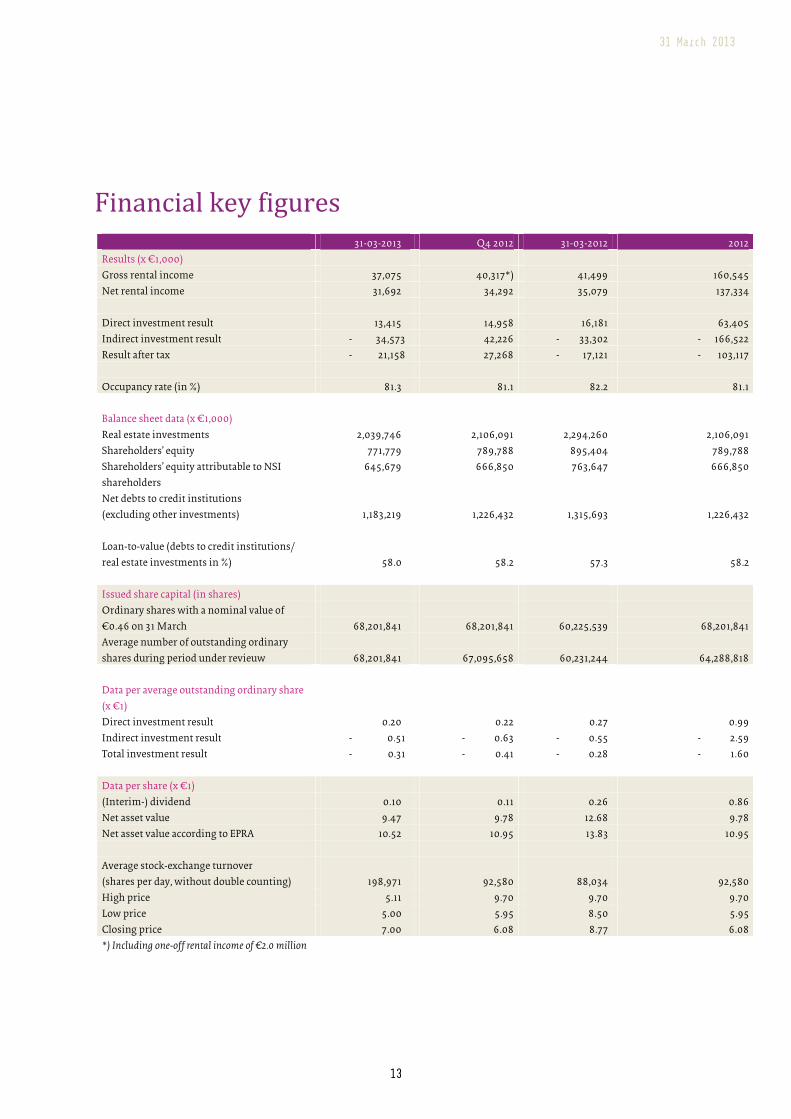
31 March 2013
� 13
�������������� �����
31-03-2013 Q4 2012 31-03-2012 2012
Results (x €1,000)
Gross rental income 37,075 40,317*) 41,499 160,545
Net rental income 31,692 34,292 35,079 137,334
Direct investment result 13,415 14,958 16,181 63,405
Indirect investment result - 34,573 42,226 - 33,302 - 166,522
Result after tax - 21,158 27,268 - 17,121 - 103,117
Occupancy rate (in %) 81.3 81.1 82.2 81.1
Balance sheet data (x €1,000)
Real estate investments 2,039,746 2,106,091 2,294,260 2,106,091
Shareholders’ equity 771,779 789,788 895,404 789,788
Shareholders’ equity attributable to NSI
shareholders
645,679 666,850 763,647 666,850
Net debts to credit institutions
(excluding other investments)
1,183,219
1,226,432
1,315,693
1,226,432
Loan-to-value (debts to credit institutions/
real estate investments in %)
58.0
58.2
57.3
58.2
Issued share capital (in shares)
Ordinary shares with a nominal value of
€0.46 on 31 March
68,201,841
68,201,841
60,225,539
68,201,841
Average number of outstanding ordinary
shares during period under revieuw
68,201,841
67,095,658
60,231,244
64,288,818
Data per average outstanding ordinary share
(x €1)
Direct investment result 0.20 0.22 0.27 0.99
Indirect investment result - 0.51 - 0.63 - 0.55 - 2.59
Total investment result - 0.31 - 0.41 - 0.28 - 1.60
Data per share (x €1)
(Interim-) dividend 0.10 0.11 0.26 0.86
Net asset value 9.47 9.78 12.68 9.78
Net asset value according to EPRA 10.52 10.95 13.83 10.95
Average stock-exchange turnover
(shares per day, without double counting)
198,971
92,580
88,034
92,580
High price 5.11 9.70 9.70 9.70
Low price 5.00 5.95 8.50 5.95
Closing price 7.00 6.08 8.77 6.08
*) Including one-off rental income of €2.0 million� � � � �

31 March 2013
� 14
Geconsolidated direct en indirect Investment result (x €1,000)
1st quarter 2013 1st quarter 2012
Gross rental income 37,075 41,499
Service costs not recharged to tenants - 1,136 - 1,482
Operating costs - 4,247 - 4,938
Net rental income 31,692 35,079
Financing income 108 28
Financing costs - 13,967 - 14,007
Administrative costs - 1,525 - 1,816
Direct investment result before tax 16,308 19,284
Corporate income tax - 17 - 80
Direct investment result after tax 16,291 19,204
Direct investment results attributable to non-controlling interest - 2,876 - 3,023
Direct investment result 13,415 16,181
Revaluation of real estate investments - 42,411 - 26,581
Elimination of rental incentives 47 - 293
Net result on sales of real estate investments 361 -
Movements in market value of financial derivatives 8,344 - 4,799
Exchange-rate differences 8 - 523
Allocated management costs - 636 - 581
Indirect investment result before tax - 34,287 - 32,777
Corporate income tax - - 193
Indirect investment result after tax - 34,287 - 32,970
Indirect investment result attributable to non-controlling interest - 286 - 332
Indirect investment result - 34,573 - 33,302
Total investment result - 21,158 - 17,121
Data per average outstanding share (x €1)
Direct investment result 0.20 0.27
Indirect investment result - 0.51 - 0.55
Total investment result - 0.31 - 0.28

31 March 2013
� 15
Condensed consolidated interim financial information

31 March 2013
� 16
Consolidated statement of comprehensive income (x €1,000)
note Q1 2013 Q1 2012
Gross rental income 37,075 41,499
Service costs recharged to tenants 5,733 5,684
Service costs - 6,869 - 7,166
Service costs not recharged - 1,136 - 1,482
Operating costs 4 - 4,247 - 4,938
Net rental income 2 31,692 35,079
Revaluation of investments - 42,364 - 26,874
Net result on sales of investments 5 361 -
Total net proceeds from
investments
- 10,311 8,205
Administrative costs 6 - 2,161 - 2,397
Financing income 116 28
Financing costs - 13,967 - 14,530
Movements in market value of
financial derivatives
8,344
- 4,799
Net financing result - 5,507 - 19,301
Result before tax - 17,979 - 13,493
Corporate income tax 13 - 17 - 273
Result after tax - 17,996 - 13,766
Exchange-rate difference on
foreign participations
- 5 52
Total non-realised result - 5 52
Total realised and non-realised
result
- 18,001 - 13,714
Result after tax attributable to:
NSI shareholders - 21,158 - 17,121
Non-controlling interest 3,162 3,355
Result after tax - 17,996 - 13,766
Total realised and non-realised
result attributable to:
NSI shareholders - 21,163 - 17,069
Non-controlling interest 3,162 3,355
Total comprehensive income - 18,001 - 13,714
Data per average outstanding
share (x €1)
Diluted as well as non-diluted
result after tax
- 0.31 - 0.28
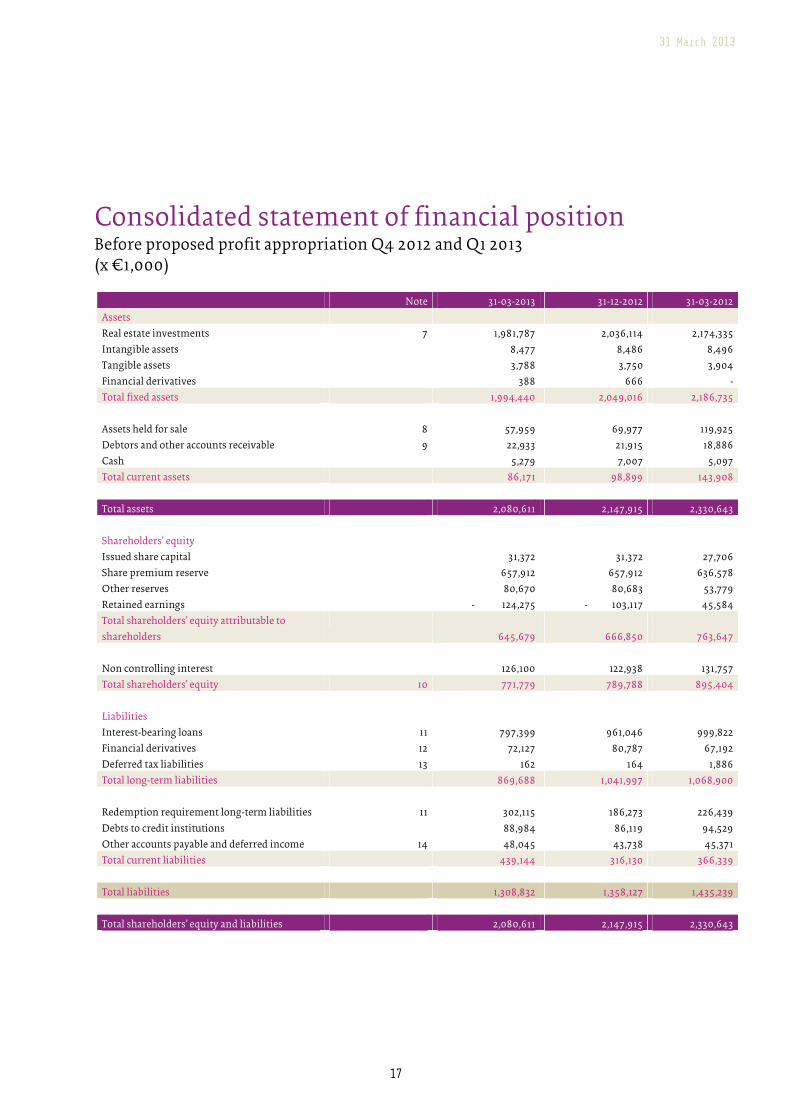
31 March 2013
� 17
Consolidated statement of financial position Before proposed profit appropriation Q4 2012 and Q1 2013 (x €1,000)
Note 31-03-2013 31-12-2012 31-03-2012
Assets
Real estate investments 7 1,981,787 2,036,114 2,174,335
Intangible assets 8,477 8,486 8,496
Tangible assets 3,788 3,750 3,904
Financial derivatives 388 666 -
Total fixed assets 1,994,440 2,049,016 2,186,735
Assets held for sale 8 57,959 69,977 119,925
Debtors and other accounts receivable 9 22,933 21,915 18,886
Cash 5,279 7,007 5,097
Total current assets 86,171 98,899 143,908
Total assets 2,080,611 2,147,915 2,330,643
Shareholders’ equity
Issued share capital 31,372 31,372 27,706
Share premium reserve 657,912 657,912 636,578
Other reserves 80,670 80,683 53,779
Retained earnings - 124,275 - 103,117 45,584
Total shareholders’ equity attributable to
shareholders
645,679
666,850
763,647
Non controlling interest 126,100 122,938 131,757
Total shareholders’ equity 10 771,779 789,788 895,404
Liabilities
Interest-bearing loans 11 797,399 961,046 999,822
Financial derivatives 12 72,127 80,787 67,192
Deferred tax liabilities 13 162 164 1,886
Total long-term liabilities 869,688 1,041,997 1,068,900
Redemption requirement long-term liabilities 11 302,115 186,273 226,439
Debts to credit institutions 88,984 86,119 94,529
Other accounts payable and deferred income 14 48,045 43,738 45,371
Total current liabilities 439,144 316,130 366,339
Total liabilities 1,308,832 1,358,127 1,435,239
Total shareholders’ equity and liabilities 2,080,611 2,147,915 2,330,643

31 March 2013
� 18
Consolidated cash flow statement (x €1,000)
note 31-03-2013 31-03-2012
Result after tax - 17,996 - 13,766
Adjusted for:
Revaluation of real estate investments 5 42,411 26,581
Net result on sales of investments - 361 -
Net financing expenses 5,507 19,301
Deferred tax liabilities 13 - 193
Depreciation 150 111
Cash flow from operating activities 47,707 46,186
Movements in debtors and other accounts receivable 9 - 1,018 - 4,929
Movements in other liabilities, accrued expenses and
deferred income
3,602 1,497
Financing income 108 28
Financing expenses - 13,300 - 15,446
Cash flow from operations 19,103 13,570
Purchases of real estate and investments in existing
properties
7
- 2,502
- 1,899
Proceeds of sale of real estate investments 26,449 4,005
Investments in tangible fixed assets - 179 - 134
Divestments of tangible fixed assets - 22
Cash flow from investment activities 23,768 1,994
Dividend paid - 8 -
Repurchase of own shares - 502
Drawdown of loans 11 - 754 29,940
Redemption of loans 11 - 46,718 - 64,656
Cash flow from financing activities - 47,480 - 35,218
Net cash flow - 4,609 - 19,654
Exchange-rate differences 16 - 450
Cash and debts to credit institution as of 1 January
- 79,112
- 69,328
Cash and debts to credit institutions as of 31 March
- 83,705
- 89,432

31 March 2013
� 19
Consolidated statement of movements in shareholders’ equity (x €1,000)
The development of the item shareholders’ equity per Q1 2013 was as follows:
Issued share
capital
Share
premium
reserve
Other
reserves
Retained
earnings
Total share-
holders’
equity
attributable
to
shareholders
Non-
controlling
interest
Total share-
holders’
equity
Balance as of 1 January 2013 31,372 657,912 80,683 - 103,117 666,850 122,938 789,788
Result Q1 2013 - - - - 21,158 - 21,158 3,162 - 17,996
Exchange-rate differences on foreign
participations
-
-
- 5
-
- 5
-
- 5
Total realised and non-realised
results Q1 2013
-
-
- 5
- 21,158
- 21,163
3,162
- 18,001
Costs related to optional dividend - - - 8 - - 8 - - 8
Total contributions by and to
shareholders
-
-
- 8
-
- 8
-
- 8
Situation as of 31 March 2013 31,372 657,912 80,670 - 124,275 645,679 126,100 771,779
The development of the item shareholders’ equity per Q1 2012 was as follows:
Issued share
capital
Share
premium
reserve
Other
reserves
Retained
earnings
Total share-
holders’ equity
attributable to
shareholders
Non-
controlling
interest
Total share-
holders’
equity
Balance as of 1 January 2012 27,732 637,054 53,727 62,705 781,218 128,402 909,620
Result Q1 2012 - - - - 17,121 - 17,121 3,355 - 13,766
Exchange-rate differences on foreign
participations
-
-
52
-
52
-
52
Total realised and non-realised results
Q1 2012
-
-
- 52
- 17,121
- 17,069
3,355
- 13,714
Repurchase of own shares - 26 - 476 - - - 502 - 502
Total contributions by and to
shareholders
- 26
- 476
-
-
- 502
-
- 502
Situation as of 31 Mach 2012 27,706 636,578 53,779 45,584 763,647 131,757 895,404

31 March 2013
� 20
Notes to the figures for the first quarter 2013 1. Most important principles for valuation and determination of the result The financial statements of NSI N.V. for the first quarter of 2013 were drawn up in compliance with International Financial
Reporting Standards, IFRS, as approved within the European Union. This report on the first quarter of 2013 has been drawn up
in accordance with IAS 34, ‘Interim Financial Reporting’.
For the most important principles for consolidation, valuation and determination of the result applied in this report, please
refer to the published 2012 financial statements (see www.nsi.nl). The consolidated figures are drawn up on the basis of
historical cost, except for property investments and financial derivatives, which are recognised at fair value. Unless stated
otherwise, the figures are presented in thousands of euros rounded to the nearest thousand.
This report on the first quarter of 2013 was approved by the Management Board and Supervisory Board on 14 May 2013.
The compilation of this interim report in accordance with IFRS requires that the Management Board forms opinions,
estimates and assumptions that affect the application of the accounting principles and the reported figures for assets,
liabilities, income and expenses. The estimates and the related assumptions are based on experience and various other factors
that are considered appropriate. The estimates and underlying assumptions are continually assessed. Revisions to estimates
are wholly included in the period in which the revision is made, if the effect only applies to that period, or in the period in
which the revision is made and future periods, if the effect also applies to future periods.
2. Segment information Below, a summary of the results of each of the reporting segments is included.
Per country the Netherlands Switzerland Belgium Total
Q1 2013 Q1 2012 Q1 2013 Q1 2012 Q1 2013 Q1 2012 Q1 2013 Q1 2012
Gross rental income 26,422 29,122 600 1,954 10,053 10,423 37,075 41,499
Service costs not recharged to
tenants
- 946
- 1,053
-
- 48
- 190
- 381
- 1,136
- 1,482
Operating costs - 4,236 - 4,615 - 96 - 487 85 164 - 4,247 - 4,938
Net rental income 21,240 23,454 504 1,419 9,948 10,206 31,692 35,079
Revaluation results - 40,539 - 24,001 - 22 - 4,293 - 1,803 1,420 - 42,364 - 26,874
Net result on sales - 1,133 - 6 - 1,488 - 361 -
Segment result - 20,432 - 547 488 - 2,874 9,633 11,626 - 10,311 - 8,205
Reconciliation
Administrative costs - 1,199 - 1,322 - 65 - 205 - 897 - 870 - 2,161 - 2,397
Net financing costs - 3,697 - 15,078 - 121 - 678 - 1,689 - 3,545 - 5,507 - 19,301
Result before tax - 25,328 - 16,947 302 - 3,757 7,047 7,211 - 17,979 - 13,493
Corporate income tax - 5 - 2 - - 256 - 12 - 15 - 17 - 273
Result after tax - 25,333 - 16,949 302 - 4,013 7,035 7,196 - 17,996 - 13,766
Non-controlling interest - - - - - 3,162 - 3,355 - 3,162 - 3,355
Investment income attributable
to shareholders NSI
- 25,333 - 16,949 302 - 4,013 3,873 - 3,841 - 21,158 - 17,121
Purchases and investments in
existing properties
1,694 1,460 22 - 786 439 2,502 1,899
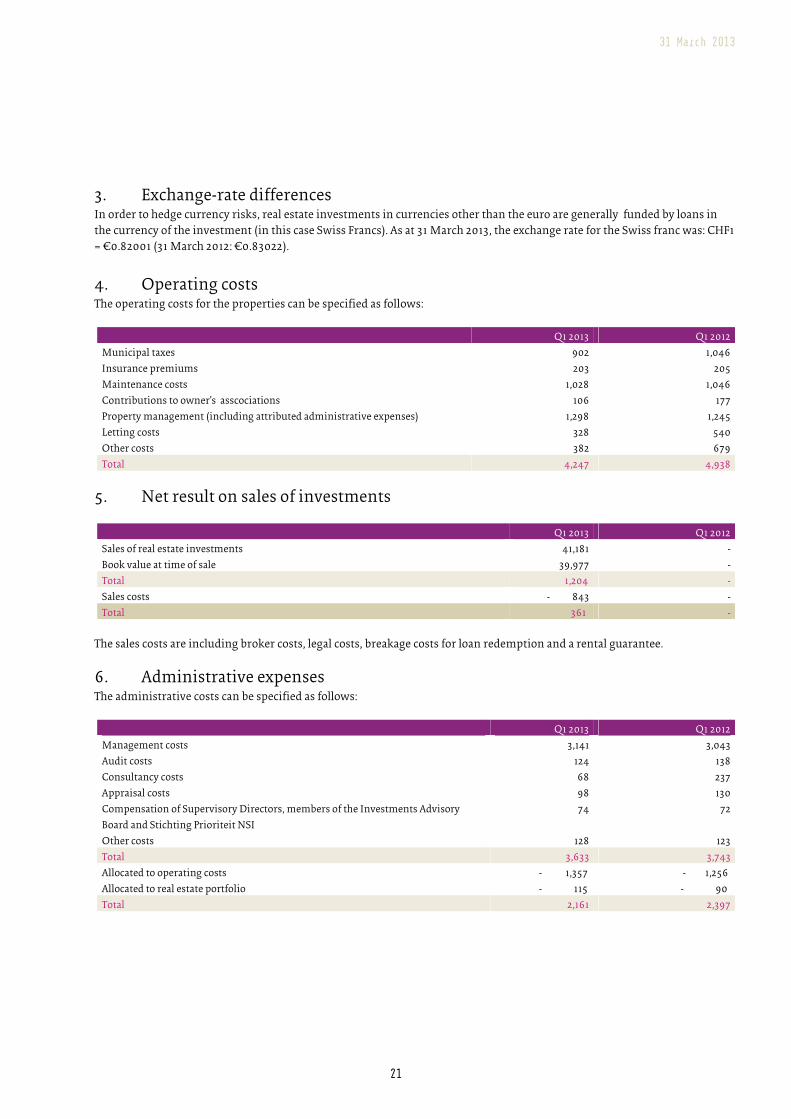
31 March 2013
� 21
3. Exchange-rate differences In order to hedge currency risks, real estate investments in currencies other than the euro are generally funded by loans in
the currency of the investment (in this case Swiss Francs). As at 31 March 2013, the exchange rate for the Swiss franc was: CHF1
= €0.82001 (31 March 2012: €0.83022).
4. Operating costs The operating costs for the properties can be specified as follows:
Q1 2013 Q1 2012
Municipal taxes 902 1,046
Insurance premiums 203 205
Maintenance costs 1,028 1,046
Contributions to owner’s asscociations 106 177
Property management (including attributed administrative expenses) 1,298 1,245
Letting costs 328 540
Other costs 382 679
Total 4,247 4,938
5. Net result on sales of investments
Q1 2013 Q1 2012
Sales of real estate investments 41,181 -
Book value at time of sale 39,977 -
Total 1,204 -
Sales costs - 843 -
Total 361 -
The sales costs are including broker costs, legal costs, breakage costs for loan redemption and a rental guarantee.
6. Administrative expenses The administrative costs can be specified as follows:
Q1 2013 Q1 2012
Management costs 3,141 3,043
Audit costs 124 138
Consultancy costs 68 237
Appraisal costs 98 130
Compensation of Supervisory Directors, members of the Investments Advisory
Board and Stichting Prioriteit NSI
74 72
Other costs 128 123
Total 3,633 3,743
Allocated to operating costs - 1,357 - 1,256
Allocated to real estate portfolio - 115 - 90
Total 2,161 2,397
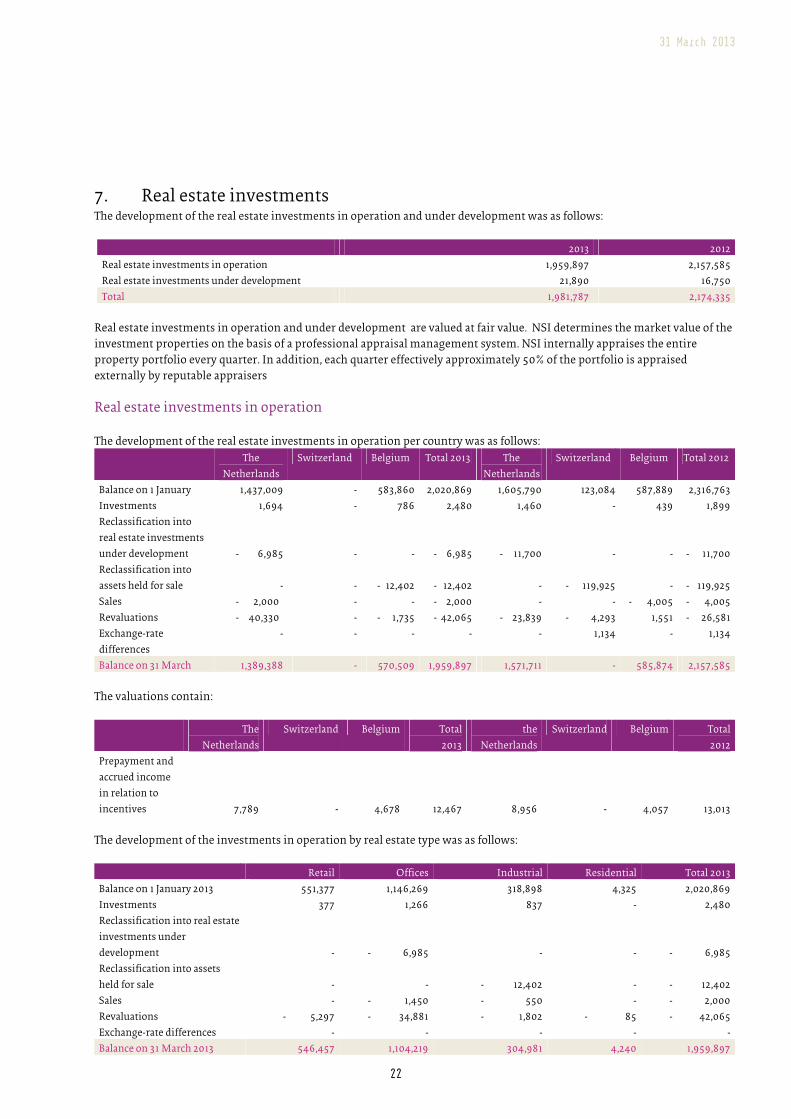
31 March 2013
� 22
7. Real estate investments The development of the real estate investments in operation and under development was as follows:
2013 2012
Real estate investments in operation 1,959,897 2,157,585
Real estate investments under development 21,890 16,750
Total 1,981,787 2,174,335
Real estate investments in operation and under development are valued at fair value. NSI determines the market value of the
investment properties on the basis of a professional appraisal management system. NSI internally appraises the entire
property portfolio every quarter. In addition, each quarter effectively approximately 50% of the portfolio is appraised
externally by reputable appraisers��Real estate investments in operation
The development of the real estate investments in operation per country was as follows:
The
Netherlands
Switzerland Belgium Total 2013 The
Netherlands
Switzerland Belgium Total 2012
Balance on 1 January 1,437,009 - 583,860 2,020,869 1,605,790 123,084 587,889 2,316,763
Investments 1,694 - 786 2,480 1,460 - 439 1,899
Reclassification into
real estate investments
under development
- 6,985
-
-
- 6,985
- 11,700
-
-
- 11,700
Reclassification into
assets held for sale
-
-
- 12,402
- 12,402
-
- 119,925
-
- 119,925
Sales - 2,000 - - - 2,000 - - - 4,005 - 4,005
Revaluations - 40,330 - - 1,735 - 42,065 - 23,839 - 4,293 1,551 - 26,581
Exchange-rate
differences
- - - - - 1,134 - 1,134
Balance on 31 March 1,389,388 - 570,509 1,959,897 1,571,711 - 585,874 2,157,585
The valuations contain:
The
Netherlands
Switzerland Belgium Total
2013
the
Netherlands
Switzerland Belgium Total
2012
Prepayment and
accrued income
in relation to
incentives
7,789
-
4,678
12,467
8,956
-
4,057
13,013
The development of the investments in operation by real estate type was as follows:
Retail Offices Industrial Residential Total 2013
Balance on 1 January 2013 551,377 1,146,269 318,898 4,325 2,020,869
Investments 377 1,266 837 - 2,480
Reclassification into real estate
investments under
development
-
- 6,985
-
-
- 6,985
Reclassification into assets
held for sale
-
-
- 12,402
-
- 12,402
Sales - - 1,450 - 550 - - 2,000
Revaluations - 5,297 - 34,881 - 1,802 - 85 - 42,065
Exchange-rate differences - - - - -
Balance on 31 March 2013 546,457 1,104,219 304,981 4,240 1,959,897
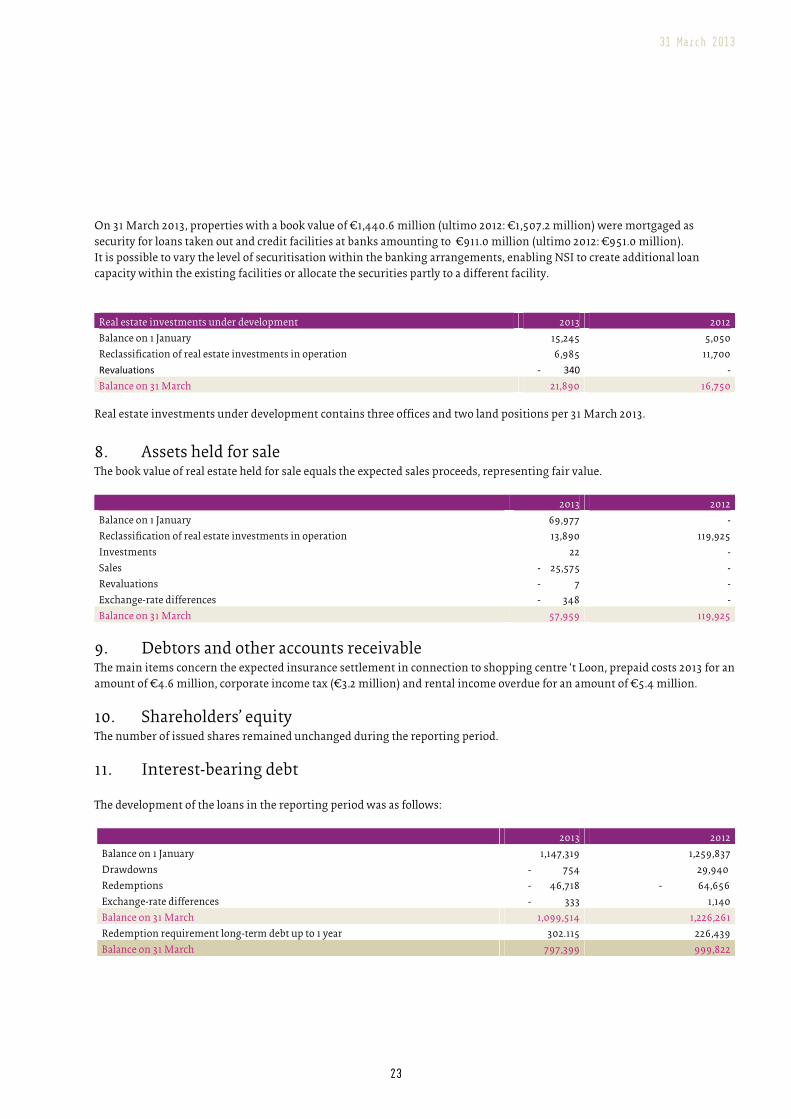
31 March 2013
� 23
On 31 March 2013, properties with a book value of €1,440.6 million (ultimo 2012: €1,507.2 million) were mortgaged as
security for loans taken out and credit facilities at banks amounting to €911.0 million (ultimo 2012: €951.0 million).
It is possible to vary the level of securitisation within the banking arrangements, enabling NSI to create additional loan
capacity within the existing facilities or allocate the securities partly to a different facility.
Real estate investments under development 2013 2012
Balance on 1 January 15,245 5,050
Reclassification of real estate investments in operation 6,985 11,700
�� �������� � �� ���� ��Balance on 31 March 21,890 16,750
Real estate investments under development contains three offices and two land positions per 31 March 2013. 8. Assets held for sale The book value of real estate held for sale equals the expected sales proceeds, representing fair value.
2013 2012
Balance on 1 January 69,977 -
Reclassification of real estate investments in operation 13,890 119,925
Investments 22 -
Sales - 25,575 -
Revaluations - 7 -
Exchange-rate differences - 348 -
Balance on 31 March 57,959 119,925
9. Debtors and other accounts receivable The main items concern the expected insurance settlement in connection to shopping centre ‘t Loon, prepaid costs 2013 for an
amount of €4.6 million, corporate income tax (€3.2 million) and rental income overdue for an amount of €5.4 million.
10. Shareholders’ equity The number of issued shares remained unchanged during the reporting period.
11. Interest-bearing debt �The development of the loans in the reporting period was as follows:
2013 2012
Balance on 1 January 1,147,319 1,259,837
Drawdowns - 754 29,940
Redemptions - 46,718 - 64,656
Exchange-rate differences - 333 1,140
Balance on 31 March 1,099,514 1,226,261
Redemption requirement long-term debt up to 1 year 302.115 226,439
Balance on 31 March 797,399 999,822
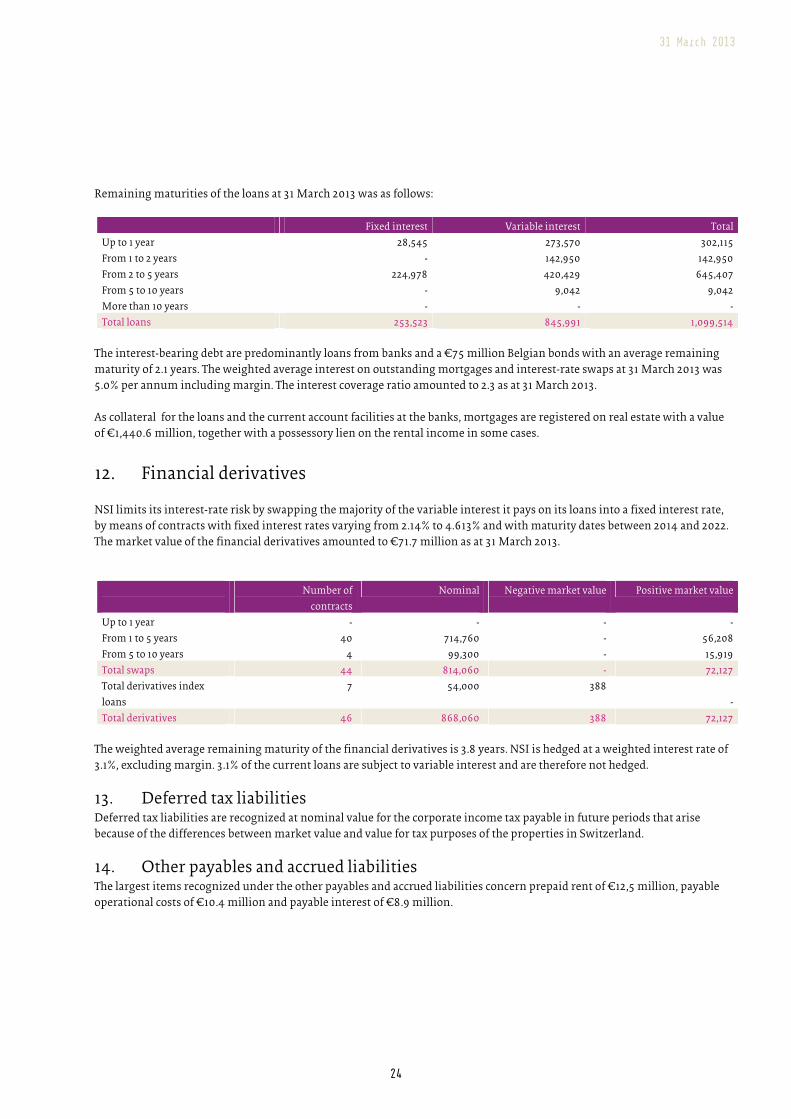
31 March 2013
� 24
Remaining maturities of the loans at 31 March 2013 was as follows:
Fixed interest Variable interest Total
Up to 1 year 28,545 273,570 302,115
From 1 to 2 years - 142,950 142,950
From 2 to 5 years 224,978 420,429 645,407
From 5 to 10 years - 9,042 9,042
More than 10 years - - -
Total loans 253,523 845,991 1,099,514
The interest-bearing debt are predominantly loans from banks and a €75 million Belgian bonds with an average remaining
maturity of 2.1 years. The weighted average interest on outstanding mortgages and interest-rate swaps at 31 March 2013 was
5.0% per annum including margin. The interest coverage ratio amounted to 2.3 as at 31 March 2013.
As collateral for the loans and the current account facilities at the banks, mortgages are registered on real estate with a value
of €1,440.6 million, together with a possessory lien on the rental income in some cases.
12. Financial derivatives
NSI limits its interest-rate risk by swapping the majority of the variable interest it pays on its loans into a fixed interest rate,
by means of contracts with fixed interest rates varying from 2.14% to 4.613% and with maturity dates between 2014 and 2022.
The market value of the financial derivatives amounted to €71.7 million as at 31 March 2013.
Number of
contracts
Nominal Negative market value
Positive market value
Up to 1 year - - - -
From 1 to 5 years 40 714,760 - 56,208
From 5 to 10 years 4 99,300 - 15,919
Total swaps 44 814,060 - 72,127
Total derivatives index
loans
7 54,000 388
-
Total derivatives 46 868,060 388 72,127
The weighted average remaining maturity of the financial derivatives is 3.8 years. NSI is hedged at a weighted interest rate of
3.1%, excluding margin. 3.1% of the current loans are subject to variable interest and are therefore not hedged.
13. Deferred tax liabilities Deferred tax liabilities are recognized at nominal value for the corporate income tax payable in future periods that arise
because of the differences between market value and value for tax purposes of the properties in Switzerland.
14. Other payables and accrued liabilities The largest items recognized under the other payables and accrued liabilities concern prepaid rent of €12,5 million, payable
operational costs of €10.4 million and payable interest of €8.9 million.
31 March 2013
� 25
15. Liabilities not appearing on the balance sheet In November 2012 NSI reached an agreement about the sale of two office properties (Leidsegracht and Herengracht in
Amsterdam). The sales price amounted to €8.0 million and the transfer is expected to take place in the second quarter of 2013.
Intervest Offices & Warehouses reached an agreement about the sale of an industrial property at de Kaaien in Antwerpen. The
sales price amounted to €2.1 million and the transfer took place on 15 April 2013.
In March 2013 Intervest Offices & Warehouses reached an agreement about the sale of a semi-industrial property at
Guldendelle in Kortenberg. The sales price amounted to €14.2 million and the transfer is expected to take place by the end of
May 2013.
Hoofddorp, 17 May 2013
Management Board Supervisory Board
J. Buijs, CEO H. Habas, chairman
D.S.M. van Dongen, CFO H.J. van den Bosch
H.W. Breukink
G.L.B. de Greef
31 March 2013
� 26
Other information Statement pursuant to the Financial Supervision Act The Netherlands Authority for the Financial Markets granted a licence to NSI N.V. on 13 July 2006. A copy of this license can be
obtained at the company’s office as well as via its website: www.nsi.nl
The members of NSI’s Supervisory Board and Management Board have no personal interests in any of the investments made
by NSI. Furthermore, they never had any such interest at any time during the period under review. The company is not aware
of any property transactions during the period under review with any people or organisations that could be considered to
have a direct relationship with the company.
Holders of shares with a capital interest of 5% or more: In accordance with the Financial Supervision Act, the Netherlands Authority for the Financial Markets received a notification
of a shareholder with an interest of more than 5% in the company. According to the most recent notification, this interest was
as follows: Habas Investments (1960) Ltd. and it subsidiaries (20.5%). The date of the notification mentioned above was 18
September 2012.
Financial calendar 2013
Financial calendar 2013
Publication HY results 2013 9 August 2013
Publication Q3 results 2013 8 November 2013
Interim-dividends
Setting of Q1 2013 interim-dividend 31 May 2013
Listing ex-dividend 4 June 2013
Payment of Q1 2013 interim-dividend 11 June 2013
Setting of HY 2013 interim-dividend 23 August 2013
Listing ex-dividend 27 August 2013
Payment of HY 2013 interim-dividend 3 September 2013
Setting of Q3 2013 interim-dividend 22 November 2013
Listing ex-dividend 26 November 2013
Payment of Q3 2013 interim-dividend 3 December 2013
31 March 2013
� 27
Review report To: the General Meeting of shareholders of NSI N.V.
Introduction We have reviewed the on page 16 to 25 the accompanying condensed consolidated interim financial information of NSI N.V.,
Hoofddorp (statutory seat Hoorn), which comprises the consolidated statement of financial position as at 31 March 2013, the
consolidated statements of comprehensive income, the consolidated statement of movements in shareholders’ equity and the
consolidated cash flow statement for the period of 3 months ended 31 March 2013, and the notes. Management of the
Company is responsible for the preparation and presentation of this consolidated interim financial information in
accordance with IAS 34 ‘Interim Financial Reporting’ as adopted by the European Union. Our responsibility is to express a
conclusion on this interim financial information based on our review.
Scope We conducted our review in accordance with Dutch law including standard 2410, ‘Review of Interim Financial Information
Performed by the Independent Auditor of the Entity’. A review of interim financial information consists of making inquiries,
primarily of persons responsible for financial and accounting matters, and applying analytical and other review procedures. A
review is substantially less in scope than an audit conducted in accordance with auditing standards and consequently does
not enable us to obtain assurance that we would become aware of all significant matters that might be identified in an audit.
Accordingly, we do not express an audit opinion.
�Conclusion Based on our review, nothing has come to our attention that causes us to believe that the accompanying condensed
consolidated interim financial information as at 31 March 2013 is not prepared, in all material respects, in accordance with
IAS 34 ‘Interim Financial Reporting’ as adopted by the European Union.
Amstelveen, 17 May 2013
KPMG Accountants N.V.
H.D. Grönloh RA

OPINION RELATED TO
HABAS TULIP B.V.’S INVESTMENT
IN NSI N.V.
The Michel-Shaked Group May 2013
I. SCOPE OF ENGAGEMENT AND REPORT
At the request of Habas Tulip B.V. (“Habas”), we analyzed and assessed to what
extent a premium, if any, to Net Asset Value (NAV) should be applied to Habas’
investment in NSI N.V. (“NSI” or the “Company”) as of March 31, 2013.1
This report presents our methodologies, findings, and conclusions. In accordance
with recognized professional ethics, our professional fees for this service are not
contingent upon the conclusions herein.
II. FIRM QUALIFICATIONS
The Michel-Shaked Group is a multi-disciplined practice covering finance,
economic, accounting, and business consulting services. We have been called upon in
many of our corporate finance engagements to provide opinions as to the value of a wide
array of financial instruments and companies. In the last three decades, we have valued
hundreds of privately held and publicly traded companies. We have extensive experience
valuing and performing financial analysis on European companies. We have also been
retained by numerous Government Agencies including the Securities and Exchange
Commission (SEC), the Internal Revenue Service (IRS), the Justice Department, and the
Department of Labor (DOL) on issues of financial analysis and valuation. See the
Appendix for a non-exhaustive list of financial/analysis valuations performed.
III. SUMMARY OF OPINION
It is our opinion that as of March 31, 2013, a premium to Net Asset Value should
not be applied to Habas’ investment in NSI. The process of assessing whether or not a
premium should be applied to NSI’s NAV consists of analyzing three components: a
portfolio premium that reflects the benefits available to NSI from combining individual
properties and managing them as a diversified portfolio; a discount for the general and
administrative expenses necessary to generate the portfolio premium; and a net premium
attributable to management’s ability to create future value. As a result, as of March 31,
1 This report and analysis is based on information and data for the quarter ended March 31, 2013. Information and data pertaining to the period after March 31, 2013 are not included or reflected in this report and analysis.
1
2013, Habas’ investment in NSI is €132.6 million, which is equal to Habas’ share of
NSI’s NAV.
IV. FACTUAL BACKGROUND
A. Company History
NSI is a publicly listed closed-end real estate investment fund that was founded in
the Netherlands in 1993 as an independent property company. Since April 3, 1998, NSI
has been listed on the Official Market of stock exchange maintained by Euronext
Amsterdam. On October 14, 2011, NSI completed a merger with VastNed
Offices/Industrials (“VastNed”). VastNed was a Dutch REIT that primarily operated in
the Netherlands and Belgium.
The Company is qualified for Dutch Fiscale Beleggingsinstelling (“FBI”) status,
which subjects it to a zero rate of corporate taxation on its profits in the Netherlands.2
FBI status is often referred to as a Real Estate Investment Trust (“REIT”) in other
markets.
The Company is governed by a Management Board, a Supervisory Board, and an
Investment Advisory Board, each of which has its own specific tasks, rights, and powers.
The Management Board consists of the Company’s CEO and CFO and is responsible for
the day to day management of NSI. The Supervisory Board consists of five members and
supervises the policy of the Management Board and the general course of affairs of NSI.
The Investment Advisory Board consists of three members and represents the
Supervisory Board in the assessment and approval of the purchase and sale of portfolio
properties.3
As of March 31, 2013, NSI reported that its €1.98 billion real estate portfolio4
consisted of about 265 commercial properties and 1,700 leases located in the
Netherlands, Belgium and Switzerland. The Company maintains a diversified portfolio
of assets with exposure to office buildings (56%), retail properties (28%), and industrial
2 NSI N.V. Annual Report for the Year Ended December 31, 2012. 3 NSI N.V. Annual Report for the Year Ended December 31, 2012. 4 Net of assets held for sale.
2
buildings (16%). With the completion of the VastNed merger in 2011, the Company
continued a push towards geographical diversification, expanding into the Belgian
market, which now constitutes 29% of the Company’s total portfolio.5
B. Habas’ Investment in NSI
In the beginning of 2007, NSI was approached by Habas Investments (1960) Ltd.
to investigate the potential for a strategic cooperation between the two companies. Habas
Investments (1960) Ltd. is a publicly listed Israeli company that develops residential real
estate and is a member of the Habas Group. The Company aimed to use its international
expertise to expand NSI’s real estate portfolio outside the Dutch market. In February
2007, Habas Tulip B.V., a subsidiary of the Habas Group, acquired a 17.1 % stake of NSI
in a private transaction. Habas’ initial February 2007 investment was at €21.90 per share,
representing a 12.22% premium over NSI’s Gross Asset Value (GAV). By September
2007, Mr. H. Habas, Chairman of the Habas Group of Israel was elected chairman of
NSI’s Supervisory Board and, Amir Nitzani, manager of International activity for the
Habas Group, was appointed to the Company’s Investment Advisory Board.6 As of
March 31, 2013, following several add-on acquisitions, Habas Tulip B.V.’s ownership
interest in the Company stood at 20.54%.7
V. NET ASSET VALUE
It is well known in financial literature that a common method for valuing REITs is
on the basis of Net Asset Value (“NAV”). A REIT’s Net Asset Value “refers to the
commonly accepted market value of a company’s assets and properties after subtracting
its liabilities and obligations.”8 As of March 31, 2013, NSI’s NAV (attributable to
shareholders) was €645.9 million. We were not requested to opine on the accuracy of
NSI’s NAV. We rely on NSI’s NAV as published in its audited financial statements, and
use it as a basis for our analysis. While NAV is a useful reference point when attempting
5 NSI N.V. Interim Report for the Period Ended March 31, 2013. 6 NSI N.V. Annual Report for the Year Ended December 31, 2007, pp. 11-16. 7 Habas Management. 8 Gordon, Mark. The Complete Guide to Investing in REITs-Real Estate Investment Trusts: How to Earn High Rates of Return Safety. Atlantic Publishing, 2008, pp. 53-54.
3
to value a shareholder’s stake in a REIT, there are situations where NAV does not capture
the full value of an investor’s holding. For example, consider the following statements:
“A net asset value lends itself well to a REIT because of a REIT’s constantly changing property values. But to some in the REIT industry that can be a disadvantage because some investors hold the view that a REIT’s market value is not only based on property assets, but also on the total business the company operates.”9
“Since a REIT’s strategic plan is capable of generating value in excess of carried assets, it is not merely a collection of properties but an enterprise worthy of a valuation in excess of the net asset value of the property portfolio.”10
“…others worry that NAV models tend to miss the value creating skills of management.”11
“They’re [REITs] not just properties, [t]hey’re a collection of properties as managed by a management team.”12
As evidenced by the aforementioned quotes, NAV does not always reflect the
benefits available to a REIT from combining individual properties and managing them as
a diversified portfolio.13
VI. PORTFOLIO PREMIUM
The use of NAV as a valuation metric ignores the benefits of managing a set of
individual real estate assets in a portfolio. Since a REIT’s NAV is obtained by
9 Gordon, Mark. The Complete Guide to Investing in REITs-Real Estate Investment Trusts: How to Earn High Rates of Return Safety. Atlantic Publishing, 2008, p. 238. (In this report, when part of a quote is both boldfaced and underlined it indicates added emphasis not in the original quote). 10 Garrigan, Richard and John Parsons. Real Estate Investment Trusts. McGraw-Hill, 1998, p. 161.11 Starkman, Dean. “The NAV Debate: Is net asset value the most accurate way to value REIT stocks?” www.nareit.com, May/June 2005. 12 T. Ritson Ferguson as quoted in Starkman, Dean. “The NAV Debate: Is net asset value the most accurate way to value REIT stocks?” www.nareit.com, May/June 2005. 15 Note that a portfolio premium is actually applied to Gross Asset Value (GAV), which is the fair value of a REIT’s real estate assets. Since NAV is GAV less debt, both GAV and NAV fail to fully reflect the benefits of managing a collection of real estate in a portfolio. Whenever this report refers to the fact that NAV does not account for portfolio advantages, one can assume the same is true for GAV.
4
performing a DCF analysis on each individual property and then summing up those
individual amounts, NAV does not explicitly consider the synergies and cost advantages
of combining individual properties into a multi-property portfolio. A report on the Dutch
REIT market by Colliers International confirms the above notion as the three deals
examined by Colliers were completed at a premium to GAV of 8-10%.14 The following
are only some of the diversification benefits and costs advantages that accrue to a
company such as NSI, which owns a large number of portfolio properties:
A. International Diversification
The concept of international diversification is well known in financial literature.
For example consider the following:
“…the basic arguments in favor of international diversification are that foreign investments offer additional profit potentials while reducing the total risk of the portfolio. In other words, international diversification helps to improve the risk-adjusted performance of a domestic portfolio.”15
“The construction of internationally diversified portfolios is both the same as and different than creating a traditional domestic portfolio.Internationally diversified portfolios are the same in principle because the investor is attempting to combine assets that are less than perfectly correlated, reducing the total risk of the portfolio. In addition, by adding assets from outside the home market, assets that previously were not available to be averaged into the portfolio’s expected returns and risks, the investor has now tapped into a larger pool of potential investments.”16
By diversifying cash flows internationally, NSI is able to realize a reduction in
portfolio variability by investing in real estate assets that are not perfectly positively
correlated. For example, the Belgian and Dutch real estate markets do not move
completely in tandem. If the Belgian market appreciates or maintains its value while the
14 Opinion of the Valuation of the investment of Habas Tulip B.V. in NSI by Colliers International dated May 2009, p. 8.15 Solnik, Bruno. International Investments. 3rd Edition. Addison-Wesley, 1996, p. 90.16 Eiteman David, Arthur Stonehill, and Michael Moffett. Multinational Business Finance. 8th Edition. Addison-Wesley, 1998, p. 341.
5

Dutch market declines (or vice-a-versa), the fluctuations of the asset returns will offset
each other, resulting in risk reduction. All other things equal, the lower the risk of an
investment, the higher the value. This benefit is not reflected in the NAV figure.
B. Sector Diversification
NSI’s diversification across sectors offers the Company further risk reduction
advantages that are not reflected in the Company’s NAV. NSI has a rule that the
purchase price of a single property should not amount to more than 5% of the total
portfolio. By preventing its portfolio from having any concentrated positions, NSI
reduces the risk that the decline in any single investment will have a material impact on
its portfolio. Moreover, in the European Public Real Estate Association’s (“EPRA”)
2012 Global REIT Survey - Netherlands, NSI was listed as one of the top five REIT’s in
the Netherlands. Out of the five companies, NSI is the only company whose portfolio is
not highly concentrated (>75%) in one sector.17 Similar to the concept of international
diversification, as long as each segment does not respond to economic and market
conditions in exactly the same way, NSI’s sector diversification reduces portfolio risk.
All other things equal, the lower the risk of an investment, the higher the value. This
benefit is not reflected in the NAV.
Even though NSI plans to focus its future investments in the office and retail
space, the Company will still have sector diversification benefits from a portfolio
invested 50% in office buildings and 50% in retail properties
C. Economies of Scale and Synergies
NSI is one of the five largest REITs in the Netherlands. NSI’s size affords the
Company the opportunity to generate significant economies of scale and synergies that
are not fully reflected in its NAV. There is ample evidence in both financial and
academic literature supporting the notion of economies of scale in REITs. For example,
consider the following:
17 Financial reports for Corio NV, Vastnet Retail NV, Eurocommercial NV and Wereldhave NV.
6
“For REITs..[g]rowth permits economies of scale… Bigger REITS are able to bid for bigger, more lucrative properties and capitalize on the discounts available in buying whole portfolios rather than individual buildings. Theyare also able to negotiate lower prices for supplies and maintenance contracts.”18
“In the case of REITs, larger REITS may achieve a level of market power, perhaps in financing or management contracts, that result in cost economies unavailable to less capitalized REITS.”19
“For total REIT expenses, estimates from the translog cost model suggests that, overall scale economies exist for REITs… The analysis shows that REITs of all asset sizes show estimated economies of scale.”20
With respect to NSI specifically, the Company benefits from:
1. Financing advantages over smaller rivals and independent property
owners due to stronger banking relationships and the prospect of being
a repeat customer. A large, diversified REIT is also more likely to
have access to the capital of institutional investors. These financing
advantages, which are not accounted for when valuing each property
separately, lead to a decrease in risk and ultimately a value higher than
the NAV.
2. Increased investment opportunities in domestic and international
markets due to capital, reputation, and experience advantages. As
evidenced by the following quote, increased investment opportunities
can lead to a premium to NAV:
“…in periods in which REITs can add value through external
growth we might expect to see premiums to NAV, all else equal.”21
18 Rosenthal, Midy, “Bigger REITs, better REITs” Institutional Investor 30 (February): 101.19 Bers, Martina and Thomas Springer. 1998a, “Economies of Scale for real estate investment trust.” Journal of Real Estate Research 14:275-90.20 Bers, Martina and Thomas Springer. 1998b “Sources of scale economies for REITs.” Real Estate Finance 14 (Winter): 47-56.
7
3. Maintenance costs and insurance costs are also likely to be lower for
a REIT with a large number of properties than for an individual
property owner. The centralized management of assets can lead to
enhanced bargaining power, supply discounts, and insurance savings.
These savings, which can be significant, are not fully incorporated in
the NAV calculation that values each of a REIT’s portfolio properties
separately. Thus, these savings are not reflected in NSI’s NAV.
4. The capacity to attract large tenants and move tenants between
different assets. For instance, a tenant may decide not to renew a lease
because he needs an increase or decrease in square footage. NSI, with
its multi-property portfolio, can retain that tenant by moving him to a
different NSI property.
5. Co-insurance benefits, which refer to the fact that the probability of
default or financial distress is significantly reduced when two or more
assets that are less than perfectly correlated are combined into a
portfolio.22 For example, if needed, the cash flows generated by some
of NSI’s assets can co-insure the cash flows of other assets
experiencing financial distress. This risk reduction benefit is not
accounted for when valuing each portfolio property independently, and
therefore it is not fully reflected in NSI’s NAV.
Confirmation of the fact that differences in growth rates and capital costs can lead
to a NAV premium can be found in academic literature that analyzes the departures from
NAV in REIT pricing. For example, consider the article by Jim Clayton and Greg
MacKinnon. Based on their findings:
21 Clayton Jim and Greg MacKinnon, “Departures from NAV in REIT Pricing: The Private Real Estate Cycle, the Value of Liquidity, and Investor Sentiment” February 2002 Working Paper, p.6. 22 Butler, Kirt C. Multinational Finance. South Western College Publishing, 1997, pp. 578-579.
8
a REIT Premium to NAV>0 if (kRE - gRE) > (kreit- greit)
kRE and gRE refer to the cost of equity and growth rates of private real estate, while
kreit- and greit refer to the cost of equity and growth rates attributable to publicly traded
REITs. Thus, a decrease in the cost of capital or increase in the REIT growth rate leads
to premiums to NAV.23
D. Corporate Governance Benefits
According to the EPRA 2008 corporate governance study, 71% of Dutch property
firms have adopted a two-tier board structure.24 This structure is viewed favorably for its
effective monitoring of management and is 40% higher than the European average.25
Furthermore, Dutch property firms are more likely to have audit and remuneration
committees relative to their European counterparts.26 With respect to NSI, the company
has a two-tier board structure as well as investment, audit, and remuneration committees.
Effective corporate governance can increase portfolio value by increasing the pool of
potential investors (both equity and debt providers) and decreasing capital costs. Over
the last three decades, the Michel-Shaked Group has amassed extensive experience
working with financial institutions. From our experience, investors such as pension
funds, insurance companies, and mutual funds are constrained by the types of companies
they can invest in. Pension consultants (working on behalf of pension funds) and other
institutional investors conduct extensive due diligence and set detailed rules for the types
of companies their money managers can invest in. For example, BlackRock Asset
Management, which owns 1.71% of NSI’s equity, is a renowned investment firm. Based
on our knowledge of BlackRock, sound corporate governance is a critical component of
its investment decision. Effective corporate governance is also an important criterion for
many other institutional investors. For a company such as NSI, effective corporate
governance increases its access to capital, thus lowering its capital costs. All other things
23 Clayton Jim and Greg MacKinnon, “Departures from NAV in REIT Pricing: The Private Real Estate Cycle, the Value of Liquidity, and Investor Sentiment” February 2002 Working Paper.24 European Public Real Estate Association Corporate Governance Study of European Listed Property Firms, 2008. 25 European Public Real Estate Association Corporate Governance Study of European Listed Property Firms, 2008. 26 European Public Real Estate Association Corporate Governance Study of European Listed Property Firms, 2008.
9
equal, the lower the cost of capital, the higher the REIT’s value. This advantage is not
reflected in NSI’s NAV.
VII. APPLYING A PORTFOLIO PREMIUM TO NSI
Based on our experience and discussion with service providers to the REIT sector
as well our review of academic literature, it is clear that portfolio benefits and economies
of scale exist for REITs. 27 Although these benefits vary, they can be significant. For
example, a study on the “Sources of Scale Economies for REITs” by Martina Bers and
Thomas Springer confirmed the existence of economies of scale for general and
administrative expenses, management fees, and operating expenses (which consist of
maintenance and repair fees, utilities, cleaning services, advertising expenses, and
security fees among other things). Bers and Springer found that general and
administrative expense as a percentage of total costs decreased from 16% for the smallest
REITs to 7% for the largest REITs. Similarly, management fees decreased from 11% to
4% and operating expenses decreased from 54% to 48%. For purposes of our analysis,
based on the aforementioned academic literature and Company specific information, we
conservatively assumed that NSI’s savings are 8% for the Company’s exploitation costs
(which consist of management fees, maintenance costs, insurance premiums, taxes, and
renting/letting costs).
Based on our analysis and discussion with REIT service providers, we also found
evidence of sizeable advantages related to financing costs. However, general economic
conditions as well as the real estate environment in the Netherlands negatively impacted
the ability to utilize these advantages. As a result, as of March 31, 2013, there is no
premium for financing cost savings.
A. Calculation of NSI’s Portfolio Savings
To calculate the total value of NSI’s annual portfolio savings, we computed the
present value of those savings by utilizing the following formula:
27 Rosenhal, Mindy, “Bigger REITs, better REITs,” Institutional Investor, February 1996; 30, 2; p. 101 and Bers, Martina and Thomas M. Springer, “Sources of Scale Economies for REITs,” Real Estate Finance, Winter 1998; 14, 4; pp. 47-56.
10
PV= CF(1+g)/ (WACC-g)
where:
� CF is the estimate of annual savings in year 0 (i.e. in the current year).
� g is the annual growth rate of the savings
� WACC is the Weighted Average Cost of Capital
For g, we assumed that NSI’s annual savings would grow by 2% per year. Given
the fact that it is widely accepted that the long-term, worldwide rate of inflation is
approximately 3% per year, a 2% growth rate is conservative.
B. Calculation of NSI’s WACC
NSI’s WACC is the discount rate that measures the risk involved in its business:
the higher the risk, the higher the rate used. The higher the rate used, the lower the value
of the discounted or capitalized cash flows. The rate chosen is designed to reflect the no-
risk rate of return, plus a factor for company equity and specific risk. The WACC is
based upon the concept of Business Enterprise Value, which represents the value of the
firm’s assets that are financed by providers of capital: equity and debt holders. As a
result, the WACC is calculated by determining the cost of equity and the after-tax cost of
debt and then weighting each of these rates by their proportion to the total capital
structure (equity plus debt).
NSI’s cost of equity was derived using the Capital Asset Pricing Model
(“CAPM”). The CAPM attributes differences in returns of the universe of stocks
comprising the “market” to their movement relative to that market. This difference is
quantified in a factor called the Beta (�) of an individual stock, which measures its
systematic risk, or tendency to move relative to the market. Stocks with Betas of 1.0
move in tandem with the market. A Beta greater than 1.0 implies that a 1% change in the
market is typically associated with a greater than 1% change in the stock price.
Conversely, a Beta less than 1.0 implies that a 1% change in the market is typically
associated with a less than 1% change in the stock. Unsystematic risk (the risk attributed
to a specific company) can be eliminated through portfolio diversification. Therefore, the
CAPM attributes differences in returns on individual companies to differences in Beta or
11
systematic risk. The formula to determine NSI’s cost of equity (Ke) using the CAPM is
as follows:
Ke = Rf + �(Rm – Rf) + Rs where:
Rf is the risk free rate
� is NSI’s Beta, or the measure of systematic risk
(Rm – Rf) is the equity risk premium for the entire market
Rs is the return in excess of CAPM
For NSI, the relevant risk-free rate (Rf) used in the CAPM model represents the
20-year European AAA government bond rate, which as of March 31, 2013 was 2.7%.
Based on equity return databases and our experience, the equity risk premium is 6.70%.
As required by the CAPM formula detailed above, the equity premium is multiplied by
the appropriate Beta. Beta is calculated by regressing the Company’s stock returns
against the returns on an appropriate index. Using regression analysis, we observed that
beginning in July 2012 NSI’s stock price was not trading in relation to the MSCI EAFE
Index. Therefore, for purposes of this analysis, we utilized NSI’s Beta as of June 30,
2012. We regressed NSI’s daily stock returns against the returns of the MSCI EAFE
Index for the 150 trading days for the period November 24, 2012 – June 30, 2012. This
arrived at a Beta of 1.003 as of June 30, 2012 (see Exhibits 1 and 2).
A size premium for NSI of 2.70% was obtained from the SBBI 2013 Yearbook
and added to the results of applying the CAPM. The size premium is determined based
on the firm’s size as measured by its value. It is added to the results of the CAPM to
reflect the notion that investors have historically required higher rates of return for
smaller companies and a lower premium for larger ones. The smaller the company is, the
larger the size premium.
A specific company risk premium of 3% was also added to the cost of equity.
This risk premium accounts for the additional risk associated with the company’s recent
performance.
As shown in Exhibit 3A, the cost of equity for NSI as of March 31, 2013 was
15.08%. According to the NSI’s Interim report, the Company’s cost of debt as of March
12
31, 2013 was 5.0%. As previously discussed, NSI does not pay corporate income taxes
due to its Dutch FBI status. Thus, NSI’s after tax cost of debt is the same as its pre-tax
cost of debt of 5.0%. As of March 31, 2013, NSI’s reported interest bearing debt was
€1,099.5 million. However, the Company’s 2011 annual report stated that the
Company’s debt and loan-to-value ratio of its real estate portfolio increased as a result of
the merger.28 The interim report states that the Company is “highly committed” to
reducing the loan-to-value ratio of 58.0% (as of March 31, 2013) to below 55%.29 This
implies that the Company expects to reduce its debt by €93.2 million. To calculate an
appropriate cost of capital, this reduction is applied to the Company’s interest bearing
debt, resulting in a target debt level of €1.01 billion.30 As shown in Exhibit 3A and 3B,
this results in a capital structure of 72.5% debt and 27.5% equity. Thus, the Company’s
WACC is 7.77%.
C. Exploitation Cost Savings
For the Latest Twelve Months (LTM) Ended March 31, 2013, the Company’s
exploitation costs were €17.766 million:
A Company such as NSI, with about 265 properties and 1,700 leases, realizes
savings on many of these costs relative to an independent property owner or a smaller
28 NSI N.V. Annual Report for the Year Ended December 31, 2011. 29 NSI N.V. Interim Report for the Period Ended March 31, 2013. 30 Total real estate investments of €1,981.8 million multiplied by 55% results in a debt target of €1,090 million. This figure is €93.2 million lower than the current adjusted debt to credit institutions (€1,183.2 million reported debt to credit institutions). The €93.2 million in LTV adjustments is deducted from current interest bearing debt of €1,099.5 million.
Exploitation Costs (000s) NSI 2012 Q1 2013 Q1 2012 LTMMunicipal taxes € 4,600 € 902 € 1,046 € 4,456Insurance premiums 764 203 205 762 Maintenance costs 3,927 1,028 1,046 3,909 Contributions to owner associations 476 106 177 405 Management of real estate 4,816 1,298 1,245 4,869 Letting costs 2,167 328 540 1,955 Other Costs 1,707 382 679 1,410 Total € 18,457 € 4,247 € 4,938 € 17,766Source: NSI Annual Report for December 31, 2012, Interim Report for Period Ended March 31, 2013.
13
REIT. In particular, insurance costs, maintenance costs, management costs, and letting
(rental) costs are all items that are clearly lower for a portfolio of professionally managed
properties. For the LTM ended March 31, 2013, of the €17.766 million in total
exploitation costs, €11.495 million are for these expenses.
An analysis of NSI’s management and insurance costs confirms the notion that
large REITs realize costs savings that are not available to smaller REITs or individual
property owners. For example, according to senior management, the average insurance
premium for an €8-€10 million property can be anywhere from .1%-.3% (depending on
the type of property being insured). In contrast, NSI with a portfolio of over 260 €8-€10
million properties, pays an average premium of .04%. This translates to about €1.23
million in annual insurance savings realized by NSI, which were not accounted for in the
Company’s NAV calculation.
In order to calculate the total portfolio savings NSI realizes on its exploitation
costs, we assumed NSI would realize an 8% savings on these costs. This translates to a
reduction of €933,920 per year. Using the constant growth model, which is often referred
to as the Gordon Growth Model, annual savings of €919,600 yields an additional €16.3
million in value.
PV = 919,600 * (1 + .02) = €16.3 million
.0777 -.02
Since NSI does not pay corporate income taxes, the after tax value of these
savings is also equal to €16.3 million.
D. Financing Cost Savings
NSI’s size advantage, bank relationships, and access to institutional capital may
enable the Company to realize significant financing costs savings that are not reflected in
its NAV. For example, it is well known in finance that there is a relationship between
firm size and risk. As mentioned previously a size premium is determined based on the
firm’s size as measured by its value. It is added to the results of the CAPM to reflect the
notion that investors have historically required higher rates of return for smaller
companies and lower rates of return for larger ones. The smaller the company is, the
larger the small stock premium. As evidenced by the table below, for companies with
14

market capitalizations in the top decile ($17,558 million to $626,550 million) a size
premium of negative .37% is added to the results of CAPM. This is in contrast to the
6.0% size premium applied to companies with market capitalizations in the bottom decile
($1.1 million to $254 million). Thus, all other things being equal, the required rate of
return by investors in a large firm is lower than that of a smaller firm.
When applied to REITs, the chart above confirms the fact that the cost of
financing for an individual property can be considerably greater than the financing cost
for a multi-property portfolio. NSI’s total real estate portfolio (including assets held for
sale) is valued at €1.98 billion or €7 million to €10 million per property. Thus, the size
premium alone can account for up to a 433 basis points difference in NSI’s cost of equity
financing relative to that of an individual property. A fundamental rule in finance is that
the lower the discount rate, the higher the value.
The co-insurance effect applicable to NSI’s property portfolio further reduces the
Company’s capital costs. The co-insurance of many different properties increases NSI’s
creditworthiness and decreases the likelihood that the Company will experience financial
distress. One way to estimate the magnitude of these savings is to look at the difference
Size Premium
Decile1 $ 17,558 $ 626,550 -0.37%2 0.76%3 0.92%4 1.14%5 1.70%6 1.72%7 1.73%8 2.46%9 2.70%
10 6.03%
Market Market Capitalization Capitalization of Smallest of Largest Company Company (in millions) (in millions)
7,748 17,5414,250 7,6872,773 4,2281,912 2,7591,347 1,909822 1,347514 818255 5141.1 254
Source: 2013 Ibbotson SBBI Valuation Yearbook.
15
in yields for European securities with different credit ratings. For example, as detailed in
Exhibit 4 according to the Merrill Lynch Global Index System, the difference between
AAA Non-Sovereign European Bonds and AA Non-Sovereign European Bonds is
approximately 15 basis points.31
However, recently, the Dutch commercial real estate market experienced a
tightened lending environment, which led to higher interest rates. Within this
environment, NSI’s typical advantages related to its size and relationships cannot be fully
utilized. As a result, as of March 31, 2013, there is no premium for financing cost
savings. As the Dutch market develops and rates fluctuate, the financing cost savings
may be revised in future reports.
E. Rental Income Synergies
A portfolio of real estate properties will also realize rental income synergies that
are not available to an individual property. For example, all other things being equal, the
occupancy rate for a multi-property portfolio is likely to be higher than that of a single
property. If the tenant of a single property owner does not renew a lease, due to either a
needed change in square meters or location, the single property owner will likely lose that
tenant. However, a multi-property REIT, with hundreds of different properties, is more
likely to retain that tenant by moving him to an existing portfolio property. NSI’s NAV,
which is based on market rates, ignores these top line benefits. Moreover, as discussed
previously, due to its size, reputation, and access to capital, NSI is exposed to more
investment opportunities than an individual property owner. These increased investment
opportunities justify a premium to NAV.
As a result of the merger, NSI acquired several properties with occupancy rates
lower than what NSI typically experiences. Currently, NSI’s vacancy rate is higher than
the industry’s rate. Therefore, for purposes of this analysis there is no premium for rental
synergies.
31 http://www.mlindex.ml.com.
16
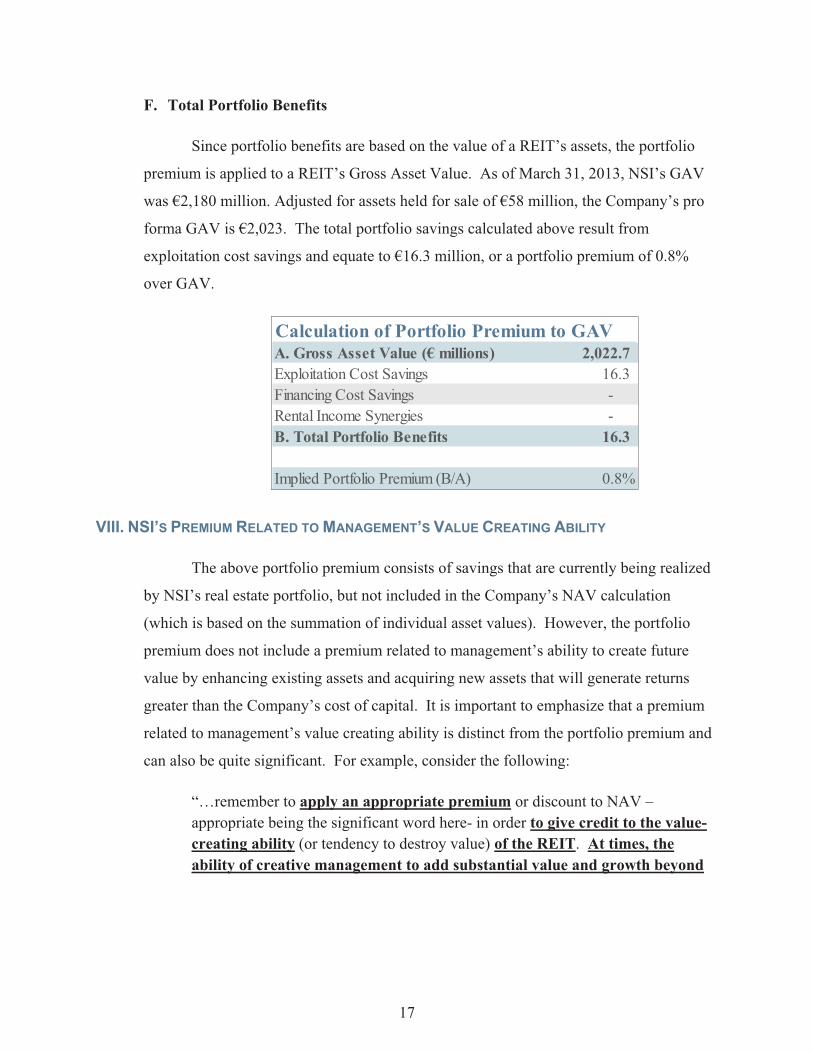
F. Total Portfolio Benefits
Since portfolio benefits are based on the value of a REIT’s assets, the portfolio
premium is applied to a REIT’s Gross Asset Value. As of March 31, 2013, NSI’s GAV
was €2,180 million. Adjusted for assets held for sale of €58 million, the Company’s pro
forma GAV is €2,023. The total portfolio savings calculated above result from
exploitation cost savings and equate to €16.3 million, or a portfolio premium of 0.8%
over GAV.
VIII. NSI’S PREMIUM RELATED TO MANAGEMENT’S VALUE CREATING ABILITY
The above portfolio premium consists of savings that are currently being realized
by NSI’s real estate portfolio, but not included in the Company’s NAV calculation
(which is based on the summation of individual asset values). However, the portfolio
premium does not include a premium related to management’s ability to create future
value by enhancing existing assets and acquiring new assets that will generate returns
greater than the Company’s cost of capital. It is important to emphasize that a premium
related to management’s value creating ability is distinct from the portfolio premium and
can also be quite significant. For example, consider the following:
“…remember to apply an appropriate premium or discount to NAV –appropriate being the significant word here- in order to give credit to the value-creating ability (or tendency to destroy value) of the REIT. At times, the ability of creative management to add substantial value and growth beyond
A. Gross Asset Value (€ millions) 2,022.7Exploitation Cost Savings 16.3Financing Cost Savings -Rental Income Synergies -B. Total Portfolio Benefits 16.3
Implied Portfolio Premium (B/A) 0.8%
Calculation of Portfolio Premium to GAV
17

what we’d expect from the properties themselves can significantly exceed the real estate values.”32
“After calculating NAV, Green Street evaluates seven factors to determine if a given REIT should trade at a premium above (or a discount below) its NAV, and if so, how great a premium (or discount):
1. Enterprise Value…This is the perceived ability of a management team to add value and generate growth in FFO. Does this company have untapped borrowing capacity? Or conversely, is it overleveraged? Does it have a considerable amount of land available for development? Has it demonstrated great negotiating skills?
***
The key is whether the public perceives that the REIT, which has added administrative expenses, can produce more value through its property management skills… and its development and acquisition strategies than one could obtain by buying individual projects directly.”33
“NAV as a static, even backward-looking perspective that doesn’t fully take into account the value-creating power that management provides.”34
With regards to NSI, management value creation initiatives include completing at
least 12 development projects with an investment totaling over €48 million.35 As
evidenced by the above initiatives, it is clear that NSI’s management is focused on
creating additional value in its real estate portfolio through asset improvements and other
strategies.
IX. NET ASSET VALUE AND GENERAL AND ADMINISTRATIVE EXPENSES
NSI’s general and administrative expenses consist largely of management salaries
and are itemized on the Company’s income statement. NSI’s gross general and
32 Block, Ralph L. Investing in REITs. Third Edition. Bloomberg Press, 2006, p. 217. 33 Poorvu, William J and Jeffrey L. Cruikshank. The Real Estate Game: The Intelligent Guide to Decision-Making and Investment. The Free Press, 1999, pp. 138 -139. Note that Green Street Advisors is a preeminent independent research, trading and consulting firm concentrating on REITs, other publicly traded real estate securities and private commercial real estate markets in North America and Europe. 34 Starkman, Dean. “The NAV Debate: Is net asset value the most accurate way to value REIT stocks?” www.nareit.com, May/June 2005. 35 NSI Management Report 2013.
18

administrative expenses are divided into three distinct groups. The first group consists of
property management costs which are allocated to NSI’s exploitation costs and are not
included in the Company’s report under G&A in the P&L statement. The second group
consists of indirect costs related to the managing of the Company’s existing property
portfolio (including letting and reletting, revaluations, acquisitions and sales of assets).
The third group is composed of direct costs related to the future improvement and
development of the Company (including asset development and redevelopment, potential
mergers and acquisitions, and international growth).36
With regards to the calculation of NSI’s adjusted NAV (which includes the
summation of individual asset values plus the portfolio premium), if a general expense
discount is applied, it should only be for the present value of the second group of
expenses. The Company’s property management costs (first group of expenses) are
allocated to the Company’s exploitation costs within the budget and are therefore already
included the Company’s NAV calculation.37 One could argue that second group of
expenses should be deducted because they represent the general and administrative costs
necessary to produce the 0.8% implied portfolio premium that was applied above. In
order to calculate the present value of these costs, we utilized the Gordon growth
formula:
PV = CF * (1 + g)
WACC-g
However, one important caveat is that the growth in general and administrative
expenses should be less than the growth in the Company’s revenue and cash flow. The
majority of general and administrative expenses is fixed and will not increase as the
Company’s top line increases. We applied a 1% growth rate for the Company’s year
ended March 31, 2012 general and administrative expenses related to managing the
existing property portfolio of €2.61 million.
36 NSI N.V. Annual Report for the Year Ended December 31, 2009, p.101 and Internal Company letter. 37 This is done since this allocation represents certain external resources previously used by NSI that are currently being provided by management, but are in essence part of the normative exploitation costs included in the NAV.
19
PV = 2.61 * (1 + .01) = €38.92 million
.0777 -.01
The calculation shows that €38.92 million may be deducted from the portfolio
premium of €16.3 million to represent management’s efforts in generating the portfolio
premium. Please note that this value is before including any additional value resulting
from the premium attributable to management’s asset improvement/acquisition efforts
(net of related cost) as detailed below.
With respect to the direct general expenses related to the future development and
growth of the Company (third group of expenses), it is improper to incorporate a discount
for these expenses without accounting for a premium attributable to management’s asset
improvement/acquisition efforts. If a premium related to management’s value creating
ability were applied to NSI’s NAV, it would cover the Company’s direct management
expenses of €6.18 million.38 Economically speaking, it would not make any sense for a
Company to pay its managers €6.18 million to create future value unless those managers
created value in excess of €6.18 million. Moreover, the €6.18 million in direct expenses
translates to only 1% of the Company’s NAV of €646 million. If one assumes
management can create more than 1% of additional value, all of NSI’s direct general
expenses are covered and an additional premium should be applied to the Company’s
NAV.
The Company has 12 development projects in the works totaling over €48
million, expected to be completed over the next one to two years.39 These projects have
an expected return on investment of approximately 15%, creating an additional €7.3
million in portfolio value (€1.17 million about direct general expenses).40 In order to
calculate the present value of this additional value, we again utilized the Gordon growth
formula with a 2% growth rate41:
38 Direct management expenses is for the Latest Twelve Months ended March 31, 2013. 39 NSI Management Report 2013. 40 Company management. 41 While a 1% growth rate was applied to the G&A supporting the portfolio premium, a 2% growth rate was applied to the G&A needed to create new value. The G&A related to the portfolio premium only has to maximize current portfolio benefits and does not require as much talent, resources, and incentives as the G&A needed to create future value. Thus, the G&A related to future value creation will grow at a faster rate.
20

PV = 1.17 * (1 + .02) = €20.62 million
.0777 -.02
It is important to note that it is debatable as to whether any discount for general
and administrative expenses should be applied. For example, Green Street Advisors the
preeminent REIT research and consulting firm, penalizes a REIT if its general and
administrative (overhead) costs are higher than those of the industry. The Company’s
website states that “Another self-evident premise is that a REIT with high G&A deserves
a lower premium to asset value than one with a lean operation.” William Poorvu and
Jeffrey Cruiskshank offer further insight to the Green Street model stating,
“Overhead costs. As in other industries, high overhead leads investors to place a discount on a REIT stock. Green Street calculates .7 percent of assets to be an average. It is unclear whether the present value of excessive overhead should be deducted to arrive at NAV, since potential buyers may or may not be factoring it into account.”42
The aforementioned quote highlights two important facts. First of all, it is unclear
whether any discount for management overhead should be applied. Secondly, the authors
point out that if a discount is applied, it should be for excessive overhead relative to the
REIT’s asset level. In order to determine whether NSI has excessive overhead, I
compared the Company’s ratio of total general expenses as a percentage of real estate
assets, excluding assets held for sale, to its competitors in the Dutch REIT market. As
shown in the table below, NSI’s ratio of .73% is better than the industry median and the
industry average of .90% and .89%, respectively. Given that NSI’s general expenses are
in the range of its Dutch competitors, it would be inappropriate to apply any discount to
the Company’s NAV for its general and administrative expenses.
42 Poorvu, William J and Jeffrey L. Cruikshank. The Real Estate Game: The Intelligent Guide to Decision-Making and Investment. The Free Press, 1999, p. 139.
21
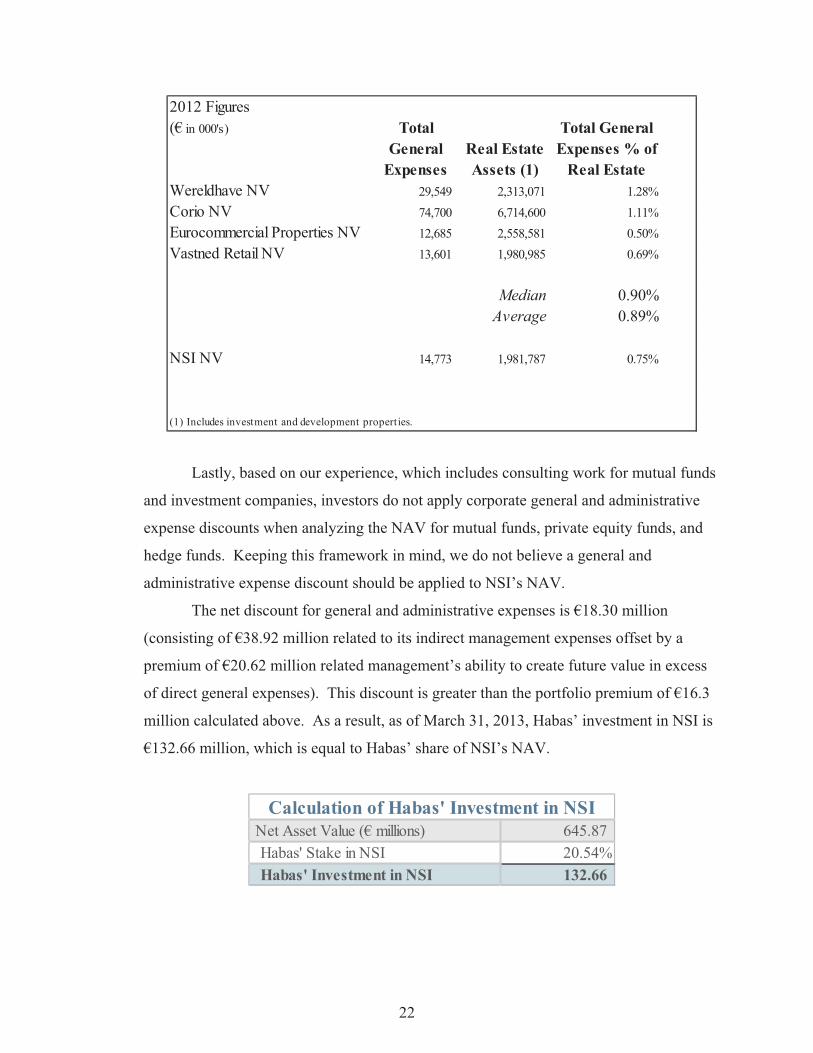
Lastly, based on our experience, which includes consulting work for mutual funds
and investment companies, investors do not apply corporate general and administrative
expense discounts when analyzing the NAV for mutual funds, private equity funds, and
hedge funds. Keeping this framework in mind, we do not believe a general and
administrative expense discount should be applied to NSI’s NAV.
The net discount for general and administrative expenses is €18.30 million
(consisting of €38.92 million related to its indirect management expenses offset by a
premium of €20.62 million related management’s ability to create future value in excess
of direct general expenses). This discount is greater than the portfolio premium of €16.3
million calculated above. As a result, as of March 31, 2013, Habas’ investment in NSI is
€132.66 million, which is equal to Habas’ share of NSI’s NAV.
2012 Figures(€ in 000's) Total
General Expenses
Real Estate Assets (1)
Total General Expenses % of
Real EstateWereldhave NV 29,549 2,313,071 1.28%Corio NV 74,700 6,714,600 1.11%Eurocommercial Properties NV 12,685 2,558,581 0.50%Vastned Retail NV 13,601 1,980,985 0.69%
Median 0.90%Average 0.89%
NSI NV 14,773 1,981,787 0.75%
(1) Includes investment and development properties.
Net Asset Value (€ millions) 645.87Habas' Stake in NSI 20.54%Habas' Investment in NSI 132.66
Calculation of Habas' Investment in NSI
22
X. NET ASSET VALUE AND STOCK PRICE
As of March 31, 2013, NSI’s stock price differs from its NAV. Our analysis
above determines to what extent a premium, if any, to NSI’s stated NAV should be
applied to Habas’ investment. NSI is a publicly traded company and its NAV is
presented in its audited financial statements. We were not requested to opine on the
accuracy of NSI’s NAV. We rely on NSI’s NAV as published in its audited financial
statements, and use it as a basis for our analysis.
In a market-wide crisis, there are numerous potential causes for the difference
between a stock price and a NAV. A stock price is affected by company specific factors
as well as market and industry factors. As discussed above, a REIT’s NAV “refers to the
commonly accepted market value of a company’s assets and properties after subtracting
its liabilities and obligations.”43 It is well known in the financial literature that in the
long-run the stock price should reflect fundamental value, but in the short-run, shocks to
the market can cause substantial deviations between the stock price and the intrinsic
value.
The following is not intended to provide an explanation for the difference
between NSI’s stock price and NAV. Instead, it is a discussion of potential factors, as
provided by NSI’s management.
According to NSI management, both macroeconomic and company specific
factors have negatively affected NSI’s stock price. For instance, liquidity in the
European equity markets has been greatly reduced. The Property Development sector, as
a result of its association with the financial sector, has been negatively impacted. The
Dutch real estate market, relative to other markets, has performed poorly.
As for company specific factors, NSI management notes that throughout 2012
NSI focused on its integration with VNOI, which resulted in a larger amount of churn and
increased vacancy in the portfolio. Also according to NSI management, NSI’s
introduction of a stock dividend in 2012 led to dilution of its stock. There is also market
43 Gordon, Mark. The Complete Guide to Investing in REITs-Real Estate Investment Trusts: How to Earn High Rates of Return Safety. Atlantic Publishing, 2008, pp. 53-54.
23
speculation that NSI will potentially issue additional shares to recapitalize the merged
company, resulting in further dilution.
In conclusion, NSI states that its property valuations are based on recent external
and internal valuations of its properties. According to NSI management, possible factors
causing the difference between NSI’s NAV and stock price are the illiquidity of the
equity markets, poor market sentiment in Europe and in the Dutch real estate market, the
uncertainty among investors about further possible impairments, and the dilution of NSI’s
stock.
XI. LIMITING FACTORS AND OTHER ASSUMPTIONS
This report is furnished solely for the benefit of Habas Tulip B.V. This report
may not be relied upon by any other person or entity without Back Bay Management
Corp.’s and its division, The Michel-Shaked Group’s (“BBM/MSG”) expressed, prior
written consent. Any disclosure of this report, whether or not consented to, shall not
create any obligation or liability on BBM/MSG, or any of its employees. This report is
delivered subject to the conditions, scope of engagement, limitations and understandings
set forth in this report, and subject to the understanding that in no event shall any officer,
director, employee, agent, shareholder or controlling person of BBM/MSG be subject to
any personal liability whatsoever.
BBM/MSG is independent of both Habas Tulip B.V. and NSI. In accordance
with recognized professional ethics, BBM/MSG’s professional fees for this service are
not contingent upon the opinion expressed herein, and BBM/MSG does not have a
present or intended financial interest in the outcome of this matter.
This report relies on (and adopts without verification), the appraised value of
NSI’s assets and its base NAV as displayed on the Company’s financial statements. This
report is not an independent valuation of NSI’s assets. The opinion expressed herein is
valid only for the stated purpose and date of this report. This report should not be
considered as a fairness opinion or any other opinion related to the attractiveness or lack
of attractiveness of an investment in NSI or Habas.
The conclusions reached herein are for the exclusive use of our client, and
represent the opinion of BBM/MSG based on information furnished to BBM/MSG by the
24
parties to the transaction, and various other sources. The extent to which the conclusions
and valuations arrived at herein should be relied upon, should be governed and weighed
accordingly.
We understand that this report is to be used for the consolidated financial
statements of Habas Tulip B.V. and Habas Investments (1960) Ltd. We allow that this
report will be included; attached and cited in the Habas Investments (1960) Ltd financial
statements, prospectus or any other immediate report. This report is prepared in
accordance with IFRS.
Public information, statistical information and data are from sources deemed to be
reliable. However, no representation is made as to the accuracy or completeness of such
information and data.
Neither all nor any part of the contents of this report should be conveyed to the
public through advertising, public relations, news, sales, mail, direct transmittal, or other
media, without BBM/MSG’s prior written consent and approval.
The working papers for this engagement are being retained in BBM/MSG’s files
and are available for your reference. BBM/MSG is available to support its valuation
conclusions should this be required. However, future services regarding the subject
matter of this report, including, but not limited to testimony or attendance in court, shall
not be required of BBM/MSG unless previous arrangements have been made in writing.
Respectfully submitted,
___________________________________
The Michel-Shaked Group
25

A Select List of The Michel-Shaked Group’s Financial Analysis/Valuation Experience
COMPANY INDUSTRYCOMPANY INDUSTRY
3Com/U.S. Robotics Computer Networks
Aavid Thermal Technologies Thermal Management
Ad l hi C i ti C i ti d C blAdelphia Communications Communications and Cable
Advest Asset Management Asset Management
Air Transport International Transportation
Airgate Inc. Telecommunications
Albany International Machinery Fabrics
Allegheny Health Education and Research Foundation Health Care
Alliance Leasing Financial Services
American Chain Link Fence Chain Link FencesAmerican Chain Link Fence Chain Link Fences
American International Group Financial Services/Insurance
American Power Conversion Electronic Instruments
Annidis Corporation Medical Imaging System
Apollo Real Estate Management Real Estate
Atlantic Richfield Oil and Gas
Au Bon Pain Restaurant
Baan Company N V Enterprise Management
1
Baan Company N.V. Enterprise Management
Bank of America Corp. Money Center Bank
Bank Julius Baer Banking
A non-exhaustive listing of The Michel-Shaked Group’s experience.
Appendix
26
A Select List of The Michel-Shaked Group’s Financial Analysis/Valuation Experience
COMPANY INDUSTRYCOMPANY INDUSTRY
Belle Casinos Casino
Bennett Funding Group Financial Services
B tl Fi i l Fi i l S iBentley Financial Financial Services
Berdon LLP Accounting
Bidsdirect.com Online Auction
Bike Athletic Recreational Products
BNP Paribas Banking
Boston Chicken Food & Beverage
Boston Communications Group Telecommunications
Boston Partners Asset Management Asset ManagementBoston Partners Asset Management Asset Management
Broadcom Semiconductors
Brown Brothers Harriman Investment Banking & Advisory
Builder’s Square Home Improvement
Caldor Corporation Retail
Cambridge Electric Electric Utility
Cambridge Technology Partners Computer Networks
Carleton Woolen Mills Textiles
2
Carleton Woolen Mills Textiles
Cascade International Retail – Clothing
Check Point Software Technologies Software/Security
A non-exhaustive listing of The Michel-Shaked Group’s experience.
Appendix
27
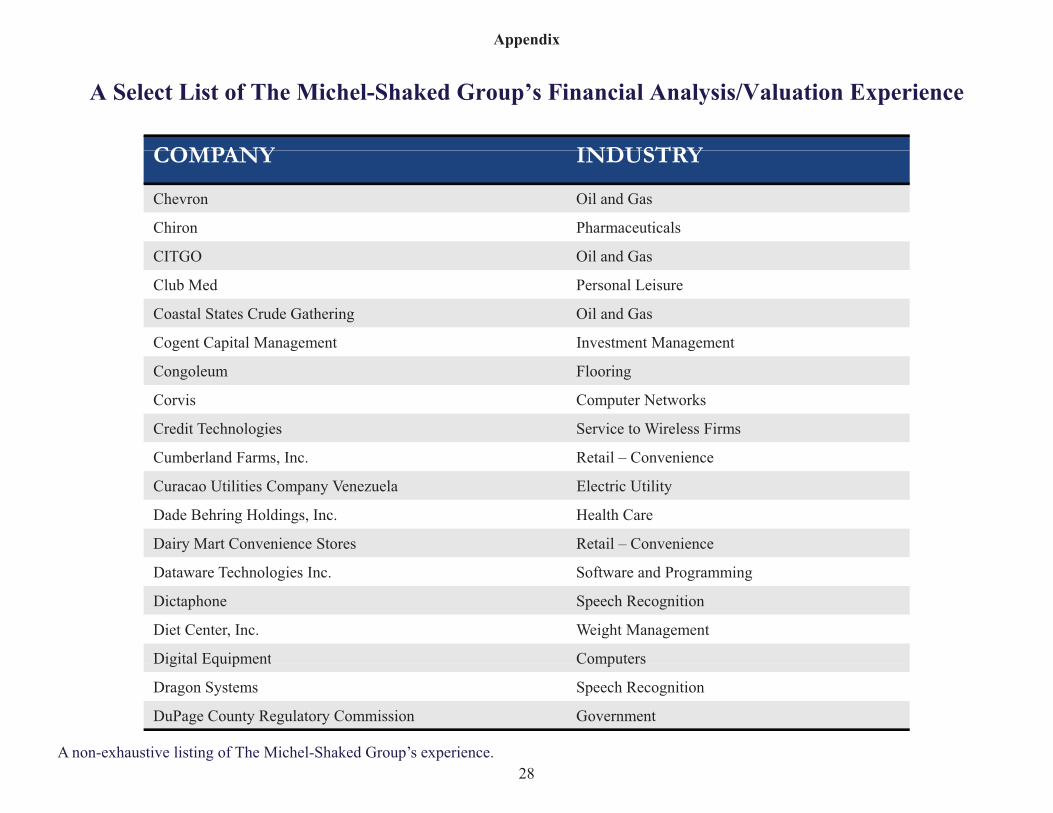
A Select List of The Michel-Shaked Group’s Financial Analysis/Valuation Experience
COMPANY INDUSTRYCOMPANY INDUSTRY
Chevron Oil and Gas
Chiron Pharmaceuticals
CITGO Oil d GCITGO Oil and Gas
Club Med Personal Leisure
Coastal States Crude Gathering Oil and Gas
Cogent Capital Management Investment Management
Congoleum Flooring
Corvis Computer Networks
Credit Technologies Service to Wireless Firms
Cumberland Farms Inc Retail ConvenienceCumberland Farms, Inc. Retail – Convenience
Curacao Utilities Company Venezuela Electric Utility
Dade Behring Holdings, Inc. Health Care
Dairy Mart Convenience Stores Retail – Convenience
Dataware Technologies Inc. Software and Programming
Dictaphone Speech Recognition
Diet Center, Inc. Weight Management
Digital Equipment Computers
3
Digital Equipment Computers
Dragon Systems Speech Recognition
DuPage County Regulatory Commission Government
A non-exhaustive listing of The Michel-Shaked Group’s experience.
Appendix
28

A Select List of The Michel-Shaked Group’s Financial Analysis/Valuation Experience
COMPANY INDUSTRYCOMPANY INDUSTRY
Duro Industries Textiles
Dynamics Research Corp. Computer Networks
Ell H ldi I M di l S liEllman Holdings, Inc. Medical Supplies
Enron Energy Services
Enstar Group Child Care/Insurance
Enterprise Capital Management Asset Management
Espirit Energy Trust Oil and Gas Operations
Executive Life Insurance Company of California Insurance
Exxon Oil and Gas
Filtronic Comtek PLC Electronic InstrumentsFiltronic Comtek PLC Electronic Instruments
Finagle-A-Bagel Restaurant
First Executive Life Insurance Insurance
Flintkote Building Materials/Asbestos Claims
The Fortress Corporation Storage
FoxMeyer Pharmaceutical Distribution
Fundamental Portfolio Advisors Financial Services
Gilbane, Inc. Real Estate Management and Construction
4
Gilbane, Inc. Real Estate Management and Construction
Gilbane Properties, Inc. Real Estate
Gillette (Rembrandt) Consumer Products
A non-exhaustive listing of The Michel-Shaked Group’s experience.
Appendix
29

A Select List of The Michel-Shaked Group’s Financial Analysis/Valuation Experience
COMPANY INDUSTRYCOMPANY INDUSTRY
Goldman Sachs & Co. Financial Services
Grand Bahama Power Electric Utility
G t l & C A t M tGruntal & Co. Asset Management
GTE Telecommunications
Habas Group Real Estate
Halliburton Energy Services
The Hartford Insurance Group Insurance
Hayes Lemmerz International Auto & Truck
Hechinger Home Improvement
High Voltage Engineering Electronic InstrumentsHigh Voltage Engineering Electronic Instruments
Home Insurance Insurance
Honeywell Controls and Aerospace
Iberdrola Energy
Innoveda, Inc. Software and Programming
Instron Corporation Measurement Instruments
Interland (n/k/a Web.Com) Internet Services
Interpublic Group of Companies, Inc. Public Relations/Advertising
5
Interpublic Group of Companies, Inc. Public Relations/Advertising
InverWorld Holdings Financial Services
iPCS, Inc. Telecommunications
A non-exhaustive listing of The Michel-Shaked Group’s experience.
Appendix
30

A Select List of The Michel-Shaked Group’s Financial Analysis/Valuation Experience
COMPANY INDUSTRYCOMPANY INDUSTRY
ITT Conglomerate
Jones Truck Lines Trucking
JPSCO (J i ) El t i UtilitJPSCO (Jamaica) Electric Utility
JWP Water Utility & Engineering/Construction
Kenner & Company Private Equity Fund
Kinder Morgan Energy Services
Kinko’s Copying
Kinross Gold Corporation Basic Materials
Lady Luck Gaming Casino
Laminate Kingdom (d/b/a Floors Today) FlooringLaminate Kingdom (d/b/a Floors Today) Flooring
Lancer Partners Hedge Fund
Lebenthal & Co. Public Finance Activities
Lernout & Hauspie Speech Recognition
Liberty Mutual Insurance
The Liggett Group Tobacco
Lincoln North Partnership Real Estate and Construction
Litchfield Realty Company Real Estate
6
Litchfield Realty Company Real Estate
Lockheed Martin Aerospace and Defense
LOGAL Software, Inc. Software
A non-exhaustive listing of The Michel-Shaked Group’s experience.
Appendix
31

A Select List of The Michel-Shaked Group’s Financial Analysis/Valuation Experience
COMPANY INDUSTRYCOMPANY INDUSTRY
Los Angeles Metropolitan Transportation Authority Government
The Lyme Timber Company Real Estate
M4 E i t l E i t l S iM4 Environmental Environmental Services
Manufacturers and Traders Trusts Banking
Mark Properties Real Estate
Matrix Capital Markets Merger & Acquisition Advisory
Mayer Group Real Estate Consultants
McKessonHBOC, Inc. Pharmaceuticals
Merry-Go-Round Retail – Clothing
Metromedia International Group TelecommunicationsMetromedia International Group Telecommunications
Metropolitan West Asset Management Asset Management
MGM/UA Communications Film/Studios
Micro Networks Electronic Instruments
Mirant Energy Services
Mobil Oil and Gas
The MONY Group Insurance
Morse Tool Tools
7
Morse Tool Tools
Munford, Inc. (d/b/a Majik Market) Retail – Convenience
National Power Corporation (Philippines) Electric Utility
A non-exhaustive listing of The Michel-Shaked Group’s experience.
Appendix
32

A Select List of The Michel-Shaked Group’s Financial Analysis/Valuation Experience
COMPANY INDUSTRYCOMPANY INDUSTRY
NetBank, Inc. Internet Banking
NetFax, Incorporated Internet Services
N th M h t F d I d St lNorth Manchester Foundry Iron and Steel
ON Technology Software Programming
One Lincoln Real Estate
OneStar Telecommunications
PaineWebber, Inc. Financial Services
Papa Gino’s Food & Beverage
Paracelsus Healthcare Corp. Health Care
Parisian Retail ClothingParisian Retail – Clothing
PETCO Retail – Pet Care
PCD, Inc. Electronic Instruments
PictureTel Communications Equipment
Pilgrim Asset Management Investment Management
Piper Capital Management, Inc. Financial
Polaroid Cameras and Film
Portland General Electric Electric Utility
8
Portland General Electric Electric Utility
Power Generation Company (Trinidad) Electric Utility
PRI Automation Semiconductors
A non-exhaustive listing of The Michel-Shaked Group’s experience.
Appendix
33
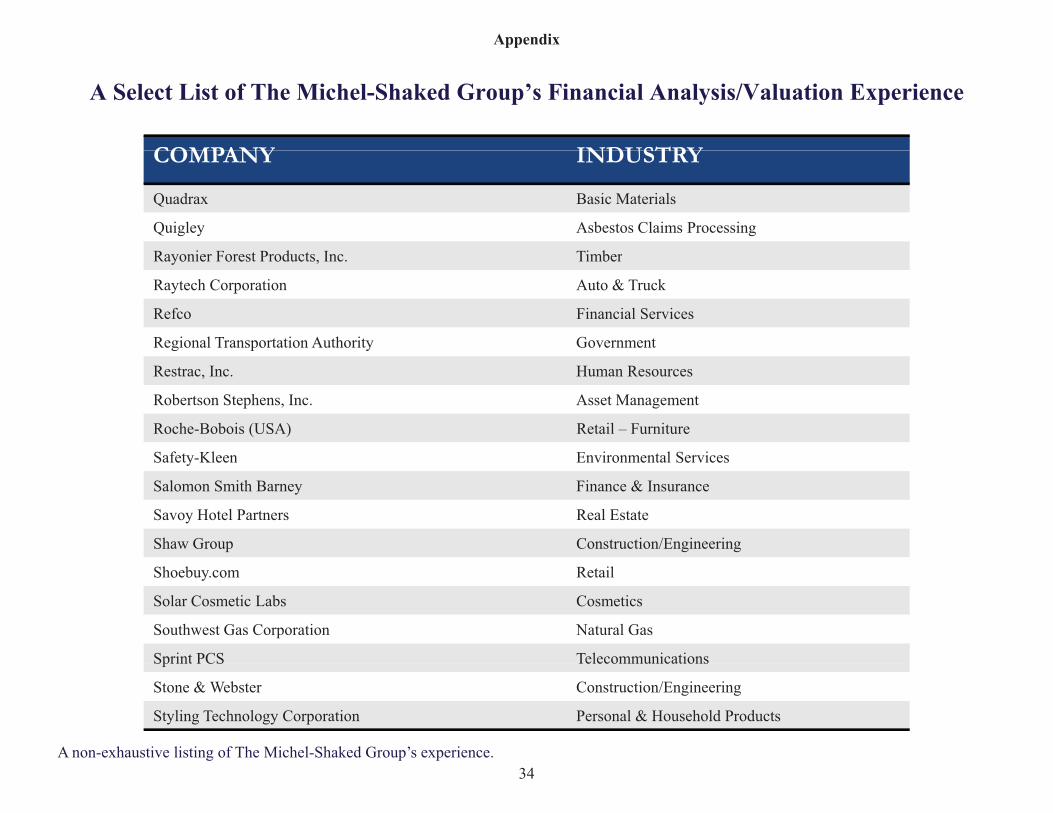
A Select List of The Michel-Shaked Group’s Financial Analysis/Valuation Experience
COMPANY INDUSTRYCOMPANY INDUSTRY
Quadrax Basic Materials
Quigley Asbestos Claims Processing
R i F t P d t I Ti bRayonier Forest Products, Inc. Timber
Raytech Corporation Auto & Truck
Refco Financial Services
Regional Transportation Authority Government
Restrac, Inc. Human Resources
Robertson Stephens, Inc. Asset Management
Roche-Bobois (USA) Retail – Furniture
Safety Kleen Environmental ServicesSafety-Kleen Environmental Services
Salomon Smith Barney Finance & Insurance
Savoy Hotel Partners Real Estate
Shaw Group Construction/Engineering
Shoebuy.com Retail
Solar Cosmetic Labs Cosmetics
Southwest Gas Corporation Natural Gas
Sprint PCS Telecommunications
9
Sprint PCS Telecommunications
Stone & Webster Construction/Engineering
Styling Technology Corporation Personal & Household Products
A non-exhaustive listing of The Michel-Shaked Group’s experience.
Appendix
34

A Select List of The Michel-Shaked Group’s Financial Analysis/Valuation Experience
COMPANY INDUSTRYCOMPANY INDUSTRY
Summit Technology Vision Technology
Texaco Oil and Gas
T l A ti T l i tiTelecom Argentina Telecommunications
Transition Systems Health Care Information
UNIFI Communications Telecommunications
United Companies Financial Financial Services
U.S. Financial Life Companies Asset Management
US Unwired Telecommunications
US West (n/k/a Qwest) Telecommunications
Vencor Hospital ManagementVencor Hospital Management
Ventas Realty Real Estate
Vetta Sports Biking Accessories
Wieboldt Stores Department Stores
Wilmington Trust Financial Services
World Bazaar Giftware
Xpedior, Inc. Computer Services
Xyvision, Inc. Software Programming
10
Xyvision, Inc. Software Programming
Zenith Electronics Consumer Electronics
Zurich Insurance Insurance
A non-exhaustive listing of The Michel-Shaked Group’s experience.
Appendix
35
Exhibit 1
NSI Regression DataFor the Period November 24, 2011 through June 30, 2012
NSI MSCI Index NSI MSCI Index Date Closing Price Closing Price % Return % Return
Nov-24-2011 9.50 1322.57Nov-25-2011 9.21 1321.23 -3.1% -0.1%Nov-28-2011 9.57 1366.44 3.9% 3.4%Nov-29-2011 9.79 1381.76 2.3% 1.1%Nov-30-2011 9.84 1427.27 0.5% 3.2%Dec-01-2011 9.53 1431.70 -3.3% 0.3%Dec-02-2011 9.30 1441.07 -2.4% 0.7%Dec-05-2011 9.30 1455.30 0.0% 1.0%Dec-06-2011 9.30 1438.59 0.0% -1.2%Dec-07-2011 9.27 1444.37 -0.3% 0.4%Dec-08-2011 9.05 1421.67 -2.4% -1.6%Dec-09-2011 8.90 1428.19 -1.7% 0.5%Dec-12-2011 8.28 1404.67 -7.3% -1.7%Dec-13-2011 8.50 1396.10 2.7% -0.6%Dec-14-2011 8.50 1363.55 0.0% -2.4%Dec-15-2011 9.00 1368.46 5.7% 0.4%Dec-16-2011 8.66 1370.78 -3.9% 0.2%Dec-19-2011 8.78 1360.97 1.4% -0.7%Dec-20-2011 9.00 1387.78 2.5% 2.0%Dec-21-2011 9.00 1384.81 0.0% -0.2%Dec-22-2011 9.12 1393.43 1.3% 0.6%Dec-23-2011 9.25 1401.60 1.5% 0.6%Dec-27-2011 9.29 1405.36 0.4% 0.3%Dec-28-2011 9.17 1386.64 -1.3% -1.3%
36
Exhibit 1
NSI Regression DataFor the Period November 24, 2011 through June 30, 2012
NSI MSCI Index NSI MSCI Index Date Closing Price Closing Price % Return % Return
Dec-29-2011 9.35 1393.45 2.0% 0.5%Dec-30-2011 9.45 1412.55 1.0% 1.4%Jan-02-2012 9.50 1422.40 0.5% 0.7%Jan-03-2012 9.40 1446.64 -1.0% 1.7%Jan-04-2012 9.05 1439.89 -3.8% -0.5%Jan-05-2012 9.00 1416.47 -0.6% -1.6%Jan-06-2012 8.84 1406.71 -1.8% -0.7%Jan-09-2012 8.50 1405.10 -3.9% -0.1%Jan-10-2012 8.65 1428.96 1.7% 1.7%Jan-11-2012 8.57 1419.33 -1.0% -0.7%Jan-12-2012 8.87 1423.02 3.5% 0.3%Jan-13-2012 8.89 1415.22 0.2% -0.5%Jan-16-2012 9.15 1417.89 2.9% 0.2%Jan-17-2012 9.25 1437.05 1.1% 1.3%Jan-18-2012 9.29 1445.00 0.4% 0.6%Jan-19-2012 9.24 1464.78 -0.5% 1.4%Jan-20-2012 9.25 1472.05 0.2% 0.5%Jan-23-2012 9.35 1487.63 1.1% 1.1%Jan-24-2012 9.40 1476.25 0.5% -0.8%Jan-25-2012 9.20 1475.53 -2.2% 0.0%Jan-26-2012 9.29 1505.67 1.0% 2.0%Jan-27-2012 9.38 1495.58 0.9% -0.7%Jan-30-2012 9.32 1480.91 -0.7% -1.0%Jan-31-2012 9.40 1486.74 0.9% 0.4%
37
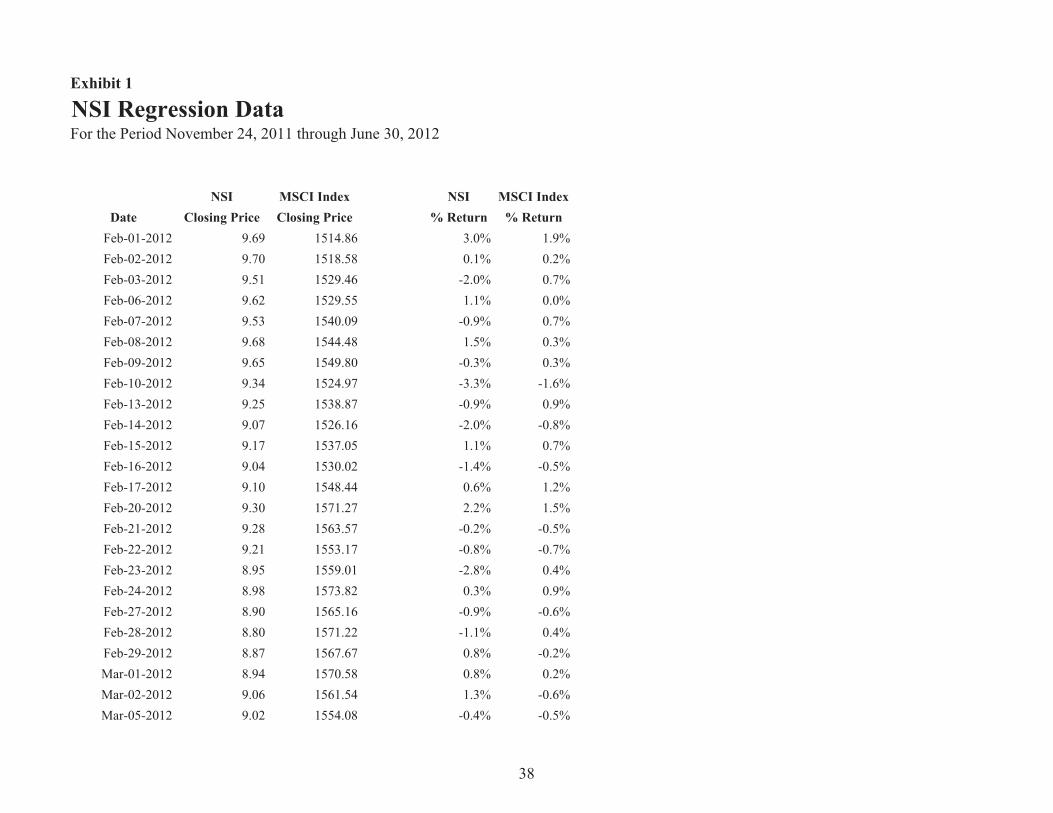
Exhibit 1
NSI Regression DataFor the Period November 24, 2011 through June 30, 2012
NSI MSCI Index NSI MSCI Index Date Closing Price Closing Price % Return % Return
Feb-01-2012 9.69 1514.86 3.0% 1.9%Feb-02-2012 9.70 1518.58 0.1% 0.2%Feb-03-2012 9.51 1529.46 -2.0% 0.7%Feb-06-2012 9.62 1529.55 1.1% 0.0%Feb-07-2012 9.53 1540.09 -0.9% 0.7%Feb-08-2012 9.68 1544.48 1.5% 0.3%Feb-09-2012 9.65 1549.80 -0.3% 0.3%Feb-10-2012 9.34 1524.97 -3.3% -1.6%Feb-13-2012 9.25 1538.87 -0.9% 0.9%Feb-14-2012 9.07 1526.16 -2.0% -0.8%Feb-15-2012 9.17 1537.05 1.1% 0.7%Feb-16-2012 9.04 1530.02 -1.4% -0.5%Feb-17-2012 9.10 1548.44 0.6% 1.2%Feb-20-2012 9.30 1571.27 2.2% 1.5%Feb-21-2012 9.28 1563.57 -0.2% -0.5%Feb-22-2012 9.21 1553.17 -0.8% -0.7%Feb-23-2012 8.95 1559.01 -2.8% 0.4%Feb-24-2012 8.98 1573.82 0.3% 0.9%Feb-27-2012 8.90 1565.16 -0.9% -0.6%Feb-28-2012 8.80 1571.22 -1.1% 0.4%Feb-29-2012 8.87 1567.67 0.8% -0.2%Mar-01-2012 8.94 1570.58 0.8% 0.2%Mar-02-2012 9.06 1561.54 1.3% -0.6%Mar-05-2012 9.02 1554.08 -0.4% -0.5%
38
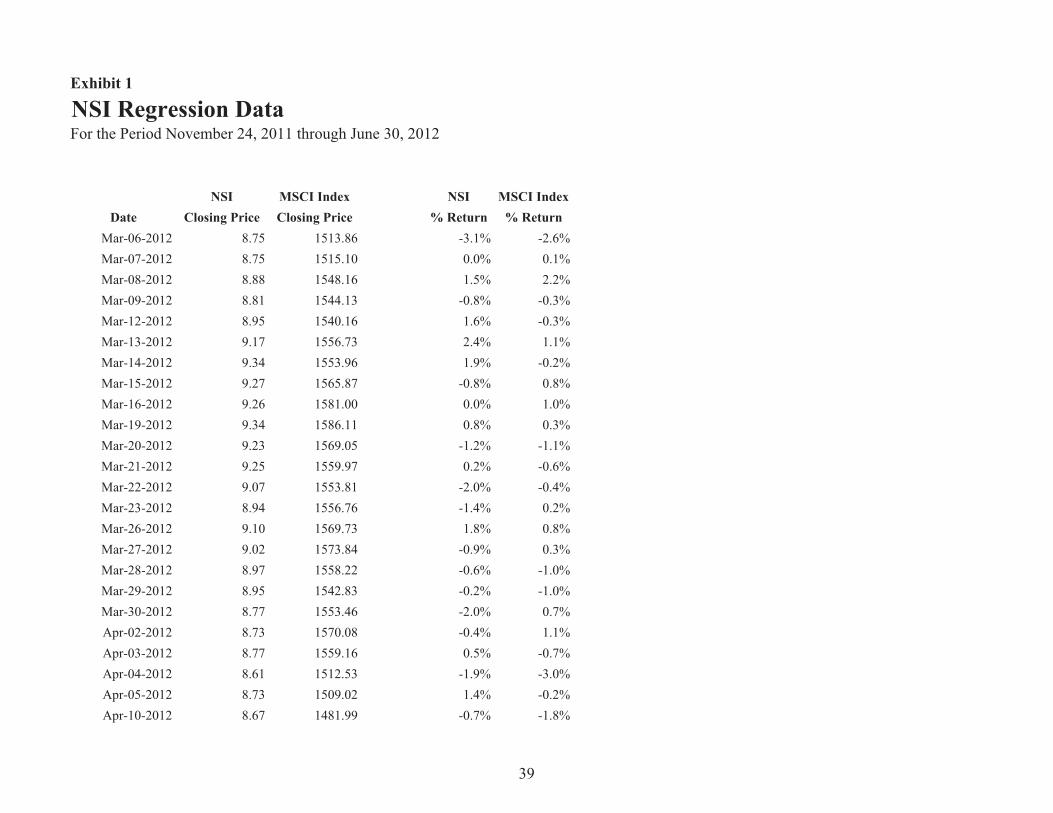
Exhibit 1
NSI Regression DataFor the Period November 24, 2011 through June 30, 2012
NSI MSCI Index NSI MSCI Index Date Closing Price Closing Price % Return % Return
Mar-06-2012 8.75 1513.86 -3.1% -2.6%Mar-07-2012 8.75 1515.10 0.0% 0.1%Mar-08-2012 8.88 1548.16 1.5% 2.2%Mar-09-2012 8.81 1544.13 -0.8% -0.3%Mar-12-2012 8.95 1540.16 1.6% -0.3%Mar-13-2012 9.17 1556.73 2.4% 1.1%Mar-14-2012 9.34 1553.96 1.9% -0.2%Mar-15-2012 9.27 1565.87 -0.8% 0.8%Mar-16-2012 9.26 1581.00 0.0% 1.0%Mar-19-2012 9.34 1586.11 0.8% 0.3%Mar-20-2012 9.23 1569.05 -1.2% -1.1%Mar-21-2012 9.25 1559.97 0.2% -0.6%Mar-22-2012 9.07 1553.81 -2.0% -0.4%Mar-23-2012 8.94 1556.76 -1.4% 0.2%Mar-26-2012 9.10 1569.73 1.8% 0.8%Mar-27-2012 9.02 1573.84 -0.9% 0.3%Mar-28-2012 8.97 1558.22 -0.6% -1.0%Mar-29-2012 8.95 1542.83 -0.2% -1.0%Mar-30-2012 8.77 1553.46 -2.0% 0.7%Apr-02-2012 8.73 1570.08 -0.4% 1.1%Apr-03-2012 8.77 1559.16 0.5% -0.7%Apr-04-2012 8.61 1512.53 -1.9% -3.0%Apr-05-2012 8.73 1509.02 1.4% -0.2%Apr-10-2012 8.67 1481.99 -0.7% -1.8%
39

Exhibit 1
NSI Regression DataFor the Period November 24, 2011 through June 30, 2012
NSI MSCI Index NSI MSCI Index Date Closing Price Closing Price % Return % Return
Apr-11-2012 8.65 1486.73 -0.1% 0.3%Apr-12-2012 8.35 1506.27 -3.6% 1.3%Apr-13-2012 8.30 1488.02 -0.6% -1.2%Apr-16-2012 8.20 1486.07 -1.2% -0.1%Apr-17-2012 8.27 1509.39 0.9% 1.6%Apr-18-2012 8.30 1508.23 0.3% -0.1%Apr-19-2012 8.16 1502.34 -1.7% -0.4%Apr-20-2012 8.09 1511.15 -0.8% 0.6%Apr-23-2012 8.25 1481.26 1.9% -2.0%Apr-24-2012 8.17 1494.90 -1.0% 0.9%Apr-25-2012 8.20 1504.32 0.4% 0.6%Apr-26-2012 8.04 1513.11 -1.9% 0.6%Apr-27-2012 8.33 1521.38 3.4% 0.5%Apr-30-2012 8.31 1516.21 -0.2% -0.3%
May-02-2012 8.21 1504.56 -1.3% -0.8%May-03-2012 8.07 1503.67 -1.6% -0.1%May-04-2012 7.90 1483.87 -2.1% -1.3%May-07-2012 8.10 1471.98 2.5% -0.8%May-08-2012 7.99 1454.15 -1.3% -1.2%May-09-2012 7.80 1440.42 -2.5% -0.9%May-10-2012 7.78 1446.19 -0.2% 0.4%May-11-2012 7.68 1444.52 -1.3% -0.1%May-14-2012 7.32 1418.66 -4.8% -1.8%May-15-2012 7.22 1402.70 -1.4% -1.1%
40
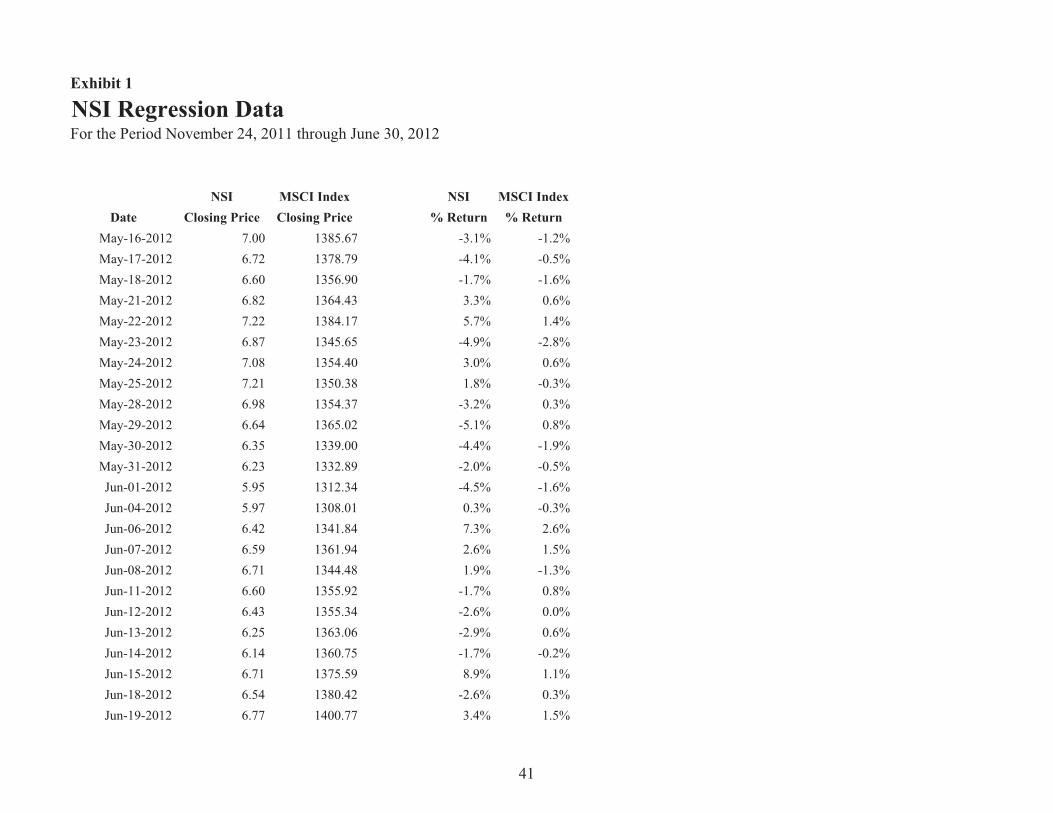
Exhibit 1
NSI Regression DataFor the Period November 24, 2011 through June 30, 2012
NSI MSCI Index NSI MSCI Index Date Closing Price Closing Price % Return % Return
May-16-2012 7.00 1385.67 -3.1% -1.2%May-17-2012 6.72 1378.79 -4.1% -0.5%May-18-2012 6.60 1356.90 -1.7% -1.6%May-21-2012 6.82 1364.43 3.3% 0.6%May-22-2012 7.22 1384.17 5.7% 1.4%May-23-2012 6.87 1345.65 -4.9% -2.8%May-24-2012 7.08 1354.40 3.0% 0.6%May-25-2012 7.21 1350.38 1.8% -0.3%May-28-2012 6.98 1354.37 -3.2% 0.3%May-29-2012 6.64 1365.02 -5.1% 0.8%May-30-2012 6.35 1339.00 -4.4% -1.9%May-31-2012 6.23 1332.89 -2.0% -0.5%Jun-01-2012 5.95 1312.34 -4.5% -1.6%Jun-04-2012 5.97 1308.01 0.3% -0.3%Jun-06-2012 6.42 1341.84 7.3% 2.6%Jun-07-2012 6.59 1361.94 2.6% 1.5%Jun-08-2012 6.71 1344.48 1.9% -1.3%Jun-11-2012 6.60 1355.92 -1.7% 0.8%Jun-12-2012 6.43 1355.34 -2.6% 0.0%Jun-13-2012 6.25 1363.06 -2.9% 0.6%Jun-14-2012 6.14 1360.75 -1.7% -0.2%Jun-15-2012 6.71 1375.59 8.9% 1.1%Jun-18-2012 6.54 1380.42 -2.6% 0.3%Jun-19-2012 6.77 1400.77 3.4% 1.5%
41

Exhibit 1
NSI Regression DataFor the Period November 24, 2011 through June 30, 2012
NSI MSCI Index NSI MSCI Index Date Closing Price Closing Price % Return % ReturnJun-20-2012 6.84 1411.88 1.1% 0.8%Jun-21-2012 6.76 1396.21 -1.2% -1.1%Jun-22-2012 6.59 1379.85 -2.4% -1.2%Jun-25-2012 6.63 1362.37 0.5% -1.3%Jun-27-2012 6.52 1373.42 -1.6% 0.8%Jun-28-2012 6.40 1373.62 -1.8% 0.0%Jun-29-2012 6.72 1423.38 4.9% 3.6%
42

Exhibit 2
NSI Regression Results
Regression StatisticsMultiple R 0.483R Square 0.233Adjusted R Square 0.228Standard Error 0.021Observations 150
Coefficients Standard Error t StatIntercept (0.003) 0.002 (1.636)MSCI EAFE Index 1.003 0.149 6.709
43

Exhibit 3ANSI N.V.Weighted Average Cost of Capital (WACC)As of March 31, 2013
Cost of Equity WACCAfter-Tax Cost of Debt (4) 5.00%
Risk Free Rate (1) 2.7% Weight of Debt (5) 72.50%Beta (2) 1.00Market Premium 6.70% Cost of Equity 15.08%Size Premium (3) 2.70% Weight of Equity (5) 27.50%Specific Risk Premium 3.00%
Cost of Equity 15.08% WACC 7.77%
(1) Represents 20-Year Risk Free Rate for Euro area from European Central Bank (ECB) database.(2) See Exhibit 2.(3) Stocks, Bonds, Bills, and Inflation 2013 Yearbook Valuation Edition. Size premium corresponds to 9th decile (3/31/13 market cap in USD).(4) NSI N.V. Interim Report for the Period ended March 31, 2013(5) See Exhibit 3B.
44

Exhibit 3BNSI N.V.Enterprise ValueAs of March 31, 2013(millions, except per share data)
Shares Market Preferred Adjusted EnterpriseCompany Stock Price Outstanding Value Stock Debt (1) Value Debt (%) Equity (%)
NSI N.V. € 5.60 68.2 € 381.7 - € 1,006.3 € 1,388.0 72.50% 27.50%
(1) NSI N.V. Interim Report for the Period Ended March 31, 2013, adjusted per report.
Capital Structure
45
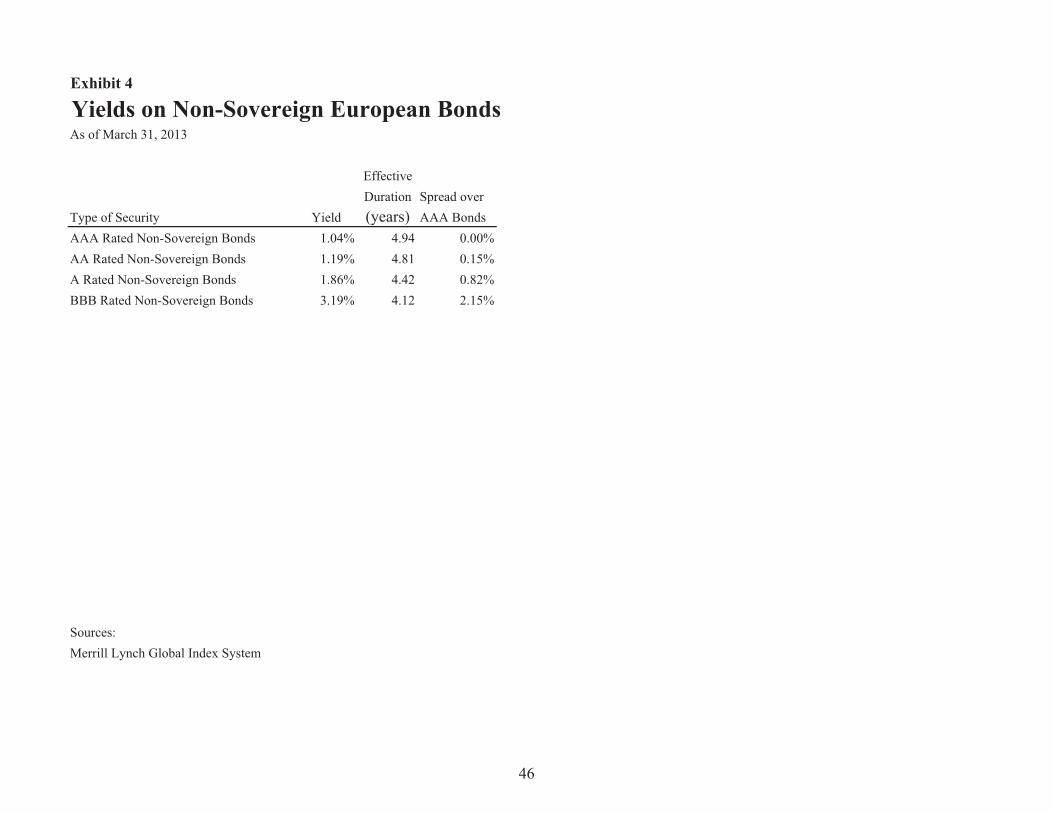
Exhibit 4
Yields on Non-Sovereign European BondsAs of March 31, 2013
EffectiveDuration Spread over
Type of Security Yield (years) AAA BondsAAA Rated Non-Sovereign Bonds 1.04% 4.94 0.00%AA Rated Non-Sovereign Bonds 1.19% 4.81 0.15%A Rated Non-Sovereign Bonds 1.86% 4.42 0.82%BBB Rated Non-Sovereign Bonds 3.19% 4.12 2.15%
Sources:Merrill Lynch Global Index System
46
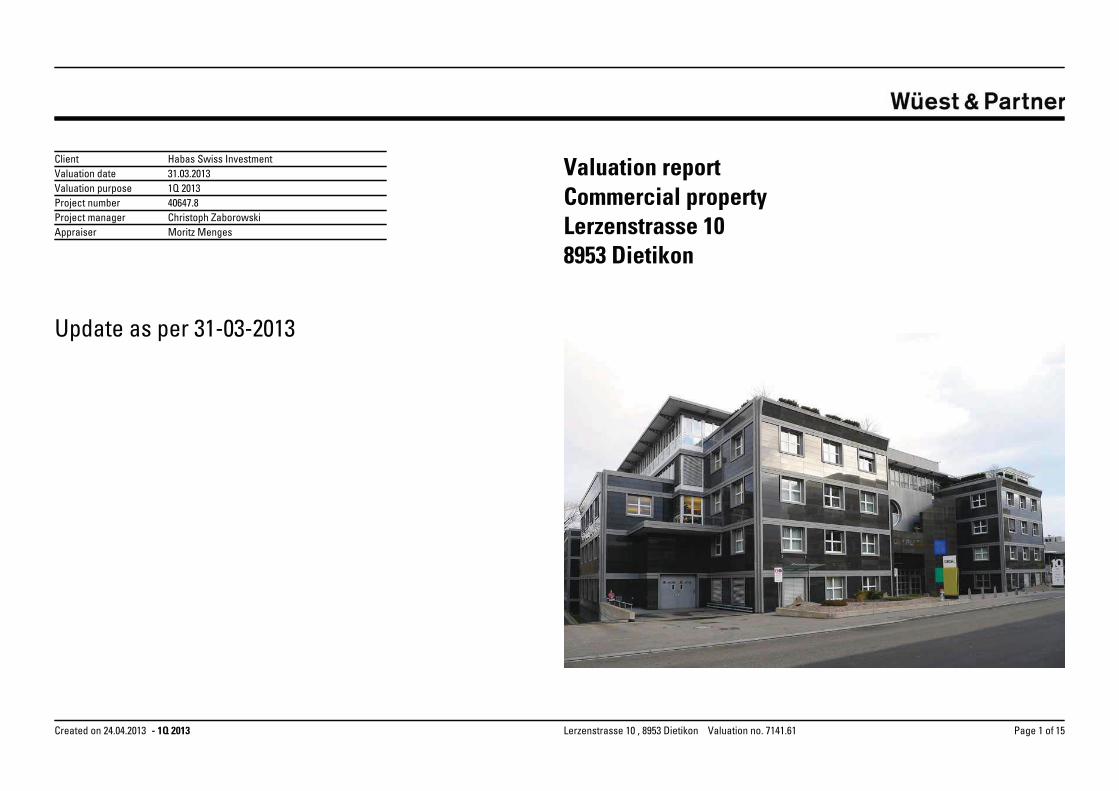
Update as per 31-03-2013
8953 DietikonLerzenstrasse 10 Commercial property
Moritz MengesChristoph Zaborowski
1Q 201331.03.2013
AppraiserProject managerProject number
ClientValuation date Valuation reportValuation purpose
40647.8
Habas Swiss Investment
- 1Q 2013 Page 1 of 15Lerzenstrasse 10 , 8953 Dietikon Valuation no. 7141.61Created on 24.04.2013
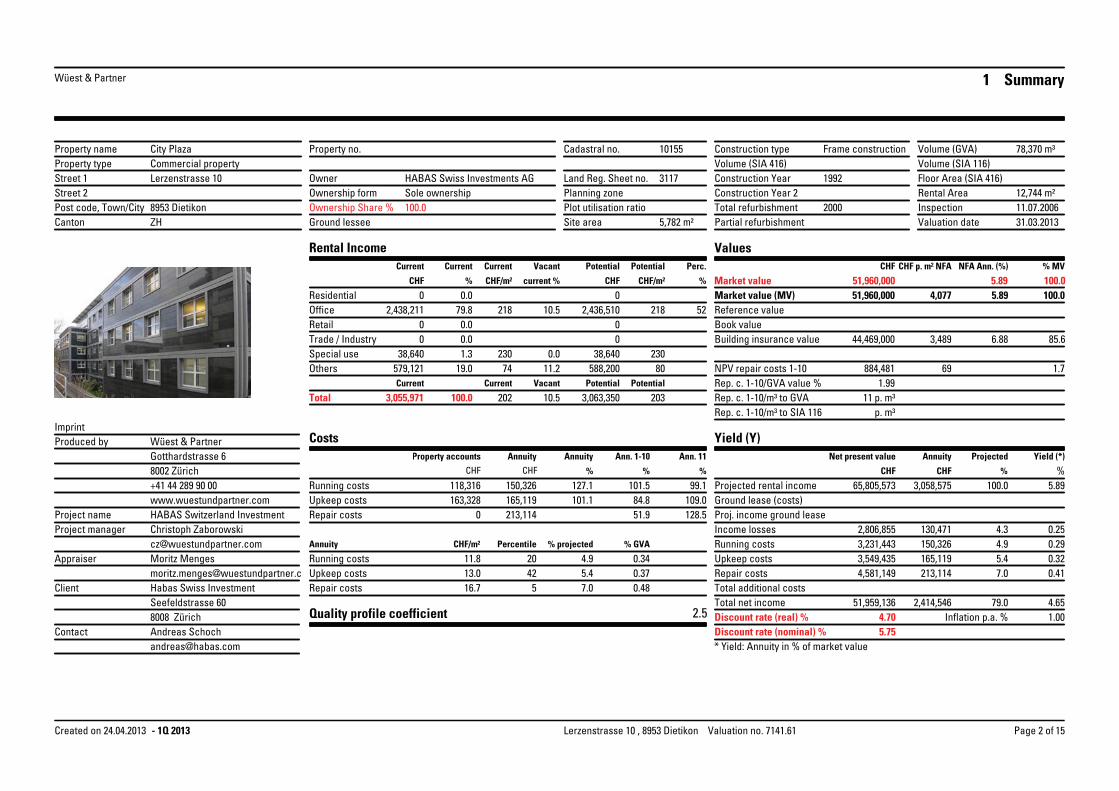
Wüest & Partner 1 Summary
Volume (SIA 416)
CHF
* Yield: Annuity in % of market value
5.89
Volume (GVA)
NPV repair costs 1-10
%
Land Reg. Sheet no.Volume (SIA 116)
Plot utilisation ratio
Ann. 11
Vacant
Ann. 1-10
Potential
Floor Area (SIA 416)
Project manager
Post code, Town/City
Construction Year
Discount rate (nominal) %
Ownership form
Vacant
Canton
Quality profile coefficient
Current
Property accounts Annuity
Construction Year 2
Building insurance value
%
InspectionGround lessee
Potential
Costs
Street 1
NFA Ann. (%)
Rep. c. 1-10/m³ to GVA
Perc.
Street 2
Net present value
Rep. c. 1-10/GVA value %
Ownership Share %
Current
Rep. c. 1-10/m³ to SIA 116
Planning zone
Project name
%
Discount rate (real) %
Annuity
Total
Market value
%
Current
Total refurbishment
Rental IncomeCurrent
Values
Owner
% projected
Cadastral no.
Imprint
Construction type
Percentile
% MV
%
%
Property no.
p. m³
Site area Partial refurbishment
Annuity
%
Current
Yield (*)
% GVA
Potential
Property type
current %
p. m³
Market value (MV)
Client
Produced by
Proj. income ground lease
Reference value
Yield (Y)
Inflation p.a. %
Annuity
Potential
Property name
Appraiser
Book value
Rental Area
Contact
Valuation date
Projected
128.5
Frame construction
0
Repair costs
100.0
12,744 m²
Seefeldstrasse 60
CHF
230
3,055,971
4.3
163,328
Others 69
Repair costs
2.5
0.37
84.8
0.34 165,119
99.1
3117
CHF
HABAS Swiss Investments AG
00
1.7
218
Trade / Industry
100.0
Income losses
Upkeep costs
579,121
2,438,211
11
7.0
8002 Zürich
4.65
3,231,443
Gotthardstrasse 6
10155
38,6400
2000
202
Upkeep costs
0.0
4.90.29
Lerzenstrasse 10
City Plaza
80
3,549,435
CHF
1992
10.5
0
100.0
38,64011.2
Total net income
Ground lease (costs)213,114
6.88
51,960,000
8953 Dietikon
3,489
Repair costs
150,326
CHF
Andreas Schoch
CHF p. m² NFA
0.0
130,471
78,370 m³
+41 44 289 90 00
16.7
Office
ZH
165,119 101.1
100.0
11.8
Total additional costs4,581,149
CHF
85.6
5.89
CHF/m²
1.99
31.03.2013
8008 Zürich
0
884,481
118,316 3,058,575
5,782 m²
51.9HABAS Switzerland Investment
CHF/m²
20 0.325.4
101.5Running costs
5
Christoph Zaborowski
2,436,510
Commercial property
11.07.2006
79.0
127.1
Running costs
0
150,326
203
213,114
2,414,546
109.0
Wüest & Partner
Projected rental income
Retail218
Sole ownership
1.3 230
4.70
51,960,000
CHF
19.0
0.48
Moritz Menges4.9
7.0Upkeep costs
0.079.8
74
5.75
3,063,350
Habas Swiss Investment
5.89
51,959,136
100.04,077
2,806,855
Special use
1.00
5.4
0.25Running costs
588,200
Residential
65,805,573
52
4213.0
0.0
CHF/m²
44,469,000
10.5
www.wuestundpartner.com
0.41
- 1Q 2013 Page 2 of 15Lerzenstrasse 10 , 8953 Dietikon Valuation no. 7141.61Created on 24.04.2013

Wüest & Partner 2 Summary II
in nominal terms
in nominal terms
31.03.2023
31.03.2018
CHF
CHF p. Mt.
9.91592480.00.09.9159
00
248
Parking space (bike/bicycle)Outdoor parkingIndoor parking
0000000
Total6 Room +5 Room4 Room3 Room2 Room1 Room
Total
%UnitsParking TypeVacantPercentileUnitsApartment Type
%
Parking Spaces - DetailsApartment Mix
%Vacant
CurrentCHF p. Mt.
10069.063.19.0
MthsLatestWeighted Av.Earliest
IndexationContract Length
1,16210.05252
% m²Potential
%Current
Percentile Classification
25315013111572609397318257181403274211193176
Trade / IndustryRetailOffice
30925822720590%70%50%30%
16910%
p. m²CHF
Price Ranges Municipality
Residential%
Vacant
Current Weighted Av.Mths Mths %
Current
Locational quality
Properties with handicaps
Problem properties
Prime propertiesQuestion marks
III II I
VI V IV
IX VIII VII
poor good
Period1 2 3 4 5 6 7 111098
105.7105.3104.9104.4102.4102.2102.0101.8101.5101.2100.0Market value
110.2109.1108.0106.9105.9105.9105.0103.9102.7101.7100.0Projected rental income
110.8109.7108.6107.5106.5109.7109.8108.8107.8106.5100.0Total income
97.496.495.594.593.692.791.792.491.492.0100.0Running costs
4.94.94.94.94.94.84.84.94.95.05.5 in % of projected rental income
142.0109.4108.3107.2106.2105.1104.1103.0102.0101.0100.0Upkeep costs
5.94.64.64.64.64.54.54.54.54.54.6 in % of projected rental income
100.80.00.00.0283.10.00.00.00.00.0100.0Repair costs
109.351.951.450.9189.849.949.449.348.848.8100.0Total costs
111.2125.0123.8122.684.4125.5125.8124.6123.4121.9100.0Total net income
75.786.086.086.059.888.990.090.090.289.975.1 in % of projected rental income
6.146.106.066.036.096.116.066.015.965.925.89Gross yield %
4.655.255.225.193.645.435.455.415.375.324.42Net yield %
14.0
2.5
1,100,000
86.3
6.36
7.04
% Building insurance value
per m³ SIA 116
Exit
Exit
Repair costsTotal Period 1-10
Various Indicators
per m²
per m³ GVA
per m³ SIA 416
Internal Rate of Return
per Apartment
Development: Value, Revenue, Costs & YieldsMarket matrix and Quality profile
2.12.3
Market CoefficientProperty quality
2.0Locational quality
5.0
Condition Micro location
Standard Usability
Macro-location
Quality profile property
4.0
3.0
2.0
1.0
1=very good; ... 5=very poor
%
- 1Q 2013 Page 3 of 15Lerzenstrasse 10 , 8953 Dietikon Valuation no. 7141.61Created on 24.04.2013

Wüest & Partner 3 Contents
1 Summary
2 Summary II
3 Contents
4 Income summary
Tenant summary5
6 Rent roll
7 Projected account summary
8 Results
9 Quality profile (extended)
10 Context
- 1Q 2013 Page 4 of 15Lerzenstrasse 10 , 8953 Dietikon Valuation no. 7141.61Created on 24.04.2013
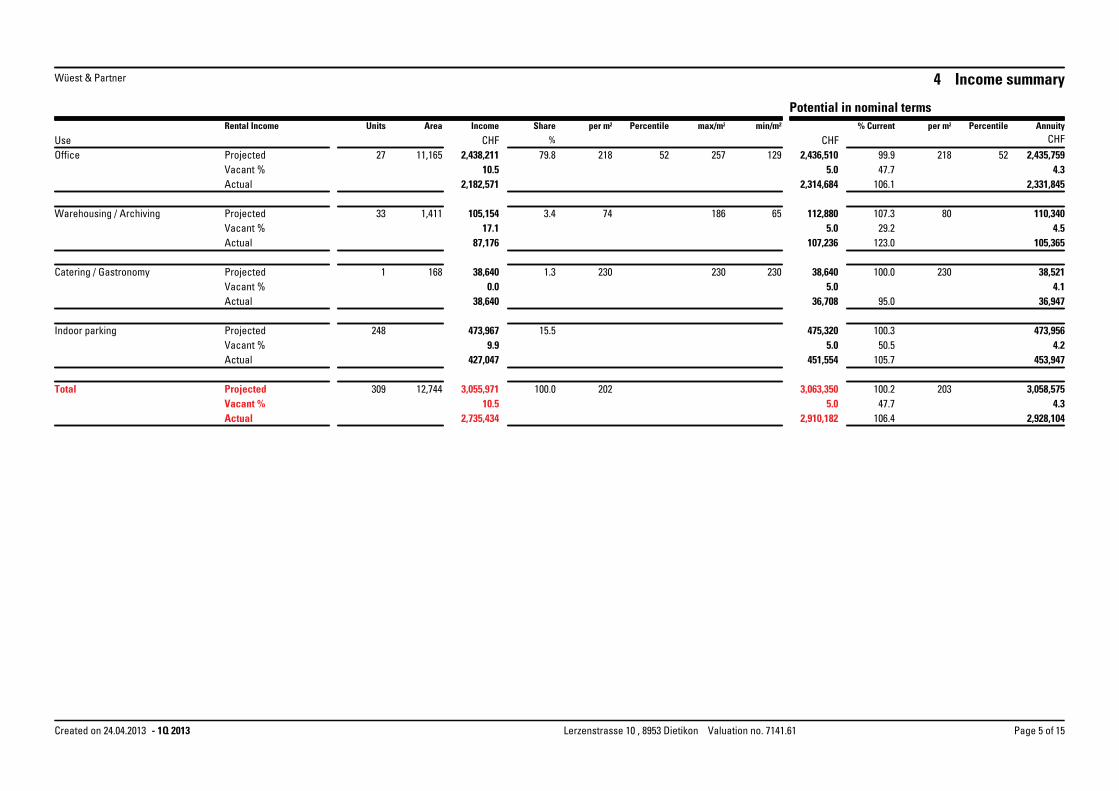
CHFCHF
Wüest & Partner
Rental Income%
AnnuityPercentileper m²% Currentmin/m²max/m²Percentileper m²ShareIncomeAreaUnits
CHFUse
Potential in nominal terms
4 Income summary
79.82,438,211 52218
106.1
99.947.7
522185.0
2,314,684
2,436,510
2,331,8454.3
2,435,75912925710.5
2,182,571
11,16527Office
Actual
ProjectedVacant %
3.4105,154 74
123.0
107.329.2
805.0
107,236
112,880
105,3654.5
110,3406518617.1
87,176
1,41133Warehousing / Archiving
Actual
ProjectedVacant %
1.338,640 230
95.0
100.0 2305.0
36,708
38,640
36,9474.1
38,5212302300.0
38,640
1681Catering / Gastronomy
Actual
ProjectedVacant %
15.5473,967
105.7
100.350.55.0
451,554
475,320
453,9474.2
473,9569.9
427,047
248Indoor parking
Actual
ProjectedVacant %
2035.0
3,063,350202
106.447.7
100.2
2,928,1044.3
3,058,575100.010.5
2,910,182
3,055,971
2,735,434
309 12,744Vacant %Actual
ProjectedTotal
- 1Q 2013 Page 5 of 15Lerzenstrasse 10 , 8953 Dietikon Valuation no. 7141.61Created on 24.04.2013
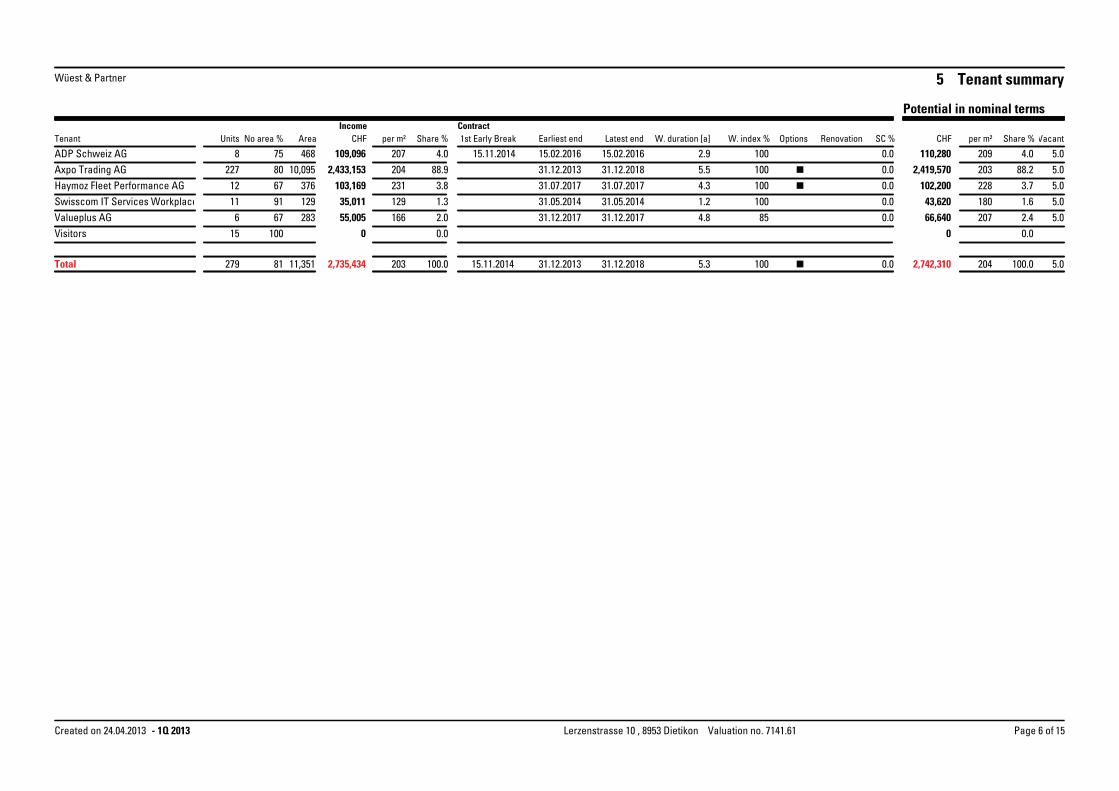
CHF CHF
Potential in nominal terms
VacantShare %per m²SC %RenovationOptionsW. index %W. duration [a]Latest endEarliest end1st Early BreakShare %per m²AreaNo area %Units
Wüest & Partner
ContractIncomeTenant
5 Tenant summary
5.04.0209110,2800.01002.915.02.201615.02.201615.11.20144.0207109,096468758ADP Schweiz AG5.088.22032,419,5700.01005.531.12.201831.12.201388.92042,433,15310,09580227Axpo Trading AG5.03.7228102,2000.01004.331.07.201731.07.20173.8231103,1693766712Haymoz Fleet Performance AG5.01.618043,6200.01001.231.05.201431.05.20141.312935,0111299111Swisscom IT Services Workplace5.02.420766,6400.0854.831.12.201731.12.20172.016655,005283676Valueplus AG
0.000.0010015Visitors
5.0Total 100.02042,742,3100.01005.331.12.201831.12.201315.11.2014100.02032,735,43411,35181279
- 1Q 2013 Page 6 of 15Lerzenstrasse 10 , 8953 Dietikon Valuation no. 7141.61Created on 24.04.2013
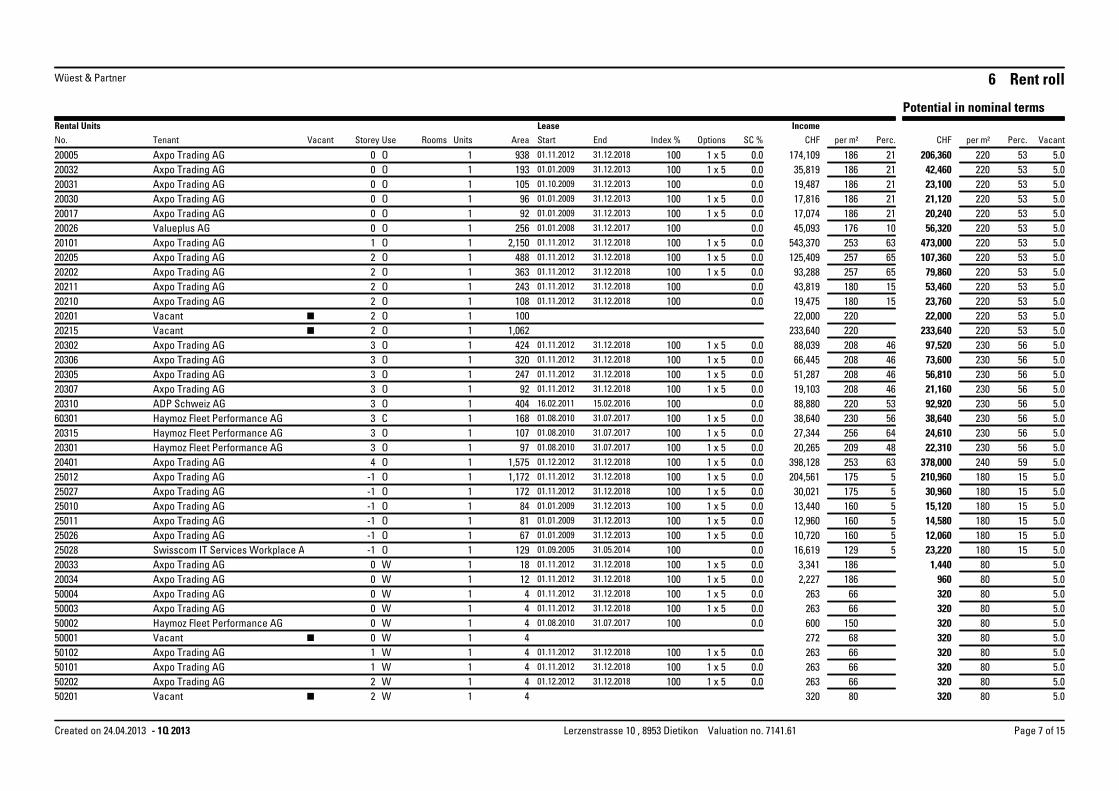
Wüest & Partner
LeaseSC %Area Perc. Vacantper m²Perc.per m²OptionsIndex %EndStartUnitsRoomsVacant
IncomeRental UnitsCHFCHFUseStoreyTenantNo.
Potential in nominal terms
6 Rent roll
20005 1 x 5 53220 5.0206,360211860.010031.12.201801.11.20129381 174,109O0Axpo Trading AG20032 1 x 5 53220 5.042,460211860.010031.12.201301.01.20091931 35,819O0Axpo Trading AG20031 53220 5.023,100211860.010031.12.201301.10.20091051 19,487O0Axpo Trading AG20030 1 x 5 53220 5.021,120211860.010031.12.201301.01.2009961 17,816O0Axpo Trading AG20017 1 x 5 53220 5.020,240211860.010031.12.201301.01.2009921 17,074O0Axpo Trading AG20026 53220 5.056,320101760.010031.12.201701.01.20082561 45,093O0Valueplus AG20101 1 x 5 53220 5.0473,000632530.010031.12.201801.11.20122,1501 543,370O1Axpo Trading AG20205 1 x 5 53220 5.0107,360652570.010031.12.201801.11.20124881 125,409O2Axpo Trading AG20202 1 x 5 53220 5.079,860652570.010031.12.201801.11.20123631 93,288O2Axpo Trading AG20211 53220 5.053,460151800.010031.12.201801.11.20122431 43,819O2Axpo Trading AG20210 53220 5.023,760151800.010031.12.201801.11.20121081 19,475O2Axpo Trading AG20201 53220 5.022,0002201001 22,000O2Vacant20215 53220 5.0233,6402201,0621 233,640O2Vacant20302 1 x 5 56230 5.097,520462080.010031.12.201801.11.20124241 88,039O3Axpo Trading AG20306 1 x 5 56230 5.073,600462080.010031.12.201801.11.20123201 66,445O3Axpo Trading AG20305 1 x 5 56230 5.056,810462080.010031.12.201801.11.20122471 51,287O3Axpo Trading AG20307 1 x 5 56230 5.021,160462080.010031.12.201801.11.2012921 19,103O3Axpo Trading AG20310 56230 5.092,920532200.010015.02.201616.02.20114041 88,880O3ADP Schweiz AG60301 1 x 5 56230 5.038,640562300.010031.07.201701.08.20101681 38,640C3Haymoz Fleet Performance AG20315 1 x 5 56230 5.024,610642560.010031.07.201701.08.20101071 27,344O3Haymoz Fleet Performance AG20301 1 x 5 56230 5.022,310482090.010031.07.201701.08.2010971 20,265O3Haymoz Fleet Performance AG20401 1 x 5 59240 5.0378,000632530.010031.12.201801.12.20121,5751 398,128O4Axpo Trading AG25012 1 x 5 15180 5.0210,96051750.010031.12.201801.11.20121,1721 204,561O-1Axpo Trading AG25027 1 x 5 15180 5.030,96051750.010031.12.201801.11.20121721 30,021O-1Axpo Trading AG25010 1 x 5 15180 5.015,12051600.010031.12.201301.01.2009841 13,440O-1Axpo Trading AG25011 1 x 5 15180 5.014,58051600.010031.12.201301.01.2009811 12,960O-1Axpo Trading AG25026 1 x 5 15180 5.012,06051600.010031.12.201301.01.2009671 10,720O-1Axpo Trading AG25028 15180 5.023,22051290.010031.05.201401.09.20051291 16,619O-1Swisscom IT Services Workplace A20033 1 x 5 80 5.01,4401860.010031.12.201801.11.2012181 3,341W0Axpo Trading AG20034 1 x 5 80 5.09601860.010031.12.201801.11.2012121 2,227W0Axpo Trading AG50004 1 x 5 80 5.0320660.010031.12.201801.11.201241 263W0Axpo Trading AG50003 1 x 5 80 5.0320660.010031.12.201801.11.201241 263W0Axpo Trading AG50002 80 5.03201500.010031.07.201701.08.201041 600W0Haymoz Fleet Performance AG50001 80 5.03206841 272W0Vacant50102 1 x 5 80 5.0320660.010031.12.201801.11.201241 263W1Axpo Trading AG50101 1 x 5 80 5.0320660.010031.12.201801.11.201241 263W1Axpo Trading AG50202 1 x 5 80 5.0320660.010031.12.201801.12.201241 263W2Axpo Trading AG50201 80 5.03208041 320W2Vacant
- 1Q 2013 Page 7 of 15Lerzenstrasse 10 , 8953 Dietikon Valuation no. 7141.61Created on 24.04.2013
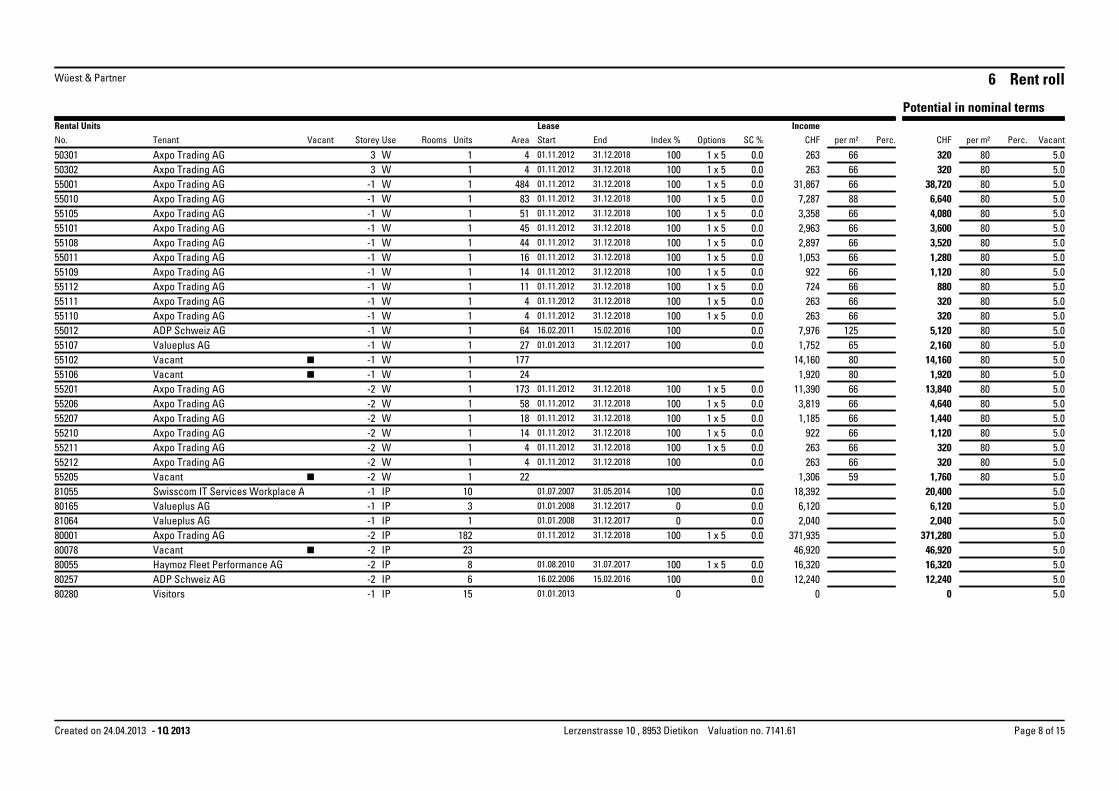
Wüest & Partner
LeaseSC %Area Perc. Vacantper m²Perc.per m²OptionsIndex %EndStartUnitsRoomsVacant
IncomeRental UnitsCHFCHFUseStoreyTenantNo.
Potential in nominal terms
6 Rent roll
50301 1 x 5 80 5.0320660.010031.12.201801.11.201241 263W3Axpo Trading AG50302 1 x 5 80 5.0320660.010031.12.201801.11.201241 263W3Axpo Trading AG55001 1 x 5 80 5.038,720660.010031.12.201801.11.20124841 31,867W-1Axpo Trading AG55010 1 x 5 80 5.06,640880.010031.12.201801.11.2012831 7,287W-1Axpo Trading AG55105 1 x 5 80 5.04,080660.010031.12.201801.11.2012511 3,358W-1Axpo Trading AG55101 1 x 5 80 5.03,600660.010031.12.201801.11.2012451 2,963W-1Axpo Trading AG55108 1 x 5 80 5.03,520660.010031.12.201801.11.2012441 2,897W-1Axpo Trading AG55011 1 x 5 80 5.01,280660.010031.12.201801.11.2012161 1,053W-1Axpo Trading AG55109 1 x 5 80 5.01,120660.010031.12.201801.11.2012141 922W-1Axpo Trading AG55112 1 x 5 80 5.0880660.010031.12.201801.11.2012111 724W-1Axpo Trading AG55111 1 x 5 80 5.0320660.010031.12.201801.11.201241 263W-1Axpo Trading AG55110 1 x 5 80 5.0320660.010031.12.201801.11.201241 263W-1Axpo Trading AG55012 80 5.05,1201250.010015.02.201616.02.2011641 7,976W-1ADP Schweiz AG55107 80 5.02,160650.010031.12.201701.01.2013271 1,752W-1Valueplus AG55102 80 5.014,160801771 14,160W-1Vacant55106 80 5.01,92080241 1,920W-1Vacant55201 1 x 5 80 5.013,840660.010031.12.201801.11.20121731 11,390W-2Axpo Trading AG55206 1 x 5 80 5.04,640660.010031.12.201801.11.2012581 3,819W-2Axpo Trading AG55207 1 x 5 80 5.01,440660.010031.12.201801.11.2012181 1,185W-2Axpo Trading AG55210 1 x 5 80 5.01,120660.010031.12.201801.11.2012141 922W-2Axpo Trading AG55211 1 x 5 80 5.0320660.010031.12.201801.11.201241 263W-2Axpo Trading AG55212 80 5.0320660.010031.12.201801.11.201241 263W-2Axpo Trading AG55205 80 5.01,76059221 1,306W-2Vacant81055 5.020,4000.010031.05.201401.07.200710 18,392IP-1Swisscom IT Services Workplace A80165 5.06,1200.0031.12.201701.01.20083 6,120IP-1Valueplus AG81064 5.02,0400.0031.12.201701.01.20081 2,040IP-1Valueplus AG80001 1 x 5 5.0371,2800.010031.12.201801.11.2012182 371,935IP-2Axpo Trading AG80078 5.046,92023 46,920IP-2Vacant80055 1 x 5 5.016,3200.010031.07.201701.08.20108 16,320IP-2Haymoz Fleet Performance AG80257 5.012,2400.010015.02.201616.02.20066 12,240IP-2ADP Schweiz AG80280 5.00001.01.201315 0IP-1Visitors
- 1Q 2013 Page 8 of 15Lerzenstrasse 10 , 8953 Dietikon Valuation no. 7141.61Created on 24.04.2013
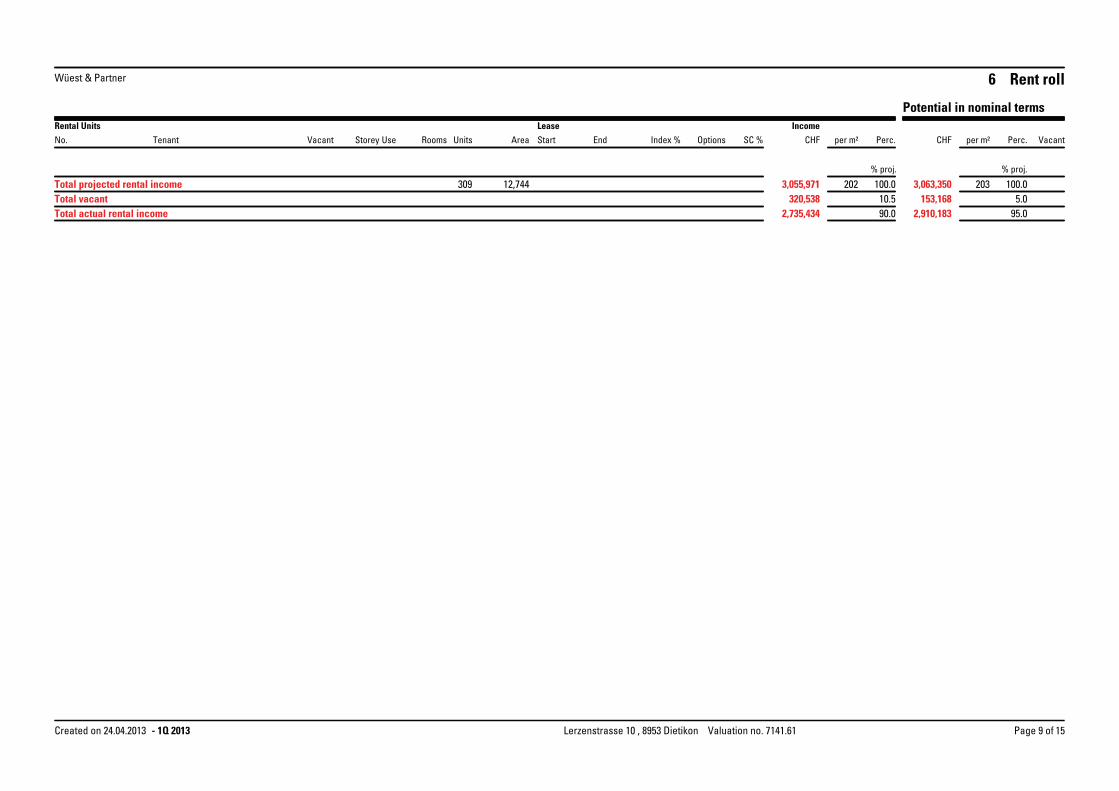
Wüest & Partner
LeaseSC %Area Perc. Vacantper m²Perc.per m²OptionsIndex %EndStartUnitsRoomsVacant
IncomeRental UnitsCHFCHFUseStoreyTenantNo.
Potential in nominal terms
6 Rent roll
153,168 5.0
% proj.% proj.
202 100.0 203 100.0
95.010.5320,53890.02,735,434 2,910,183
12,744 3,055,971309
Total actual rental incomeTotal vacant
3,063,350Total projected rental income
- 1Q 2013 Page 9 of 15Lerzenstrasse 10 , 8953 Dietikon Valuation no. 7141.61Created on 24.04.2013
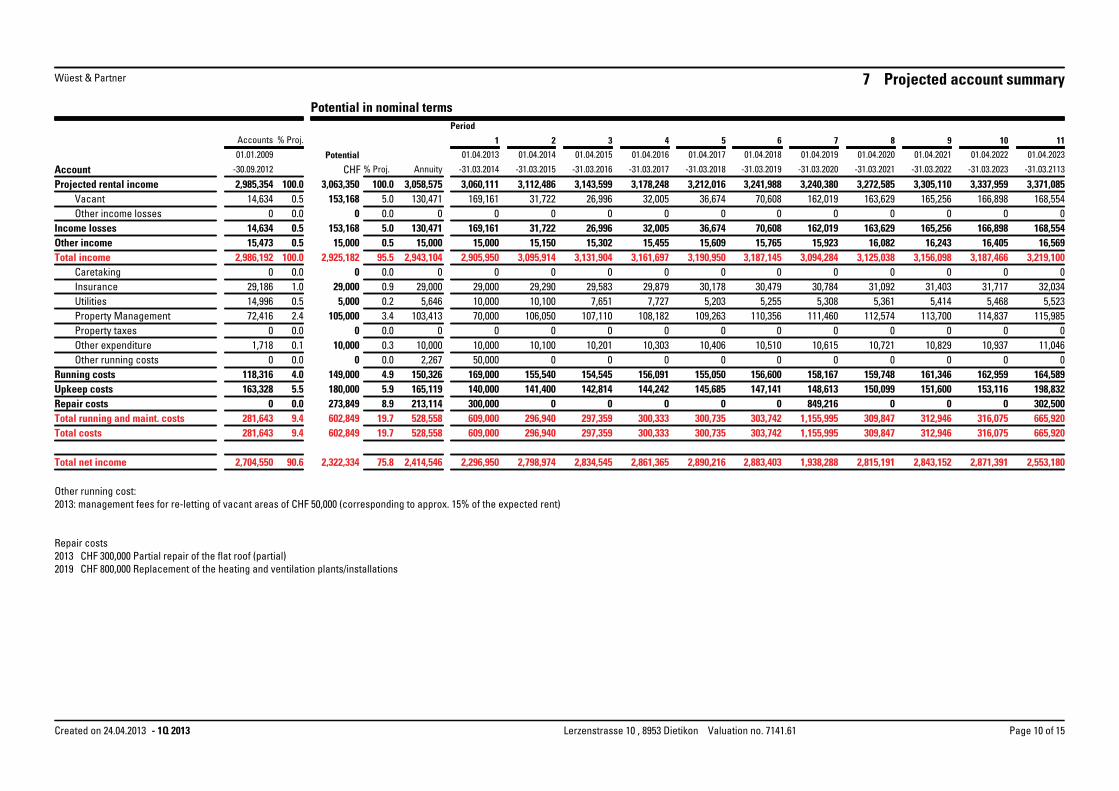
CHF -31.03.2113
1101.04.2023
-31.03.2023
1001.04.2022
-31.03.2022
901.04.2021
-31.03.2021
801.04.2020
-31.03.2020
701.04.2019
-31.03.2019
601.04.2018Potential
Annuity
Accounts % Proj.
Account % Proj.
01.01.2009
-31.03.2017-31.03.2016-31.03.2015-31.03.2014-30.09.2012
01.04.201601.04.201501.04.201401.04.20131 2 3 4
-31.03.2018
01.04.20175
Period
Potential in nominal terms
7 Projected account summaryWüest & Partner
3,371,0853,337,9593,305,1103,272,5853,240,3803,241,9883,060,111 3,112,486 3,143,599 3,178,248 3,212,016100.0 3,058,5753,063,3502,985,354 100.0Projected rental income168,554166,898165,256163,629162,01970,608169,161 31,722 26,996 32,005 36,6745.0 130,471153,16814,634 0.5Vacant
0000000 0 0 0 00.0 000 0.0Other income losses168,554166,898165,256163,629162,01970,608169,161 31,722 26,996 32,005 36,6745.0 130,471153,16814,634 0.5Income losses
16,56916,40516,24316,08215,92315,76515,000 15,150 15,302 15,455 15,6090.5 15,00015,00015,473 0.5Other income3,219,1003,187,4663,156,0983,125,0383,094,2843,187,1452,905,950 3,095,914 3,131,904 3,161,697 3,190,95095.5 2,943,1042,925,1822,986,192 100.0Total income
0000000 0 0 0 00.0 000 0.0Caretaking32,03431,71731,40331,09230,78430,47929,000 29,290 29,583 29,879 30,1780.9 29,00029,00029,186 1.0Insurance
5,5235,4685,4145,3615,3085,25510,000 10,100 7,651 7,727 5,2030.2 5,6465,00014,996 0.5Utilities115,985114,837113,700112,574111,460110,35670,000 106,050 107,110 108,182 109,2633.4 103,413105,00072,416 2.4Property Management
0000000 0 0 0 00.0 000 0.0Property taxes11,04610,93710,82910,72110,61510,51010,000 10,100 10,201 10,303 10,4060.3 10,00010,0001,718 0.1Other expenditure
00000050,000 0 0 0 00.0 2,26700 0.0Other running costs164,589162,959161,346159,748158,167156,600169,000 155,540 154,545 156,091 155,0504.9 150,326149,000118,316 4.0Running costs198,832153,116151,600150,099148,613147,141140,000 141,400 142,814 144,242 145,6855.9 165,119180,000163,328 5.5Upkeep costs302,500000849,2160300,000 0 0 0 08.9 213,114273,8490 0.0Repair costs665,920316,075312,946309,8471,155,995303,742609,000 296,940 297,359 300,333 300,73519.7 528,558602,849281,643 9.4Total running and maint. costs665,920316,075312,946309,8471,155,995303,742609,000 296,940 297,359 300,333 300,73519.7 528,558602,849281,643 9.4Total costs
2,553,1802,871,3912,843,1522,815,1911,938,2882,883,4032,296,950 2,798,974 2,834,545 2,861,365 2,890,21675.8 2,414,5462,322,3342,704,550 90.6Total net income
Other running cost:2013: management fees for re-letting of vacant areas of CHF 50,000 (corresponding to approx. 15% of the expected rent)
Repair costs2013 CHF 300,000 Partial repair of the flat roof (partial)2019 CHF 800,000 Replacement of the heating and ventilation plants/installations
- 1Q 2013 Page 10 of 15Lerzenstrasse 10 , 8953 Dietikon Valuation no. 7141.61Created on 24.04.2013
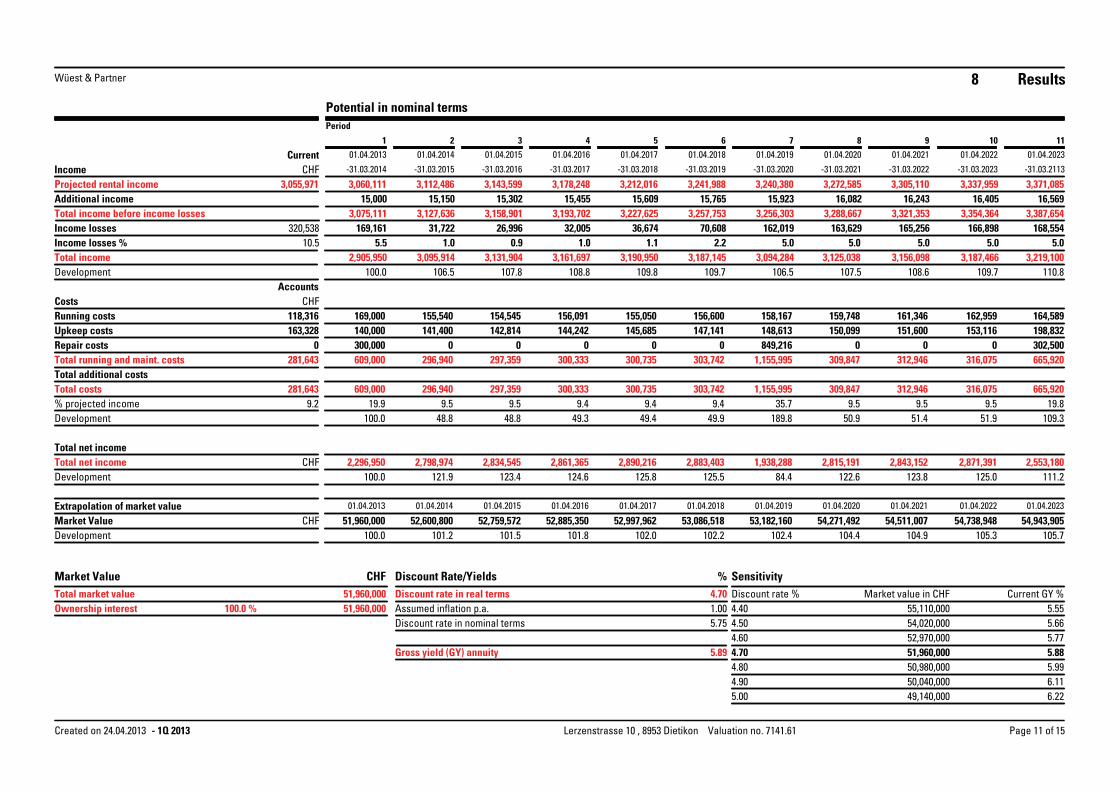
Market value in CHF
CHF
CHF
CHF
CHF
CHF
320,53810.5
16,5693,387,654
168,5545.0
3,219,100
16,4053,354,364
166,8985.0
3,187,466
16,2433,321,353
165,2565.0
3,156,098
16,0823,288,667
163,6295.0
3,125,038
15,9233,256,303
162,0195.0
3,094,284
15,7653,257,753
70,6082.2
3,187,145
15,6093,227,625
36,6741.1
3,190,950
15,4553,193,702
32,0051.0
3,161,697
15,3023,158,901
26,9960.9
3,131,904
15,1503,127,636
31,7221.0
3,095,914
15,0003,075,111
169,1615.5
2,905,950Total income Income losses %Income losses
CurrentIncome
Results
01.04.2013 01.04.2014 01.04.2015 01.04.2016 01.04.2017 01.04.2018 01.04.2019 01.04.2020 01.04.2021 01.04.2022 01.04.2023
100.0 101.2 101.5 101.8 102.0 102.2 102.4 104.4 104.9 105.3 105.751,960,000 52,600,800 52,759,572 52,885,350 52,997,962 53,086,518 53,182,160 54,271,492 54,511,007 54,738,948 54,943,905
100.0 121.9 123.4 124.6 125.8 125.5 84.4 122.6 123.8 125.0 111.22,296,950 2,798,974 2,834,545 2,861,365 2,883,403 1,938,288 2,815,191 2,843,152 2,871,391 2,553,180
100.0 48.8 48.8 49.3 49.4 49.9 189.8 50.9 51.4 51.9 109.319.9 9.5 9.5 9.4 9.4 9.4 35.7 9.5 9.5 9.5 19.8
609,000 296,940 297,359 300,333 300,735 303,742 1,155,995 309,847 312,946 316,075 665,920
665,920609,000 296,940 297,359 300,333 300,735 303,742 1,155,995 309,847 312,946 316,075300,000 0 0 0 0 0 849,216 0 0 0 302,500140,000 141,400 142,814 144,242 145,685 147,141 148,613 150,099 151,600 153,116 198,832169,000 155,540 154,545 156,091 155,050 156,600 158,167 159,748 161,346 162,959 164,589
100.0 106.5 107.8 108.8 109.8 109.7 106.5 107.5 108.6 109.7 110.8
3,060,111 3,112,486 3,143,599 3,178,248 3,212,016 3,241,988 3,240,380 3,272,585 3,305,110 3,337,959 3,371,085
5.00 49,140,000 6.22
51,960,000
4.90 50,040,000 6.11
4.50 5.66
4.80 50,980,000 5.994.70
52,970,0005.88
4.6054,020,000
5.77
55,110,0004.40 5.55Current GY %
Discount Rate/Yields %4.70
5.75
5.89
1.00Discount rate in real terms
Gross yield (GY) annuity
Discount rate in nominal terms51,960,00051,960,000
100.0 %
SensitivityDiscount rate %
Assumed inflation p.a.Ownership interestTotal market value
Market Value
DevelopmentMarket ValueExtrapolation of market value
Development
Total net incomeTotal net income
% projected incomeDevelopment
Total additional costs
2,890,216
Repair costsUpkeep costs
Total running and maint. costs
Running costs
Total costs
Accounts
118,316
281,643
163,3280
9.2
3,055,971
281,643
Costs
Development
Total income before income lossesAdditional incomeProjected rental income
-31.03.2015
01.04.2014
-31.03.2016
01.04.2015
-31.03.2017
01.04.2016
-31.03.2018
01.04.2017
-31.03.2019
01.04.2018
-31.03.2020
01.04.2019
-31.03.2021
01.04.2020
-31.03.2022
01.04.2021
-31.03.2023
01.04.2022
-31.03.2113
01.04.2023
-31.03.2014
01.04.20131110987654321
Period
Potential in nominal terms
8Wüest & Partner
- 1Q 2013 Page 11 of 15Lerzenstrasse 10 , 8953 Dietikon Valuation no. 7141.61Created on 24.04.2013
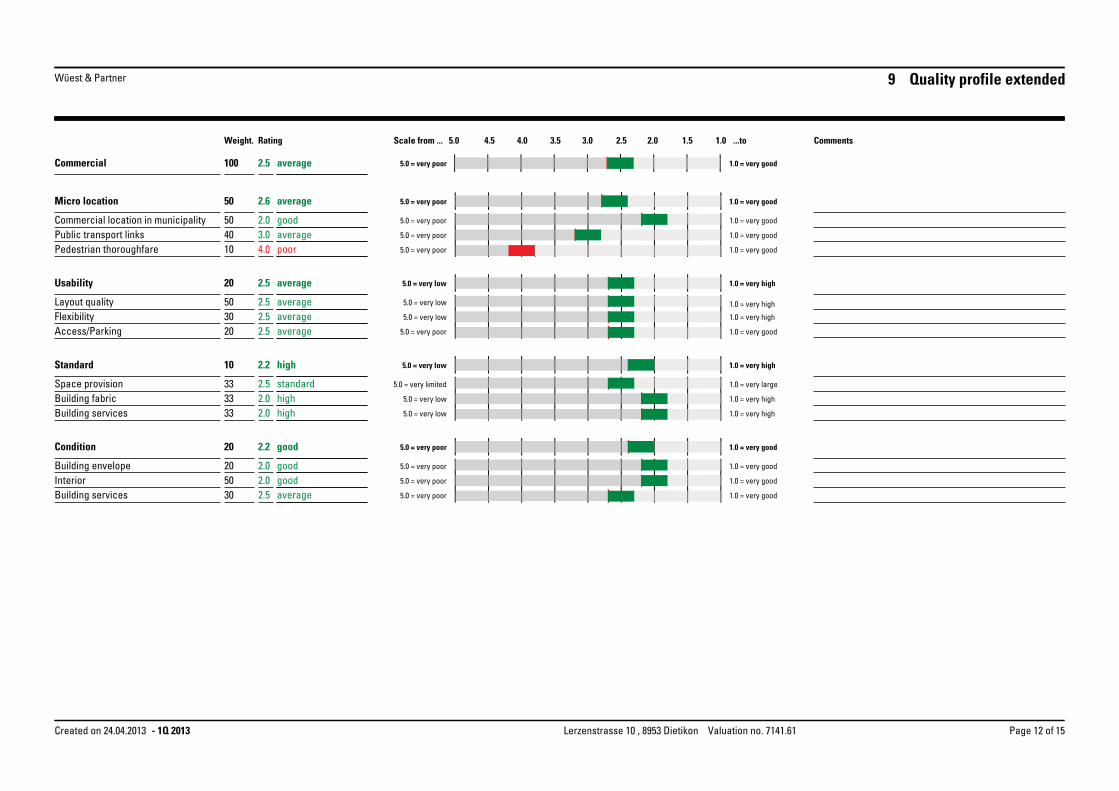
9 Quality profile extended
5.0Scale from ...Weight.
Wüest & Partner
4.5 4.0 3.5 3.0 2.5 2.0 1.5 1.0 ...to CommentsRating
2.5100Commercial average 5.0 = very poor 1.0 = very good
1.0 = very good5.0 = very pooraverageMicro location 50 2.6
1.0 = very good
4.03.02.0
104050Commercial location in municipality
Public transport linksPedestrian thoroughfare
goodaveragepoor
5.0 = very poor
5.0 = very poor
5.0 = very poor
1.0 = very good
1.0 = very good
2.5 averageUsability 20 5.0 = very low 1.0 = very high
1.0 = very high2.52.52.5
503020 average
averageaverageLayout quality
Access/ParkingFlexibility
5.0 = very low
5.0 = very low 1.0 = very high
5.0 = very poor 1.0 = very good
1.0 = very high2.2 highStandard 10 5.0 = very low
2.02.0
2.5333333
Space provisionBuilding fabricBuilding services high
highstandard 5.0 = very limited 1.0 = very large
5.0 = very low
5.0 = very low
1.0 = very high
1.0 = very high
2.220Condition good 5.0 = very poor 1.0 = very good
2.02.02.530
5020Building envelope
InteriorBuilding services average
goodgood 5.0 = very poor
5.0 = very poor
5.0 = very poor
1.0 = very good
1.0 = very good
1.0 = very good
- 1Q 2013 Page 12 of 15Lerzenstrasse 10 , 8953 Dietikon Valuation no. 7141.61Created on 24.04.2013
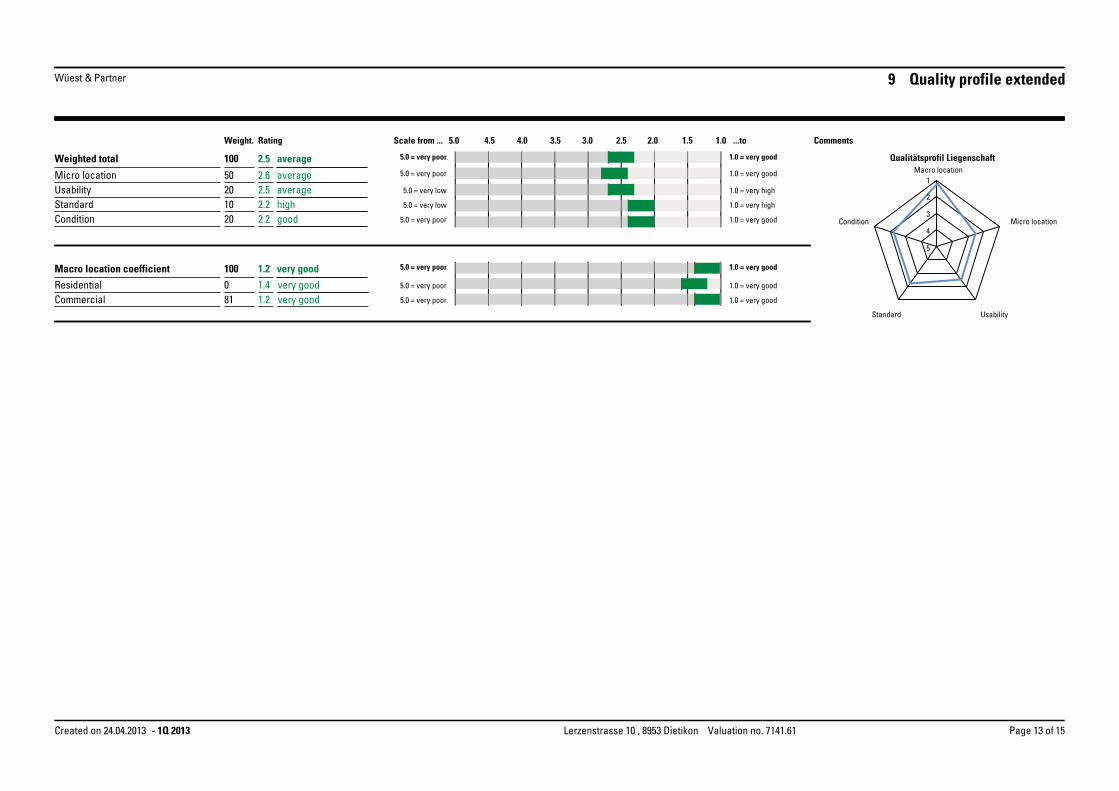
9 Quality profile extended
5.0Scale from ...Weight.
Wüest & Partner
4.5 4.0 3.5 3.0 2.5 2.0 1.5 1.0 ...to CommentsRating
Macro locationQualitätsprofil Liegenschaft
Condition
Standard
Micro location
Usability
1
3
5
4
2
very goodvery good
very good 1.0 = very good
1.0 = very good
1.0 = very good
5.0 = very poor
5.0 = very poor
5.0 = very poor
1.2811.40
CommercialResidential
1.2100Macro location coefficient
1.0 = very good
1.0 = very good
1.0 = very high
5.0 = very low
5.0 = very low
5.0 = very poor
5.0 = very pooraverage
2.2
2.52.6
2.5
2.220102050
100
Micro locationUsabilityStandardCondition
Weighted total
averageaveragehighgood 5.0 = very poor
1.0 = very high
1.0 = very good
- 1Q 2013 Page 13 of 15Lerzenstrasse 10 , 8953 Dietikon Valuation no. 7141.61Created on 24.04.2013
Wüest & Partner 10 Context
MethodCommission
The valuation uses the discounted cash-flow (DCF) method. With this method, the current market value of a property is determined as the total of all projected future net income from ongoing operations discounted to present-day equivalents. No allowance is made for any possible transaction cost (such as taxes, charges or fees). Further valuation does not account for any taxation (except of mandatory property taxes) or interest cost.
The net income of operations is discounted individually for each property with due allowance for specific opportunities and threats, and with adjustment in line with prevailing market conditions and risks. All projected cash flows are presented to ensure maximum transparency.
Wüest & Partner applies a so-called one-period DCF model. The valuation period extends for 100 years , from the valuation date. Due to formal constraints the report displays a time-weighted residual value for the period 11 through 100 of the valuation.
Wüest & Partner was commissioned by HABAS Swiss Investment to value the property in question as per the stipulated day of valuation for accounting reasons.
The valuations comply with national and international standards. These standards also accord with the reporting guidelines commonly used in Switzerland. The valuation focuses on the calculation of the market value. In the absence of any official definitions of market value in Switzerland, the concept used in standard European valuation textbooks is adopted. Property values are thus determined in accordance with the guidelines of the RICS (Royal Institution of Chartered Surveyors) and TEGOVA (The European Group of Valuers' Associations).
In accordance to these regulations the market value is defined as «the estimated amount for which a property ���������� ���� ������������������� ���� �������� �������� ��������� �������� �� �������� ����transaction after proper marketing, wherein the parties have each acted knowledgeably, prudently, and without compulsion.»
Value and price may diverge. No allowance can be made in this valuation for any circumstances affecting the price.
- 1Q 2013 Page 14 of 15Lerzenstrasse 10 , 8953 Dietikon Valuation no. 7141.61Created on 24.04.2013
Wüest & Partner 10 Context
������������ ���������� ���� ���� ���������������������������� ������� ���������������������!�Partner to the best of its knowledge and with due observance of current professional standards. The valuation was performed with reference to the specified valuation date and may be affected by subsequent events for which no allowance can be made at the present time. A revaluation shall become necessary should any such events occur.
����������� ���������� ������������������ ����� ����������������� ���������������� ���� ��������� ����documentation summary. A site visit has been held in the course of the first recognition of the property.
Nothing in the Report should be construed as advice to proceed or not to proceed with a transaction and/or any investment or provision of finance or the consideration of terms on which to so proceed. The scope of this Report is not nor does it purport to be a confirmation or complete review of all matters of a legal, technical or real estate relevant nature which may be of interest or concern to a potential purchaser and financing parties considering or evaluating whether to proceed with a transaction or the consideration or terms on which to so proceed.
In consideration of our agreement to make a copy of the Report available to you, you agree to treat the contents of the Report as confidential and not to distribute copies of the Report, or otherwise disseminate the contents of the Report, to any person without our prior written consent, with the exception of (a) disclosure on a confidential basis to such of your professional advisers, directors, officers, servants, employees and/or agents and members of the group of companies controlled by you who need to consider the matters set out in the Report (b) disclosure required by law in any jurisdiction, or (c) disclosure for regulatory purposes.
We hereby confirm to have performed the valuation independently and neutrally in conformity with its business policies. It is addressed to HABAS Swiss Investment and was carried out solely for those purposes specified above. No conflicts of interest of any kind exist. The valuation was; Wüest & Partner shall accept no liability in respect of third parties other than that mentioned above.
The valuation is based on the current letting situation as disclosed in the relevant rent-roll prepared by the charged management. The projected rental income reflects the relevant terms and conditions of ongoing rental contracts as well as the general regulations of the rental law and the generally applied business principles. The estimation of the rental values is determined individually for all separate letting units on the basis of the prevailing local and regional market conditions.
The projection of the running and maintenance cost is determined on the basis of the property accounts of previous operations and validated with benchmarks and comparable information of our extensive databases.
����������������� ����������������� ����������� ��� ���������������������������������� �������lifecycle analysis of the individual building elements. The building structure's remaining lifespan was estimated and periodic refurbishments modelled on the basis of the general condition of the fabric as determined during the property inspection. Appropriate annual reserves were calculated accordingly and plausibility tested using comparables and Wüest & Partner's own benchmarks. The calculation factors in 100% of repair costs in the first 10 years; the proportion applied from year 11 onwards is limited to the value-preserving investments.
The relevant discount is based on a risk-adjusted interest rate. Rates are determined individually for each property on the basis of appropriate benchmarks derived from comparable transactions. Credit risks posed by specific tenants are , if not otherwise stated, not explicitly factored into the valuation
Inflation is respected with an annual rate of 1.0%. Specific adjusment clauses in the rental contracts are reflected individually.
Disclaimer Valuation Assumptions
- 1Q 2013 Page 15 of 15Lerzenstrasse 10 , 8953 Dietikon Valuation no. 7141.61Created on 24.04.2013

Habas Star B.V.
Unaudited Condensed Consolidated Interim Financial Statements
as of 31 March 2013
Habas Star B.V. Unaudited Condensed Consolidated Interim Financial Statements as of 31 March 2013 Table of Contents
Page Unaudited condensed consolidated interim balance sheet 2 Unaudited condensed consolidated interim statement of comprehensive income 3 Unaudited condensed interim statement of changes in equity 4 Unaudited condensed consolidated interim statement of cash flow 6 Notes to the unaudited condensed consolidated interim financial statements 7 Independent report on review of unaudited condensed consolidated interim financial information 11
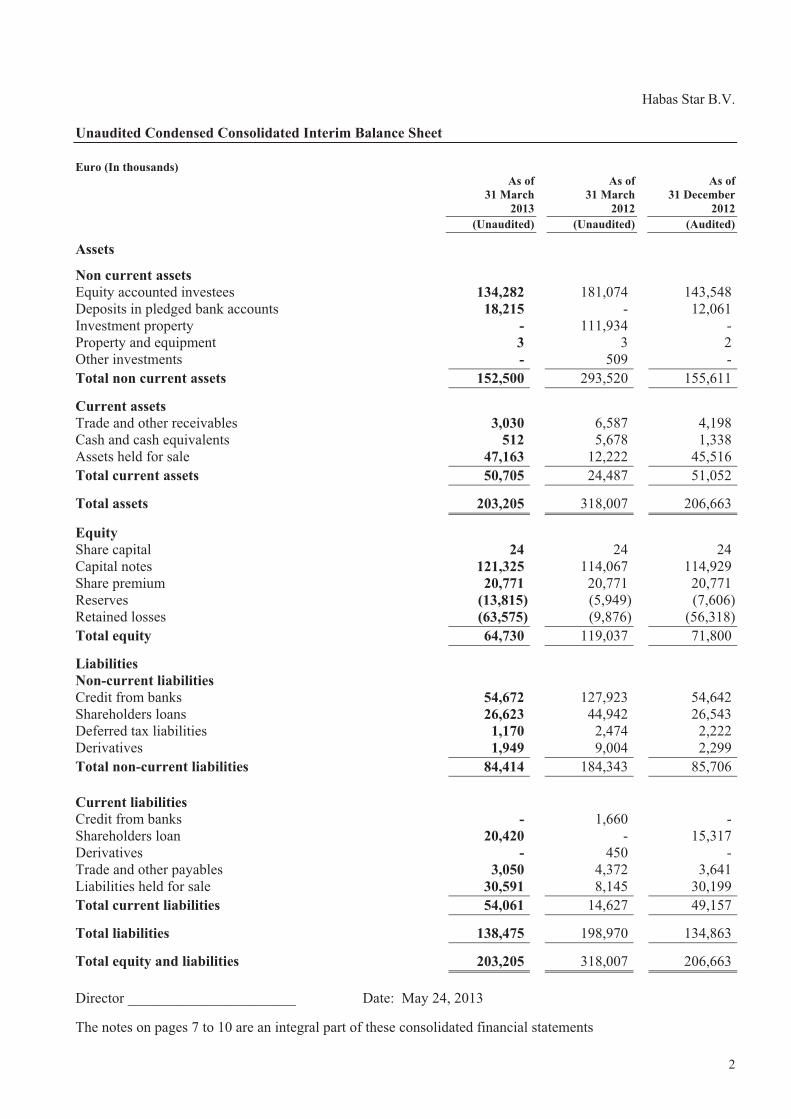
2
Habas Star B.V. Unaudited Condensed Consolidated Interim Balance Sheet Euro (In thousands) As of As of As of 31 March 31 March 31 December 2013 2012 2012 (Unaudited) (Unaudited) (Audited)
Assets
Non current assets Equity accounted investees 134,282 181,074 143,548 Deposits in pledged bank accounts 18,215 - 12,061 Investment property - 111,934 - Property and equipment 3 3 2 Other investments - 509 - Total non current assets 152,500 293,520 155,611
Current assets Trade and other receivables 3,030 6,587 4,198 Cash and cash equivalents 512 5,678 1,338 Assets held for sale 47,163 12,222 45,516 Total current assets 50,705 24,487 51,052
Total assets 203,205 318,007 206,663
Equity Share capital 24 24 24 Capital notes 121,325 114,067 114,929 Share premium 20,771 20,771 20,771 Reserves (13,815) (5,949) (7,606) Retained losses (63,575) (9,876) (56,318) Total equity 64,730 119,037 71,800
Liabilities Non-current liabilities Credit from banks 54,672 127,923 54,642 Shareholders loans 26,623 44,942 26,543 Deferred tax liabilities 1,170 2,474 2,222 Derivatives 1,949 9,004 2,299 Total non-current liabilities 84,414 184,343 85,706 Current liabilities Credit from banks - 1,660 - Shareholders loan 20,420 - 15,317 Derivatives - 450 - Trade and other payables 3,050 4,372 3,641 Liabilities held for sale 30,591 8,145 30,199 Total current liabilities 54,061 14,627 49,157
Total liabilities 138,475 198,970 134,863
Total equity and liabilities 203,205 318,007 206,663 Director _______________________ Date: May 24, 2013 The notes on pages 7 to 10 are an integral part of these consolidated financial statements
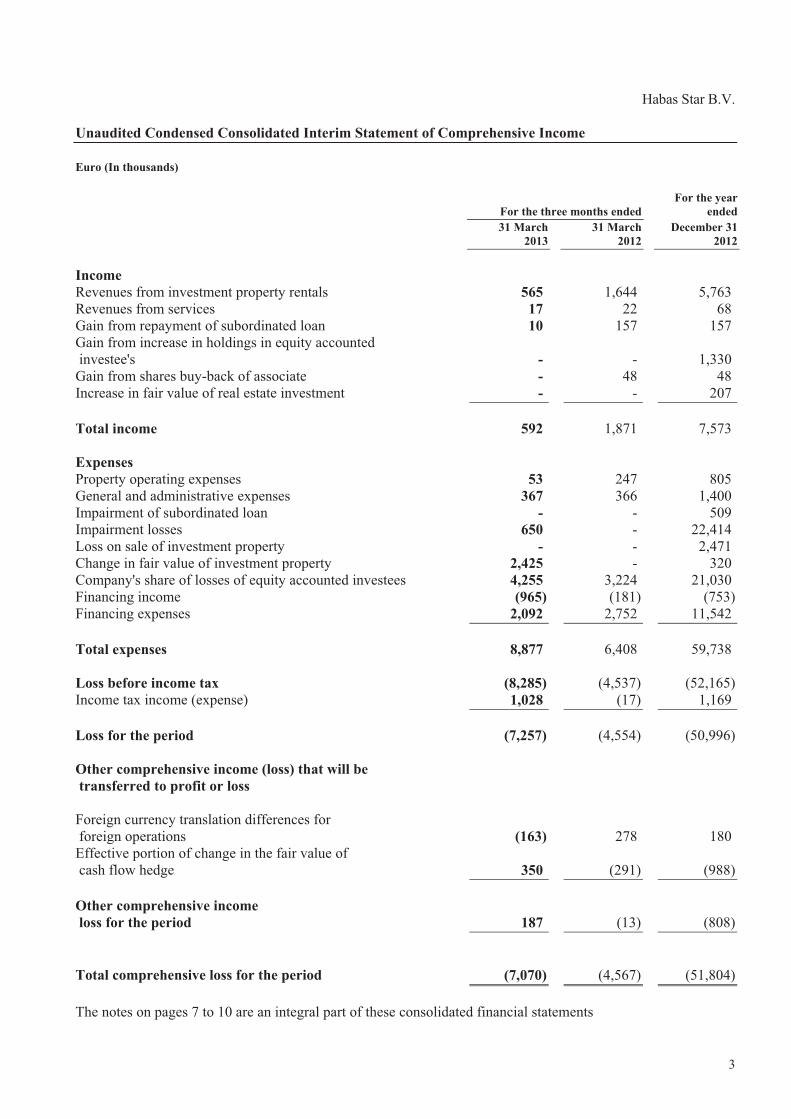
3
Habas Star B.V. Unaudited Condensed Consolidated Interim Statement of Comprehensive Income Euro (In thousands) For the year For the three months ended ended 31 March 31 March December 31 2013 2012 2012 Income Revenues from investment property rentals 565 1,644 5,763 Revenues from services 17 22 68 Gain from repayment of subordinated loan 10 157 157 Gain from increase in holdings in equity accounted investee's - - 1,330 Gain from shares buy-back of associate - 48 48 Increase in fair value of real estate investment - - 207 Total income 592 1,871 7,573 Expenses Property operating expenses 53 247 805 General and administrative expenses 367 366 1,400 Impairment of subordinated loan - - 509 Impairment losses 650 - 22,414 Loss on sale of investment property - - 2,471 Change in fair value of investment property 2,425 - 320 Company's share of losses of equity accounted investees 4,255 3,224 21,030 Financing income (965) (181) (753) Financing expenses 2,092 2,752 11,542 Total expenses 8,877 6,408 59,738 Loss before income tax (8,285) (4,537) (52,165) Income tax income (expense) 1,028 (17) 1,169 Loss for the period (7,257) (4,554) (50,996) Other comprehensive income (loss) that will be transferred to profit or loss Foreign currency translation differences for foreign operations (163) 278 180 Effective portion of change in the fair value of cash flow hedge 350 (291) (988) Other comprehensive income loss for the period 187 (13) (808) Total comprehensive loss for the period (7,070) (4,567) (51,804) The notes on pages 7 to 10 are an integral part of these consolidated financial statements
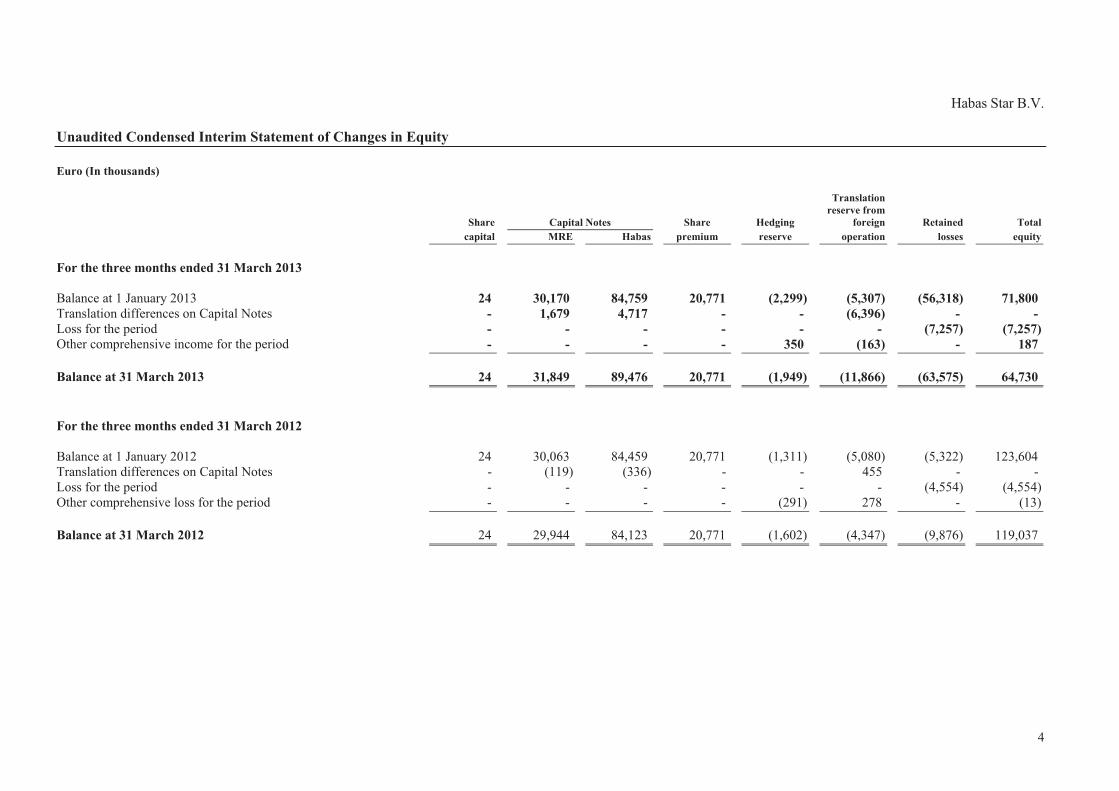
4
Habas Star B.V. Unaudited Condensed Interim Statement of Changes in Equity Euro (In thousands) Translation reserve from Share Capital Notes Share Hedging foreign Retained Total capital MRE Habas premium reserve operation losses equity For the three months ended 31 March 2013
Balance at 1 January 2013 24 30,170 84,759 20,771 (2,299) (5,307) (56,318) 71,800 Translation differences on Capital Notes - 1,679 4,717 - - (6,396) - - Loss for the period - - - - - - (7,257) (7,257) Other comprehensive income for the period - - - - 350 (163) - 187 Balance at 31 March 2013 24 31,849 89,476 20,771 (1,949) (11,866) (63,575) 64,730 For the three months ended 31 March 2012
Balance at 1 January 2012 24 30,063 84,459 20,771 (1,311) (5,080) (5,322) 123,604 Translation differences on Capital Notes - (119) (336) - - 455 - - Loss for the period - - - - - - (4,554) (4,554) Other comprehensive loss for the period - - - - (291) 278 - (13) Balance at 31 March 2012 24 29,944 84,123 20,771 (1,602) (4,347) (9,876) 119,037
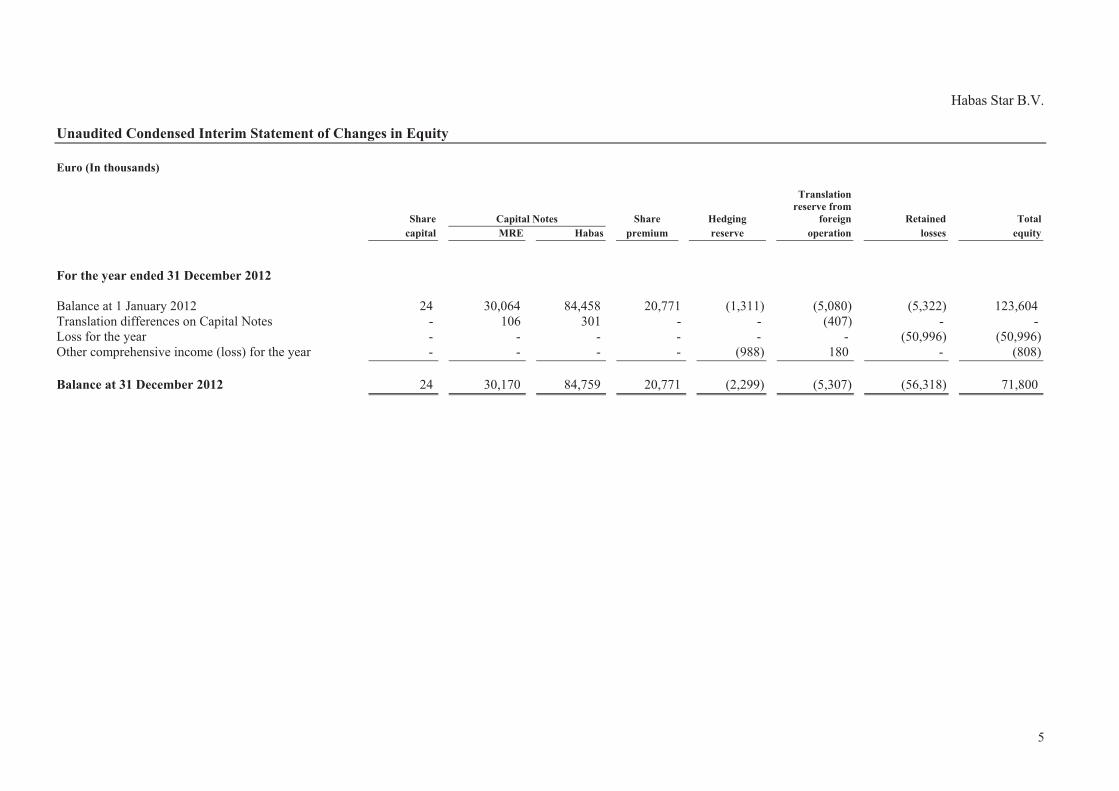
5
Habas Star B.V. Unaudited Condensed Interim Statement of Changes in Equity Euro (In thousands) Translation reserve from Share Capital Notes Share Hedging foreign Retained Total capital MRE Habas premium reserve operation losses equity For the year ended 31 December 2012 Balance at 1 January 2012 24 30,064 84,458 20,771 (1,311) (5,080) (5,322) 123,604 Translation differences on Capital Notes - 106 301 - - (407) - - Loss for the year - - - - - - (50,996) (50,996) Other comprehensive income (loss) for the year - - - - (988) 180 - (808) Balance at 31 December 2012 24 30,170 84,759 20,771 (2,299) (5,307) (56,318) 71,800
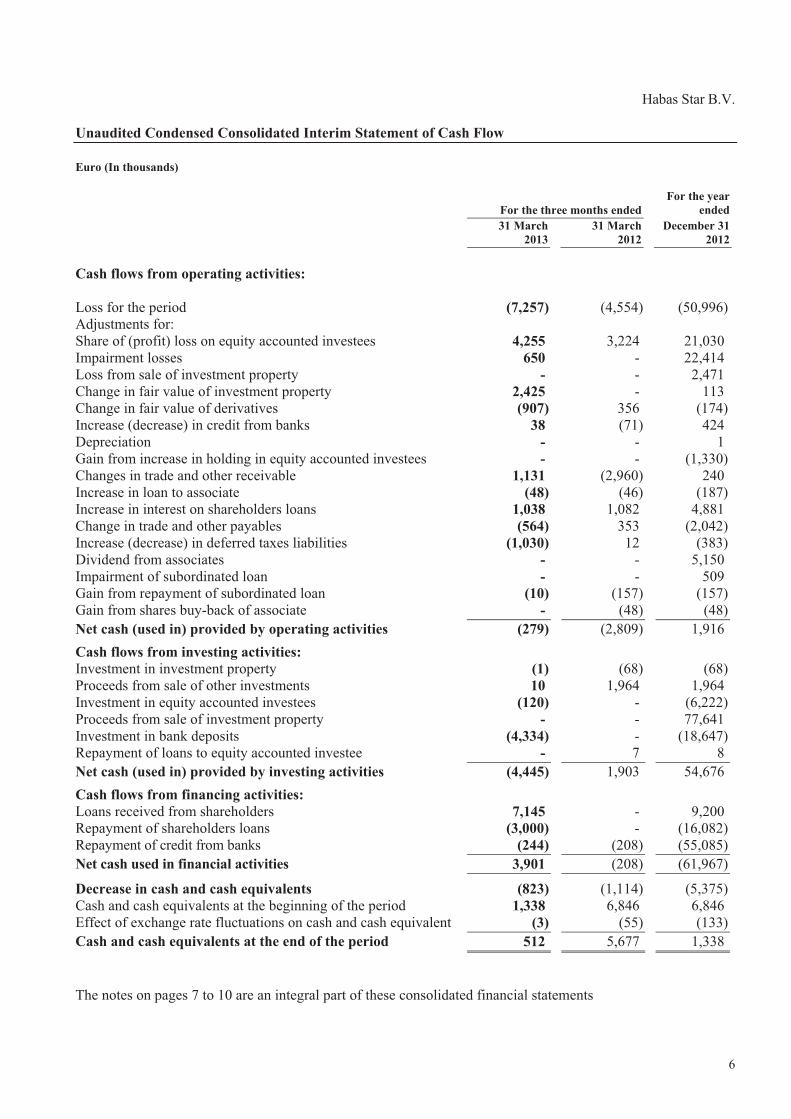
6
Habas Star B.V. Unaudited Condensed Consolidated Interim Statement of Cash Flow Euro (In thousands)
For the year For the three months ended ended 31 March 31 March December 31 2013 2012 2012 Cash flows from operating activities: Loss for the period (7,257) (4,554) (50,996)Adjustments for: Share of (profit) loss on equity accounted investees 4,255 3,224 21,030 Impairment losses 650 - 22,414 Loss from sale of investment property - - 2,471 Change in fair value of investment property 2,425 - 113 Change in fair value of derivatives (907) 356 (174)Increase (decrease) in credit from banks 38 (71) 424 Depreciation - - 1 Gain from increase in holding in equity accounted investees - - (1,330)Changes in trade and other receivable 1,131 (2,960) 240 Increase in loan to associate (48) )46( (187)Increase in interest on shareholders loans 1,038 1,082 4,881 Change in trade and other payables (564) 353 (2,042)Increase (decrease) in deferred taxes liabilities (1,030) 12 (383)Dividend from associates - - 5,150 Impairment of subordinated loan - - 509 Gain from repayment of subordinated loan (10) (157) (157)Gain from shares buy-back of associate - (48) (48)Net cash (used in) provided by operating activities (279) (2,809) 1,916
Cash flows from investing activities: Investment in investment property (1) )68( (68)Proceeds from sale of other investments 10 1,964 1,964 Investment in equity accounted investees (120) - (6,222)Proceeds from sale of investment property - - 77,641 Investment in bank deposits (4,334) - (18,647)Repayment of loans to equity accounted investee - 7 8 Net cash (used in) provided by investing activities (4,445) 1,903 54,676
Cash flows from financing activities: Loans received from shareholders 7,145 - 9,200 Repayment of shareholders loans (3,000) - (16,082)Repayment of credit from banks (244) )208( (55,085)Net cash used in financial activities 3,901 )208( (61,967)
Decrease in cash and cash equivalents (823) (1,114) (5,375)Cash and cash equivalents at the beginning of the period 1,338 6,846 6,846 Effect of exchange rate fluctuations on cash and cash equivalent (3) (55) (133)Cash and cash equivalents at the end of the period 512 5,677 1,338 The notes on pages 7 to 10 are an integral part of these consolidated financial statements
7
Habas Star B.V. Notes to the Unaudited Condensed Consolidated Interim Financial Statements Note 1 - Reporting Entity
Habas Star B.V. (hereinafter: “The Company”) was incorporated in The Netherlands as a private company with limited liability and acts as a financing and holding company. The Company is owned 74% by Habas Investment (1960) Ltd. and 26% by Mayer (Kesher) Real Estate Ltd. The Company was incorporated on 24 October 2006 and is registered at the Chamber of Commerce in Amsterdam. The condensed consolidated interim financial statements of the Company as of and for the three month period ended 31 March 2013 comprise the Company and its subsidiaries (hereinafter: “The Group”), and the Company’s interests in associates. The Company’s business is investment in properties, held directly or indirectly, for the generation of rental income and gains and real estate debt transactions.
Note 2 - Statement of Compliance
A. Statement of compliance These condensed consolidated interim financial statements have been prepared in accordance with IAS 34 Interim Financial Reporting and do not include all of the information required for full annual financial statements. They should be read in conjunction with the financial statements as of and for the year ended 31 December 2012 (hereinafter: “the annual financial statements”). These condensed consolidated interim financial statements were approved by the Board of Directors on 24 May 2013. B. Use of estimates and judgments The preparation of financial statements in conformity with IFRSs requires management to make judgments, estimates and assumptions that affect the application of accounting policies and the reported amounts of assets, liabilities, income and expenses. Actual results may differ from these estimates. The significant judgments made by management in applying the Group’s accounting policies and the principal assumptions used in the estimation of uncertainty were the same as those that applied to the annual financial statements.
Note 3 - Significant Accounting Policies
Except as described below, the accounting policies applied by the Group in these condensed consolidated interim financial statements are the same as those applied by the Group in its annual financial statements. Presented hereunder is a description of the changes in accounting policies that were applied in these condensed consolidated interim financial statements and their effect:
Habas Star B.V. Notes to the Unaudited Condensed Consolidated Interim Financial Statements
8
Note 3 - Significant Accounting Policies (cont’d)
As from January 1, 2013 the Group applies the new amendment described below:
1. Amendment to IAS 1, Presentation of Financial Statements: Presentation of Items of Other Comprehensive Income (hereinafter - “the Amendment”). The amendment to IAS 1 changes the presentation of items of other comprehensive income (hereinafter – “OCI”) in the financial statements, so that items of OCI that may be reclassified to profit or loss in the future, would be presented separately from those that would never be reclassified to profit or loss.
The application of the standard had no material effect on the financial statements.
2. A new suite of accounting standards on consolidation of financial statements, joint arrangements and disclosure of involvement with other entities
IFRS 10 Consolidated Financial Statements (hereinafter - “IFRS 10”). IFRS 10 introduces a new single control model for determining whether an investee should be consolidated, which is to be implemented with respect to all investees. According to IFRS 10 de facto power is to be considered when assessing control, which means that the existence of effective control of an investee will require consolidation. In addition, when assessing the existence of control, all substantive potential voting rights will be taken into account, and not only potential voting rights that are currently exercisable. The application of the standard had no material effect on the financial statements. The suite of standards is applicable retrospectively for annual periods beginning on or after January 1, 2013 (other than certain relief in the transitional provisions).
IFRS 13, Fair Value Measurement
When measuring the fair value of a liability the effect of the entity’s own credit risk must be taken into account. Measurement of fair value of investment property should reflect consideration of future capital expenditure which would improve or extend the property and the future economic benefits to be gained from this expenditure should such expenditure or benefits be taken into account by market participants on the measurement date. Should there be a bid price and ask price for an asset or liability being measured at fair value, the price in the range between them which best reflects fair value under the circumstances should be used in order to measure fair value. IFRS 13 is applicable on a prospective basis where the disclosure requirements need not be applied in comparative information for periods before initial application. The application of the standard had no material effect on the financial statements.
Note 4 - Significant Events during the Reporting Period
1. Further to Note 7A to the Annual Statements, following a further decrease in NSI’s share price, the Company has reviewed the provision for impairment of its investment in NSI, using an external, independent appraiser. According to the valuation, which is attached to these financial statements, no further provision for impairment, beyond the provision for impairment recorded in 2012 is necessary. As at March 31, the carrying amount of the investment in NSI shares is EUR 132.6 million this is calculated as the investment amount before impairment - EUR 155,014 thousand, less impairment provision of EUR 22,414 thousand, to give a net investment amount in the books of EUR 132.6 million.
Habas Star B.V. Notes to the Unaudited Condensed Consolidated Interim Financial Statements
9
Note 4 - Significant Events during the Reporting Period (cont’d)
2. Following a continuing decrease in NSI’s share price during and after the reporting period, Tulip is required, according to the agreement with the bank lender (described in Note 14A in the annual financial statements) to increase the loan guarantee in order to avoid a LtSV breach. Accordingly, an additional cash amount of about EUR 6.1 million has been pledged to the bank lender, so that as at 31 March 2013, the balance of the pledged account was EUR 18.2 million. Since at the reporting date the LtSV was 51.40% Tulip obtained a waiver on 25 March 2013 from the bank lender agreeing to accept a temporary new LtSV level of 55%. This temporary waiver was valid from 25 March 2013 until 5 April 2013. After the reporting date the pledged account balance has increased to EUR 18.7 million.
The increase in the pledged account deposit was financed by the shareholders of the Company as follows:
a. On 11 February 2013 the Company received a loan of EUR 2.5 million from Mayer (Kesher) Real Estate Ltd. (hereinafter: “MRE”). This loan bears an annual interest rate of 12%. On 1 May 2013 the Company repaid partial repayment of the loan in the amount of EUR 1 million. The parties agreed to postpone the repayment date of the loan balance until 31 May 2013. On 13 May 2013 the Company repaid the remainder of the loan in the amount of about EUR 1.57 million (principal and interest accrued to that date).
b. On 14 March 2013, the Company received an additional loan from MRE totalling EUR 1.3 million. This additional loan is repayable by 13 June 2013 and bears an annual interest rate of 12%, together with an additional “Phantom Amount” to be calculated as follows: On the date of granting the loan, the NSI share value on the Euronext stock exchange (hereinafter: “Stock Exchange”), was EUR 5.36 per share.
For so long as the average closing price of the NSI shares on the Stock Exchange, during the ten trading days preceding the loan repayment date (hereinafter: “NSI Stock Value at maturity price”), is higher than EUR 5.36 per share, an additional amount known as the Phantom Amount will be payable by the Company, calculated based on a notional multiplier of 242,537 (i.e. EUR 1.3 million divided by EUR 5.36 per share) multiplied by the difference between: (a) the NSI share value on the date of repayment and (b) EUR 5.36. Where the NSI share value at the date of repayment is lower than EUR 5.36, then the Phantom Amount is zero.
The meaning of the above is that in addition to the interest that MRE will be entitled to under the additional loan, MRE will also be entitled to an additional amount (the Phantom Amount) if should there be any increase in value of the NSI shares above EUR 5.36 at the date of repayment for 242,537 NSI shares represents about 1.7% of the total shares held by Tulip in NSI.
If the additional loan, including interest and the Phantom Amount, if any, is not fully repaid by the due date, the amount of the outstanding loan principal, plus interest, plus any Phantom Amount, will bear interest at a rate of 5% per month.
Under the additional loan agreement, the Company has undertaken that any cash flow to the Company will be used exclusively for the repayment in whole or in part of this additional loan.
In the event that the financing bank exercises its right to enforce Tulip to sell any or all of its shares in NSI, then the additional loan shall become immediately repayable.
Habas Star B.V. Notes to the Unaudited Condensed Consolidated Interim Financial Statements
10
Note 4 - Significant Events during the Reporting Period (cont’d)
2. (cont’d) c. On 21 March, 2013, the Company received new loans of about EUR 1.2 million from
its shareholders Habas investments and MRS pro-rata to their shareholdings. d. On 5 April 2013, the Company received new loans of about EUR 0.7 million from
Habas Investments and MRS pro-rata to their shareholdings. Note 5 - Subsequent Events
1. On 10 April, 2013 the Company sold its entire interest (30%) in Horn Three GmbH & Co. KG and Horn Three Management GmbH, two entities incorporated in Germany, to an unrelated third party, for a total of about EUR 1.27 million. Of this amount as agreed between the parties, a total of about EUR 0.27 million will be paid to cover part of a tax liability (Real Estate Transfer Taxes) arising in respect of this transaction (the remaining balance of the tax liability will be paid by the buyer). For more information about the entities sold, see Note 7 of the annual financial statements. This transaction has generated to the Company a net cash flow of about EUR 1 million. The Company recorded a loss from the sale of approximately EUR 0.23 million. Horn Three GmbH & Co KG acquired the three shopping centers in Germany, held at the date of this report by Durango Munich GmbH & Co. (a German entity owned 30% by the company) (hereinafter: “Durango”). On completion of this sale, the Company will record an additional loss of about EUR 0.41 million. The sale of the three properties mentioned above is not expected to generate any cash to investors in Durango.
2. On 21 Further to Note 7C to the Annual Statements, in May 2013 Tarcoola Shopping Centers
GmbH an equity accounted investee, registered in Germany, reached an agreement with the financing bank who have agreed to retract their demand for immediate repayment of the loan and extended the repayment date to October 2014.
Accountants - Belastingadviseurs - Management Consultants Mazars Tower, Delflandlaan 1 - Postbus 7266 - 1007 JG Amsterdam Tel: 020 20 60 500 - Fax: 020 64 48 051 - [email protected]
Mazars Paardekooper Hoffman N.V. Statutair gevestigd te Rotterdam (KvK Rotterdam nr. 24389296).
46526/018SvS/JK
REVIEW REPORT
To: the management and shareholders of Habas Star B.V.
INTRODUCTION
We have reviewed the accompanying balance sheet of Habas Star B.V. (“the Company”) as of March 31, 2013 and the related statements of income, changes in equity and cash flows for the three-month period then ended. Management is responsible for the preparation and presentation of this interim financial information in accordance with IAS34. Our responsibility is to express a conclusion on this interim financial information based on our review.
SCOPE OF REVIEW
We conducted our review in accordance with International Standard on Review Engage-ments 2410, "Review of Interim Financial Information Performed by the Independent Auditor of the Entity." A review of interim financial information consists of making inquiries, primarily of persons responsible for financial and accounting matters, and applying analytical and other review procedures. A review is substantially less in scope than an audit conducted in accordance with International Standards on Auditing and consequently does not enable us to obtain assurance that we would become aware of all significant matters that might be identified in an audit. Accordingly, we do not express an audit opinion.
CONCLUSION
Based on our review, nothing has come to our attention that causes us to believe that the accompanying interim financial information is not prepared, in all material respects, in accordance with IAS 34.
RESTRICTION ON DISTRIBUTION AND USE
The interim financial information is prepared for purposes of providing information to Habas Investments (1960) Ltd. and their auditors to enable it to prepare the interim financial information of the group. The interim financial information may not be distributed or used for another purpose and should not be issued to third parties without our prior written consent.
Amsterdam, 24 May 2013
M A Z A R S P A A R D E K O O P E R H O F F M A N N . V .
w.s. F.D.N. Walta RA

�������������������������� ������� �
) ������ �1960 ( ���� ���
����� ���� ���� ����
����31 ���2013 (���� ���)
��� ) �����1960����� ������ (
���� ��� ������� ������ ����� ������� ����� ����� ���� ������ ������
�������� ���
���
������� ����� ���� �� 2
���������� ����� ���� �� ���� 3
����� ����� ����� �� ���� ����� 4
������� ������ �� ���� ����� 5
����� ��� ����� � ��� ������ ��� � �� 7
������ ��� ���� 8000 684 03 ������ �� KPMG �������� 8444 684 03 ������ ����17 ���� �� ,609 ����� www.kpmg.co.il
�� �� ��61006
���� ����� ������� ������ ,������ ���
KPMG � � ���� � �� �� �� � � �� ��� - KPMG
International Cooperative ("KPMG International") .�������� ����
���� ) ����� ��� � ����� ����1960����� ������ (
�"��� '��18 ���� ��
,..�
� ���� �� ���� �� : ���� ���� ��� ���� ����� ���� ���� �� ���� ��38 ��� ������ ������ '�
�"��� ,(������� �������� ����)- 1970
����
��� ��� ����� ��� ������ ����� � ��� �� ����38 �������� ���� ) ��� ����� ����� ' �"�� ,(��� ���- 1970 ) ����� ��� ���� �1960��� ( ����) ����� ���- ���� ,(�����31 ����2013
������� ��� ��� ������ ����� � ��� .����� ����� ������� �� �� ��� � ������� ������ ��� ������ ����� � ��� �� ���� ����� ��� ������� .����� � ������ ��������� �
������ �� ������ �� �����.
��� �� ������� ������� ������� ����� � ������� ���� � ���� ��� ������ ����� � ��� �� � ���� � ������� ���� � .������� ����� � ������� ����� � ������ ������ � ����� ����
,������ �� ������ ������� ����� ���� ���� � � �� ���� ����� ���� ��� ��� ���� � ���,����� ���� ���� ������� .������ ����� ���� � ������ ���� �� ������
������ ����
����� ���� ����� ������ �� ����1 ������� ���� � �� � �����" ����� ���� ���� ��� �
���� � �� � ����� ."���� � ����� ����� ���� � � �� ����� ����� ����� ������� ���������� ������, ��������� ������� ������ ������� ��� �� �����, ����� ��� ������������ �������. ���� ����� ����� ������ ��� ���� � ��� ������ ������� ��� �����
������ ���� �� ����� ��� ������ ����� ������� ������ ��� ��������� ������ ��� � ���������� ������ ����� ������. ������ � �� ���� ������ �� ��� ,��� �����.
����
�� ����� �� ���� ����� �� �� ,����� ���� ���� � ������ ���� ��� ,������ �� ������
� ��� ������ ����� � ��� �����"���� ��� ��������� ������ ��� ,, ��� ������� �����38 �"�� ,(��� ��� �������� ���� ) ��� ����� ����� ' - 1970.
:����� ��� ���� �� ���� �� ,�"� ����� �� ����� ���� .� ����� �����1 ����� ����� � ������ �� � �������� ����� �� � ��� ����� � ��� �
���� ��� �� ���� ����� � ������� ���� ����� �� � ����� ��12 �- 4 �� ��� ������� ������� ���2013 ����� ������� ,�"� ����� �������� ����� ������ �� �� ,��� ������ .
���� ,������ �� ���� �� ������� ���� � ."�� ���"� ����� � ����� ��� �� � �������� ���� ���� �� ����� �� ���� ������ ���� ,������� ����� � ������������ �����
."�� ���"� ������ �����
.� ����� �����5 � ����������� ���� ����� ����� ������ ���� �� � �� ����NSI ���� , ���� ����� � ���� ����� ,����� ���� ��� ��� ������� ������NSI �� � ������ ������
.������ �� �������� ������� .� �������� �����7� �-7 ����� � ���� ������ �� � �� ���� ����� ������ ���� ������ �
.�������� ������� ������ �����
������ ���� ���� ����
27 ����2013
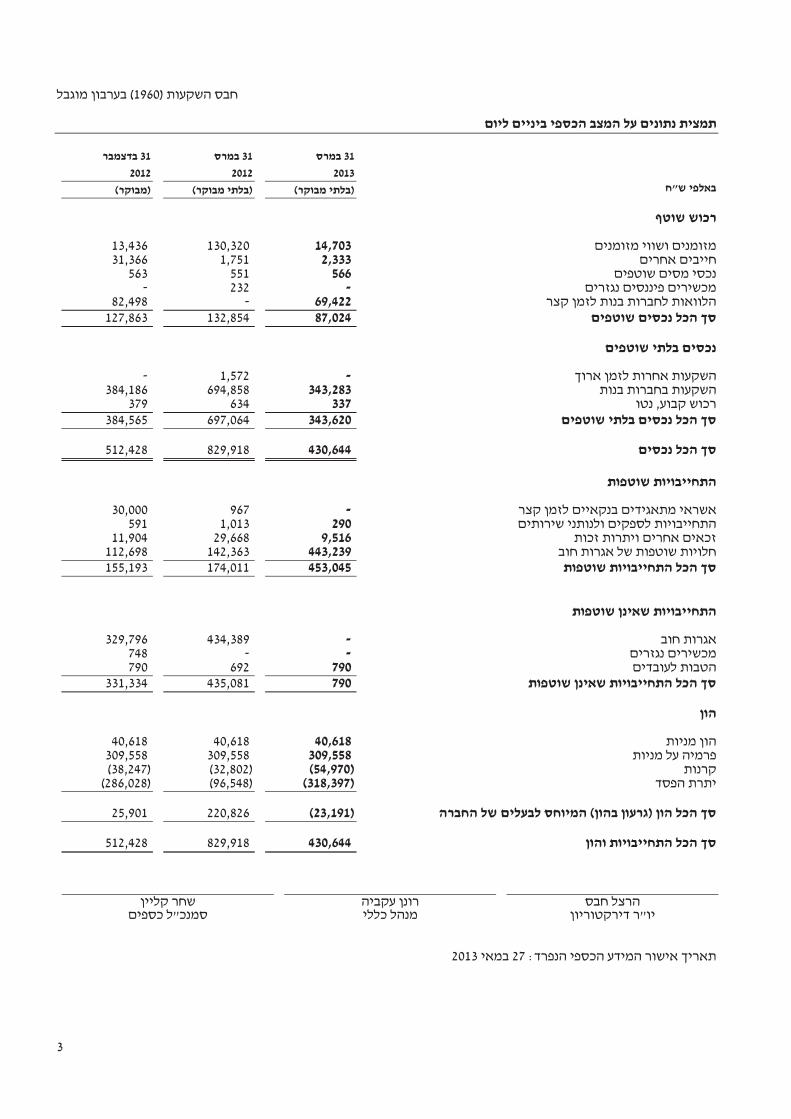
3
��� ) �����1960����� ������ (
���� ��������� ����� ����� ��� �� �� 31 ��� 31 ��� 31 ���� 2013 2012 2012
"� ���� (���� ���) (���� ���) (����)
���� ����
������ ���� ������ 14,703 130,320 13,436 ����� ������ 2,333 1,751 31,366
����� ���� ��� 566 551 563 ����� ����� ������ - 232 -
��� ���� ��� ������ ������� 69,422 - 82,498 ������ ����� ��� �� 87,024 132,854 127,863
������ ��� �����
���� ���� ����� ����� - 1,572 -
��� ������ ����� 343,283 694,858 384,186 �� ,���� ��� 337 634 379
������ ��� ����� ��� �� 343,620 697,064 384,565
����� ��� �� 430,644 829,918 512,428
������ ��������
��� ���� ������ �� ����� ����- 967 30,000 ���� ���������������� ����� ��290 1,013 591
���� ������ ����� ����� 9,516 29,668 11,904 ��� ����� � ����� ������ 443,239 142,363 112,698 ������ �������� ��� �� 453,045 174,011 155,193
������ ���� ��������
������� � - 434,389 329,796 ����� ������ - - 748 �� ���� ����� 790 692 790
������ ���� �������� ��� �� 790 435,081 331,334
��
���� ���40,618 40,618 40,618 ���� �� ����� 309,558 309,558 309,558
����)54,970( )32,802( )38,247( ��� ���� )318,397( )96,548( )286,028(
��� �� ����� ����� ( �� ����) �� ��� ��)23,191( 220,826 25,901
��� �������� ��� �� 430,644 829,918 512,428
��� ���� ����� �������� ��
�"�� ��������� ���� �������� �"���
: ��� ����� � ��� ���� �����27 ����2013
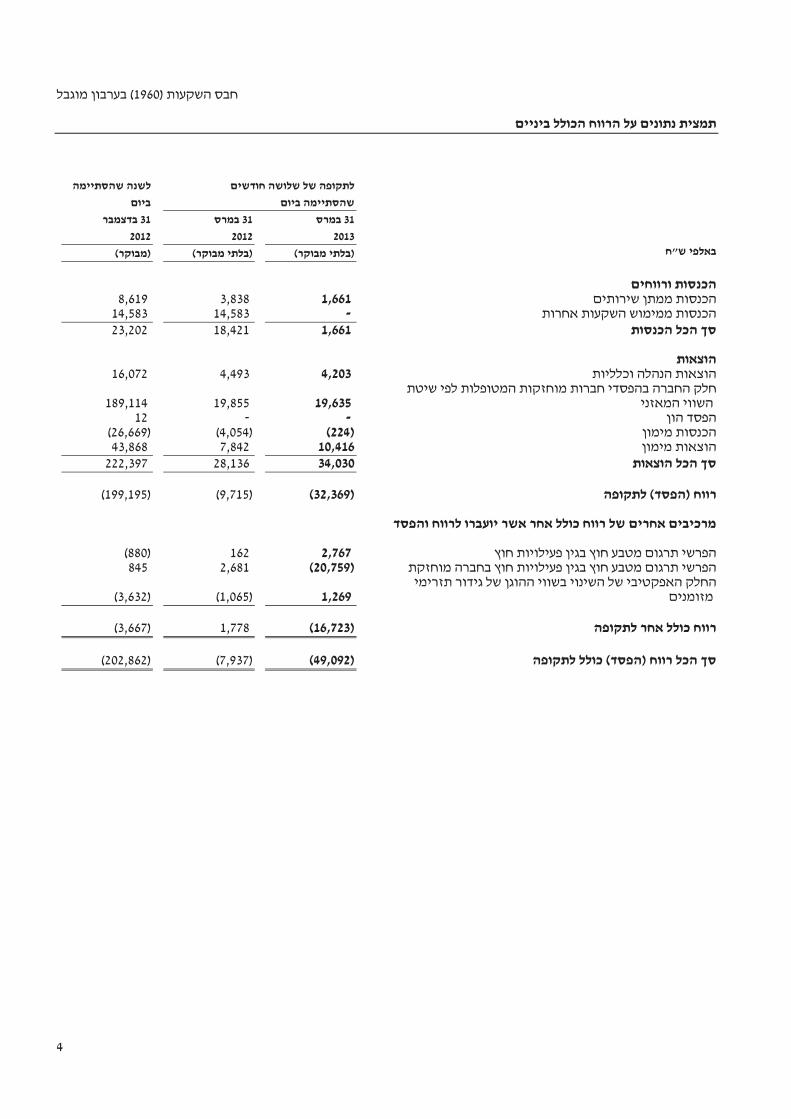
4
) ����� ���1960����� ������ (
����� ����� ���� �� ������ ����� ����� ����� �� ������ �������� ���� ��� �������� ��� 31 ��� 31 ��� 31 ���� 2013 2012 2012
"� ���� (���� ���) (���� ���) (����)
������ ������ ������ ���� ����� 1,661 3,838 8,619
����� ����� ����� ����� - 14,583 14,583 ������ ��� �� 1,661 18,421 23,202
������
������� ���� ������ 4,203 4,493 16,072 ����� ������� ��� �������� ������� ����� � ���
����� ���� 19,635 19,855 189,114 ��� ���- - 12
����� ����� )224( )4,054( )26,669( ����� ������ 10,416 7,842 43,868
������ ��� �� 34,030 28,136 222,397
������ (����) ��� )32,369( )9,715( )199,195(
����� ���� ����� ��� �� ���� ��� �� ���� ������
��� �������� ���� ��� ���� ����� ����2,767 162 )880( ������ ����� ��� �������� ���� ��� ���� ����� ����)20,759( 2,681 845 ������ �� �� � ����� ���� ���� � �������� ����
������ 1,269 )1,065( )3,632(
������ �� ���� ��� )16,723( 1,778 )3,667(
������ ���� (����) ��� ��� ��)49,092( )7,937( )202,862(
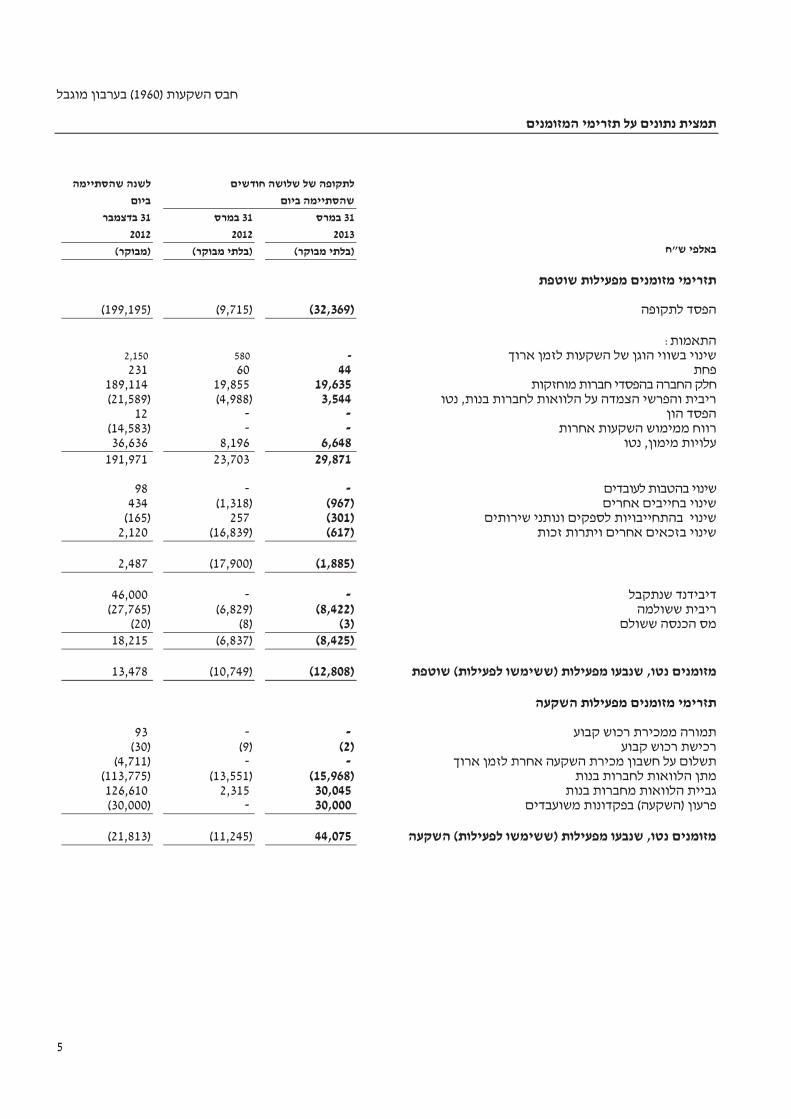
5
) ����� ���1960� (����� �����
�������� ������ �� ������ ����� ����� ����� �� ������ �������� ���� ��� �������� ��� 31 ��� 31 ��� 31 ���� 2013 2012 2012
"� ���� (���� ���) (���� ���) (����)
����� ������� ������� ������
��� ������ )32,369( )9,715( )199,195(
:������ ���� ���� ����� � ���� ���� ���- 580 2,150
���44 60 231 ������� ����� � ���� ����� ���19,635 19,855 189,114
�� ,��� ������ ������� �� � ��� ����� �����3,544 )4,988( )21,589( ��� ��� - - 12
����� ����� ����� ���� - - )14,583( �� ,����� ������ 6,648 8,196 36,636
29,871 23,703 191,971
�� ���� ������ ��� - - 98 ����� ������� ��� )967( )1,318( 434
�� ���� ������ ����������� �������)301( 257 )165( ���� ������ ����� ������ ���)617( )16,839( 2,120
)1,885( )17,900( 2,487
���� ��� - - 46,000
���� ����� )8,422( )6,829( )27,765( ��� ���� �� )3()8( )20(
)8,425( )6,837( 18,215
��� ������� ������� ���� ,������) ������������ ()12,808( )10,749( 13,478
����� ������� ������� ������
���� ��� ������ ����� - - 93 ���� ��� ���� )2()9( )30(
���� ���� ���� ���� ����� ���� �� ����- -)4,711( ��� ������ ������� ��� )15,968( )13,551( )113,775(
��� ������ ������� �����30,045 2,315 126,610 �� ���� ��� ��� (����) ����� 30,000 -)30,000(
���� ,��� ������� �������������) ������������ ( 44,075 )11,245( )21,813(
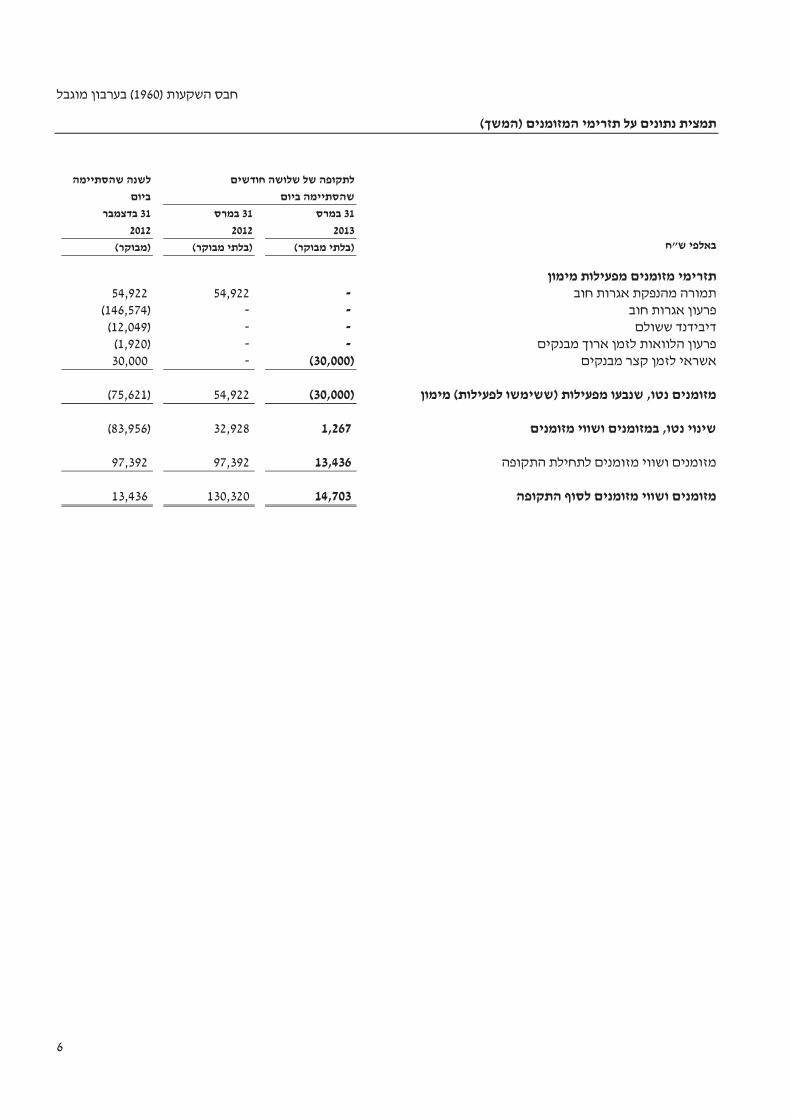
6
�� ���) ���1960����� ������ (
(����) �������� ������ �� ������ ����� ����� ����� �� ������ �������� ���� ��� �������� ��� 31 ��� 31 ��� 31 ���� 2013 2012 2012
"� ���� (���� ���) (���� ���) (����)
���� ������� ������� ������ ��� ����� ����� ����� - 54,922 54,922
��� ����� ����� - -)146,574( ��� ��� - -)12,049(
����� ���� ���� ������� ����� - -)1,920( ����� ��� ���� ���� )30,000( - 30,000
���� ,��� ������� �������������) �������� ( ��� )30,000( 54,922 )75,621(
������� ����� ������� ,��� ����� 1,267 32,928 )83,956(
������ ������ ������ ���� ������ 13,436 97,392 97,392
������ ���� ������� ����� ������� 14,703 130,320 13,436
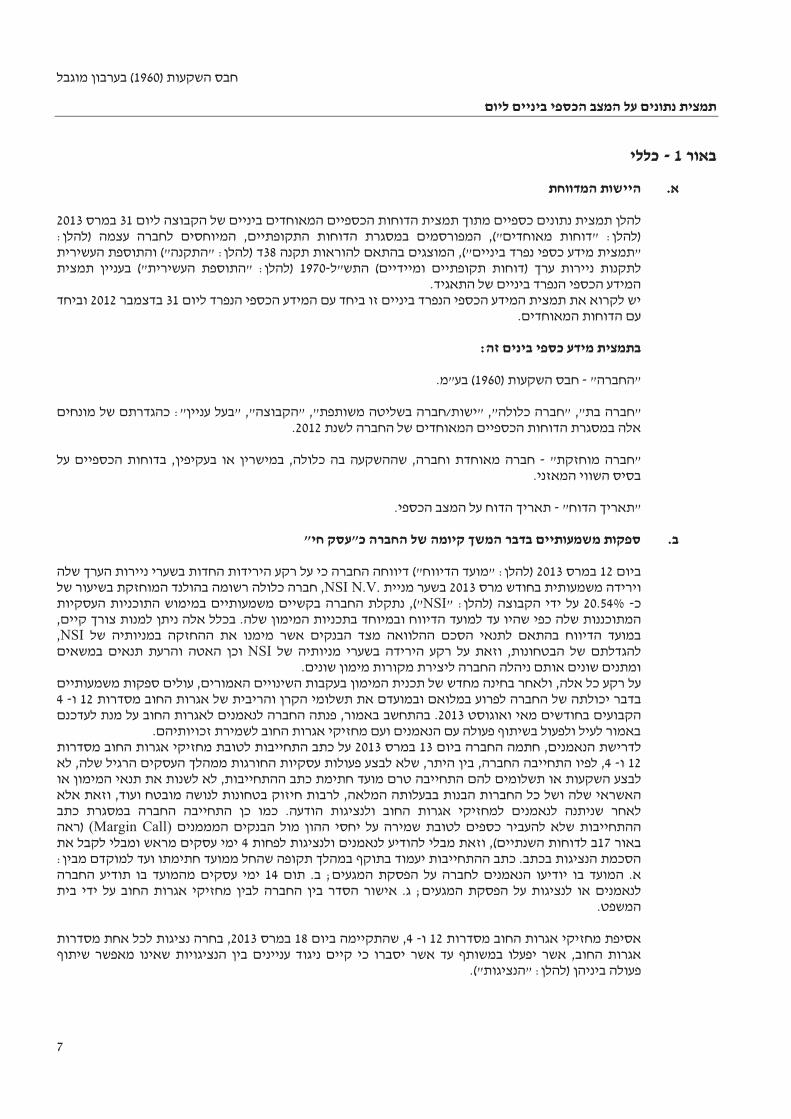
��� ) �����1960����� ������ (
���� ��� �� ������ ��������� ����� �
7
���1 - ���� �. ������ ������
���� ������ � ����� �� ����� ������� ���� � ����� ���� ������ ���� ����� ����31 ����2013
:����) ���� ����� �������� ,��������� ���� � ������ ��������� ,("�� ���� ���� " :����)������� ����� ������� ,("����� �� ���� � �� �����" ���38 ������ ������� ("����" :����)
�"�� (��� ���� �������� ���� ) ��� ����� �����-1970 ����� ����� ("������ ������" :����). ����� � ����� ��� ����� � ���
���� ��� ����� � ��� �� ��� �� ����� ��� ����� � ��� ����� �� ����� �31 ��� � �2012 ����.�� ����� ���� � ��
:�� ���� ���� ���� �����
"�����"- ) ����� ���1960.�"�� (
����� � ��� ��� :"���� ���" ,"������" ,"����� ����� ����/���" ,"����� ����" ,"�� ����"
�� ����� � �� ����� ������� ���� � ������ ���2012.
���� ����" "��- �� ������� ���� � ,������� �� ������ ,����� �� ����� ,����� � ���� ����.����� ���� ����
"�� � �����"- .����� ���� �� �� � �����
. "� ���"� ��� �� ����� ���� �� ��������� �����
����12 ����2013 �� �� �� ����� ����� ("���� � ���" :����) �� ���� ����� ���� �� �� �� ���� �
��� ��� ������� � ����2013 ���� ���N.V. NSI � ����� ������� ���� ���� ����� ���� ,�- 20.54% " :����) ������ � � ��NSI ������� ������� ����� �������� ����� ����� ���� ,("
���� � ��� ��� �� ������� ,���� ���� ���� ��� ��� ���� .�� ������ ������ ������ ���� � � ������� ������ �� ���� �� ����� �� ������� ���� ���� ����� ���� � ����NSI ,
� ������ ���� � ���� ��� �� ���� ,������� � ��� ���NSI ����� ���� ����� ���� ����� ��� ����� .��� ����� ������ ������ ����� ���� ��
�������� ����� ����� ,������� ������ ������ ������ ���� � �� ���� ����� ,��� �� ��� �� ��� �� ���� ����� � ������� ���� ����� �� � ����� ������ ����� ����� � ������ �� �12 �- 4
���� ��� �� ��� ������� ���2013 �� �� �� �� ���� ������ ����� ����� ��� ,����� ����� ..��������� ����� ���� ����� ������ ��� ����� �� ����� ����� ������ ���� �����
���� ����� ���� ,����� ��� �13 ����2013 ��� �� ���� ����� ������ ����� �������� ��� ��12 �- 4���� , �� ,�� ����� ������ ����� ������� ������ ������ ���� �� ,���� ��� ,����� �������
�� ������ ��� �� ��� �� ,��������� ��� ����� ��� ��� ������� ��� ������ �� ����� ������ ����� ��� ������ ����� ����� ,����� ������� ���� ������ �� �� �� ����� ��� ���� , �
��� ������ ����� ������� �� ��� .�� �� ������� ���� ����� ������� ����� ��� ���� ������ ����� ��� ���� ���� �� ���� ����� ����� ������ �� ���������)Margin Call( ���)
����17 ����� ������� ����� �� ��� ���� ���� ,(����� ���� � �4 �� ���� ����� ��� ����� ��� :���� � ���� �� ������ ���� ��� ����� ����� ����� ���� ��������� ��� .���� ������ �����
��� .� ;������ ����� �� ����� ����� ��� �� �� ���� .�14 ����� �� �� �� ����� ����� ���� .� ;������ ����� �� ������ �� ����� ��� � � �� ���� ����� ������ ���� ����� ��� � �� ���
.����
��� �� ���� ����� ������ �����12 �- 4 ���� ������� ,18 ����2013 ��� �� ��� ��� ����� ���� , ���� ���� ��� �������� ��� ����� ��� ���� �� ����� �� � ����� ����� �� ,���� �����
���.("������" :����) ����� ��
��� ) �����1960����� ������ (
���� ��� �� ������ ��������� ����� �
8
���1 - (����) ����
. (����) "� ���"� ��� �� ����� ���� �� ��������� �����
������ � �������� ������ �� ������ ������ �� ����� ����� ����� ������� �� � ����� ����� ��������� ,����� ���� ��� �� � ����� �� � ������ ����� �� ,����� � ���� �� ���
.����� ���� ����� ������ ����� �� �� ����� ����� ���� �� � ���� ����� �������� �������� ������ ��� �� �����6 ,7 �- 9 .�� ���� ����� ������ ���� ������
����13 ����2013 ��� ������ ���� �� �� �� ����� ����� �� �) �12 ���� ���� �� � ����� � (
�� �) ��� ����� � ������ ��� ����� ��� �12 ���� ������ ����� ��� �� ��� ,(31 ����2013 , ����17 ����2013.
����19 ����2013 ���� ������ ,����� ,����� ���� ���� � � �� ��� ����� ������ ����� ������� ,���� ���� ������� ������ �������� ����� ���� ����������� �������� �� �18 ����2013 ,
������� ������� �� ����� ���� ����� ������ ������ �� ��� �� ������ ���� �� � ����� ������� �� ��) ���� ����� ��� � � ������ ������ ���� �� � ����� ���� ,�� ���� ��� ����� (
�� �) ��� ����� ������ ���� ��� ���� ����� ��� �12 � �� ��� ���� � ���� ����� , ��� ����� � ( �� � � ������� ���� �����12 ���� �) ��� �� �� ���� �� ������26 �����2013.( �� ������
.������ � �� ��� �� � �� �� ����� ���� ���� ���
."�� ���"� ����� � ����� ��� �� � �������� ����� ������� ���� ������ �������
���� ��� ,����� ��� ���� ����� �� ���� ������ �����7 .�� ���� ����� ���� ������
�� ������ ���� ������������ ����� ���� ���� ������ �� ���� �� ������� ���� � ����� �� ,��."�� ���"� ������ ����� ���� ��
���2 - ����� ����� ����� ����� ����� ������ ������� �������� �����
����� �� ������� ���� �� ����� ����� ��� ,�� ����� �� ���� � �� ������ ������� ���� �� ���� ��� ����� � ���31 ���� �2012.
���3 - ��� ����� ������� ������� ����� ���� ��� �������� ����� ,
������ ���6 ,7 �- 9 ������ ���� ������ �����.�� ����
� ��� ���������������������� ������� ������ �������� ���� ���������
������� �� ������� ���� �������� �� ���� ��� ������ ��� ����� �����38�)�:(
�� ��� ���������� ��� ������ ��� ����� ����� �� ������� ���� �������� �� ����38�:(�)
��������� � ������ ,����� �) ����� ���1960:����) �"�� ( " �����(" ������ ,. ����� ������ ��� ����� ���� � �� ���� ����� ���� � ���������� �������
:�� ����� ���� ,�� �����
1..�"�� ,����� ���2. �"�� ,��� ����Habas Star B.V..3..����� �"��� ,����� ��4..������� ���� �"��� ,���� �� 5.���� ��� - ���� ����� ����� ,�� ����� �����.
���� �� , ����� ������� ����� ����� ����� ������ ��� ����� ���� � �� ����� ���� �� ����� �� ����� ���� �� � �� �� ,������ ��� �� ������ �"���� �"��� � ��
, ����� ��������� ������ ,�������������� ���� � �� �� ������� ������� ���� ����� ���� � ����� � ����� � �� �� ������� ,�� � ������� ����� ���� � �����
, ���� ,��� �� � ������ �� �� ����� ��� ���� � ������� ������� ���� ��� �� �����.�� �
� ����� � �� �� ������ ���� ����� ����� ,��� ��� ,����� ������ �����
� ���� ��� �� ������ �"����� ,�"��� ����� , ����� ����� ������ ��� ,����� ����� ������� ,������ ���� ������ ���� ���� � � ���� ,������� �� ����� �� �����
.������ ��� �
���� � ���� ��� ������ ��� ����� ���� � �� ����� ���� ,�� ������ ������� ��.����� �� ���� ���� � � �� ���� �� ������ ���� ����� ������
�� ���� �� � ���� �� ������ ��� ����� ���� � �� ������ ����� ��������� �� ���� ���� ������ ������31 ���� � 2012 �� �" :����)��� ������ ����� �� �
("������,��� ��������� � ������ ,�� ����� �� ������ . ����� ������ ����� �� �� ���� ,����� ������ ����� �� ����� ����� ����� ����� ��������� �31 ���� �2012
���.��������
� ���� �� � ,�� ���� ��� �� ��������� � ������ �� ����� �� ���� � ��� � � ��� �� ����� ���������� � ����� ������ ,��� ����� ������ �� � ����� � �����
������ ������.
���� �� � ,������ �� ������ ����� � ���������� ����� �� � ����� ������ ������������ ,������� �� � �� ���� ��� �� ����� ��������� �� ����� ���� ,����� ������ ��� ��������.

2
��� ��� ���� ��� �����38�)( )1(
������ �����
��������� ����
,������� ���:�� ����� , 1. �� ���� ������ �� �� ) ����� ���1960" :����) �"�� ( ������ (" ���������� �
�2013 .("���� �" :����)
2. ��� �� ��� �� ������ ��� ���� � ,���� � ��� � ��� ��� ��� ��� ������ � ��� � � ��� �� ,����� ���� ���� ��� ������ ���� ,��� ���� ������ � � ���� ������
���� ���.���� � ������ ������� ��
3. ��� ,��� ����� ����� ���� � ����� ��� ���� � ��� ������� ���� � ,���� � ����������� ������, � ���� �� ����� � ������� ������� ������� ������ ,����
.���� � �������� ����� �������� ��������
4. � ����� ����� ����� ������ ����� ��������� � ,� ����� ������� �� ������� ���� � �� ������� ����� ���� � �� ������ ����� ���� ����� ��� �� ������ �� ������ , ��:����
�. � ������� �� ������� �������� ������� ��������� �������� �� �� �� ���� ����� ���� ����� ������� ������ ��� ����� ���� � �� ������ �����
� ������ ����� ����� �� � ����� ���� � �� �� ��� � �� ���� , ��� ,������ ���� ����� ���� � ������� ������ ;�� � ������� ����� ������� ���� -
�. ����� �� ,������ ��� ���� ������ ��� ,����� ������� ��� �� ���� �� ���� ����� ������ ���� ��� � ����� �� ��� ������� �� ������ �� ����
.������ ��� ����� ���� �
5.: ����� ����� �� �� �� �� ,���.���� ����� ,����� ����� � ������ ��� ������ ������ ��� �� �� ,����� �
������� ����� � �� ������ �� ������ ���� �� �� ���� ����� ����� , �"�� ,(���� ������ ���� ) ��� ����� ����� ��� ���- 2010 ���� �� ���� ,
����� � � �� ����� � ���� ,�� ����� ������� ;���� � � ���� ����� �������-
�.����� ��� ������ ������ ��� �� �� ,����� ����� ������ ,����� ����� � ������� ���� � ���� ����� ���� � ������ �� ���� ����� ������ �� �����
,�� � ������� ����� ����� ;������� ������ ����� ������.�� ���� ���� �� �� ����� �� ���� �� ����� ������ ��� ��� �� � ������
,���������� ��� �� �� ,�� � �� � � ��� �� ���� ���������� ������ ���� ���������� ����� ������ �� ���� � ����� ��� ������ � �����.
�� ,��� � � �� ������� �� �������� ����� � � ���� ����� ��� .�� �� ��
72 ���� 3201 ������ �����
����� ��� ,���� ���

3
���������� ����� ����� ���� �� ��� ��� ������38�)( )2(
������ ����� �������� ���� ���� ����� ���� ������
:�� ����� ,����� �� ,��
1.� ���� � ������ ������ ���� � ����� ���� ����� � ��� ��� ����� ������� ���� �
� ) ����� ���1960" :����) �"�� ( ������ (" ���������� � �2013 :����)���� �" ������ ������.("
2. ������� ���� � ,���� � ��� ����� ���� � ����� ���� ����� � ���� ������������
���� ������ � ��� � ��� ��� ��� ��� ������ � ��� � ��� �� ��� �� ������ ���� ������ ���� ,��� ���� ������ � ���� ���� �� ,����� ���� ���� �� ������� ��
.���� � ������
3. ������� ���� � ,���� � ��� ����� ���� � ����� ��� ���� � ��������� ������ ������� ������� ������ ,����� ���� �� �������� ������ ��� ,��� ����� �����
� ������� ����� .���� � �������� ����� �������� ��������
4. � ����� ����� ����� ������ ����� ,��������� � � ����� ������� �� ������� ���� � � ������ �� ������ �� ������ ,��� �� ��� ����� ���� � �� ������ ����� ���� ��
:�������. � ������� �� ������� �������� ������� ��������� �������� �� ��
������ ��� ����� ���� � �� ������ ����� ������� ���� � ������� ��� ��� ,���� � ����� ���� ����� � ���� ����� ������ ������, ������ ���� ����� �
� ������ �� ���� ������ ���� ���� � �� �� ��� � �� ���� , ��� ,����� ����� ������� ���� � ���� ����� ���� � ������� ��� ����� �� � �����
��� ;�� � ������� - �. ����� �� ,������ ��� ���� ������ ��� ,����� ������� ��� �� ���� �� ��
��� �� ������ ����� ������ ���� ��� � ����� �� ��� ������� �� ���;������ ��� ����� ���� �
5. ����� �� �� �� �� ,�� �����:�. ������ ������ ��� �� �� ,����� ����� ����������� ��� ,����� ����� �
������� ����� � �� ������ �� ������ ���� ����� ����� , �� ������ �"�� ,(���� ������ ���� ) ��� ����� ����� ��� ���- 2010 ���� �� ���� ,
����� � � ��� ���� ;���� � � ���� ����� ����� ���� ,�� ����� ����������-
�. ,����� ����� � ������ ��� ������ ������ ��� �� �� ,����� ����� ������� ������ �� ����� ������� ���� � ���� ����� ���� � ������ �� ���� ���,�� � ������� ����� ����� ;������� ������ ����� �����
�.�� ���� ���� �� �� ����� �� ���� �� ����� ������ ��� ��� �� � ������ ,���������� ��� �� ��, � ���� � �� ���� ����� ������� ���� � ������� ��
������ ������ ���� � ����� �� � �� � � ���,������� , �� ���� ���������� ������ ���� ���������� ����� ������ �� ���� � ����� ��� ������ � � ����.
.�� �� �� �� ,��� � � �� ������� �� �������� ����� � � ���� ����� ��� 72 ����, 3201
������ ����� ,����� ���"��� �����