
Epinor presentation 24.09.2015.
21
24/09/2015 1 To explain or to predict Kathrine Frey Frøslie, statistician, PhD Norwegian advisory unit for women’s health, Oslo university hospital Oslo Centre for Biostatistics and Epidemiology, University of Oslo Overview Epidemiology The research process Aim vs statistical methods Regression analysis To explain or to predict: Explain Mechanisms Causality DAGs Exposure & outcome Confounder, Mediator, Collider Direct and indirect effects To explain or to predict: Predict Diagnostic tests, Forecasting Personalized medicine Statistical learning, big data, black box Prediction error: Bias vs variance Constructing a predictor Thom R. Prédire N’est Pas Expliquer (1991) Shmueli G. To explain or to predict (2010) Abdelnoor M, Sandven I: Etiologisk versus prognostisk strategi i klinisk epidemiologisk forskning (2006) EPIDEMIOLOGY The study of the occurrence and distribution of health-related states or events in specified populations, including the study of DETERMINANTS influencing such states, and the application of this knowledge to control the health problems. Study includes surveillance, observation, hypothesis testing, analytic research, and experiments. Distribution refers to analysis by time, place, classes or subgroups of persons affected in a population or in a society. Determinants are all the physical, biological, social, cultural, economic and behavioral factors that influence health. Health-related states and events include diseases, causes of death, behaviors, reactions to preventive programs, and provision and use of health services. Specified populations are those with common identifiable characteristics. Application… to control… makes explicit the aim of epidemiology – to promote, protect, and restore health. The primary “knowledge object” of epidemiology as a scientific discipline are causes of health-related events in populations. In the last 70 years, the definition has broadened from concern with communicable disease epidemics to take in all processes and phenomena related to health in populations. Therefore epidemiology is much more than a branch of medicine treating epidemics. Porta M: A Dictionary of Epidemiology, Fifth Edition, 2008 John Snow, 1854 “To summarize, it is not reasonable, in our view, to attribute the results to any special selection of cases or to bias in recording. In other words, it must be concluded that there is a real association between carcinoma of the lung and smoking.” “...it is concluded that smoking is an important factor in the cause of carcinoma of the lung.” DOLL R, HILL AB. Smoking and carcinoma of the lung. BMJ 1950;4682:739-748.
Transcript of Epinor presentation 24.09.2015.

24/09/2015
1
To explain or to predict
Kathrine Frey Frøslie, statistician, PhD
Norwegian advisory unit for women’s health, Oslo university hospital
Oslo Centre for Biostatistics and Epidemiology, University of Oslo
Overview
EpidemiologyThe research processAim vs statistical methodsRegression analysis
To explain or to predict: Explain MechanismsCausalityDAGsExposure & outcomeConfounder, Mediator, ColliderDirect and indirect effects
To explain or to predict: Predict Diagnostic tests, ForecastingPersonalized medicineStatistical learning, big data, black boxPrediction error: Bias vs varianceConstructing a predictor
Thom R. Prédire N’est Pas Expliquer (1991)
Shmueli G. To explain or to predict (2010)
Abdelnoor M, Sandven I: Etiologisk versus prognostisk strategi i klinisk epidemiologisk forskning (2006)
EPIDEMIOLOGYThe study of the occurrence and distribution of health-related states or events in
specified populations, including the study of DETERMINANTS influencing such states,
and the application of this knowledge to control the health problems.
Study includes surveillance, observation, hypothesis testing, analytic research, and
experiments. Distribution refers to analysis by time, place, classes or subgroups of
persons affected in a population or in a society. Determinants are all the physical,
biological, social, cultural, economic and behavioral factors that influence health.
Health-related states and events include diseases, causes of death, behaviors,
reactions to preventive programs, and provision and use of health services. Specified
populations are those with common identifiable characteristics. Application… to
control… makes explicit the aim of epidemiology – to promote, protect, and restore
health.
The primary “knowledge object” of epidemiology as a scientific discipline are causes of health-related events in populations. In the last 70 years, the definition
has broadened from concern with communicable disease epidemics to take in all
processes and phenomena related to health in populations. Therefore epidemiology
is much more than a branch of medicine treating epidemics.
Porta M: A Dictionary of Epidemiology, Fifth Edition, 2008
John Snow, 1854
“To summarize, it is not reasonable, in our view, to attribute the results to any special selection of cases or to bias in recording. In other words, it must be concluded that there is a real association between carcinoma of the lung and smoking.”
“...it is concluded that smoking is an important factor in the cause of carcinoma of the lung.”
DOLL R, HILL AB. Smoking and carcinoma of the lung. BMJ 1950;4682:739-748.

24/09/2015
2
Ill: Åshild Irgens
Marit B Veierød, 2015: Melanoma incidence on the ri se again
APPLIED EPIDEMIOLOGYThe application and evaluation of epidemiological knowledge and methods (e.g. in
public health or in health care). It includes applications of etiological research,
priority setting and evaluation of health care programs, policies, technologies, and
services. It is epidemiological practice aimed at protecting and/or improving the
health of a defined population. It usually involves identifying and investigating health
problems, MONITORING changes in health status, and/or evaluating the outcomes of interventions. It is generally conducted in a time frame determined by the need to
protect the health of an exposed population and an administrative context that
results in public health action. See also FIELD EPIDEMIOLOGY*; HOSPITAL
EPIDEMIOLOGY**.
Porta M: A Dictionary of Epidemiology, Fifth Edition, 2008
Problem of interest
Aim
Main outcomeDesign
Statistical analysis
Categorical
Lung
cancer
Continuous
Blood
glucose
Censored
Life
time
Experimental
RCT
Observational
Case-Control
Cohort
Regression analyses
REGRESSION ANALYSISGiven data on a regressand (dependent variable) y and one or more regressors
(covariates or independent variables) x1, x2, etc., regression analysis involves finding a mathematical model (within some restricted class of models) that adequately describes y as a function of the x’s, or that predicts y from the x’s. The most
common form of model for an unbounded continuous y is a linear model; the logistic
and proportional hazards models are the most common forms used when y is binary
or a survival time, respectively.
Porta M: A Dictionary of Epidemiology, Fifth Edition, 2008
Regressand Regressor
Response Explanatory variable
Dependent variable
y
Independent variable
x
Outcome Covariate
Output
Endogenous variable
⁞
Predictor
Determinant
Exogenous variable
⁞
Response
Continuous
Ex Birth weight
Categorical
Ex Lung cancer/no lung cancer
Ex 3 different types of lung cancer
Ex 3 different stages of lung cancer
Survival (Censored)
Common regression model
Linear
Logistic
Binary logisticNominal logisticOrdinal logistic
Cox

24/09/2015
3
ε+++++= 443322110 xBxBxBxBBy
The price of a used car: ydepends on
Age, Mileage, Size, Brand, Colour, Rust,…
Linear function
ε+++++= 5442
3322110 ln xxBxBxBxBBy
Generalised linear function
The price of a used car: ydepends on
Age, Mileage, Size, Brand, Colour, Rust,…
ε+++++= 5442
3322110 ln)( xxBxBxBxBByg
Linear function
WHAT IS YOUR RESEARCH QUESTION? (AIM?) Write your aim in one sentence.
WHAT IS YOUR DESIGN?
WHAT IS YOUR OUTCOME?
HOW WOULD YOU DO A REGRESSION ANAYSIS ON YOUR DATA?
To explain
Understanding
Mechanisms
Expert knowledge
What is the best estimate for the association between the main exposure and the main outcome?
Etiology
Causality
CAUSALITYThe relating of causes to the effects they produce. The property of being causal. The
presence of cause. Ideas about the nature of the relations of cause and effect. The
potential for changing an outcome (the effect) by changing the antecedent (the
cause).
Most of clinical, epidemiological, and public health research concerns causality. In
the health and life sciences, causality is often established by integration of biological,
clinical, epidemiological, and social evidence, as appropriate to the hypothesis at
stake.
Porta M: A Dictionary of Epidemiology, Fifth Edition, 2008

24/09/2015
4
“Necessary” and/or “sufficient” causes
Examples
Measles virus is necessary and sufficient to cause measles in an unimmunized individual.
Mycobacterium tuberculosis is the necessary cause of tuberculosis, but often is not a sufficient cause without poverty, poor nutrition etc
Smoking is sufficient to cause lung cancer, but not necessary, as lung cancer can also be caused by radon gas, asbestos fibres etc.
Giving a lecture is not necessary to make me stressed, as many other things stress me. Also, it is not sufficient, as I usually enjoy giving lectures. However, sometimes giving a lecture causes stress.
Counterfactual theory
This is the story of what didn’t happen
Det var synd!
Hernán MA, Robins JM (2016). Causal Inference.
‘Any cause of disease will itself have causes. And each of these causes will
have causes, in a theoretically infinite causal chain. Acute myocardial
infarction is caused by (among other things) atherosclerosis of the coronary
arteries, which is caused by (among other things) high plasma cholesterol
concentrations, which is caused by (among other things) a high dietary
intake of fat, which is caused by (among other things) living in 21st century
western society, and so on. In a sense, all diseases have a potentially
infinite set of causes and so can never be completely understood.’
Coggon D, Martyn C. Time and chance: the stochastic nature of disease causation.
Lancet 2005;365:1434-1437.
The infinite causal chain
Causality
What is causality?
The Counterfactual concept
Interventions and causality
Consequences of actions
Philosophicbackground
Ultimate goal: Action!

24/09/2015
5
Implantation of
blastocysts from RAG-
deficient mice into
pseudo-pregnant mothers
results in the
development of viable
mice that lack mature B
and T cells. However, if
normal embryonic stem
(ES) cells are injected into
RAG-deficient blastocysts,
somatic chimaeras are
formed, which develop
mature B and T cells.

24/09/2015
6
Problem of interest
Aim
Main outcomeDesign
Statistical analysis
Categorical
Lung
cancer
Continuous
Blood
glucose
Censored
Life
time
Experimental
RCT
Observational
Case-Control
Cohort
Regression analyses
Problem of interest
Aim
Main outcomeDesign
Statistical analysis
Categorical
Lung
cancer
Continuous
Blood
glucose
Censored
Life
time
Experimental
RCT
Observational
Case-Control
Cohort
Regression analyses
Based on expert knowledge of the topic under investigation, we want to estimate the association between an exposure and an outcome as unbiasedly as possible.
Knowledge of the topic makes it plausible that the estimated association can be interpreted as an effect, i. e. causal, i.e. as a quantification of mechanisms.
The expert knowledge about the topic is formalised in a graph of the variables studied, a Directed Acyclic Graph (DAG).
In a DAG, one variable is defined as the main outcome, and one variable is defined as the main exposure.
Expert knowledge is used to define other variables as either a confounder, a mediator, or a collider.
DIRECTED ACYCLIC GRAPH (DAG)See CAUSAL DIAGRAM.
CAUSAL DIAGRAM (Syn: causal graph, path diagram) A graphical display of causal relations among
variables, in which each variable is assigned a fixed location on the graph (called a
node) and in which each direct causal effect of one variable on another is
represented by an arrow with its tail at the cause and its head at the effect. Direct
noncausal associations are usually represented by lines without arrowheads.
Graphs with only directed arrows (in which all direct associations are causal) are
called directed graphs.
Graphs in which no variable can affect itself (no feedback loop) are called acyclic.
Algorithms have been developed to determine from causal diagrams which sets of
variables are sufficient to control for confounding, and for when control of variables
leads to bias.
Porta M: A Dictionary of Epidemiology, Fifth Edition, 2008
RE RE
Exposure and response
RE RE RE
Confounder, mediator, collider

24/09/2015
7
RE RE RE
Confounder, mediator, collider
Confounder ColliderMediator
Note: The presence of either of these may affect the association of interest. Hence, including either of these in regression analyses may change effectestimates.
Confounding
Confounding is bias of the estimated effect of an exposure on an outcome due to the presence of a common cause of the exposure and the outcome.
Important in observational designs. May lead to underestimation, overestimation, or even change the sign of the estimated effect.
A confounder is a variable that is associated with the outcome (either as a cause or a proxy for a cause, but not as an effect of the disease), associated with the exposure, and not an effect of the exposure. The definition of confounding may also include bias due to baseline differences in exposure groups in the risk factor for the outcome, although this may be considered as selection bias.
Confounding can be reduced by proper adjustment. Exploring data is not sufficient to identify whether a variable is a confounder, and such evaluation of confounding may lead to bias. Other evidence like pathophysiological and clinical knowledge and external data is needed. DAGs are useful tools when considering confounding variables.
Ex: Shopping time vs estradiol level. Simulated data.

24/09/2015
8
Ex: Shopping time vs estradiol level. Simulated data.
FemalesMales
Ex: Shopping time vs estradiol level. Simulated data.
Ex: Shopping time vs estradiol level. Simulated data.
FemalesMales
ShoppingEstradiollevels
HoursFrequencyIntensity
Sex
Confounder:Sex or gender?
Biomarker
Mediator
In contrast to the confounder, a mediator represents a step in the causal pathway between the exposure and the outcome.
Such a variable will also be associated with both the exposure and the outcome.
Example: Mediators between maternal BMI and birth weight
Path diagram showing a decomposition of the hypothesized effect of early pregnancy BMI on birth weight. The indirect pathways between BMI and birth weight were hypothesized to be mediated by fasting glucose (nutrient availability), the interleukins IL-1Ra or IL-6 or a combination of these.
Friis et al. The interleukins IL-6 and IL-1Ra: a mediating role in the associations between BMI and birth weight?

24/09/2015
9
Direct effects and indirect effects
Depends on the level of explanation. When available knowledgeallows for it, a direct effect may be split into components, i.e. indirect effects via mediators.
Example: Mediators between maternal BMI and birth weight
Path diagram showing a decomposition of the hypothesized effect of early pregnancy BMI on birth weight. The indirect pathways between BMI and birth weight were hypothesized to be mediated by fasting glucose (nutrient availability), the interleukins IL-1Ra or IL-6 or a combination of these.
Friis et al. The interleukins IL-6 and IL-1Ra: a mediating role in the associations between BMI and birth weight?
Decomposition of the total effect of maternal BMI on birth weight. The total effect is the sum of all arrows, that is, the direct and indirect effects. The arrow widths represent the relative proportions of the total effect through a specific pathway.
COLLIDERA variable directly affected by two or more other variables in the causal diagram.
Porta M: A Dictionary of Epidemiology, Fifth Edition, 2008
Ex: Post-traumatic stress after terror attack. Simulated data.
Grouped after length of hospital stay:
> 2 weeks< 2 weeks
Ex: Post-traumatic stress after terror attack. Simulated data.

24/09/2015
10
Ex: Post-traumatic stress after terror attack. Simulated data.
Grouped after length of hospital stay:
> 2 weeks< 2 weeks
RE RE RE
Confounder, mediator, collider
Confounder ColliderMediator
Note: The presence of either of these may affect the association of interest. Hence, including either of these in regression analyses may change effectestimates.
> 2 weeks< 2 weeks
FemalesMales
Confounder. Correct to adjust
Only expert knowledge can tell us what to do
> 2 weeks< 2 weeks
FemalesMales
Collider. Wrong to adjust
Regression analysis recipe (kind of)
When the ultimate goal is to understand mechanisms, and to estimateassociations between an exposure and an outcome as unbiasedly as possible:
Use expert knowledge to identify exposure & outcome, confounders, colliders & mediators. Use DAGs to clarify and communicate.
Find the crude association between exposure and outcome
Measured variables:Adjust for confoundersDo not adjust for collidersSometimes adjust for mediators
Unmeasured variables:Sensitivity analysis
Alas, real world may not be so simple.
Alas, real world may not be so simple:
Expert knowledge may be lacking or inconclusive, regarding whichvariables and arrows to include or leave out in the DAG.
Additional variables may come into consideration as confounderse.g. for indirect effects, resulting in a very complex DAG.
It may be hard to tell (based on present knowledge) the directionof a causal effect, e.g. whether a variable is a confounder or a mediator, or a mediator or a collider.
Feed-back may be of concern.
Time-dependent covariates may exist.

24/09/2015
11
Topics not covered
Inverse probability weighting
Dynamic path analysisTime-dependent confoundersMarginal structural models
Latent variables Structural equation modelling
Background: There is an association between giving birth to a large baby, and subsequent maternal diabetes.
Draw a DAG that can clarify potential mechanisms behind thisassociation.
Discussion exercises
BackgroundIt is controversial whether maternal hyperglycemia less severe than that in diabetes
mellitus is associated with increased risks of adverse pregnancy outcomes.
Hyperglycemia and Adverse Pregnancy OutcomesThe HAPO Study Cooperative Research Group
N Engl J Med 2008;358:1991-2002
MethodsA total of 25,505 pregnant women underwent 75-g oral glucose-tolerance testing at
24 to 32 weeks of gestation. Data remained blinded if the fasting plasma glucose
level was <5.8 mmol/l and the 2-hour plasma glucose level was <11.1 mmol/l.
Primary outcomes: Birth weight above the 90th percentile for gestational age,
primary cesarean delivery, clinically diagnosed neonatal hypoglycemia, and cord-
blood serum C-peptide level above the 90th percentile.
For continuous-variable analyses, odds ratios were calculated for a 1-SD increase
in fasting, 1-hour, and 2-hour plasma glucose levels. As prespecified, to assess
whether the log of the odds of each outcome was linearly related to glucose
level, we added squared terms for glucose level for each adverse pregnancy
outcome to assess whether there were significant quadratic associations.
For each outcome, two logistic models were fit.
Model I included adjustment for center or the variables used in estimating the
90th percentile for birth weight for gestational age (infant's sex, race or ethnic
group, center, and parity).
For associations of glycemia with primary outcomes, each glucose measurement
was considered as both a categorical and a continuous variable in multiple logistic-
regression analyses. For categorical analyses, each measure of glycemia was divided
into seven categories, such that the 1- and 2-hour plasma glucose measures
reflected data for approximately the same number of women in each category as
did the fasting plasma glucose measure.
Model II included adjustment for multiple potential prespecified
confounders, including age, body-mass index (BMI), smoking status, alcohol
use, presence or absence of a family history of diabetes, gestational age at
the oral glucose-tolerance test, sex of the infant, parity (0, 1, or ≥2, except
for primary cesarean deliveries), mean arterial pressure and presence or
absence of hospitalization before delivery (except for preeclampsia), and
presence or absence of a family history of hypertension and maternal
urinary tract infection (for analysis of preeclampsia only). Height was also
included as a potential confounder, on the basis of post hoc findings of an
association with birth weight greater than the 90th percentile, and two
prespecified confounders (maternal urinary tract infection and previous
prenatal death) were excluded from primary and secondary outcome
analyses when neither was found to be related to any primary outcome or to
affect primary outcome–glucose associations.
Only the fully adjusted model results are presented in this report.
Please discuss this approach with your nearest neighbours.
The HAPO Study Cooperative Research Group. N Engl J Med 2008;358:1991-2002.
Frequency of Primary Outcomes across the Glucose Categories.

24/09/2015
12
Background: Physical activity is beneficial to a variety of physiologicalprocesses, including the metabolisation of nutritients. Might there also be positive effects on bone metabolism, as measured by bone mineral density?
Aim: Estimate the association between physical activity and bone mineral density.
Measured variables: Physical activityBMDAge Draw the DAG.
Are there unmeasured variables that should be taken intoconsideration? If so, include them in the DAG.
When studying the association between milk consume and bone mineral density, should one adjust for calcium supplements?
Draw the DAG.
To predict
Does not have to explain/understand mechanisms, as long as it predicts well.
Diagnostic testsEx Diabetes diagnosis
Melanoma screening based on picture and blood samples
Expected devlopment in disease (e.g. prognosis aftersepsis)
Identify high-risk groups/profiles, compute risk scores
Personalised medicine
Diagnostic tests Diagnostic tests

24/09/2015
13
Forecasting
[slide source: Birgitte Freiesleben deBlasio, Oslo Center for Biostatistics and Epidemiology]
Precision medicine
Aim: Tailoring of medical treatment to the individual characteristics, needs, and preferences of a patient during all stages of care, including prevention, diagnosis, treatment, and follow-up.
Provide the right patient with the right drug at the right dose at the right time.
Methods: Diagnostic tests to determine which medical treatments will work best for each patient. Personalized Health Care is based on systems biology and uses predictive tools to evaluate health risks and to design personalized health plans.
Ex Predict a person’s risk for a particular disease, based on one or several genes.
Initiate preventative treatment before the disease presents itself in their patient.
Personalized medicine
Refers to a vast set of tools for modelling and understanding data, i.e. to extract important patterns and trends in complex data sets.
These tools can be classified as supervised or unsupervised. Supervised statistical learning involves building a statistical model for predicting, or estimating, an output based on one or more inputs.
Statistical learning is a recently developed area in statistics and blendswith parallel developments in computer science and, in particular, machinelearning. The field encompasses many methods such as the lasso and sparseregression, classification and regression trees, and boosting and supportvector machines.
With the explosion of “Big Data” problems, statistical learning has becomea very hot field in many scientific areas as well as marketing, finance,and other business disciplines.
Statistical learning

24/09/2015
14
What is inside the black box?
“BLACK BOX”1. A method of reasoning or studying a problem in which the methods and
procedures are not described, explained, or perhaps even understood. Nothing
is stated or inferred about the method; discussion and conclusions relate solely
to the empirical relationships observed.
2. A method of formally relating an input (e.g., quantity of a drug administered,
exposure to a putative causal factor) to an output or an observed effect (e.g.,
amount of the drug eliminated, disease), without making detailed assumptions about the MECHANISMS that have contributed to the transformation of input to
output within the organism (the “black box”).
“BLACK-BOX EPIDEMIOLOGY”A common epidemiological approach, used both in research and in public health
practice, in which the focus is on assessing putative causes and clinical effects
(beneficial or adverse) rather than the underlying biological MECHANISMS. It is not a
formal branch or speciality of epidemiology, nor is it an epidemiological method or
philosophy. Loosely speaking, it is an opposite of MECHANISTIC EPIDEMIOLOGY.
Porta M: A Dictionary of Epidemiology, Fifth Edition, 2008
MECHANISMIn epidemiology and in other health, life and social sciences, the way in which a
particular health-related event or outcome occurs, often described in terms of the
agents and steps involved. Whereas the focus is often on biological mechanisms,
environmental, social, and cultural mechanisms are also relevant to epidemiology,
public health, medicine and related disciplines.
MECHANISTIC EPIDEMIOLOGYEpidemiological research that focuses on MECHANISMS underlying and explaining
associations between DETERMINANTS and health-related events or states. It is not a
formal branch or or speciality of epidemiology, nor is it an epidemiological method or
philosophy. Loosely, the opposite of “BLACK-BOX EPIDEMIOLOGY”. See also APPLIED
EPIDEMIOLOGY.
Porta M: A Dictionary of Epidemiology, Fifth Edition, 2008

24/09/2015
15
The big issue in prediction models:
Prediction error
www.scientificamerican.com
Tota
l po
pu
latio
nin
billio
ns
[slide source: Birgitte Freiesleben deBlasio, Oslo Center for Biostatistics and Epidemiology]
http://www.minitab.com/en-us/Published-Articles/Weather-Forecasts--Just-How-Reliable-Are-They-/
The big issue in prediction models:
Prediction error
The best model = the optimal predictor is theone which minimises the prediction error, i.e. the model that predicts new values (or classifies undiagnosed patients) best possible
24/09/2015
16
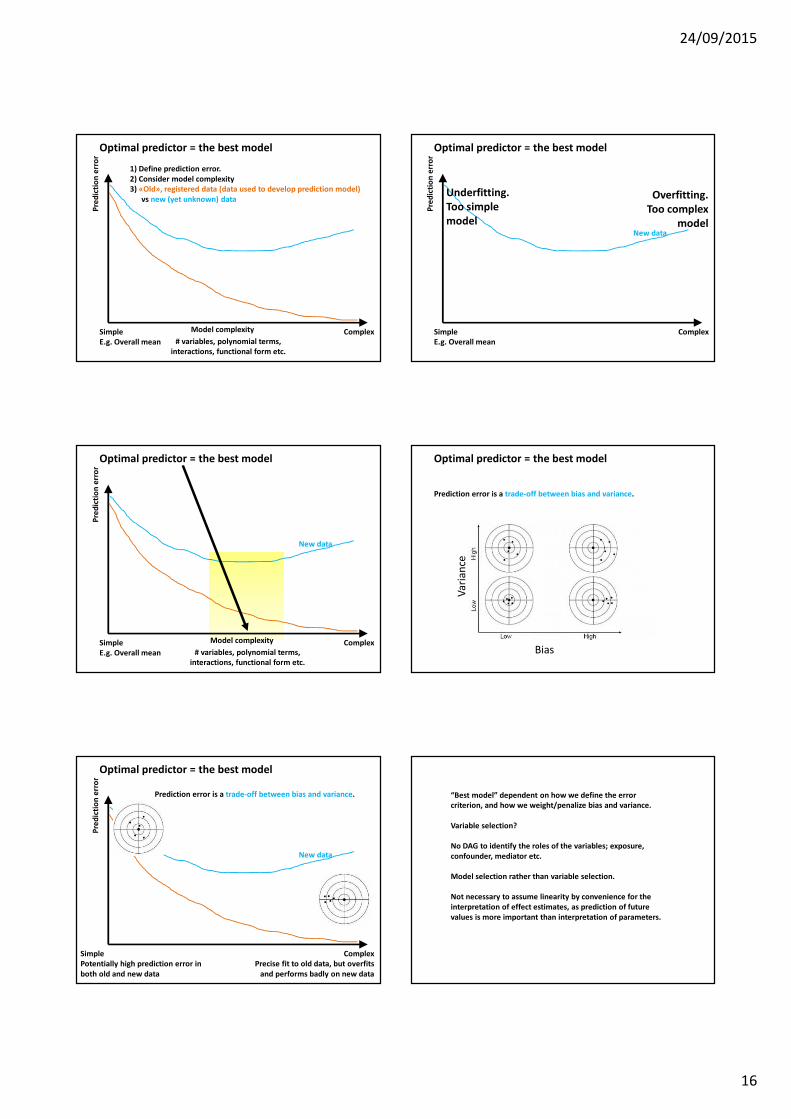
Optimal predictor = the best model
1) Define prediction error. 2) Consider model complexity3) «Old», registered data (data used to develop prediction model)
vs new (yet unknown) data
Model complexity
# variables, polynomial terms, interactions, functional form etc.
ComplexSimpleE.g. Overall mean
Pre
dic
tio
ner
ror
Optimal predictor = the best model
ComplexSimpleE.g. Overall mean
New data
Pre
dic
tio
ner
ror
Underfitting. Too simple model
Overfitting. Too complex
model
Optimal predictor = the best model
ComplexSimpleE.g. Overall mean
New data
Pre
dic
tio
ner
ror
Model complexity
# variables, polynomial terms, interactions, functional form etc.
Optimal predictor = the best model
Prediction error is a trade-off between bias and variance.
Bias
Va
ria
nce
New data
Prediction error is a trade-off between bias and variance.
ComplexPrecise fit to old data, but overfits
and performs badly on new data
SimplePotentially high prediction error in both old and new data
Optimal predictor = the best model
Pre
dic
tio
ner
ror
“Best model” dependent on how we define the error criterion, and how we weight/penalize bias and variance.
Variable selection?
No DAG to identify the roles of the variables; exposure, confounder, mediator etc.
Model selection rather than variable selection.
Not necessary to assume linearity by convenience for the interpretation of effect estimates, as prediction of future values is more important than interpretation of parameters.

24/09/2015
17
Ex2Classification into two classes(toxic/non-toxic) based on twocontinuous predictors x1 and x2
Constructing a predictor/classifier, two simple examples
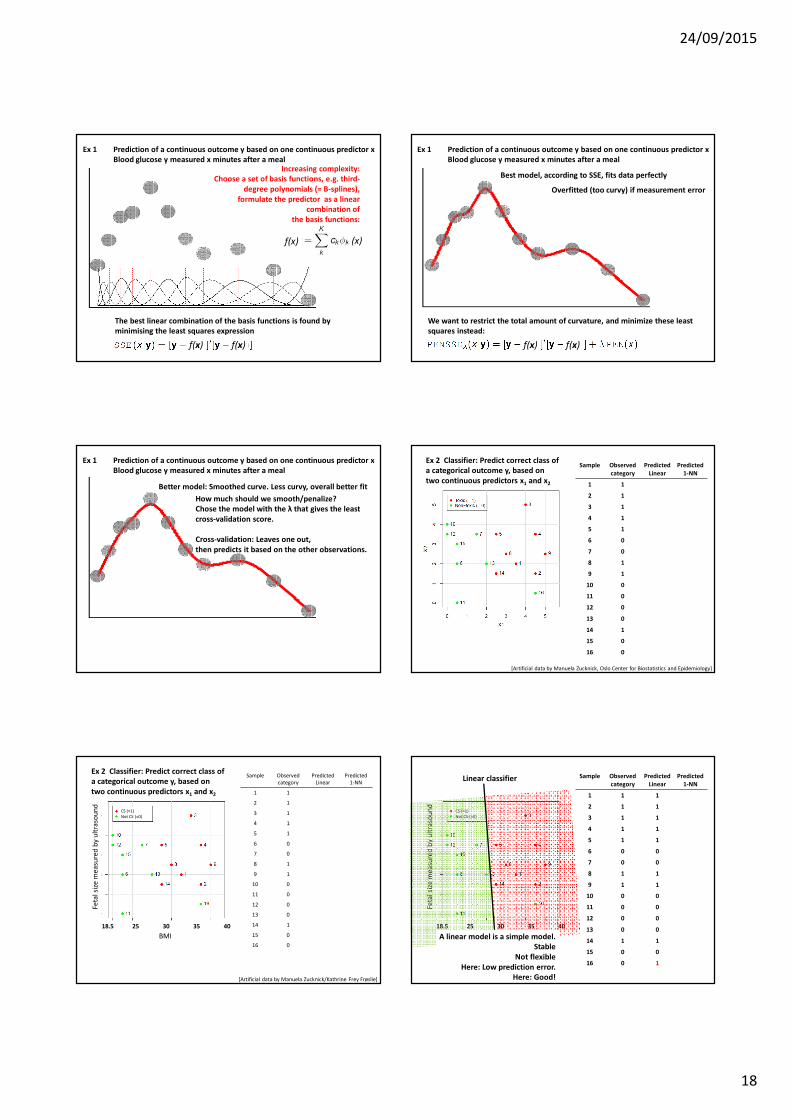
Ex 1Prediction of a continuous outcome y based on one continuous predictor x
y
x
Predictor x
Res
pon
sey
I.e. What response do we expect to getfor a new observation of x?
Ex: What do we expect theblood glucose valueto be 30 mins after a meal?
newobservation
of x
Ex 1 Prediction of a continuous outcome y based on one continuous predictor xBlood glucose y measured x minutes after a meal
First shot: Simple linear model, y= a + bx + e
A linear model is a simple model. Stable
Not flexibleHere: High prediction error
Here: Bad!
Predictor x
Res
pon
sey
Ex 1 Prediction of a continuous outcome y based on one continuous predictor xBlood glucose y measured x minutes after a meal
Slightly more complex: y=a + bt + ct2+e
Predictor x
Res
pon
sey
Ex 1 Prediction of a continuous outcome y based on one continuous predictor xBlood glucose y measured x minutes after a meal
Increasing complexity: y=a + bt + ct2 + dt3+e
Predictor x
Res
pon
sey
Ex 1 Prediction of a continuous outcome y based on one continuous predictor xBlood glucose y measured x minutes after a meal
Predictor x
Res
pon
sey
Increasing complexity: A sum of third-degree polynomials
More flexible
Ex 1 Prediction of a continuous outcome y based on one continuous predictor xBlood glucose y measured x minutes after a meal
24/09/2015
18
The best linear combination of the basis functions is found by minimising the least squares expression
Increasing complexity: Choose a set of basis functions, e.g. third-
degree polynomials (= B-splines), formulate the predictor as a linear
combination ofthe basis functions:
Ex 1 Prediction of a continuous outcome y based on one continuous predictor xBlood glucose y measured x minutes after a meal
f(x)
f(x)f(x)
(x)
Best model, according to SSE, fits data perfectly
We want to restrict the total amount of curvature, and minimize these leastsquares instead:
Overfitted (too curvy) if measurement error
Ex 1 Prediction of a continuous outcome y based on one continuous predictor xBlood glucose y measured x minutes after a meal
f(x)f(x)
Better model: Smoothed curve. Less curvy, overall better fit
How much should we smooth/penalize? Chose the model with the λ that gives the leastcross-validation score.
Cross-validation: Leaves one out, then predicts it based on the other observations.
Ex 1 Prediction of a continuous outcome y based on one continuous predictor xBlood glucose y measured x minutes after a meal
Sample Observedcategory
PredictedLinear
Predicted1-NN
1 1
2 1
3 1
4 1
5 1
6 0
7 0
8 1
9 1
10 0
11 0
12 0
13 0
14 1
15 0
16 0
[Artificial data by Manuela Zucknick, Oslo Center for Biostatistics and Epidemiology]
Ex 2 Classifier: Predict correct class ofa categorical outcome y, based ontwo continuous predictors x1 and x2
Sample Observed
category
Predicted
Linear
Predicted
1-NN
1 1
2 1
3 1
4 1
5 1
6 0
7 0
8 1
9 1
10 0
11 0
12 0
13 0
14 1
15 0
16 0
[Artificial data by Manuela Zucknick/Kathrine Frey Frøslie]
CS (=1)
Not CS (=0)
BMI
18.5 25 30 35 40
Feta
lsi
zem
ea
sure
db
y u
ltra
sou
nd
Ex 2 Classifier: Predict correct class ofa categorical outcome y, based ontwo continuous predictors x1 and x2
Sample Observedcategory
PredictedLinear
Predicted1-NN
1 1 1
2 1 1
3 1 1
4 1 1
5 1 1
6 0 0
7 0 0
8 1 1
9 1 1
10 0 0
11 0 0
12 0 0
13 0 0
14 1 1
15 0 0
16 0 1
Linear classifier
CS (=1)
Not CS (=0)
BMI
18.5 25 30 35 40
Feta
lsi
zem
ea
sure
db
y u
ltra
sou
nd
A linear model is a simple model. Stable
Not flexibleHere: Low prediction error.
Here: Good!

24/09/2015
19
Sample Observedcategory
PredictedLinear
Predicted1-NN
1 1 1
2 1 1
3 1 1
4 1 1
5 1 1
6 0 0
7 0 0
8 1 1
9 1 1
10 0 0
11 0 0
12 0 0
13 0 0
14 1 1
15 0 0
16 0 1
Predict/classify an observation accordingto its nearest neighbour (1-NN)
CS (=1)
Not CS (=0)
BMI
18.5 25 30 35 40
Feta
lsi
zem
ea
sure
db
y u
ltra
sou
nd
Divide the data set into training set (1/3) and test set (2/3)
Leave-one-out cross-validation
K-fold cross-validation
How to obtain prediction error based on new data?
A brilliant tutorial is found at http://www.autonlab.org/tutorials/overfit10.pdf
Cross-validation for detecting and preventing overfittingAndrew W. Moore
“Best” model?
Variable selection(Forward/Backward/stepwise)Akaike’s information criterion (AIC)Bayes’ information criterion (BIC)Focused information criterion (FIC)
Variable shrinkagePCARidge regression cf. Penalization in the curve fitting Lasso
Functional forms of variables? Nonlinear models?
“There are two cultures in the use of statistical modeling to reach conclusions from data. One assumes that the data are generated by a given stochastic data model. The other uses algorithmic models and treats the data mechanism as unknown. The statistical community has been committed to the almost exclusive use of data models. This commitment has led to irrelevant theory, questionable conclusions, and has kept statisticians from working on a large range of interesting current problems. Algorithmic modeling, both in theory and practice, has developed rapidly in fields outside statistics. It can be used both on large complex data sets and as a more accurate and informative alternative to data modeling on smaller data sets. If our goal as a field is to use data to solve problems, then we need to move away from exclusive dependence on data models and adopt a more diverse set of tools.”
Breiman L. Statistical modeling: The two cultures. Statist. Sci. 2001;16:199-231.
What is inside the black box?
Regression analysis comes with a huge toolbox and add-ons.
Different regression tools and different approaches to (regression modelling) must be chosen for different scientific questions, even though the data set in the study «contains several variables to be included in the analysis».

24/09/2015
20
Topics not covered
Model selection(Forward/Backward/stepwise)Akaike’s information criterion (AIC)Bayes’ information criterion (BIC)Focused information criterion (FIC)
Variable shrinkagePCARidge regressionLasso
Cross-validation
What are the main differences betweena regression analysis for the estimation of associations, and a regression analysis for prediction purposes?
Discussion exercises
To explain and to predict
Public health perspective
Using prediction models to construct/improve hypotheses and theories
“Learning causal structures”
Using expert knowledge to improve prediction by incorporating knowledge into prediction models
Take action to improve health
OCBE partner in new SFI The University of Oslo celebrates BIG INSIGHT, our new centre for research based innovation, awarded by the Research Council of Norway.
Leaders of the new SFI centre Big
Insight: Arnoldo Frigessi, Lars Holden,
Kjersti Aas and André Teigland.
UiO headline, November 2014
BIG INSIGHT will produce innovative solutions
for key challenges facing the consortium of
private, public and research partners, by
developing original statistical and machine
learning methodologies. Fulfilling the promise
of the big data revolution, we shall invent deep
analytical tools to extract knowledge from
complex data and deliver BIG INSIGHT.
We shall focus on two central innovation
themes: deeply novel personalised solutions
and sharper predictions of transient behaviours.

24/09/2015
21
References 1/2• Abdelnoor M, Sandven I: Etiologisk versus prognostisk strategi i klinisk epidemiologisk
forskning. Norsk epidemiologi, 2006;16:77-80.
• Benner A, Zucknick M, Hielscher T, Ittrich C, Mansmann U. High-Dimensional Cox
Models: The Choice of Penalty as Part of the Model Building Process. Biometrical
Journal 2010;52:50-69.
• Breiman L. Statistical modeling: The two cultures. Statist. Sci. 2001;16:199-231.
• Fattori E, Cappelletti M, Costa P, et al. Defective inflammatory response in interleukin
6-deficient mice. J Exp Med. 1994; 180:1243–1250.
• Greenland S, Pearl J, Robins JM. Causal diagrams for epidemiologic research.
Epidemiology 1999;10:37-48.
• Hastie, Tibshirani and Friedman. The Elements of Statistical Learning, 2nd ed. Springer,
2009
• Hernan MA, Hernandez-Diaz S, Werler MM, Mitchell AA. Causal knowledge as a
prerequisite for confounding evaluation: An application to birth defects epidemiology.
Am J Epidemiol 2002;155:176-84.
• Hernán MA, Robins JM. Causal Inference. Boca Raton: Chapman & Hall/CRC,
forthcoming 2016. http://www.hsph.harvard.edu/miguel-hernan/causal-inference-
book/
• James G, Witten D, Hastie T, Tibshirani R. An Introduction to Statistical Learning with
Applications in R. Springer, 2014
http://www-bcf.usc.edu/~gareth/ISL/index.html
References 2/2• Janszky I, Ahlbom A, Svensson AC. The Janus face of statistical adjustment: confounder
versus collider. Eur J Epidemiol 2010,25:361-363
• Porta M. A dictionary of epidemiology. 5th ed. New York: Oxford University Press;
2008.
• Rothman KJ, Greenland S, Lash TL. Modern Epidemiology, 3rd ed. Lippincott Williams &
Wilkins; 2008.
• Shmueli G. To explain or to predict. Statist. Sci. 2010;25:289-310.
• Somm E, Cettour-Rose P, Asensio C, et al. Interleukin-1 receptor antagonist is
upregulated during diet-induced obesity and regulates insulin sensitivity in rodents.
Diabetologia. 2006;49, 387–393.
• Steyerberg EW: Clinical Prediction Models. A practical approach to development,
validation and updating. Springer, 2009
• Thom R. Prédire N’est Pas Expliquer, 1991. Translated by Roy Lisker:
http://www.fermentmagazine.org/Stories/Thom/Predire.pdf
• VanderWeele TJ. Explanation in Causal Inference: Methods for Mediation and
Interaction, Oxford University Press, 2015.
• Veierød M, Lydersen S, Laake, (eds.). Medical statistics in clinical and epidemiological
research. Gyldendal Akademisk; 2012.
• Aalen OO, Røysland K, Gran JM, Ledergerber B. Causality, mediation and time: a
dynamic viewpoint. Journal of the Royal Statistical Society: Series A, 2012;175:831-
861.
Thanks to the sweet and smart colleagues at OCBE, who generously shared their slides and knowledge!
Thanks to Valeria Vitelli, Odd Aalen,
https://www.youtube.com/watch?v=e0vj-0imOLw