Entrega Final Modelo Toma de Decisiones
24
TALLER DE CHIP FOOSE LETRA LISTA DE ACTIVIDADES A Pedido de materiales (tapiceria, parabrisas, carburador y bomba de ac B Recibir el material de tapiceria para las fundas de los asientos C Recibir el parabrisas D Recibir el carburador y la bomba de aceite E Retirar las partes cromadas de la carrocería F Retirar la carrocería (puertas, capó, portaequipaje y guardabarros) d G Enviar los guardabarros a hojalateria par su reparación. H Reparar las puertas, el portaequipaje y el capó. I Extraer el motor del chasis J Quitar la herrumbre del bastidor K Rectificar las válvulas del motor L Sustituir el carburador y la bomba de aceite M Volver a cromar las partes cromadas N Reinstalar el motor O Volver a instalar sobre el bastidor las puertas, el capó y el portaeq P Reconstruir la transmisión y volver a colocar los frenos Q Volver a colocar el parabrisas R Volver a instalar los guardabarros S Pintar el automóvil T Volver a tapizar el interior del vehículo U Reinstalar las partes cromadas V Llevar el automóvil a la Exposición
description
TOMA DE DECISONES
Transcript of Entrega Final Modelo Toma de Decisiones
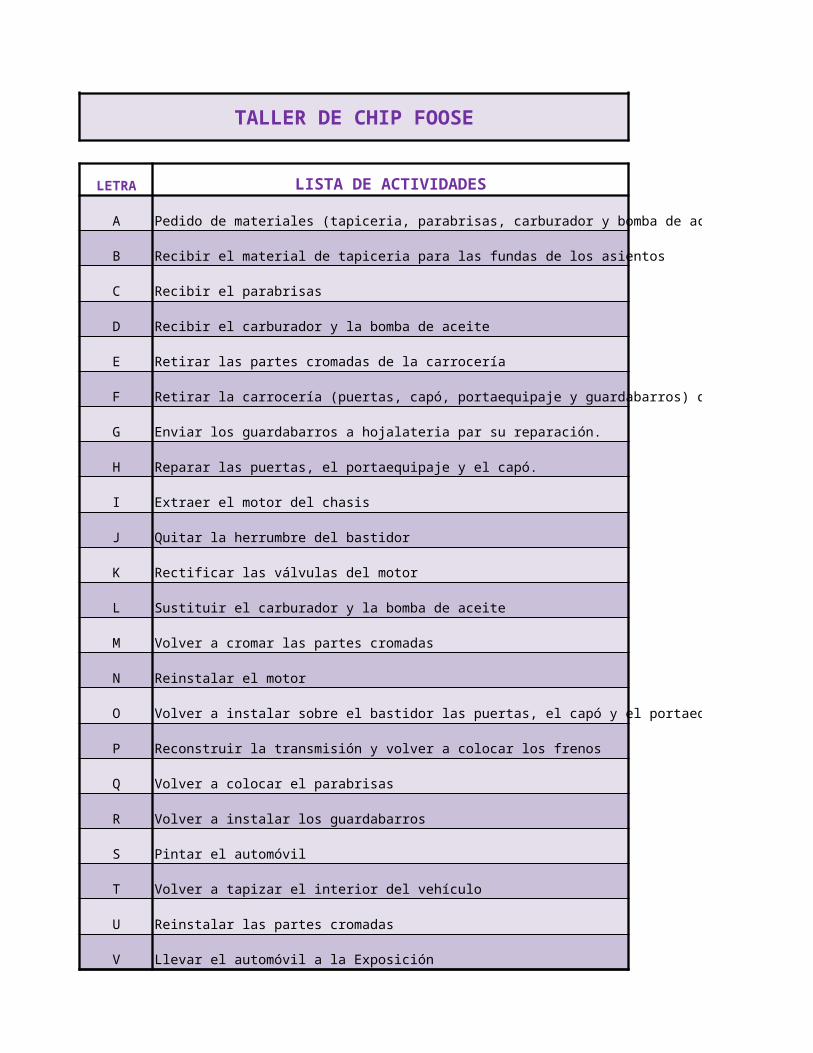
TALLER DE CHIP FOOSE
LETRA LISTA DE ACTIVIDADES
A Pedido de materiales (tapiceria, parabrisas, carburador y bomba de aceite)
B Recibir el material de tapiceria para las fundas de los asientos
C Recibir el parabrisas
D Recibir el carburador y la bomba de aceite
E Retirar las partes cromadas de la carrocería
F Retirar la carrocería (puertas, capó, portaequipaje y guardabarros) del bastidor.
G Enviar los guardabarros a hojalateria par su reparación.
H Reparar las puertas, el portaequipaje y el capó.
I Extraer el motor del chasis
J Quitar la herrumbre del bastidor
K Rectificar las válvulas del motor
L Sustituir el carburador y la bomba de aceite
M Volver a cromar las partes cromadas
N Reinstalar el motor
O Volver a instalar sobre el bastidor las puertas, el capó y el portaequipaje
P Reconstruir la transmisión y volver a colocar los frenos
Q Volver a colocar el parabrisas
R Volver a instalar los guardabarros
S Pintar el automóvil
T Volver a tapizar el interior del vehículo
U Reinstalar las partes cromadas
V Llevar el automóvil a la Exposición
TALLER DE CHIP FOOSE
ACTIVIDAD ACTIVIDAD DESCRIPCION
A 0 A Pedido de materiales (tapiceria, parabrisas, carburador y bomba de aceite)B A B Recibir el material de tapiceria para las fundas de los asientosC A C Recibir el parabrisasD A D Recibir el carburador y la bomba de aceite
E 0 E Retirar las partes cromadas de la carrocería
F E F Retirar la carrocería (puertas, capó, portaequipaje y guardabarros) del bastidor.
G F G Enviar los guardabarros a hojalateria par su reparación.
H F H Reparar las puertas, el portaequipaje y el capó.I F I Extraer el motor del chasisJ I J Quitar la herrumbre del bastidor
K I K Rectificar las válvulas del motorL I - D L Sustituir el carburador y la bomba de aceiteM E M Volver a cromar las partes cromadasN K - L N Reinstalar el motor
O H - J O Volver a instalar sobre el bastidor las puertas, el capó y el portaequipaje
P N -O P Reconstruir la transmisión y volver a colocar los frenosQ C Q Volver a colocar el parabrisasR G - P R Volver a instalar los guardabarros
S R - Q S Pintar el automóvil
T B - S T Volver a tapizar el interior del vehículo
U S - M U Reinstalar las partes cromadas
V T - U V Llevar el automóvil a la Exposición
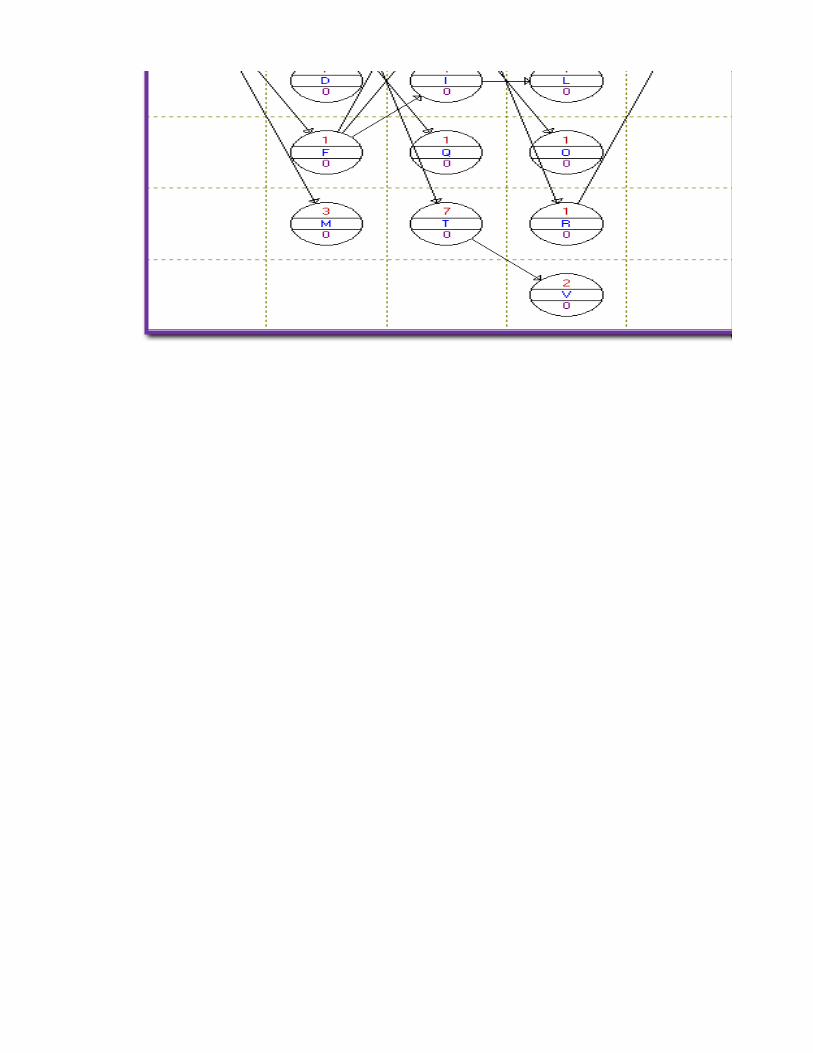
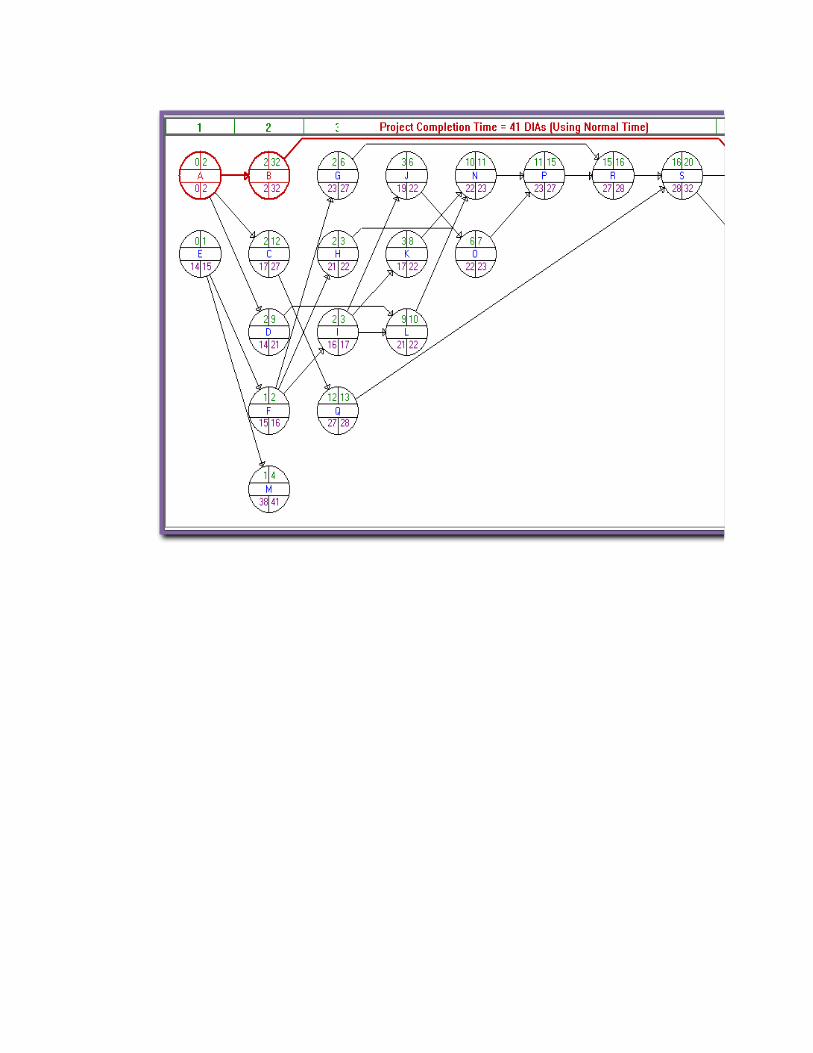
3. Elabore un diagrama de red donde se evidencie las relaciones de precedencia de las actividades de proyecto
2. Elabore en Excel, dado el caso de estudio anterior una tabla en la cual se presenten las diversas actividades de este proyecto, asignando una letra a cada actividad con sus estimaciones de tiempo y las relaciones de precedencia a partir de las cuales construirá usted el diagrama de red.
ACTIVIDADES PRECEDENTES

DIAS
0 1 2 5A 25 30 35A 8 10 14A 6 7 10
0 1 1 2
E 1 1 2
F 2 4 5
F 1 1 2F 1 1 2I 1 3 6
I 3 5 6I D 1 1 2E 3 3 5K L 1 1 2
H J 1 1 2
N O 3 4 6C 1 1 1G P 1 1 1
R Q 2 4 5
B S 5 7 10
S M 1 1 2
T U 2 2 2
3. Elabore un diagrama de red donde se evidencie las relaciones de precedencia de las actividades de proyecto
ACTIVIDADES PRECEDENTES
Tiempo Optimista
Tiempo Normal
Tiempo Pesimista

TIEMPO DE INICIO
ACTIVIDAD Te
A 1 2 5 2.333 0.0 0.0B A 25 30 35 30.000 2.3 2.0C A 8 10 14 10.333 2.3 16.9D A 6 7 10 7.333 2.3 13.9E 1 1 2 1.167 0.0 13.8F E 1 1 2 1.167 1.2 14.8G F 2 4 5 3.833 2.3 23.2H F 1 1 2 1.167 2.3 20.8I F 1 1 2 1.167 2.3 15.8
J I 1 3 6 3.167 3.5 19.0
K I 3 5 6 4.833 3.5 17.2
L I D 1 1 2 1.167 9.7 21.2
M E 3 3 5 3.333 1.2 34.7
N K L 1 1 2 1.167 10.8 21.8
O H J 1 1 2 1.167 6.7 21.8
P N O 3 4 6 4.167 12.0 22.8
Q C 1 1 1 1.000 12.7 27.0
R G P 1 1 1 1.000 16.2 27.0
S R Q 2 4 5 3.833 17.2 28.2
T B S 5 7 10 7.167 32.3 31.8
U S M 1 1 2 1.167 21.0 37.8
V T U 2 2 2 2.000 39.5 39.0
DURACION TOTAL = 41 DIAS
RUTAS CRITICAS = 1
5. Indique que actividades son críticas en el sentido que deben ser terminadas exactamente como fueron programadas, a fin de cumplir el objetivo
RUTA CRITICA
ACTIVIDAD Te
A 1 2 5 2.333 0 0
B A 25 30 35 30.000 2 2
T B S 5 7 10 7.167 32 32
V T U 2 2 2 2.000 39 39
4. Desarrolle un modelo en Excel (formulado) que muestre los cálculos para tiempos de inicios más próximos, tiempo de terminación más próximo, tiempo de inicio más lejano, tiempo de terminación más lejano, la holgura y ruta crítica, de acuerdo a los datos dados anteriormente, pero si se cambian los tiempos de duración dados inicialmente el modelo debe mostrar estos cambios en la ruta crítica y en los cálculos de tiempos.
6.Cuanto tiempo pueden retrasarse las actividades no críticas, antes de que se incurra en un retraso en la fecha de terminación general? Rta en amarillo señalamos actividades con menor holgura que se podrian volver uan nueva Ruta Critica.
ACTIVIDADES PRECEDENTES
Tiempo Optimista
Tiempo Normal
Tiempo Pesimista
Tiempo mas cercano
Tiempo mas lejano
ACTIVIDADES PRECEDENTES
Tiempo Optimista
Tiempo Normal
Tiempo Pesimista
Tiempo mas cercano
Tiempo mas lejano

TIEMPO TERMINADO
Holgura Ruta Critica
2.3 2.3 0.0 SI32.0 32.0 0.0 SI12.7 27.2 14.53 NO9.7 21.2 11.5 NO1.2 15.0 13.8 NO2.3 16.0 13.7 NO6.2 27.0 20.8 NO3.5 22.0 18.5 NO3.5 17.0 13.5 NO
6.7 22.2 15.5 NO
8.3 22.0 13.7 NO
10.8 22.4 11.6 NO
4.5 38.0 33.5 NO
12.0 23.0 11.0 NO
7.8 23.0 15.2 NO
16.2 27.0 10.8 NO
13.7 28.0 14.3 NO
17.2 28.0 10.8 NO
21.0 32.0 11.0 NO
39.0 39.0 0.0 SI
22.2 39.0 16.8 NO
41.0 41.0 0.0 SI
5. Indique que actividades son críticas en el sentido que deben ser terminadas exactamente como fueron programadas, a fin de cumplir el objetivo
Holgura Ruta Critica
2 2 0 SI
32 32 0 SI
39 39 0 SI
41 41 0 SI
Desarrolle un modelo en Excel (formulado) que muestre los cálculos para tiempos de inicios más próximos, tiempo de terminación más próximo, tiempo de inicio más lejano, tiempo de terminación más lejano, la holgura y ruta crítica, de acuerdo a los datos dados anteriormente, pero si se cambian los tiempos de duración dados inicialmente el modelo
6.Cuanto tiempo pueden retrasarse las actividades no críticas, antes de que se incurra en un retraso en la fecha de terminación general? Rta en amarillo señalamos
Tiempo mas
cercano
Tiempo mas lejano
Tiempo mas
cercano
Tiempo mas lejano


TIEMPO DE INICIO TIEMPO TERMINADO
ACTIVIDAD
A 1 2 5 2.333 0 0.000 2.333B A 25 30 35 30.000 2.333 2.333 32.333T B S 5 7 10 7.167 32.333 32.333 39.500
V T U 2 2 2 2 39.500 39.500 41.500
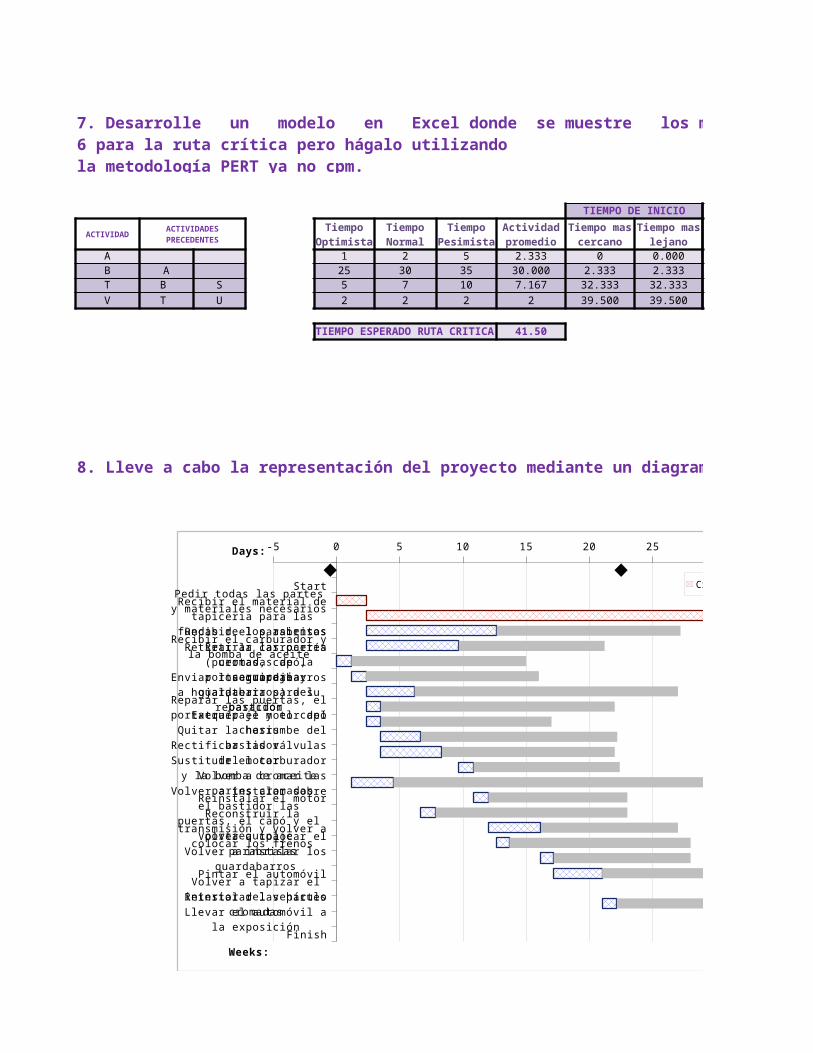
TIEMPO ESPERADO RUTA CRITI 41.50
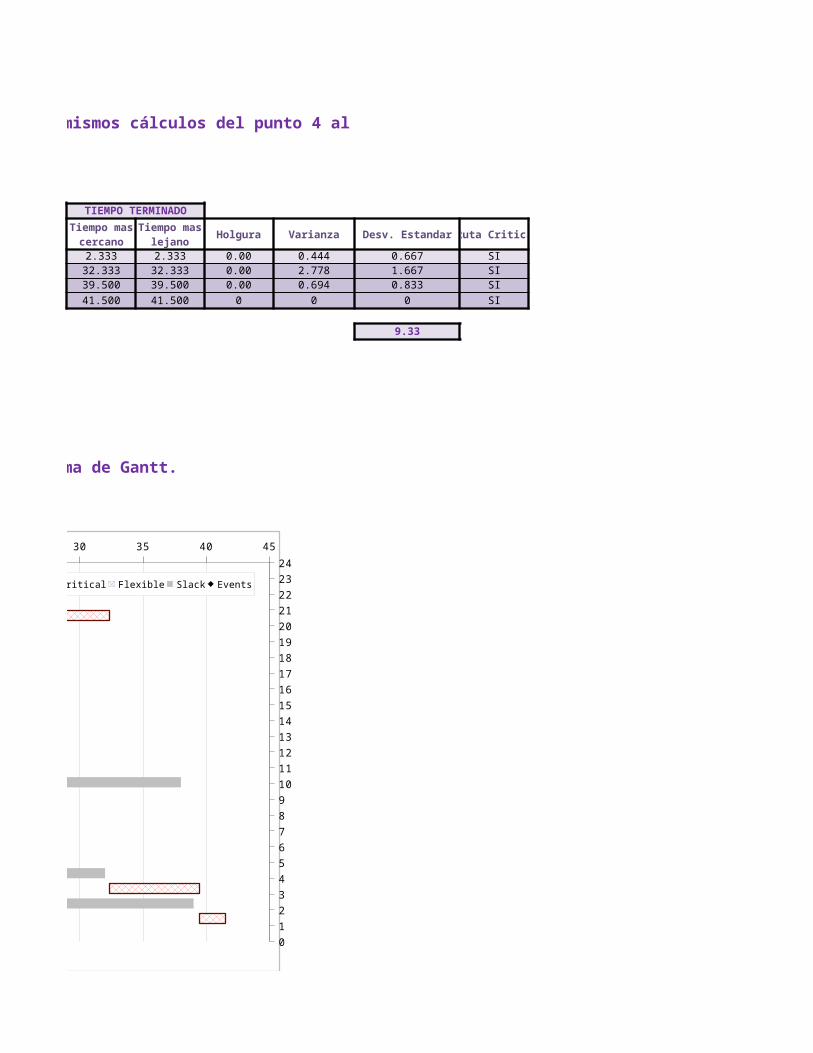
8. Lleve a cabo la representación del proyecto mediante un diagrama de Gantt.
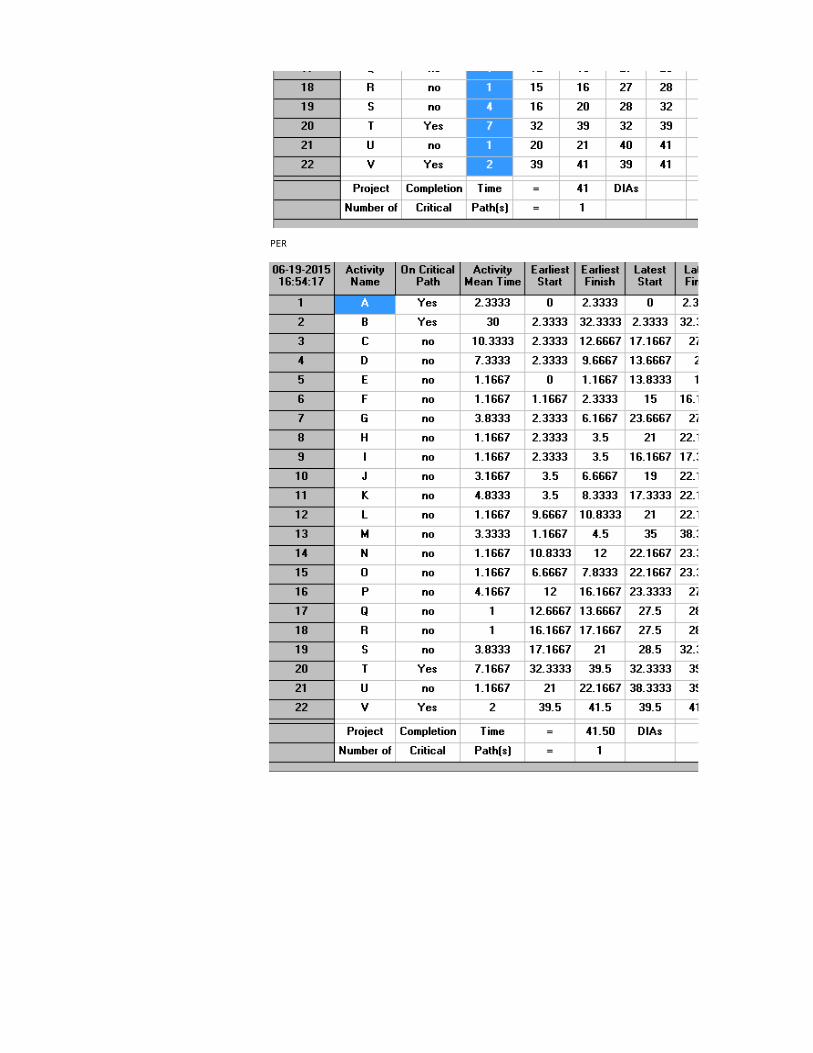
7. Desarrolle un modelo en Excel donde se muestre los mismos cálculos del punto 4 al 6 para la ruta crítica pero hágalo utilizando la metodología PERT ya no cpm.
ACTIVIDADES PRECEDENTES
Tiempo Optimista
Tiempo Normal
Tiempo Pesimista
Actividad promedio
Tiempo mas
cercano
Tiempo mas lejano
Tiempo mas
cercano
StartPedir todas las partes y mate-
riales necesariosRecibir el material de tapiceria para las fundas de los asientos
Recibir el parabrisasRecibir el carburador y la
bomba de aceiteRetirar las partes cromadas de la carroceriaRetirar la carrocería (puertas,
capó, portaequipaje y guard-abarros) del bastidorEnviar los guardabarros a ho-
jalateria para su reparaciónReparar las puertas, el por-taequipaje y el capó
Extraer el motor del chasis
Quitar la herrumbe del bastidorRectificar las válvulas del mo-
torSustituir el carburador y la bomba de aceiteVolver a cromar las partes
cromadasReinstalar el motorVolver a instalar sobre el
bastidor las puertas, el capó y el portaequipajeReconstruir la transmisión y
volver a colocar los frenosVolver a colocar el parabrisas
Volver a instalar los guardabar-ros
Pintar el automóvilVolver a tapizar el interior del
vehículoReinstalar las partes cromadas
Llevar el automóvil a la ex-posición
Finish0
1
2
3
4
5
6
7
8
9
10
11
12
13
14
15
16
17
18
19
20
21
22
23
24
-5 0 5 10 15 20 25 30 35 40 45
Critical Flexible Slack Events
Days:
Weeks:

TIEMPO TERMINADO
Holgura Varianza Desv. Estandar Ruta Critica
2.333 0.00 0.444 0.667 SI32.333 0.00 2.778 1.667 SI39.500 0.00 0.694 0.833 SI
41.500 0 0 0 SI
9.33
7. Desarrolle un modelo en Excel donde se muestre los mismos cálculos del punto 4 al 6 para la ruta crítica pero hágalo
Tiempo mas lejano
StartPedir todas las partes y mate-
riales necesariosRecibir el material de tapiceria para las fundas de los asientos
Recibir el parabrisasRecibir el carburador y la
bomba de aceiteRetirar las partes cromadas de la carroceriaRetirar la carrocería (puertas,
capó, portaequipaje y guard-abarros) del bastidorEnviar los guardabarros a ho-
jalateria para su reparaciónReparar las puertas, el por-taequipaje y el capó
Extraer el motor del chasis
Quitar la herrumbe del bastidorRectificar las válvulas del mo-
torSustituir el carburador y la bomba de aceiteVolver a cromar las partes
cromadasReinstalar el motorVolver a instalar sobre el
bastidor las puertas, el capó y el portaequipajeReconstruir la transmisión y
volver a colocar los frenosVolver a colocar el parabrisas
Volver a instalar los guardabar-ros
Pintar el automóvilVolver a tapizar el interior del
vehículoReinstalar las partes cromadas
Llevar el automóvil a la ex-posición
Finish0
1
2
3
4
5
6
7
8
9
10
11
12
13
14
15
16
17
18
19
20
21
22
23
24
-5 0 5 10 15 20 25 30 35 40 45
Critical Flexible Slack Events
Days:
Weeks:
inicio de la Feria 38 DiasProbabilidad de entregar el vehículo antes del plazo es d 35.4%
TIEMPO DE INICIO
ACTIVIDAD ACTIVIDADES PRECEDENTES
A 1 2 5 2.333 0B A 25 30 35 30.000 2.333T B S 5 7 10 7.167 32.333
V T U 2 2 2 2 39.500
TIEMPO ESPERADO RUTA CRITICA 41.50
9. Si el inicio de la feria es en 38 días apartir de este momento, qué probabilidad existe de terminar la restauración completa del vehículo antes de ese plazo?
Tiempo Optimista
Tiempo Normal
Tiempo Pesimista
Actividad promedio
Tiempo mas
cercano

TIEMPO DE INICIO TIEMPO TERMINADO
Holgura Varianza Ruta Critica
0.000 2.333 2.333 0.00 0.444 0.667 SI2.333 32.333 32.333 0.00 2.778 1.667 SI32.333 39.500 39.500 0.00 0.694 0.833 SI
39.500 41.500 41.500 0 0 0 SI
9.33
9. Si el inicio de la feria es en 38 días apartir de este momento, qué probabilidad existe de terminar la
Tiempo mas lejano
Tiempo mas
cercano
Tiempo mas lejano
Desv. Estandar
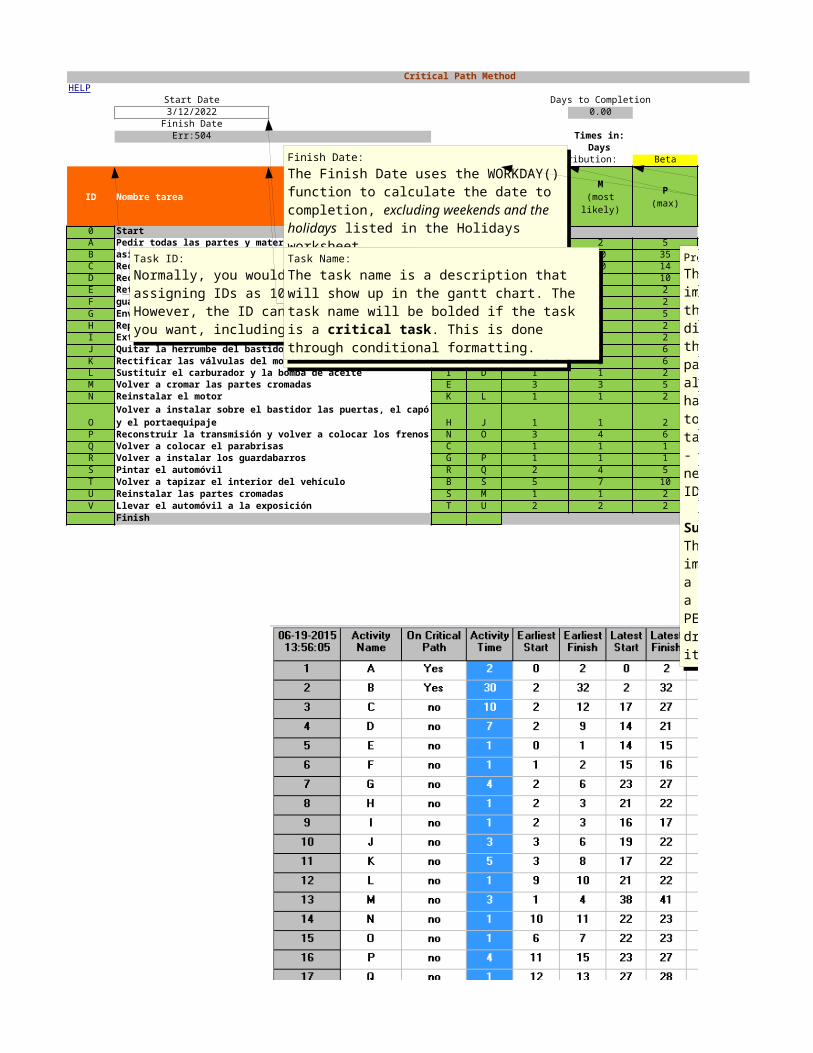
Critical Path Method
Start Date Days to Completion4/18/2023 0.00
Finish DateErr:504 Times in:
DaysTime Distribution: Beta
ID Nombre tarea
0 Start 0.00A Pedir todas las partes y materiales necesarios 1 2 5 2.33B Recibir el material de tapiceria para las fundas de los asientos A 25 30 35 30.00C Recibir el parabrisas A 8 10 14 10.33D Recibir el carburador y la bomba de aceite A 6 7 10 7.33E Retirar las partes cromadas de la carroceria 1 1 2 1.17F E 1 1 2 1.17G Enviar los guardabarros a hojalateria para su reparación F 2 4 5 3.83H Reparar las puertas, el portaequipaje y el capó F 1 1 2 1.17I Extraer el motor del chasis F 1 1 2 1.17J Quitar la herrumbe del bastidor I 1 3 6 3.17K Rectificar las válvulas del motor I 3 5 6 4.83L Sustituir el carburador y la bomba de aceite I D 1 1 2 1.17M Volver a cromar las partes cromadas E 3 3 5 3.33N Reinstalar el motor K L 1 1 2 1.17
O H J 1 1 2 1.17P Reconstruir la transmisión y volver a colocar los frenos N O 3 4 6 4.17Q Volver a colocar el parabrisas C 1 1 1 1.00R Volver a instalar los guardabarros G P 1 1 1 1.00S Pintar el automóvil R Q 2 4 5 3.83T Volver a tapizar el interior del vehículo B S 5 7 10 7.17U Reinstalar las partes cromadas S M 1 1 2 1.17V Llevar el automóvil a la exposición T U 2 2 2 2.00
Finish 0.00
HELP
Predecesores(Enter one ID per cell)
O(min)
M(most likely)
P(max)
Duración reducida
TE
Retirar la carrocería (puertas, capó, portaequipaje y guardabarros) del bastidor
Volver a instalar sobre el bastidor las puertas, el capó y el portaequipaje
Finish Date:The Finish Date uses the WORKDAY() function to calculate the date to completion, excluding weekends and the holidays listed in the Holidays worksheet.
If you see a #NAME or other error in the Finish Date, you probably need to install the Analysis ToolPak and then recalculate the worksheet by pressing Ctrl+Alt+F9.
Task ID:Normally, you would start by assigning IDs as 10, 20, 30, etc. However, the ID can be anything you want, including text.
Task Name:The task name is a description that will show up in the gantt chart. The task name will be bolded if the task is a critical task. This is done through conditional formatting.
Predecessors:The set of events immediately preceding the task. In a network diagram or PERT chart, the predecessors for a particular task are all the tasks which have arrows pointing to that particular task.- Each predecessor needs to refer to the ID in column A.
Successors:The set of events immediately following a particular task. In a network diagram or PERT chart, arrows are drawn from a task to its successors.
Optimistic Time (O):The minimum time required to complete the task. Assumes that everything proceeds faster than normal.
Most Likely Time (M):The most likely time required to complete the task, assuming everything proceeds as normal.
Pessimistic Time (P):The maximum time required to complete the task. Assumes that everything proceeds faster than normal.
Duration or Expected Time:Using a Beta distribution, where O is the minimum, P is the maximum, and M is the most likely value, the formula for calculating the mean or expected time is:Duration = (O+4M+P)/6
Using a Triangular distribution, the mean of the distribution would be:Duration = (O+M+P)/3
B5
Finish Date: The Finish Date uses the WORKDAY() function to calculate the date to completion, excluding weekends and the holidays listed in the Holidays worksheet. If you see a #NAME or other error in the Finish Date, you probably need to install the Analysis ToolPak and then recalculate the worksheet by pressing Ctrl+Alt+F9.
A9
Task ID: Normally, you would start by assigning IDs as 10, 20, 30, etc. However, the ID can be anything you want, including text.
B9
Task Name: The task name is a description that will show up in the gantt chart. The task name will be bolded if the task is a critical task. This is done through conditional formatting.
E9
Predecessors: The set of events immediately preceding the task. In a network diagram or PERT chart, the predecessors for a particular task are all the tasks which have arrows pointing to that particular task. - Each predecessor needs to refer to the ID in column A. Successors: The set of events immediately following a particular task. In a network diagram or PERT chart, arrows are drawn from a task to its successors.
K9
Optimistic Time (O): The minimum time required to complete the task. Assumes that everything proceeds faster than normal.
L9
Most Likely Time (M): The most likely time required to complete the task, assuming everything proceeds as normal.
M9
Pessimistic Time (P): The maximum time required to complete the task. Assumes that everything proceeds faster than normal.
N9
Duration or Expected Time: Using a Beta distribution, where O is the minimum, P is the maximum, and M is the most likely value, the formula for calculating the mean or expected time is: Duration = (O+4M+P)/6 Using a Triangular distribution, the mean of the distribution would be: Duration = (O+M+P)/3

PER
Optimistic Time (O):The minimum time required to complete the task. Assumes that everything proceeds faster than normal.

Optimistic Time (O):The minimum time required to complete the task. Assumes that everything proceeds faster than normal.

Critical Path Method© 2010 Vertex42 LLC
HOLGURA
ES EF LS LF Slackiance
EF of Predecessors
Project:
0.00 0.00 0.00 0.00 0.00 0.00 0 0 0 0 0 0 Mean = 0.002.33 0.00 2.33 0.00 2.00 0.00 0.44 0.00 0.00 0 0 0 0 Variance project =
30.00 2.33 32.33 2.00 32.00 0.00 2.78 2.33 0.00 0 0 0 0 Std. Dv. = 010.33 2.33 12.67 16.87 27.20 14.53 1.00 2.33 0.00 0 0 0 0 P ( Tproject <=
7.33 2.33 9.67 13.87 21.20 11.53 0.44 2.33 0.00 0 0 0 01.17 0.00 1.17 13.83 15.00 13.83 0.03 0.00 0.00 0 0 0 01.17 1.17 2.33 14.83 16.00 13.67 0.03 1.17 0.00 0 0 0 03.83 2.33 6.17 23.17 27.00 20.83 0.25 2.33 0.00 0 0 0 01.17 2.33 3.50 20.83 22.00 18.50 0.03 2.33 0.00 0 0 0 01.17 2.33 3.50 15.83 17.00 13.50 0.03 2.33 0.00 0 0 0 03.17 3.50 6.67 19.03 22.20 15.53 0.69 3.50 0.00 0 0 0 04.83 3.50 8.33 17.17 22.00 13.67 0.25 3.50 0.00 0 0 0 01.17 9.67 10.83 21.23 22.40 11.57 0.03 3.50 9.67 0 0 0 03.33 1.17 4.50 34.67 38.00 33.50 0.11 1.17 0.00 0 0 0 01.17 10.83 12.00 21.83 23.00 11.00 0.03 8.33 10.83 0 0 0 0
1.17 6.67 7.83 21.83 23.00 15.17 0.03 3.50 6.67 0 0 0 04.17 12.00 16.17 22.83 27.00 10.83 0.25 12.00 7.83 0 0 0 01.00 12.67 13.67 27.00 28.00 14.33 0.00 12.67 0.00 0 0 0 01.00 16.17 17.17 27.00 28.00 10.83 0.00 6.17 16.17 0 0 0 03.83 17.17 21.00 28.17 32.00 11.00 0.25 17.17 13.67 0 0 0 07.17 32.33 39.50 31.83 39.00 0.00 0.69 32.33 21.00 0 0 0 01.17 21.00 22.17 37.83 39.00 16.83 0.03 21.00 4.50 0 0 0 02.00 39.50 41.50 39.00 41.00 0.00 0.00 39.50 22.17 0 0 0 00.00 0.00 0.00 0.00 0.00 0.00 0.00 0.00 0 0 0 0
las celdas resaltadas en verdeen amarillo
serán utiles para la entrega
Duración
(exp. time)
Predecessors:The set of events immediately preceding the task. In a network diagram or PERT chart, the predecessors for a particular task are all the tasks which have arrows pointing to that particular task.- Each predecessor needs to refer to the ID in column A.
Successors:The set of events immediately following a particular task. In a network diagram or PERT chart, arrows are drawn from a task to its successors.
Optimistic Time (O):The minimum time required to complete the task. Assumes that everything proceeds faster than normal.
Most Likely Time (M):The most likely time required to complete the task, assuming everything proceeds as normal.
Pessimistic Time (P):The maximum time required to complete the task. Assumes that everything proceeds faster than normal.
Duration or Expected Time:Using a Beta distribution, where O is the minimum, P is the maximum, and M is the most likely value, the formula for calculating the mean or expected time is:Duration = (O+4M+P)/6
Using a Triangular distribution, the mean of the distribution would be:Duration = (O+M+P)/3
Duration or Expected Time:Using a Beta distribution, where O is the minimum, P is the maximum, and M is the most likely value, the formula for calculating the mean or expected time is:Duration = (O+4M+P)/6
Using a Triangular distribution, the mean of the distribution would be:Duration = (O+M+P)/3
Early Start Time:The ES is the maximum EF of all predecessors, except for the first task where the ES=0.
Early Finish Time:The EF time is the ES time plus the duration (EF=ES+Duration).
Late Start Time:The LS time is calculated as the LF time minus the duration (LS=LF-Duration).
Late Finish Time:The LF time is the minimum LS of all the successors, except for the last task where LF equals EF.
Slack Time:The Slack time is calculated as LF minus EF. It can also be calculated as LS minus ES. If the slack is zero, then the task is on the critical path.
Slack Time:The Slack time is calculated as LF minus EF. It can also be calculated as LS minus ES. If the slack is zero, then the task is on the critical path.
O9
Duration or Expected Time: Using a Beta distribution, where O is the minimum, P is the maximum, and M is the most likely value, the formula for calculating the mean or expected time is: Duration = (O+4M+P)/6 Using a Triangular distribution, the mean of the distribution would be: Duration = (O+M+P)/3
R9
Early Start Time: The ES is the maximum EF of all predecessors, except for the first task where the ES=0.
S9
Early Finish Time: The EF time is the ES time plus the duration (EF=ES+Duration).
T9
Late Start Time: The LS time is calculated as the LF time minus the duration (LS=LF-Duration).
U9
Late Finish Time: The LF time is the minimum LS of all the successors, except for the last task where LF equals EF.
V9
Slack Time: The Slack time is calculated as LF minus EF. It can also be calculated as LS minus ES. If the slack is zero, then the task is on the critical path.
AB9
Slack Time: The Slack time is calculated as LF minus EF. It can also be calculated as LS minus ES. If the slack is zero, then the task is on the critical path.
Optimistic Time (O):The minimum time required to complete the task. Assumes that everything proceeds faster than normal.
Optimistic Time (O):The minimum time required to complete the task. Assumes that everything proceeds faster than normal.

Project:
DaysDaysDays) = ?
Late Start Time:The LS time is calculated as the LF time minus the duration (LS=LF-Duration).
Late Finish Time:The LF time is the minimum LS of all the successors, except for the last task where LF equals EF.
Slack Time:The Slack time is calculated as LF minus EF. It can also be calculated as LS minus ES. If the slack is zero, then the task is on the critical path.
Slack Time:The Slack time is calculated as LF minus EF. It can also be calculated as LS minus ES. If the slack is zero, then the task is on the critical path.