Detecció i identificació de desequilibris cromosòmics … · 2008-05-07 · ft s 'utilitza com a...
140
Detecció i identificació de desequilibris cromosòmics constitucionals i adquirits mitjançant Paplicació de la tècnica de Hibridació* Genòmica Comparada '^ I (' '%f- «. < -i**^ "? T .T^ *. « , - ' í 'í<è ' /Mf Angels Rigpla Tor TESI-2003
Transcript of Detecció i identificació de desequilibris cromosòmics … · 2008-05-07 · ft s 'utilitza com a...
Detecció i identificació de desequilibris cromosòmicsconstitucionals i adquirits mitjançant Paplicació dela tècnica de Hibridació* Genòmica Comparada
' I (''%f- «.
< -i** "? T.T^ *. «
, - ' í 'í<è '
/Mf Angels Rigpla TorTESI-2003
o
*9oO
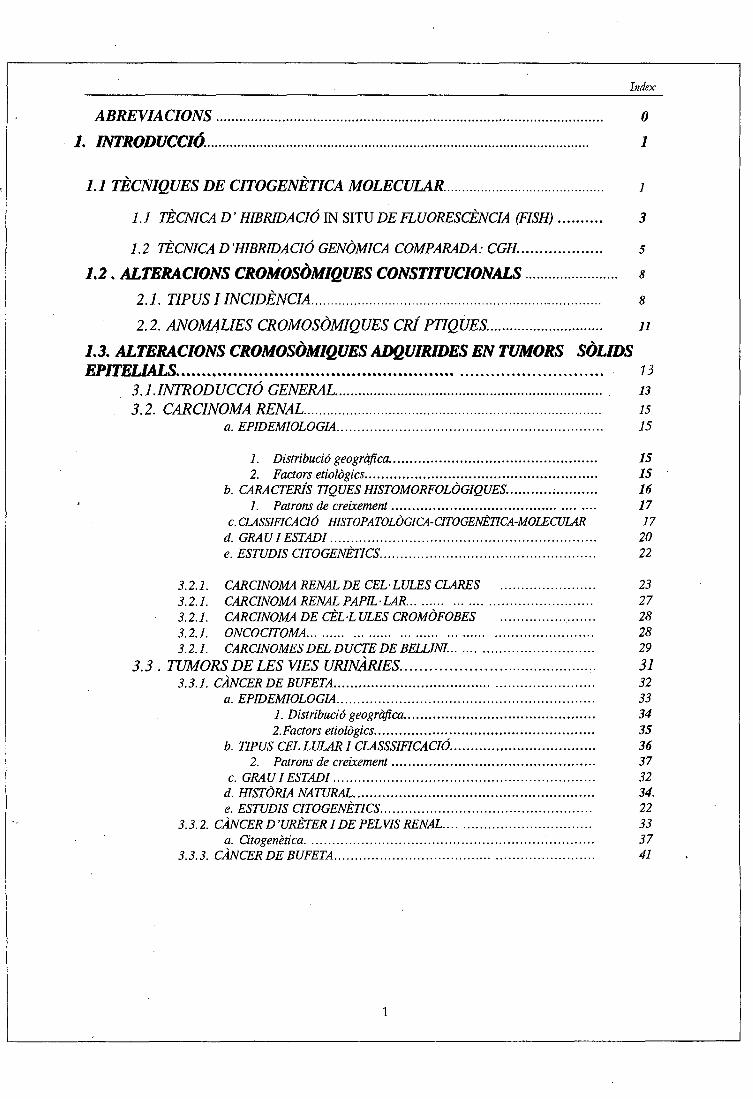
O . ABREVIACIONS .................................................................................................... O
/. INTRODUCCIÓ. ...................................................................................................... 1
9/./ TÈCNIQUES DE CITOGENETICA MOLECULAR i
L7 TÈCNICA D'HIBRIDACIÓ IN SITU D£ FLUORESCENCIA (FISH)OO 1.2 TÈCNICA D 'HIBRIDACIÓ GENÒMICA COMPARADA: CGH. .................. 5
1.2 . ALTERACIONS CROMOSÒMIQUES CONSTITUCIONALS
2.7. TIPUS I INCIDÈNCIA ............................................................................ 8
O 2.2. ANOMALIES CROMOSÒMIQUES CRÍ PTIQUES. ............................. u
L3. ALTERACIONS CROMOSÒMIQUES ADQUIRIDES EN TUMORS SÒLIDSEPITEUALS. ................................................................................. 13
3.1. INTRODUCCIÓ GENERAL ....................................... .............................. 133.2. CARCINOMA RENAL ............................................................................. 15
91 a. EPIDEMIOLOGIA ................................................................ 15O
1. Distribució geogràfica .................................................. 152. Factors etiologies ........................................................ J5
b. CARACTERÍS TIQUES HISTOMORFOLÒGIQUES. .......... . .......... 167. Patrons de creixement ................................................ 17
tl c. CLASSIFICACIÓ HISTOPATOLÒGICA-CITOGENÈTICA-MOLECULAR 17. GRAUIESTADI ................................................................ 20
0 e. ESTUDIS CITOGENÈTICS .................................................... 22
5.2J. CARCINOMA RENAL DE CÈL·LULES CLARES ....................... 235.2J. CARCINOMA RENAL PAPIL- LAR ......................................... 27
ft 3.2.;. CARCINOMA DE CÈL·LULES CROMÒFOBES ................ ....... 283.2 J. ONCOCITOMA ............................................................ 283.2J. CARCINOMES DEL DUCTE DE BELLINI. ................................. 29
3.3 . TUMORS DE LES VIES URINÀRIES. ........................................ .. 313.3J. CÀNCER DE BUFETA .............................................................. 32
a. EPIDEMIOLOGIA .............................................................. 331 . Distribució geogràfica .............................................. 342. Factors etiologies ..................................................... 35
b. TIPUS CEL LULAR I CLASSSIFICACIÓ ................................... 362. Patrons de creixement ................................................. 37
c. GRAUIESTADI ............................................................... 32d. HISTÒRIA NATURAL .......................................................... 34.
9 e. ESTUDIS CITOGENÈTICS ................................................... 229 " 3.3.2. CÀNCER D'URÈTER I DE PELVIS RENAL ................................... 33
a. Citogenètica ......................................................... ............ 37* 3.3.3. CÀNCER DE BUFETA .............................................................. 41
99
9
Index
ft
oftooJ 2. OBJECTIUS. 50ft
OO 3. MATERIAL I MÈTODES 51ft 3.1. MATERIAL BIOLÒGIC. 510 3.1.1. PACIENTS AMB ANOMALIES CROMOSOMIQUES CONSTITUCIONALS..
3.1.2. TUMORS UROTELIALSI RENALS. 52
3.2. TÈCNIQUES DE CULTIU ICITOGENÈTICA CONVENCIONAL. 55.3.2.1. CULTIU DE SANG PERIFÈRICA 55
j) 3.2.2. CULTIU DE LÍQUID AMNIOTIC. 573.2.3. CULTIU DE CÈL·LULES TUMORALS 58
3.3. TÈCNIQUES DE BANDEIG CROMOSOMIC. 59
O 3.4. EXTRACCIÓ DE DNA 61
3.5. QUANTIFICACIÓ DEL DNA 63
3.6. PCR QUANTITATIVA FLUORESCENT. 64
3.7. FISH. 66
3.8. HIBRIDACIÓ GENÒMICA COMPARADA 68
4. RESULTATS 781. Identification of two de novo partial trisomies by comparative genomic
hybridization.Rigola MA, Carrera M. Ribas I, De La Iglesia C, Méndez B, Egozcue J, Fuster C.Clin Genet. 2001 Feb;59(2):106-10
2.2*
2. Characterization of a heritable partial monosomy 18p by molecular andcytogenetic analysis.Rigola MA, Plaja A, Mediano C, Miro R, Egozcue J, Fuster C.Am J Med Genet. 2001 Nov15¡104(1):37-41
2.3*
3. A comparative genomic hybridization study in a 46,XX male.Rigola MA, Carrera M, Ribas I, Egozcue J, Miro R, Fuster C.Fèrtil Steril. 2002 Jul;78(1):186-8
3.2*
Index
4. Comparative genomic hybridization analysis of transitional cell carcinomas ofthe renal pelvis.Rigola MA, Fuster C, Casadevall C, Bemues M, Caballin MR, Gelabert A, Esozcue J,Miró R.
Càncer Genet Cytogenet. 2001 May;127(1):59-631.7*
5. Analysis of kidney tumors by comparative genomic hybridization andconventional cytogenetics.Rigola MA, Casadevall C, Bemues M, Caballin MR, Fuster C, Gelabert A, EgozcueJ, Miro R.Cancer Genet Cytogenet. 2002 Aug;137(1):49-53
1.7*
6. Comparative genomic hybridization analysis of invasive bladder tumors withdifferent grown patterns.
Rigola MA, Hernando C, Fuster C, Gelabert A, EsozcueJ, Miro R.Journal of Urology (enviat)
5. DISCUSSIÓ. 80
5.1. ALTERACIONS CROMOSÒMIQUES CONSTITUCIONALS. 815.1.1. TRISOMIES IMONOSOMIES PARCIALS. 815.1.2. BARONSXX. 85
5.2. ALTERACIONS CROMOSÒMIQUES ADQUIRIDES EN TUMORSUROTELIALSI RENALS 895.2.1. TUMORS UROTELIALS DE CÈL·LULES TRANSICIONALS. 955.2.2. TUMORSDE CEL- LULES TRANSICIONALS DE PELVIS RENAL 965.2.3 TUMORS DE CÈL·LULES TRANSICIONALS DE BUFETA 98
6. CONCLUSIONS 107
7. BIBLIOGRAFIA 109

Abreviacions
ABREVIACIONS
ADN Acid desoxirribonucleicARN Acid ribonucleicCGH Hibridació Genòmica ComparadadUTP Deoxiuridina 5'trífosfatISCN International System for Human Cytogenetic NumenclaíureDm dm doble minutesDOT-PCR Primers oligonucleotids degenerats-reacció en cadena de làpolimerasaFISH Hibridació in situ fluorescentFITC Fluoresceïna isotiocianatH-CGH Hibridació Genòmica Comparada de Alta ressolució.LA Líquid amniòticM-FISH Multi painting-Hibridació in situ fluorescentPCR Reacció en cadena de la polímer asaPb pb Parells de basesQF-PCR Reacció en cadena de la poümerasa- quantitativaSP Sang perifèricaTas tas associacions telomèriquesWHO World Health Organization

Introducció
*
*
1. INTRODUCCIÓ
ftftftftftft - _: - -J 1. TÈCNIQUES DE CITOGENÈTICA MOLECULARft Les tècniques de citogenètica convencional i molecular tenen una gran implicació en el diagnòstic
ft
Introducció
ft z pronòstic de malalties. El desenvolupament de tècniques de hibridació in situ de fluorescencia
(FISH) amb les seves variants tecnològiques com la hibridació genòmica comparada CGH, el
ft cariotip espectral (SKY-FISH), o el multiplex FISH (M-FISH), constitueixen una nova disciplina
jT anomenada citogenètica molecular i proporcionen nous mètodes més precisos de detecció de les.
À alteracions cromosomiques constitucionals i de les alteracions cromosomiques adquirides en
ft cel -Mes turnarais.
A La tècnica citogenètica de bandes G permet la identificació del cromosomes gràcies a l 'aparició
Ç de un patró de bandes característic i específic de cada parell de cromosomes homòlegs. Un
ft patró de bandes G amb un nivell de resolució 550, té un promig de 5x1 (f pb de DNA per banda;ft^ capaç de codificar per 100-200 gens. Per poder visualitzar al microscopi una alteració
Ò cromosòmica estructural ha d'ésser superior a 5 Mb i els guanys o pèrdues almenys han d'afectar
* a una banda o pari d'ella. La tècnica del cariotip amb bandes G, anomenada citogenèticaftÀ convencional, ha permès identificar nombroses alteracions cromosomiques constitucionals i
ft s 'utilitza com a tècnica de rutina en el diagnòstic d'aquestes anomalies.
* En el cas de tumors sòlids hi ha factors metodològics que han dificultat la incorporació de
£ l'anàlisi citogenètica convencional com a rutina diagnostica, per tal de complementar el
ft diagnòstic anatomopatològic. Entre els obstacles tècnics per obtenir metafases analitzables a
_ partir de mostres de tumor cal destacar les següents: baixa viabilitat cel -lular degut a la necrosi,
£ necessitat de la disgregació enzimàtica, contaminació microbiana, contaminació de teixit amb
ft cèl·lules normals, presència d'alteracions cromosomiques molt complexes que fan difícil
^ determinar el canvi cromosòmic primari associat a un tipus concret de tumor. En tumors sòlids,
% les tècniques de FISH i CGH, han permès evolucionar molt més ràpidament cap a la detecció d'
ft alteracions genètiques i poder identificar aquest tipus de canvis (Nederloft al. 1990 , Lichter et al
* 1991, Ried et al 1992).
<9 En genètica clínica, la caracterització acurada de les anomalies cromosomiques, tan numèriquesgl™ com estructurals, es fonamental per conèixer la seva implicació en la etiologia de les diferentsft£ malalties hereditàries. La aplicació de les noves tècniques de citogenètica molecular: FISH
ft (FISH-convencional, M-FISH, M-FISH-bands , CGH) ofereix una eina molt eficaç a nivell clínicft al possibilitar un diagnòstic més precís de les alteracions genètiques tan prenatal com
• postnatalment. Aquestes metodologies permeten identificar regions cromosomiques que,
mitjançant bandes G, no poden arribar a ésser caracteritzades (cromosomes marcadors,
dt Introducció _ _.. . ..;. . _ _ - . . _ -..^-~ _
& derivatius i altres) o detectades (anomalies subtils o críptiques). A mes a mes, faciliten la
• localització de gens específics i de seqüències de DNA dins de cromosomes concrets, la
identificació de microduplicacions o microdelecions i la detecció d'aneuploïdies parcials que a
A vegades es manifesten donant un fenotip anòmal. Es a dir, aquestes tècniques ens permetran
S localitzar millor les regions cromosòmiques on es troben els gens implicats en diferents
patologies.
*
<f
9
* Introducció
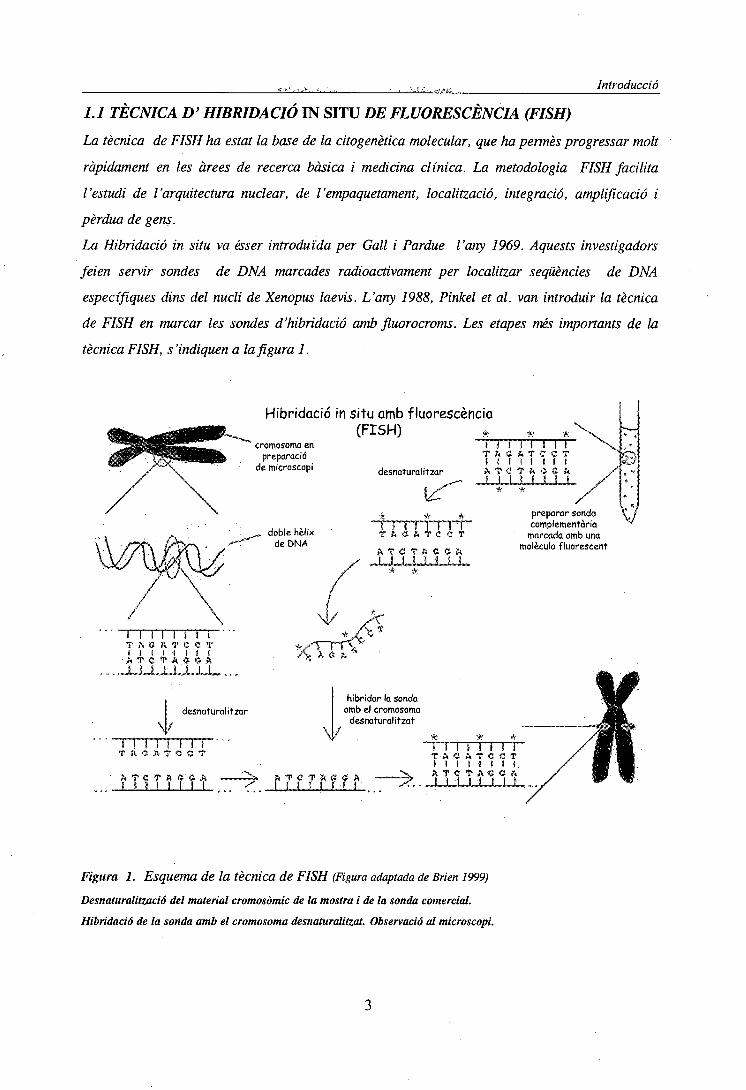
1.1 TÈCNICA D'HIBRIDACIÓ IN SITU DE FLUORESCENCIA (FISH)
La tècnica de FISH ha estat la base de la citogenètica molecular, que ha permès progressar molt
ràpidament en les àrees de recerca bàsica i medicina clínica. La metodologia FISH facilita
l'estudi de l'arquitectura nuclear, de l'empaquetament, localització, integració, amplificació i
pèrdua de gens.
La Hibridació in situ va ésser introduïda per Gall i Pardue l'any 1969. Aquests investigadors
feien servir sondes de DNA marcades radioactivament per localitzar seqüències de DNA
específiques dins del nucli de Xenopus laevis. L'any 1988, Pinkel et al. van introduir la tècnica
de FISH en marcar les sondes d'hibridació amb fluorocroms. Les etapes més imponants de la
tècnica FISH, s'indiquen a la fi gura 1.
Hibridació in
cromosoma enpreparació
de microscopi
„ doble hèlixde DNA
/
situ amb fluorescencia(FISH) * *• *\
desnaturalitzar.*-""" «v?
í * *i ï r M i i íT f t · S & T C C T
A T C T í t C C Í i/ -LJJJLJULJLL.' * *.
\ t i 1 1 1 1 1 \T A C A T C C T ^t ï 1 1 f 1 ( IA T - C T A O C A /
JULJLJLJULJLJL /* * /
preparar sondacomplementària
marcada amb unamolècula fluorescent
OiC-í
V
I I .1 1 I 1 I ÍT A O R T C C TI I I I I i l l
• A T e VA « « ft..JULJULLJ-JJL...;.
desnaturalitzar
M M Î 1 1 1T f t * A T < ! < J T
A T C T ft « '« Ai t i l I I I I
\/
hibridar la sondaamb el cromosomadesnaturalitzat
*i I I i Í í! Í iT-A C- A-T C C Tl i l l l i l ift .T ' C TAC C ft' "JULU-J-JU
Figura 1. Esquema de la tècnica de FISH (Figura adaptada de Brien 1999)
Desnaturalitzada del material cromosòmic de la mostra i de la sonda comercial.
Hibridació de la sonda amb el cromosoma desnaturalitzat. Observació al microscopi.
A Introducció
£ En genètica mèdica, la detecció d'anomalies cromosòmiques és fonamental per l'identificació de
<§ caríotips específics de les malalties. La metodologia FISH ha estat particularment útil per
™ detectar translocacions críptiques indétectables amb l'anàlisi cromosòmica de bandes.
A La FISH-convencional esdevé insuficient quan no es sospita la naturalesa de l'alteració, al
% desconèixer el tipus de sonda cromosòmica que cal utilitzar. En aquest casos, s'apliquen lesÀ"r tècniques de M-FISH (multicolor) o de SKY (cariotip espectral) que permeten la ràpida
^ identificació de tots els cromosomes en una única hibridació utilitzant un kit comercial de 24
^ sondes de pintat cromosomic (Speicher et al. 1996; Schròck et al. 1996). La seva utilitat
•— s'evidencia en la detecció i caracterització de reorganitzacions complexes, críptiques i de
Q material cromosomic d'origen desconegut (Uhrig et al. 1999; Joyce et ui. 1999; Jalal et al 2001).
^ Però aquesta metodologia també té limitacions, la principal es que no pot detectar anomalies%
intracromosòmiques tal com duplicacions i delecions.
f
**«»«
*
Introducció
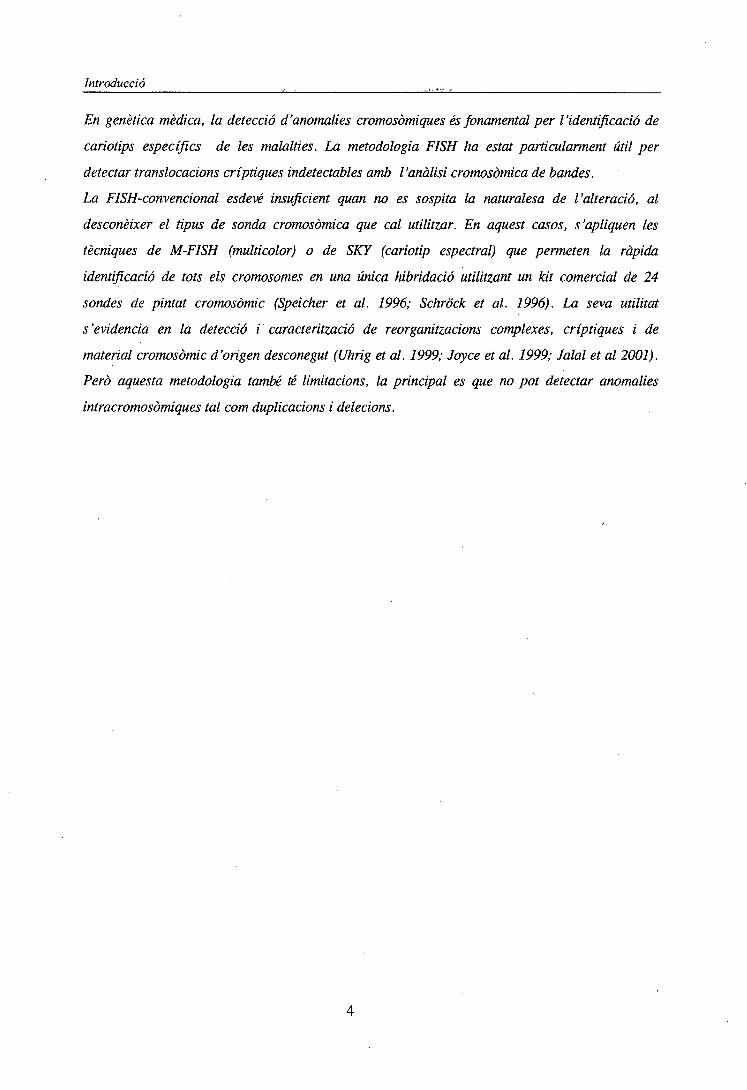
1.2 TÈCNICA D'HIBRIDACIÓ GENÒMICA COMPARADA: CGH
La CGH és una tècnica que permet l'anàlisi total del DNA, detectant guanys i pèrdues de material
genètic (Kallionemi et al. 1992) Es basa en la hibridació competitiva simultània de DNA
problema i DNA control marcats diferencialment sobre cromosomes normals. En aquesta
hibridació les diferències entre la unió de les seqüències de DNA marcades, indica aquelles
regions que puguin estar sobre o infrarepresentades en el genoma problema. Un software
especial per aquesta tècnica, interpreta els valors de la intensitat de fluorescencia, generant
perfils de guanys i pèrdues al llarg de cada cromosoma (Figura 2). En condicions de normalitat,
com que la quantitat de DNA disponible problema i el de referència és la mateixa el resultat de la
- hibridació és un cromosoma de color homogeni amb un perfil normal. En condicions
patològiques, si el DNA problema conté un guany cromosòmic la quantitat disponible d'aquest
DNA problema és superior i la hibridació marcarà una desviació cap a un dels fluorocroms. Si en
el DNA problema hi ha deleció o pèrdua, la desviació de color anirà en sentit contrari. El
software elabora un perfil mig per cada cromosoma i el resultat final ens indica quines són les
zones cromosòmiques guanyades, amplificades o delecionades en cada mostra.
La tècnica de CGH, inicialment descrita per analitzar el desequilibri en el nombre de copies de
DNA en tumors, pot aplicar-se a l'estudi d'alteracions cromosòmiques desequilibrades en tot tipus
de mostra.
AVANTATGES
• Permet estudiar, de forma simultània, la totalitat de canvis en el nombre de copies de
DNA presents en el genoma.
• No necessita cèl·lules en cultiu a diferència d'altres tècniques SKY, M-FISHque depenen
de l'obtenció de metafases.
• Es requereix molt poca quantitat de DNA (200ng-l/ug)
• Es pot treballar amb petits grups cel·lulars obtinguts per microdissecció o dissecció amb
làser, també permet l'anàlisi d'una única cèl·lula. Quan es treballa amb tant poc material
s'ha de realitzar prèviament una DOT-PCR o PCR inespecífica, fent servir
oligonucleòtids degenerats.
• Pot utilitzar-se a partir de DNA extret de mostres fresques o incloses en blocs de
parafina, per possibles estudis retrospectius.

t
* Introducció
^ • Aquesta tècnica ha contribuït significativament al coneixement actual de moltes
<|) alteracions genòmiques, i a la caracterització dels canvis genètics en mostres procedents
T de qualsevol teixit.
**J DESAVANTATGES
fr • La CGH pot avaluar canvis en el nombre de còpies relatives però no els nivells de
^ ploïdia (diploide, tríploide, tetraploide) degut a que el programa d'anàlisi de la CGH es9A basa en la normalització de la intensitat de senyal observada en cada metafase.
• • No detecta reordenaments cromosòmics equilibrats (Kallioniemi et al.1994)
m • No es detecten guanys menors de 3-5Mb, a menys que es trobin amplificades unes quantes
Q vegades en el DNA problema . La mida mínima detectable en casos d'amplificació d'una
w regió és de 2-4Mb (Piper et al 1995), i el fragment mínim per una deleció és de 10-20MbA^ (Kallionemi et al 1994). Una variant de la CGH, anomenada d'alta resolució (HR-CGH)
permet la detecció de desequilibris cromosòmics submicroscòpics, de l'ordre de 3 Mb
(Kirschhoff et al. 1999).
• No es fiable per a detectar canvis en les regions centromèriques, telomèriques i les
corresponents a l'heterocromatina dels cromosomes 1,9,16, Y a l'ésser molt polimòrfiques
respecte al nombre de repeticions. Per evitar problemes, aquestes regions es bloquegen
amb DNA Cot-1 Kallionemi et al 1994).
• No permet detectar mosaïcismes inferiors al 30%-40% ja que un clon emmascara
l'altre.
• La CGH només pot detectar canvis presents a una pan àmplia de cel -lules turnarais i no
permet detectar alteracions presents en dons minoritaris.
• En tumors sòlids, un contingut variable de cel -Iules normals o cel -Iules inflamatòríes
infiltrades dins del tumor pot reduir significativament la capacitat de la CGH per detectar
aberracions. Per aquest motiu, es requereix que un mínim d'un 70% de la mostra
M analitzada correspongui a cèl·lules turnarais. Aquests obstacles es poden solventar
0 mitjançant la microdissecció de petites àrees turnarais excloent material contaminat de
cel iules normals per tal de reduir els resultats enganyosos deguts a la presència de
cel -Mes no malignes.
Introducció
ms
,5JL1_.3L_
MARCATGE
• . :ffllM|DAC|o• • • ' • • •
JEUX., . T T
z:Metalase -normal
v;;,.: EAPTUMA1)' IMATGES
. . , . ; . iANÀLISIS
fl.S fX?$ i t3:tí*™».,
§6 n - j 5
S n* t 3
normal guany pèrdua
<&r^íS^mmmMs^j;'=^f^rs:^^L^^
Figura 2. Esquema de la tècnica de CGH.
***
* Introducció
9• 2. ALTERACIONS CROMOSÒMIQUES CONSTITUCIONALS
J 2.7. 77PKS / INCIDÈNCIA
fa Les alteracions cromosòmiques constitucionals poden ser causa de síndromes clíniques,
infertilitat, avortaments de repetició i altres manifestacions clíniques. En l'actualitat es coneixen
més de 60 síndromes degudes a anomalies dels cromosomes. Aquestes alteracions poden estar
presents en totes les cèl·lules de l'individu o bé, menys sovint, en forma de mosaïcisme.
Aproximadament el 20% de totes les concepcions presenten alteracions cromosòmiques, però la
' majoria no arriben a implantar-se o avorten espontàniament. La incidència d'anomalies
cromosòmiques a nounats es d'un 0.65%; aquesta freqüència varia segons la etapa del
desenvolupament. En diagnòstic prenatal s'han detectat alteracions citogenètiques en el 3% dels
embrions de primer trimestre i en el 2% de segon trimestre (Lippman et al 1992). Tanmateix
s'han observat alteracions cromosòmiques en un 10% dels espermatozoides de un individu sa i
aproximadament en la meitat dels embrions procedents de programes de fertilització in vitro de
parelles subfertils i en més del 50% dels avortaments espontanis (Hsu,1992; Guttenbach et al
1997; Munnéetal 1998).
Les alteracions cromosòmiques es classifiquen en numèriques i estructurals. Es considera que
aproximadament 1 de cada 150 nounats te una alteració cromosòmica moderada o greu. El tipus
d'anomalia cromosòmica més freqüent es la numèrica i concretament les trisomies autosòmiques
21,- 13, 18 i les que afecten els cromosomes sexuals 47,XXY; 47,XYY; 47,XXX i la monosomia
45,X.
L'obtenció de DNA genòmic de qualsevol mostra permet l'amplificació per PCR d'algun gen o
marcador específic d'un cromosoma concret, utilitzant oligonucleòtids complementaris.
Darrerament una variant anomenada PCR fluorescent quantitativa (QF-PCR) possibilita una
ràpida detecció prenatal de les aneuploïdies més freqüents que afecten als cromosomes X, Y, 13,
18, i 21 (Adinolfi et al 1997; Cirigliano et al. 2001). El gran avantatge d'aquesta tècnica
molecular és, a part de la seva rapidesa i fiabilitat, que es pot obtenir DNA d'una mostra molt
petita que a vegades resulta insuficient per obtenir cromosomes.
Les anomalies estructurals es produeixen per trencaments dels cromosomes originant fragments
cromosòmics que poden perdre's (deleció) o intercanviar-se (reorganitzacions). La pèrdua de
gens en el primer cas o el possible canvi d'activitat gènica en el segon produeixen, en molt casos,
disfuncions cel·lulars. Si aquestes alteracions cromosòmiques tenen lloc a la meiosi, abans de la
concepció, estaran presents en totes les cèl·lules del fetus. Si els errors es produeixen a la mitosis
Introducció
postconcepcional, el resultat és un fetus mosaic on existeixen cèl·lules normals i cèl·lules amb
alteracions cromosòmiques.
Les anomalies estructurals representen un 10% de totes les alteracions cromosòmiques i poden
ésser equilibrades o desequilibrades (Hsu,1992). Les més freqüents son les equilibrades que estan
presents en un 2% dels nounats i en el 5% d'embrions analitzats per diagnòstic prenatal; mentre
les desequilibrades constitueixen un 0.04% i 0.06% respectivament (Hsu,1992; Jacobs et al. 1992;
Yu et al. 1997; Bugge et al. 2000). Les alteracions estructurals més freqüents són les
translocacions.
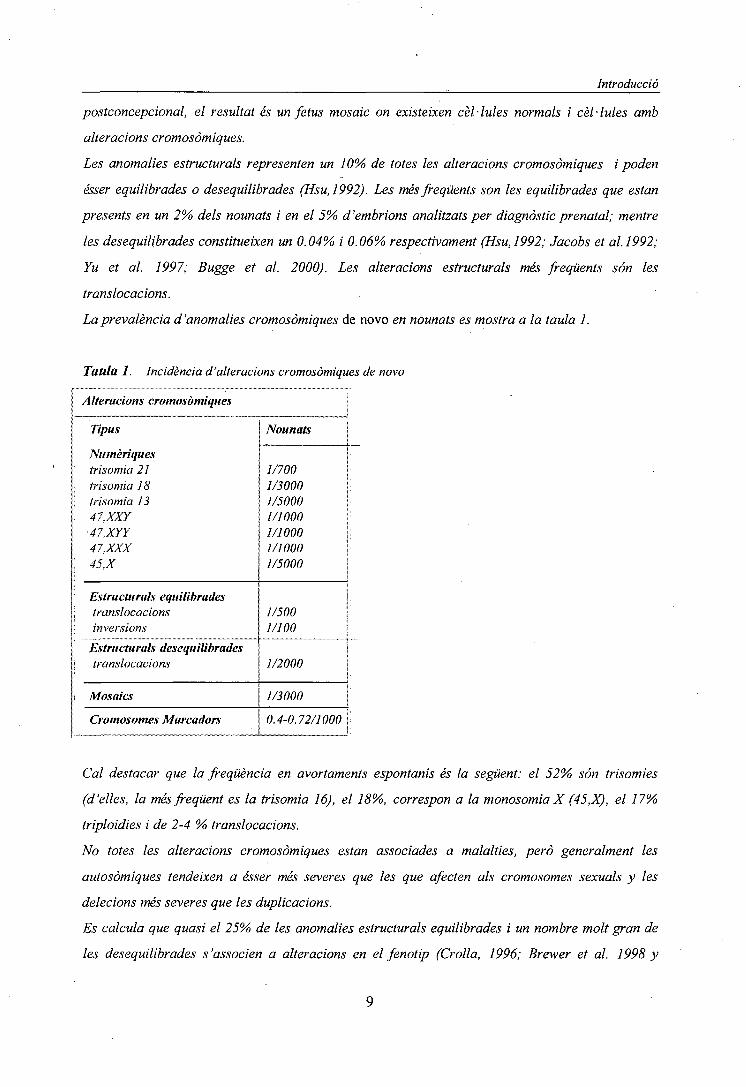
Laprevalència d'anomalies cromosòmiques de novo en nounats es mostra a la taula 1.
Taula 1. Incidència d'alteracions cromosòmiques de novo
A Iterations cromosòmiques
Tipus
Numèriquestrisomia 21trisomia J Strisomia 1347,XXY
•47.XYY47.XXX45.X
Estructurals equilibradestranslocacionsinversions
Estructurals desequilibradestranslocacions
Mosaics
Cromosomes Marcadors
Nounats
1/7001/30001/50001/10001/10001/10001/5000
1/5001/100
1/2000
1/3000
0.4-0.72/1000
Cal destacar que la freqüència en avortaments espontanis és la següent: el 52% són trisomies
(d'elles, la més freqüent es la trisomia 16), el 18%, correspon a la monosomia X (45,X), el 17%
triploidies i de 2-4 % translocacions.
No totes les alteracions cromosòmiques estan associades a malalties, però generalment les
autosòmiques tendeixen a ésser més severes que les que afecten als cromosomes sexuals y les
delecions més severes que les duplicacions.
Es calcula que quasi el 25% de les anomalies estructurals equilibrades i un nombre molt gran de
les desequilibrades s'associen a alteracions en el fenotip (Crolla, 1996; Brewer et al. 1998 y

Introducció
1999; Bugge et al. 2000; Shaper and Lupski, 2000; Li et al. 2000). En aquest casos, les
característiques clíniques més freqüents son retard mental, retard del creixement intrauterí,
alteracions neurològiques, malformacions congènites i infertilitat. Aquest tipus de alteracions
clíniques sovint son el. resultat de l'alteració de molts gens.
Cadascuna de les anomalies cromosòmiques estructurals pot considerar-se com única ja que,
encara que els punts de trencament observats al microscopi, es trobin a la mateixa banda, poden
estar separats entre sí per varies megabases (Warburton, 1991). La pèrdua o duplicació de
segments cromosòmics d'una mida semblant pot tenir conseqüències molt diferents depenen del
nombre i funció del gens que es localitzen en aquestes regions. Algunes alteracions
cromosòmiques estructurals son fenotípicament innòcues (variants polimòrfiques com la inversió
pericéntrica del cromosoma 9) però també s'han descrit individus que presentaven alteracions
cromosòmiques sense alteracions f enotípiques aparents (Gardner and Sutherland, 1996).
La tècnica de FISH convencional esta estandarizada en la majoria dels laboratoris de
citogenètica al permetre la detecció tant d'anomalies cromosòmiques numèriques com
estructurals. Les dues grans avantatges de aquesta tècnica son: la rapidesa i la facilitat en la
detecció d'anomalies com microdelecions, duplicacions i reorganitzacions complexes. L'any
1993, Ward et al. varen evidenciar la utilitat de aquesta tècnica per realitzar grans screenings de
aneuploïdies en mostres de líquid amniòtic no cultivat (emprant sondes pels cromosomes amb més
rellevància en la clínica en el diagnòstic prenatal 13, 18, 21, X e Y). La utilització de sondes de
pintat cromosòmic es especialment útil per detectar reorganitzacions complexes i per la
identificació dels cromosomes marcadors, al evidenciar fàcilment la existència de intercanvis
entre cromosomes no homòlegs degut a la presència de colors diferents en un mateix cromosoma
(Batista et al. 1993; Fuster et al. 1997; Wieczorek et al. 1998; Lee et al. 2002). Per altra banda,
la possibilitat de realitzar múltiples hibridacions (no simultànies) utilitzant diferents tipus de
sondes (de seqüència única, de pintat cromosòmic, centromèriques) sobre una mateixa
preparació ha resultat molt útil, especialment en el diagnòstic prenatal, preimplantacional o
preconcepcional i en general quan es disposa de poc material (Larin et al 1994; Escudero et al.
1997).
La tècnica de CGH constitueix una alternativa a la de FISH en la caracterització d'alteracions
cromosòmiques numèriques i estructurals desequilibrades (incloent duplicacions i delecions).
L'eficàcia d'aquesta tècnica per la identificació de alteracions cromosòmiques constitucionals va
quedar palesa, per primera vegada, en el treball de Bryndorf et al. (1995) al identificar un
desequilibri cromosòmic, prèviament detectat per bandes G, en un cas de diagnòstic prenatal.
10
Introducció
Posteriorment, l'aplicació de la CGH al diagnòstic postnatal va permetre caracteritzar anomalies
que eren impossibles de identificar amb la citogenètica convencional (Erdel et al 1997; Levi et al
1997; Yu et al. 1997; Daniely et al. 1998; Lapierre et al. 1998; Airam-Goldríng et al. 2000;
Levy and Hirschhorn, 2002). La utilitat de la CGH ha quedat palesa en la identificació
d'alteracions desequilibrades en diferents teixits: amniòcits no cultivats (Lapierre et al. 2000),
avortaments espontanis (Daniely et al. 1999 a,b), placenta (Christiaens et al. 2000; Ozcan et al
2000; Tabet et al. 2001); blastòmers (Voullaire et al. 2000) i en corpuscle polar (Wells et
al.2002). A més, permet la detecció de mosaics confinats aplacenta (Lestau et al. 1999 i 2000)
2.2. ANOMALIES CROMOSÒMIQUES CRÍPTIQUES
A causa de les limitacions de les tècniques de citogenètica convencional, fins ara, son poques les
regions cromosòmiques crítiques associades a un síndrome clínic concret. Entre aquests es
troben les síndromes degudes a microdelecions com la de Williams (delectó a 7qll.23), la de
Prader-Willi i la d'Angelman, (delectó a 15ql2), la de Smith-Magenis (delectó a 17pll.2), la de
DiGeorge/velocardiofacial (deleció a 22qll.2) entre d'altres.
Actualment, amb la existència de sondes comercials especifiques d'aquests loci es possible
diagnosticar tan microdelecions com microduplicacions e inversions (Lichter et al 1991; Ward et
al 1993; Shaffer et al.1995). L'any 1997, Ligón et al. varen realitzar el primer estudi pilot per
detectar la presencia de microdelecions en pacients amb retard mental i de creixement utilitzant
un còctel de sondes multicolor de les regions més freqüents implicades en aquestes síndromes.
Podem concloure que la combinació d'estudis citogenètics i moleculars ha permès detectar i
relacionar la presència de microdelecions i microduplicacions amb diverses síndromes (Fig.3).
Les regions telomèriques son molt riques en gens i poden presentar anomalies cromosòmiques
críptiques que, en molts casos, no es poden detectar a l'utilitzar bandes G. L'any 1993,Meltzer et
al. combinant els mètodes de FISH i microdissecció, varen demostrar que es podien detectar
deletions i translocacions telomèriques críptiques. Però com que.la tècnica de microdissecció es
molt laboriosa, actualment s'utilitzen les sondes multi-subtelomèríques especifiques per la
caracterització d'aquests tipus d'alteracions (Flint et al. 1995; Knight et al. 2000; Bezrookove et
al 2000). Amb aquesta metodologia s'han trobat anomalies cromosòmiques críptiques afectant
regions subtelomèríques en el 7% de pacients amb retard mental moderat/sever associat a
malformacions congènites (Knight et al. 1999).
Segons el estudis realitzats per Benz et al. (1998), la CGH~convencional permet la detecció de
deletions cromosòmiques majors de 10 Mb. Però diferents equips han descrit desequilibris
11

Introducció
cromosòmics críptics utilitzant aquesta metodologia. Així, Ghaffari et al.(1998) i Joly et al.
(2001) han detectat anomalies cromosòmiques críptiques en casos on les bandes G indicaven un
cariotip normal.
13
13
19
14
20
IS
Van
21
18
W- i jHúscHmni
10
Efeteï
Snift
17
22
Ca du Clat
11 12
| TrúomíalS
18
Ccffiji-
Figura 3. Microdelecions(verd) i microduplicacions(vermell) en síndromes.

Introducció
VOH
ffippèl-Lrndai
Wdf- iHinckhonú CriduChat
Langei-Giedion
13 14 15 16
10
1 Tiïsomíà13 .
ig•
^
•
© Mme*-RadetWmi/ e¿ngehtmt
•
i•
:
• . • .
g Díeler 03 Sitith «^ Magenis
11 12
MonosomU I
Monasomía
TnsonúílS
Velo ^W1" Siniroró
21 22
Coffin-Lonrry
Figura 3. Microdelecions(verd) i microduplicacions(vermell) en síndromes.
Breen et al. (1999) han demostrat que la CGH permet determinar tant l'origen de cromosomes marcadors
supernumeraris com confirmar la presencia de delecions críptiques (prèviament detectades mitjançant
FISH). Actualment, utilitzant aquesta tècnica es poden detectar delecions associades a la síndrome de
Prader-Willi/Angelman (de 3-5 Mb) però no les associades a les síndromes de DiGeorge i de Williams (1-
2Mb) (Kirschhoffetal. 2000).
U

Introducció
Breen et al. (1999) han demostrat que la CGH permet determinar tant I'origen de cromosomes
marcadors supernumeraris com confirmar la presencia de delecions críptiques (prèviament detectades
mitjançant FISH). Actualment, utilitzant aquesta tècnica es poden detectar delecions associades a la
síndrome de Prader-Willi/Angelman (de 3-5 Mb) però no les associades a les síndromes de DiGeorge i
de Williams (l-2Mb) (Kirschhoffet al. 2000).
Darrerament, la CGH d'alta resolució (High Resolution CGH, HR-CGH) se està aplicant amb èxit per la
identificació de desequilibris cromosòmics críptics en pacients amb dismorfologies i retard mental,
detectant-se una major incidència d'alteracions cromosòmiques que en el screening utilitzant sondes
subtelomèriques (Kirschhoff et al. 2001; Ness et al.2002). Es considera que la utilització d'aquesta
metodologia en els laboratoris de citogenètica permetrà, en un futur pròxim, explicar un 10% de les
alteracions del fenotip al detectar la presència d' alteracions cromosòmiques que fins ara no eren
diagnosticades.
13
Introducció
3. ALTERACIONS CROMOSÒMIQUES ADQUIRIDES EN TUMORS
SÒLIDS EPITELIALS
3.1 INTRODUCCIÓ GENERAL
Quan es parla de càncer s'està fent referència a més de 300 malalties genètiques independents
que el que tenen en comú és que s'originen per una acumulació de mutacions específiques o
canvis adquirits en el DNA (Volgelstein i kinzler,1993), i per un creixement cel·lular
descontrolat que esdevé maligne.
L' anàlisi citogenètica de les cèl·lules turnarais ha proporcionat una important informació en la
biologia del càncer. Les cèl·lules somàtiques pateixen mutacions i si aquestes evolucionen poden
induir neoplàsies. S'ha descrit la presència d' alteracions cromosòmiques clonáis (únic
progenitor cel·lular) en més de 30.000 neoplàsies humanes (Mitelman, 1998). Moltes d'aquestes
alteracions s 'han caracteritzat molecularment i han permès la identificació de nous oncogens i
gens superiors de tumors implicats en la gènesi tumoral. Així cada dia són més conegudes les
alteracions citogenètiques responsables de la transformació neoplàssica i els mecanismes
moleculars implicats. En neoplàsies hematològiques i sarcomes, l'anàlisi citogenètica constitueix
una important eina diagnostica i pronostica incorporada a la rutina del laboratori, ja que en
general una alteració específica caracteritza freqüentment una patologia. En tumors sòlids l'ús
està força més limitat degut a problemes tècnics en el cultiu de les mostres, presència de múltiples
dons cel • lulars i cariotips complexes. En particular, els tumors epitelials es caracteritzen per un
nombre elevat d'alteracions cromosòmiques complexes i cap és especifica d'un tipus de tumor
determinat. L'elevat grau d'inestabilitat genòmica en forma de nombroses alteracions numèriques
i estructurals, així com l'elevada heterogeneïtat tumoral són propietats comuns a la majoria de
carcinomes caracteritzats citogenèticament.
Una revisió sobre la freqüència i distribució dels desequilibris cromosòmics detectats amb bandes
G en 3185 tumors sòlids corresponents all tipus diferents (Mer tens et al 1997) va mostrar que
les alteracions més freqüents, eren les pèrdues dels cromosomes X,Y,4,10,13,14,15,18,22,
Ip22pter,3pl3pter,6ql4qter,8p,9p,llp i els guanys dels cromosomes 7,20,12q i 11 q. En aquest
estudi s'observava que, en general, les pèrdues eren més freqüents que els guanys .
Per altre banda, la revisió de les dades aportades per la tècnica de CGH en tumors sòlids ha
mostrat que els guanys són mes comuns que les pèrdues (Rooney et al 1999). Aquesta diferència
pot ser deguda a les dificultats d'identificació de les alteracions cromosòmiques amb bandes G en
aquells casos en que el cariotip del tumor és molt complex.
14

Introducció
Les alteracions detectades per CGH en els diferents tipus de tumors epitelials, que per altre
banda són comuns a la majoria dels tumors estudiats, són els guanys a 3q,8q,20q,lq i les
pèrdues a 8p, 13q,17p (revisat per Forozan et al. 1997). Cal destacar que la tècnica de CGH ha
premés identificar nombroses amplificacions tant en regions cromosòmiques on es localitzen
oncogens coneguts com en d'altres desconegudes fins el moment.
15

Introducció
3.2 CARCINOMA RENAL
Quan es parla de tumors renals o carcinoma de cèl·lules renals (RCC) es fa referència a
neoplàsies que sorgeixen del parènquima renal excloent els tumors de la pelvis renal i els calces.
Dintre dels tumors renals hi distingim dos grans grups: el carcinoma renal a l'adult i el tumor de
Wilms (Nefroblastoma) a l'infant. En aquest apartat només farem referència al carcinoma renal.
EPIDEMIOLOGIA
El 80% dels tumors renals són adenocarcinomes, que poden ésser de cel • lules clares amb patró
de creixement sòlid i de cèl·lules cromofíliques amb patró de creixement papil·lar. La forma
sarcomatoide representa menys del 5% dels casos, presentant pitjor pronòstic, donada la gran
tendència a desenvolupar metástasis, independent del tractament del tumor primari.
El carcinoma renal representa el 85-90% de les neoplàsies malignes del parènquima renal. Es
més freqüent en l'home (1.6 vegades) i l'edat d'aparició més freqüent és a partir dels 50-60 anys.
Distribució geogràfica
1. Incidència alta : Dinamarca , Nova Zelanda , Noruega, Escòcia.
2. Incidència intermitja: Austràlia, Bèlgica , França, Holanda, EEUU.
3. Incidència baixa: Irlanda, Itàlia, Japó, Espanya, Veneçuela.
Factors etiologies
El consum de tabac, cafè, grasses animals, l'obesitat (sobretot en dones), I 'hipertensió , alguns
tractaments amb estrogens, exposició ocupacional a productes derivats del petroli, metalls pesats,
asbest, cadmi, diòxid de tori (thorotrast), productes emprats en el curtit de la pell i exposició a
radiacions ionitzants. També s'ha relacionat amb el consum crònic d'analgèsics tipus fenacetina i
amb certes infeccions víriques (MostolfiFK, Algaba F. Et al 19909). El risc a patir càncer renal
també incrementa en pacients afectats de la malaltia quistosa renal adquirida associada a
insuficiència renal crònica i esclerosis tuberosa (revisat a Motzer et al 1996).
En la majoria dels casos, els tumors renals apareixen de forma esporàdica sense un patró
d'herència reconegut. Hi ha però formes familiars molt poc freqüents que és caracteritzen per un
patró d'herència autosòmica dominant, aparició a edat jove i tumors bilaterals i multifocals. La
Síndrome de Von Hippel-Lindau presenta una predisposició familiar a una varietat de neoplàsies
entre les que s'inclou el càncer renal de cèl·lules clares que apareix en un 40% dels pacients
amb la síndrome. El gen responsable (VHL) es localitza a 3p25-26 i codifica per una proteïna
que juga un paper important en els mecanismes de control de la tumorigènesi i angiogènesi. La
prote ïna VHL activa els mecanismes de control en les vies de degradació mediada per ubiquitina
16
Introducció
i regula negativament la síntesi de factors induïts per I'anoxia (Murata et al. Càncer Research
2002).
Altres formes familiars del carcinoma renal de cèl·lules clares s'han trobat associades a una
translocació constitucional equilibrada entre el cromosoma 3p i el cromosoma 6 o el cromosoma
8 (Cohen et al 1982, Pathak et al. 1982 NEJM). Mes recentment s'han detectat formes familiars
associades a translocacions entre 3q i els cromosomes 1 i 2 (Kanayama et al. 2001 i Bodmer et
al. 2002 respectivament). La forma hereditària del carcinoma renal de tipus papil·lar s'ha
associat a mutacions constitucionals del protoncogen MET localitzat a 7q (Schmidt et al. 1997
MARTA).
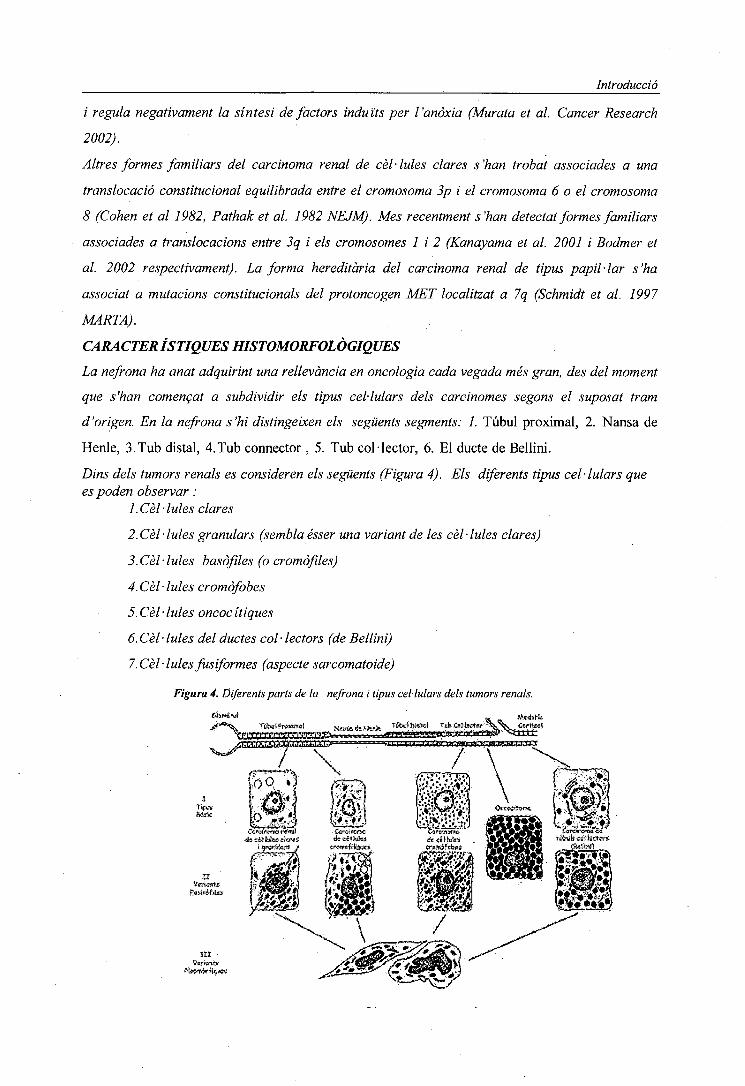
CARÀCTER ÍSTIQUES HISTOMORFOLÒGIQUES
La nefrona ha anat adquirint una rellevància en oncologia cada vegada més gran, des del moment
que s'han començat a subdividir els tipus cel·lulars dels carcinomes segons el suposat tram
d'origen. En la nefrona s'hi distingeixen els següents segments: 1. Túbul proximal, 2. Nansa de
Henle, 3.Tub distal, 4.Tub connector , 5. Tub col·lector, 6. El ducte de Bellini.
Dins dels tumors renals es consideren els següents (Figura 4). Els diferents tipus cel·lulars quees poden observar :
1.Cèl·lules clares
2. Cel • lules granulars (sembla ésser una variant de les cel • lules clares)
3.Cèl·lules basòfiles (o cromòfiles)
4. Cel • lules cromòfobes
5.Cel-lules oncocítiques
6. Cel • lules del ductes col • lectors (de Bellini)
7.Cel-Iules fusiformes (aspecte sarcomatoide)
Figura 4. Diferents parts de la nefrona i tipus cel·lulars dels tumors renals.
Introducció
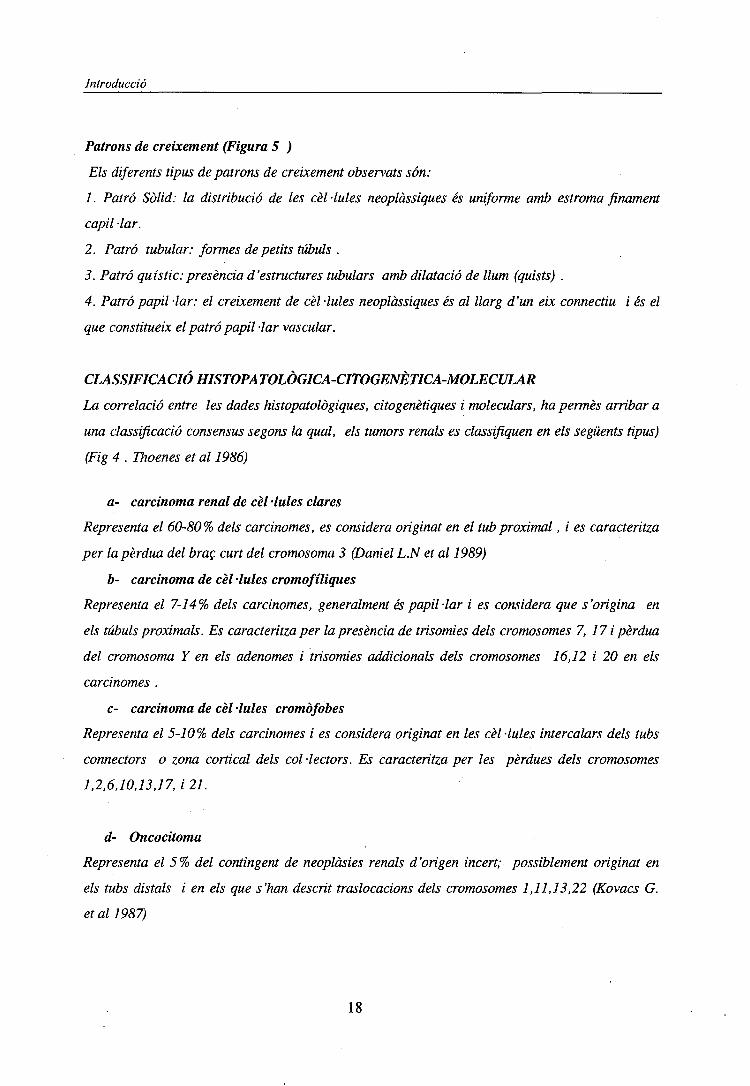
Patrons de creixement (Figura 5 )
Els diferents tipus de patrons de creixement observats són:
1. Patró Sòlid: la distribució de les cel -lules neoplàssiques és uniforme amb estroma finament
copiï -lar.
2. Patró tubular: formes de petits túbuls .
3. Patró quístic:presència d'estructures tubulars amb dilatació de llum (quists) .
4. Patró papil -lar: el creixement de cel -Iules neoplàssiques és al llarg d'un eix connectiu i és el
que constitueix el patró papil -lar vascular.
CLASSIFICACIÓ HISTOPATOLÒGICA-CITOGENÈTICA-MOLECULAR
La correlació entre les dades histopatològiques, citogenètiques i moleculars, ha permès arribar a
una classificació consensus segons la qual, els tumors renals es classifiquen en els següents tipus)
(Fig 4 . Thoenes et al 1986)
a- carcinoma renal de cel -lules clares
Representa el 60-80% dels carcinomes, es considera originat en el tub proximal, i es caracteritza
per la pèrdua del braç curt del cromosoma 3 (Daniel L.N et al 1989)
b- carcinoma de cel -lules cromofíliques
Representa el 7-14 % dels carcinomes, generalment és papil -lar i es considera que s'origina en
els túbuls proximals. Es caracteritza per la presència de trisomies dels cromosomes 7, 17 i pèrdua
del cromosoma Y en els adénomes i trisomies addicionals dels cromosomes 16,12 i 20 en els
carcinomes .
c- carcinoma de cel -lules cromòfobes
Representa el 5-10% dels carcinomes i es considera originat en les cèl·lules intercalars dels tubs
connectors o zona conical dels col·lectors. Es caracteritza per les pèrdues dels cromosomes
1,2,6,10,13,17, i 21.
d- Oncocitoma
Representa el 5% del contingent de neoplàsies renals d'origen incert; possiblement originat en
els tubs distáis i en els que s'han descrit traslocacions dels cromosomes 1,11,13,22 (Kovacs G.
et al 1987)
18

Introducció
e- Carcinoma de túbuls col -lectors (o ducte de Bellini)
Representa el 1-2% deis carcinomes i es caracteritza per la Monosomia dels cromosomes
1,6,14,15,22. A I 'igual que els carcinomes urotelials de cèl·lules transicionals, presenta
alteracions de braços llargs del cromosoma 1 (Fuzesi L. et al 1992)
f- Carcinoma fus-cel-lular o sarcomatoide
Representa el 1-10% dels tumors renals i es considera com una forma morfológica derivada deis
tipus cel -lulars anteriors (Baer S et al 1993)
oce«3Ü
Gammon | [ Papillary
*"1«
-e-10-13-17-21
Collecting duet) [ Chromophobe |
Loop of
Figura 6. Classificació histopalògica-citogenètica-molecular dels tumors renals.
19
Introducció
Ü¿ Ihi 'sSLriSaia!!.'' '"5a&' - M> ¿^ <£%•£.. j, • . ¿ , -i'%'' y - -**i J
M^%4cf%;Ssa,V^>®HlBSteSPíJ"lv '<\*f4*-C •»'^!® */l*i**ES;l-*-<v^wiri .*3y'*»» ";"í4**'tj 2l; \tífc^^J^L · W f' O
^.^I^ÏKS^^Cél.lula clara, grau III. Patró ebtid. HE x400.| Papil.lar-Cromàfil. Ûrau II. HE x20D.jpg
Xp i Pl - ^@^5«iátóe!A«
Cromòfbb. Grau II. Uncacltoma. 31. HE x2UO.jpg
C.Barooenstaitfe, glV. HE x200.jog
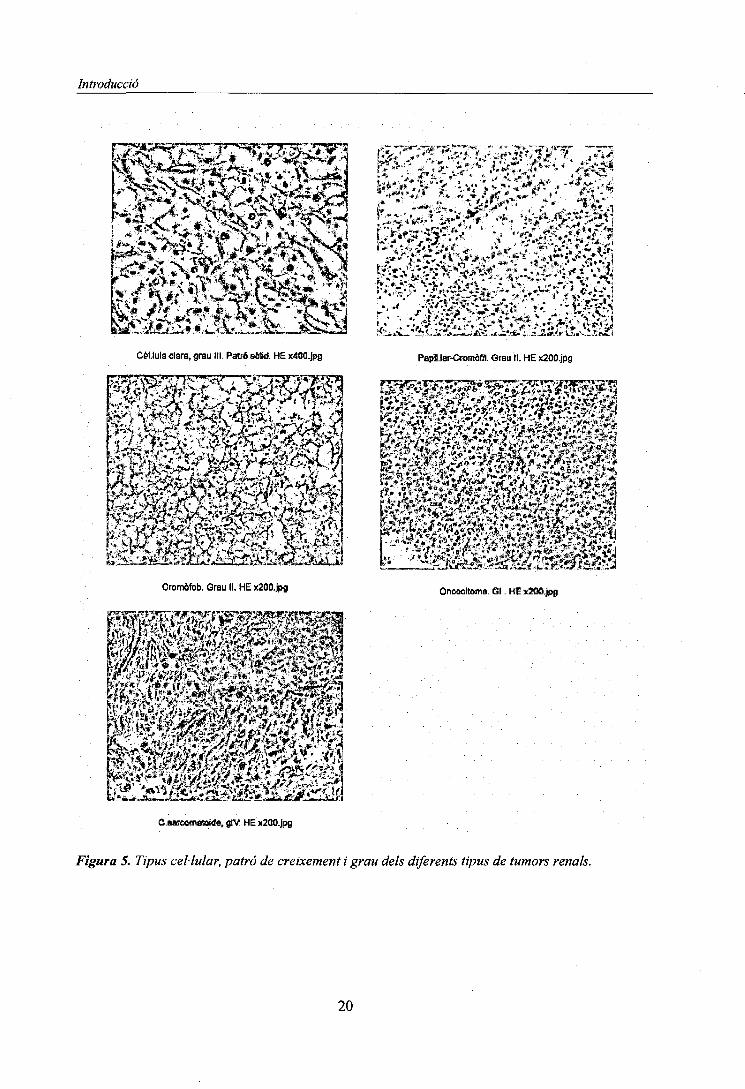
Figura 5. Tipus cel·lular, patró de creixement i grau dels diferents tipus de tumors renals.
20
Introducció
GRAU I ESTADI
El grau de diferenciació nuclear i l'estadi d'extensió dels tumors s'utilitzen com a factors de
pronòstic.
En els RCC s'estableix el grau respecte a la atípia nuclear incloent la mida del nucli, el seu
contorn i la presència i visibilitat del nucleol.
Actualment d'acord amb la classificació de Fuhrman, es distingeixen 4 graus (Gl, G2, G3,
G4).(Fig5).
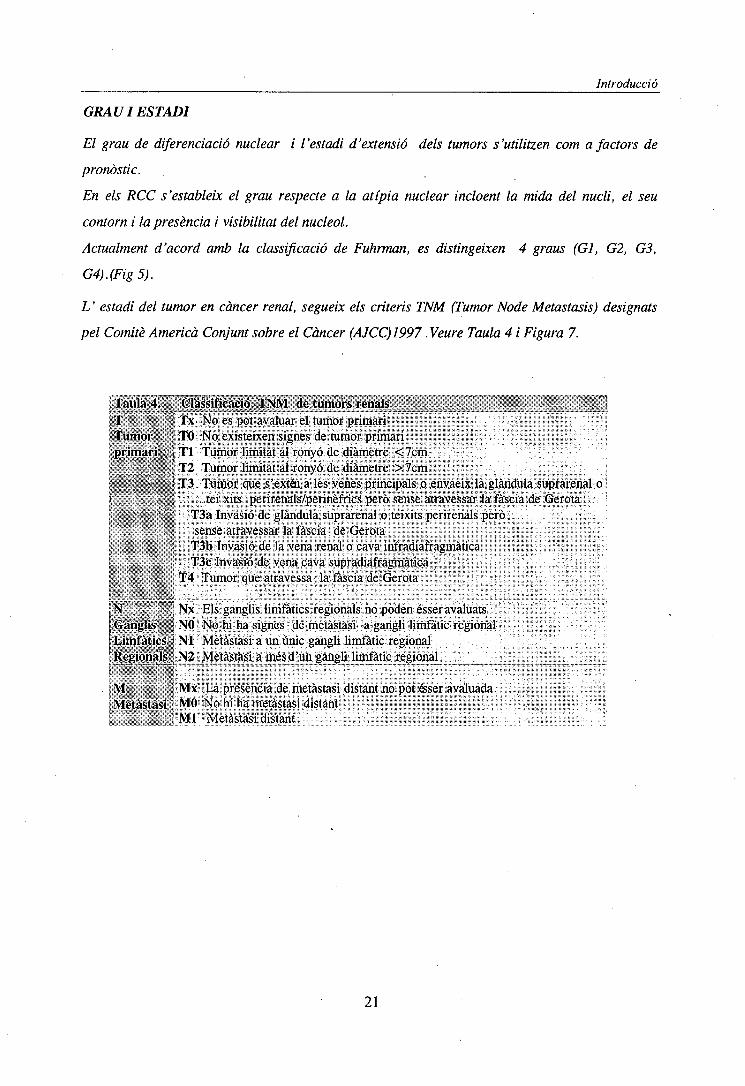
L ' estadi del tumor en càncer renal, segueix els criteris TNM (Tumor Node Metastasis) designats
pel Comitè Americà Conjunt sobre el Càncer (AJCC) 1997 .Veure Taula 4 i Figura 7.
Taula 4. f Classificació TNM de tumors renalsT Tx No es pot avaluar el tumor primari
; Tumor : . ' TO No existeixen signes de tumor primari;: primari*&'<| Tl Tumor limitat al ronyó de diàmetre <7cmi H-T2 Tumor limitat al ronyó de diàmetre > 7cm ,I "* ¿'-f'.v!-i| T3 Tumor que s'extói a les venes principals o envaeix la glàndula suprarenal oI - j teixits perirenals/perinèfrics però sense atravessar la fàscia de Gerota: . v '•:'; T3a Invasió de glàndula suprarenal o teixits perirenals però
. .; ; sense atravessar la fàscia de Gerota: T3b Invasió de la vena renal o cava infradiafragmàtica
: T3c Invasió de vena cava supradiafragmàtica; . T4 Tumor que atravessa la fàscia de Gerota
iÑ . V ,. '!) Nx Els ganglis limfàtics regionals no poden ésser avaluats¡.(Ganglis11 NO No hi ha signes de metàstasi a gangli limfàtic regional.Limfàtics ' NI Metàstasi a un únic gangli limfàtic regionalRegionalst, N2 Metàstasi a mésd'un gangli limfàtic regional
M MX La presència de metàstasi distant no pot éser avaluadaMetàstasi MO No hi ha metàstasi distant
, Ml Metàstasi distant
21

Introducció
Escorça
Médula
Pelvis Renal
Figura 7, Imatges d'estadis d'invasió dels tumors renals.
22
Introducció
ESTUDIS CITOGENETICS
Tal i com s'ha indicat anteriorment, la citogenètica permet la classificació dels tumors renals
respecte les seves diferències genotípiques. A més, les dades citogenètiques mostren un patró
d'evolució en aquests tumors que proporciona informació rellevant sobre el pronòstic de la
malaltia.
De forma general podem dir que en aquells casos en que no es produeix una regressió de les
cèl·lules embrionàries, aquestes poden desenvolupar un tumor renal papil·lar amb l'aparició de les
trisomies 7 i 17 i la pèrdua del cromosoma Y. En el .procés de transformació d'adenoma a
carcinoma està implicat el guany de determinades regions cromosòmiques tal com les trisomies 8,
12, 16 i 20 i la duplicació de 3q. El guany de lOq estaria relacionat amb la transformació
sarcomatoide i la pèrdua de 3p21 s'ha observat en alguns RCC papil·lar s que evolucionen cap a la
forma mes maligna de RCC de cèl·lules clares, reflectint una relació més estreta entre aquestes
dues formes de carcinomes renals. Per altre banda , un subtipus de carcinoma renal papil·lar es
caracteritza per translocacions equilibrades implicant a la regió Xpll.2.
L'estudi d'aquests tumors mitjançant CGHha mostrat que a més dels guanys observats amb bandes
G, apareixen de forma freqüent guanys a 5q ipèrdues de Ip, 4q,6q,9p,13q i Y.
El carcinoma renal de cèl·lules clares es caracteritza per la pèrdua de 3p (per translocació
desequilibrada, delectó o monosomia 3) o alteracions moleculars que afecten a 3p. Un augment de
desdiferenciació nuclear (GI>GH) s'acompanya de guanys del cromosoma 5q, 7 i 10. Pèrdues dels
cromosomes 6q, 8p, 14q i 9 apareixen durant la progressió. Els estudis amb CGH coincideixen
amb els de citogenètica convencional mostrant la pèrdua de 3p com alteració més freqüent seguida
de pèrdues als cromosomes 9p, 13q, 6q i guanys a 5q .
Els oncocitomes són citogenèticament heterogenis. Un grup es caracteritza per la translocació
recíproca t(5;ll)(q35;ql3) que implica gens que codifiquen enzims de la cadena respiratòria del
mitocondri. Un altre grup es caracteritza per la pèrdua del cromosoma 1 i per la presència
d'associacions telomèriques. La pèrdua de material del cromosoma 1 és l'alteració més freqüent
detectada per CGH en oncocitomes. Altres alteracions freqüentment detectades amb aquesta
tècnica són pèrdues implicant al cromosoma 14 i als cromosomes sexuals .
El carcinoma de cèl·lules cromòfobes presenta la pèrdua de material cromosòmic més abundant
coneguda en un tumor. La forma més típica es caracteritza per múltiples monosomies (-1, -2, -6, -
10, -13, -17, -21, i -Y) que s'han confirmat per citogenètica convencional, FISH i CGH.
23
Introducció
L'estudi de les proliferacions epitelials atípiques en la malaltia de quists renals adquirits ha
mostrat la presencia d'aneuploïdies afectant als cromosomes 7, 17, 12 i 20 en diferents tipus de
lesions. Aquest descobriment indica que aquestes proliferacions poden considerar-se com a lesions
neoplàstiques primerenques ( Cheuk et al 2002).
A continuació fem un breu resum d'alguns dels estudis citogenètics i moleculars que s'han portat a
terme en carcinomes renals i la correlació amb cada un dels tipus i subtipus establerts fins al
moment.
CARCINOMA RENAL DE CEL -LULES CLARES
Pèrdua de 3p
Es l'alteració més característica
_ En algunes formes familiars rares, s'han descrit translocacions constitucionals equilibrades
implicant 3pl2p-14 (Cohen et al. 1979, Pathak et al. 1982; Kovacs et al. 1989, Dol Cin et al
1996). Observant-se, en els tumors, la pèrdua parcial de 3p per desequilibri de la translocació.
_ La pèrdua de 3p s'observa també en estudis citogenètics de tumors esporàdics (Yoshida et al.
1986, Kovacs et al. 1987).
_ Detecció d'una translocació constitucional t(l;3)(q32-41;ql3-21) en una família amb RCC de
cel -lules clares (Kanayama et al. 2001)
_ Translocació constitucional t(2;3)(q35;q21) en una família amb RCC. Caracterització de la
regió 3ql3-q22 (Bodmer et al. 2002 a).
_ Caracterització del gen DIRC2 localitzat a 3q21 i afectat pel trencament de la translocació
familiar t(2;3) (q35;q21) (Bodmer et al. 2002 b).
_ Gen DIRC2 afectat per la translocació constitucional t(2;3) (q35;q21) no es troba associat al
desenvolupament del tumor (Bodmer et al. 2002)
Detecció del gen TRC8 localitzat al cromosoma 8 i que es interromput per la t(3; 8) (Gemmill et
al. 2002)
_ Delecions i pèrdues al·lèliques a 3p (Tajara et al. 1988, Kovacs and Frisch 1989, Van den
Berg et al.1993; Presti et al. 1993;Iqbal et al. 1996)
Introducció d'un 3p en línia cel·lular establerta a partir d'un carcinoma d'aquest tipus
modera la tumorigenicitat d'aquestes cèl·lules ( Shimizu et al. de polimorfismes en la mida de
fragments de restricció RFLP i amplificació de microsatel -lits per PCR, han mostrat la pèrdua de
diferents regions d'aquest braç cromosòmic: 3pl2, 3pl3-pl4.2, 3p21-24, 3p25-26 en més del 97%
des casos (Yamakawa et al. 1991;Van der Hout et al. 1993; Lubinski et al. 1994; Foster et al.
24
Introducció
1994; Wilhelm et al. 1995; Van der Berg et al.1996; Chudek et al. 1997). Pèrdues al·lèliques en
els loci 3pl4.3-3p24.3 s'han detectat en més de 97% dels casos.
_ Pèrdua de 3p detectada per CGH en el 63 % dels casos (Reutzel et al. 2001)
Detecció de tres regions critiques per la localització de gens supressors a 3p: regió 3p26.1-
p25.3, 3p25-p24.3, 3p21.3 (Braga étal 2002)
_ El gen VHL (malaltia Von Hippel- Lindau) és, de moment, l'únic gen associat a carcinomes
renals de cel -Iules clares. Aquest gen amb locus a 3p25p-26 va ser identificat per estudis de
lligament en pacients afectats per la síndrome i ha estat proposat com a gen supressor de
tumors. Mutacions del gen VHL s'han trobat en el 50% de carcinomes de cèl·lules renals no
papil -lars (Gnarra et al. 1994, Kench et al. 1996)
Estudis de tumors renals en pacients amb la síndrome de V on Hippel-Lindau indiquen que els
tumors de baix, grau amb nombre cromosòmic pròxim a diploide, es caracteritzen per
translocacions recíproques, dicèntrics i/o isocromosomes i aneuploïdies. Els tumors d'alt grau i
les seves metàstasi ganglionars son altament aneuploids i presenten translocacions equilibrades
que impliquen la pèrdua de 2q, 3p, 4q, 9p, 14q, i 19p (Philips et al. 2001)
Les mutacions en VHL gen estan relacionades amb RCC de cel -Iules clares i poden ocórrer
com a canvis en l'inici del tumor i com canvis tardans (Kondo et al. 2002)
Les delecions a 3p amb punts de trencament pròxims al locus de VHL es troben en el 90% dels
tumors i fa pensar que altres gens localitzats a 3p estan implicats a la tumorigènesi renal.
El gen FHIT (Ohta et al. 1996 està localitzat en el punt de trencament de la t(3;8)(p!4.2;q24)
dels tumors dels individus de la família descrita per Cohen I 'any 1979. Bugert et al. (1997) van
descartar la implicació genètica de la regió que conté aquest gen en la tumorigènesi renal.
_ Més recentment, s'han observat canvis en l'expressió del gen FIHT durant la progressió del
tumor suggerint un paper que el mecanisme de canvis reversibles en la inactivació d'aquest gen
pot tenir un paper durant l'inici i progressió del RCC de cel -Iules clares (Romp et al. 2002)
_ S'han analitzat regions crítiques de pèrdua a 3p21.3, localitzant almenys tres loci candidats a
supressors relacionats amb càncer renal, càncer de cèl·lules microcítiques de pulmó i càncer
colorectal (Braga et al. 2002)
Guany 5q
És l'alteració més freqüent desprès de la pèrdua de 3p (Kovacs and Frisch 1989, Van den Berg et
al.1993; Presti et al 1991; Moch et al. 1996)
-Guany de 5 detectada per CGH en el 63% dels casos. Es correlaciona amb baix grau (Reutzel
et al. 2001)
25
Introducció
-Amplificació de 5q23q-33 detectada per CGH (Yang et al. 2000)
Guany 7
-S'ha detectat de forma freqüent per citogenètica convencional(Kovacs and Frisch 1989, Van den
Berg et al. 1993; Presti et al. 1991; Moch et al. 1996)
-S'ha detectat de forma freqüent per citogenètica convencional(Kovacs and Frisch 1989, Van den
Berg et al.1993; Presti et al 1991; Moch et al. 1996)
-Guany del 7 detectada per CGH en el 35% dels casos (Reutzel et al. 2001)
-Amplificado de 7q22-qter (Yang et al. 2000)
Pèrdua Y
És freqüent i es troba associada a la pèrdua de 3p (Dal Cin et al. 1996)
Pèrdua de Y detectada per CGH en el 7% dels casos (Reutzel et al. 2001)
Perdues de 14q
-Reorganitzacions del cromosoma 14. Un 70% d'aquestes són monosomies del cromosoma 14
(Béroud et al. 1996)
-Pèrdua de 14q en un 54% dels casos analitzats per CGH (Yang et al. 2000)
-Pèrdua de 14q detectada per CGH en el 30% dels casos (Reutzel et al. 2001)
-Estudis moleculars relacionen la LOH de 14q amb agressivitat tumoral (Mitsumori et al. 2002)
Pèrdues de 6q,8p
-Pèrdua de 6/6q detectada per CGH en el 17% dels casos cada una d'elles (Reutzel et al. 2001)
-Pèrdua de 8/8p detectada per CGH en el 15% dels casos cada una d'elles(Reutzel et al. 2001)
Pèrdua del cromosoma 9
-L'estudi de pèrdues al·lèliques en el cromosoma 9 ha delimitat dues regions d'aquest
cromosoma que contenen gens candidats a supressors de tumors a 9p21p-22 i 9q33-qter (Cairns
et al. 1995)
-Estudis de LOH indiquen que la pèrdua mes freqüent es a 9q22 on es localitza el gen PTCH
(patched) (Fukunaga et al. 2002)
-Gen CDKN2/pl6 localitzat a 9p21 es un gen candidat a gen supressor de tumors, la pèrdua dels
seus al·lels s'ha detectat en diverses línies cel·lulars tumorals (Cairns et al. 1995, Noborí et
al.1994, Kamb et al. 1995 )
-Pèrdua de 9 detectada per CGH en el 26% dels casos (Reutzel et al. 2001)
-La pèrdua del 9 es mes freqüent en tumors metastàsics (Junker et al. 2000)
-La pèrdua del gen Kank ( Kidney ankyrin repeat-containing protein) localitzat a 9p24 pot estar
relacionada amb la carcinogènesi renal (Sarkar et al. 2002)
26
Introducció
Pèrdua 17p
- La freqüència de mutació del gen p5 3 (localitzat a 17pl3) en carcinomes de cèl·lules renal és
molt baixa. (Uchida et al. 1994) - Les mutacions del genp53 que donen lloc a una sobreexpressió
de la proteïna estan estretament lligades a la transformació sarcomatoide dels carcinomes de
cel -lules renals.
-Pèrdua de 17p detectada per CGH en el 7% dels casos (Reutzel et al. 2001)
-La pèrdua del 17 es mes freqüent en tumors metastàsics (Junker et al. 2000)
Altres Alteracions
-Guany de Iq detectada per CGH en el 33% dels casos (Reutzel et al. 2001)
-Pèrdua de 1 detectada per CGH en el 17% dels casos (Reutzel et al. 2001)
-Pèrdua de 2/2q detectada per CGH en el 17% dels casos en cada una d'elles (Reutzel et al.
2001)
-Guany de 3q detectada per CGH en el 17% dels casos (Reutzel et al. 2001)
-Pèrdua de 4 detectada per CGH en el 17% dels casos, correlaciona amb estadis avançats
(Reutzel et al. 2001)
-Pèrdua de 4q en el 62 % dels casos estudiats per CGH (Yang et al. 2000)
-Amplificació de 4ql2(Yang et al. 2000)
-Guany de 8/8q detectada per CGH en el 20% dels casos (Reutzel et al. 2001)
-Amplificació de 8q23q24 (Yang et al. 2000)
-Guany de 10 detectada per CGH en el 9% dels casos correlaciona amb alt grau (Reutzel et al.
2001)
-Pèrdues de 7q, 10, 16, 18 detectada per CGH en el 7% dels casos cada una d'elles (Reutzel et
al. 2001)
La inactivació del gen supressor PTEN/NMAC1 localitzat a 10q23 es detecta en un 37,5% dels
tumors i es relaciona amb progressió (Velickovic et al. 2002)
- Pèrdua de heterocigozitat del gen PTEN/NMAC1 s'associa a mal pronòstic (Velickovic et al.
2002)
La pèrdua dels cromosomes 10, 18 es mes freqüent en tumors metastàsics (Junker et al. 2000)
Amplificació de 12 p i 12ql3q22 (Yang et al. 2000)
-Guanys de 12, 20 detectada per CGH en el 20% dels casos (Reutzel et al. 2001)
-Guany de 17q detectada per CGH en el 11% dels casos correlaciona amb alt grau ( Reutzel et
al. 2001)
-Pèrdua de 22 detectada per CGH en el 11 % dels casos (Reutzel et al. 2001)
11
Introducció
CARCINOMA RENAL PAPIL -LAR
Subtipus 1. Adenoma: + 7, +17, -Y
Carcinoma: +7, +17, -Y, +12, +16, +20
-Proto-oncogen MET localitzat a 7q31.2q-31.3. Estudis de lligament realitzats a famílies
afectades de carcinomes renals papil -lars hereditaris ha permès identificar les alteracions del
gen MET com a responsable d'aquests tipus de tumors (Schmidt et al. 1997)
-S'observa guany del cromosoma 7portador de la copia mutada del MET en els tumors (Zhuang
et al. 1998)
-La sobrexpressió del MET es relaciona amb comportament agressiu del tumor (Sweney et al.
2002)
-Guany de 7 i 17 detectada per CGHen el 50% dels casos (Reutzel et al. 2001)
-Guany de 16 i 20 detectada per CGHen el 15% dels casos (Reutzel et al. 2001)
-Estudis moleculars de desequilibris al ièlics indiquen que la LOH a 17q i 9p es mes freqüent en
el subtipus 1 que en el 2 (Sanders et al. 2002)
-Amplificació a 2q22q33, 16q, 17qi X detectada per CGHen un tumor (Reutzel et al. 2001)
-Pèrdues de 2, 4, 6 i 13 detectada per CGH en el (2/15% dels casos cada una d'elles
(Reutzel et al. 2001)
-La inactivació del gen supressor PTEN/NMAC1 es detecta en un 29,6% dels tumors (Velickovic
et al. 2002)
-Pèrdues de 1, 14, 15 i Y detectada per CGH en el (3-15% dels casos cada una d'elles
(Reutzel et al 2001)
Subtipus 2.
Translocacions del cromosoma Xpll.2
-S 'ha detectat la translocació en diversos tumors: t(X;l)(pll.2;q21.2) (Yoshida et al. 1985;
DeJong et al. 1986; Tomlinson et al. 1991; Meloni et al. 1992,i 1993; Dijkhuizen et al. 1995)
- es van identificar gens localitzats al punt de trencament de la t (X;l)(pll.2;q21.2) present en 3
carcinomes papil -lars (Sidhar et al .1996). Aquesta translocació dona lloc a un gen nou que resulta de la
fusió de dos gens (Weterman et al. 1996): PRCC (papil-lar renal celi carcinoma) ubicat a Iq21.2 i TFE3
localitzat a Xpll.2 (la proteïna codificada per aquest gen es un factor de transcripció). El gen quimèric
resultant te absència dels transcrits normals de TFE3 i per tant te molta importància en el control
transcripcional del desenvolupament de carcinomes renals. El gen de fusió PRCC-FE3 actua de
forma negativa sobre la formació del fus mitòtic (Bodmer et al. 2002).
28

Introducció
-S 'ha detectat la del (X) (pli) en una metàstasi (Ohimi 1993).
CARCINOMA DE CÈL·LULES CROMOFÒBES
Pèrdues dels cromosomes 1, 2, 6, 10, 13, 17 i 21
S'han trobat múltiples pèrdues en mes de 90% dels tumors (Kovacs A, et al. 1992) Es
caracteritzen per presentar una població cel -Ma principal que mostra una pèrdua important de
cromosomes sencers ponant a les cèl·lules a una situació d 'hiperhaploïdia (Kovacs et dl.
1988, 1992, Van der Berg et al 1993, Shuin et al. 1995; Iqbal et al.1996).
-Descobriment d'un nou gen (BHD) relacionat amb el síndrome de Birt-Hogg-Dube, el
oncocitoma i RCC de cel iules cromòfobes (Nickerson et al. 2002)
-La inactivació del gen supressor PTEN/NMAC1 es detecta en un 87,5% dels tumors
(Velickovic et al. 2002)
Tendència a formar associacions telomèriques (TAS). S 'observen associacions telomèriques,
que afecten a diferents cromosomes a les metafases d'un mateix tumor. Aquest fet reflecteix que
es tracta d'un tipus específic d 'inestabiltat cromosòmica i no una alteració clonal. Això
significa que les associacions telomèriques són esdeveniments secundaris durant el procés de la
tumorígènesi i no primaris. (Kovacs et al.1992, Van den Berg et al. 1993)
ONCOCITOMA
Amb mes freqüència són benignes però també existeix algun maligne (Psihramis et al.1986; 1988)
Subtipus 1: Caracteritzat per: -1 -Y en homes i -1 -X en dones (Psihramis et al.1988; Miles
et al. 1988; Crotty et al. 1992, Dobin et al. 1992, Meloni et al. 1992, Van den Berg et al. 1995;
Dal Cin et al .1996; Brown et al. 1996)
Subtipus 2: Caracteritzat per la translocació del cromosoma 11, t(ll;ll)(ql2ql3) (Walter et al.
1989; Presti 1991, Van der berg et al. 1995; Dukhuizen et al. 1997)
Altres alteracions
-Pèrdues de:lp, 3p, 14q
-S'ha detectat MONOSOMIA DEL CROMOSOMA 14
- CGH d'aquests tumors corrobora les alteracions detectades amb citogenètica convencional
-Descobriment d'un nou gen (BHD) relacionat amb el síndrome de Birt-Hogg-Dube, el
oncocitoma i RCC de cel -Iules cromòfobes (Nickerson et al. 2002) .
Tendència a formar TAS'(Associacions telomèriques).
29

Introducció
CARCINOMES DEL DUCTE DE BELLINI
- Són tumors rars. Hi ha 7 casos analitzats (Davis et al. 1995,Rumpelt HJ 1991, Fleming et al
1986,Fuzesi 11992)-Les alteracions citogenètiques no estan del tot dares. S'han observat perdues
a 1, 6, 8p, 14, 15, 22 i guanys a 7, 12, 16, 17, 20 .
30
Introducció
3.3 TUMORS DE LES VIES URINÀRIES
Tota la via urinària (calces, pelvis, urèters, bufeta i uretra) constitueix una unitat morfofuncional,
amb un comportament oncològic similar, pel que de forma conceptual pot considerar-se com a
únic òrgan. Les neoplàsies de les diferents zones difereixen en la seva incidència (90% bufeta,
5.7% uretra,2.4% a pelvis renal, 2.1% urèter) i per tant a la repercussió clínica. Tot i que en la
major part d'aquest apartat ens referirem al tumor de bufeta, les dades poden extrapolar-se als
altres tipus de tumors urotelials.
CÀNCER DE BUFETA
La majoria (90-95%) s'originen en l'epiteli transicional. Es tracta d'una malaltia crònica amb un
curs clínic variable, la seva tendència a la recidiva i progressió obliguen a un seguiment
diagnòstic i terapèutic permanent.
EPIDEMIOLOGIA
El càncer de bufeta representa el 8,8% de tots els tumors malignes, essent el cinquè tumor
maligne més comú en barons i el segon tumor en freqüència dins del sistema urinari després del
càncer de pròstata. A Espanya es diagnostiquen prop de 8.000 nous casos de càncer de bufeta a
l'any i 3000pacients moren d'aquesta malaltia.
La incidència màxima es troba al final de la sexta dècada (67-70 anys.), essent més freqüent en
barons,que en dones (2.7/1). Encara que s'està constatant un augment gradual de la incidència
en pa ïsos industrialitzats, la mortalitat es manté estable degut a que el augment es fa a expenses
de les formes superficials del tumor (amb millor pronòstic), diagnòstic precoç i optimització dels
tractaments.
Distribució geogràfica
Incidència alta: Dinamarca, Israel
Incidència intermitja : Escòcia, Noruega, Suècia, Nova Zelanda, Espanya
Incidència baixa: Finlàndia i Singapur
31
Introducció
Factors etiologies
El càncer de bufeta representa un dels primers tumors que es va relacionar amb el mon laboral,
l'any 1895, Rehn va publicar casos de treballadors amb contacte amb tints d'anilina. S'estima
que a les poblacions occidentals, el consum de tabac causa almenys el 50% dels tumors de bufeta
i les exposicions ocupacionals entre el 10 i el 20% (Silverman 1996, Kogevinas 1998, Mannetje
1999, Serra 2000).
Els únics agents específics que, deforma inequívoca, han estat associats amb un excés de risc de
càncer de bufeta són les amines aromàtiques (bencidines, 4-aminobifenil, b-naftilamina) i els
hidrocarburs poliaromàtics. Les dues principals fonts d'exposició a amines aromàtiques són les
laborals (indústria de la surera, producció de colorants, indústria tèxtil, tints i d'altres) i el
consum de tabac, trobant-se els nivells més alts en el tabac negre.
Altres factors de risc potencials ( revisat per Silverman 1996) són:
-1'exposició a determinants contaminants de l'aigua potable (incloent principalment el conjunt de
compostos organo-clorats que es formen durant la clorado de l'aigua com els trihalometans i
l'arsènic), la dieta, el consum total de líquids, el fum ambiental del tabac i la contaminació
atmosfèrica.
-Les infeccions, especialment l'infecció crònica por Schistosoma Haematobium, (esquistosomiasi)
en relació a carcinomes escamosos; el virus del papiloma humà com a factor predisposant esta en
fase d'estudi.
-Alguns medicaments com la ciclofosfamida (el seu metabolit. anomenat acroleina produeix
ulcerado, hemorràgia i neovascularització de l'uroteli, que augmenta nou vegades el risc de
desenvolupar un càncer vesical quasi sempre infiltrant). El consum elevat defenacetina o d'altres
com l'acetaminofen.
-La irradiació pélvica, sobretot en dones tractades amb radioteràpia per carcinoma de cèrvix.
-Altres patologies mèdiques associades així com els antecedents familiars de càncer (Silverman
1996).
Com a factors de predisposició endògena s'ha observat una certa associació amb la capacitat
d'acetilació.
32
Introducció
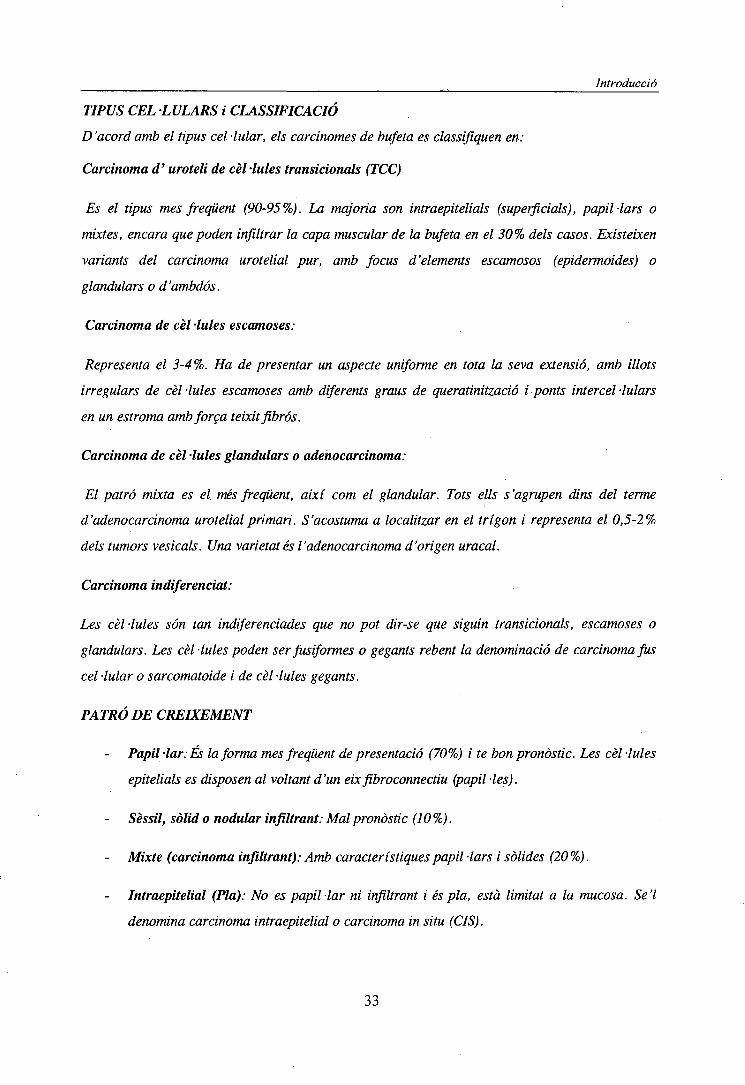
TIPUS CEL -LULARS i CLASSIFICACIÓ
D'acord amb el tipus cel -lular, els carcinomes de bufeta es classifiquen en:
Carcinoma d'uroteü de cèl·lules transicionals (TCC)
Es el tipus mes freqüent (90-95%). La majoria son intraepitelials (superficials), papil·lars o
mixtes, encara que poden infiltrar la capa muscular de la bufeta en el 30% dels casos. Existeixen
variants del carcinoma urotelial pur, amb focus d'elements escamosos (epidermoides) o
glandular s o d'ambdós.
Carcinoma de cel -lules escamases:
Representa el 3-4%. Ha de presentar un aspecte uniforme en tota la seva extensió, amb illots
irregulars de cel -lules escamases amb diferents graus de queratinització i ponts intercel -lulars
en un estroma amb força teixit fibrós.
Carcinoma de cel -lules glandulars o adenocarcinoma:
El patró mixta es el més freqüent, així com el glandular. Tots ells s'agrupen dins del terme
d'adenocarcinoma urotelial primari. S'acostuma a localitzar en el trígon i representa el 0,5-2%
dels tumors vesicals. Una varietat és l'adenocarcinoma d'origen uracal.
Carcinoma indiferenciat:
Les cel -Iules són tan indiferenciades que no pot dir-se que siguin transicionals, escamases o
glandulars. Les cèl·lules poden ser fusiformes o gegants rebent la denominació de carcinoma fus
cel -lular o sarcomatoide i de cel -Mes gegants.
PATRÓ DE CREIXEMENT
Papil-lar: És la forma mes freqüent de presentació (70%) i te bon pronòstic. Les cèl·lules
epitelials es disposen al voltant d'un eix fibroconnectiu (papil -les).
Sèssü, sòlid o nodular infiltrant: Mal pronòstic (10%).
Mixte (carcinoma infiltrant): Amb característiques papil -lars i sòlides (20%).
Intraepitelial (Pla): No es papil -lar ni infiltrant i és pla, està limitat a la mucosa. Se 7
denomina carcinoma intraepitelial o carcinoma in situ (CIS).
33
Introducció
GRAU i ESTADI
Els principals factors pronòstics del carcinoma de bufeta, són la profunditat de l'invasió a la
paret de la bufeta i el grau de diferenciació tumoral
Respecte al grau, La OMS y la UICC prefereixen una classificació basada en l'anaplàsia
segons la qual es distingeixen tres graus:
Grau I (baix o diferenciat), amb cèl·lules de lleugera anaplàsia, el 4,4% progressaran
en grau o estadi en posteriors recidives.
Grau II (mitjà o moderadament diferenciat), cèl·lules amb moderada anaplàsia,
progressen el 12%.
Grau III (alt o pobrament diferenciat), amb marcada anaplàsia (atípia cel·lular),
progressen el 62%.
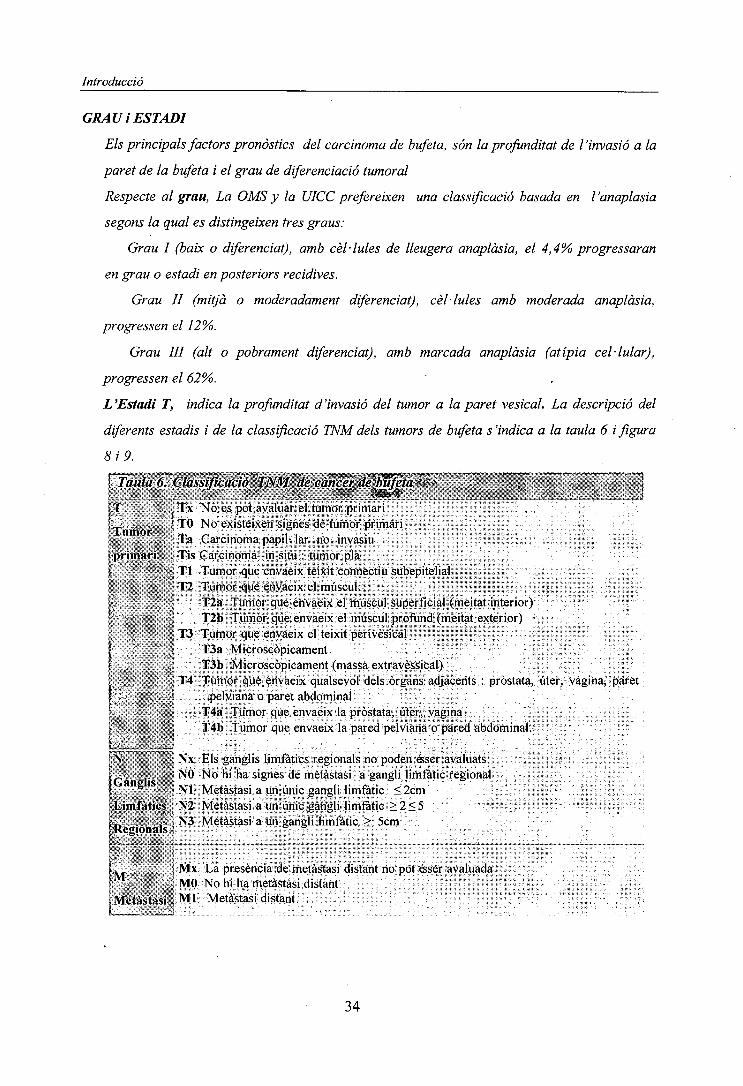
L'Estadi T, indica la profunditat d'invasió del tumor a la paret vesical. La descripció del
diferents estadis i de la classificació TNM dels tumors de bufeta s'indica a la taula 6 i figura
8 i 9.
ÇT^úla6.\Clàssiflca£Í^f^M^ecà^^f^a'^^^Mí'^^ . ' . --f ' - '4-| """,.; * : • . * • ' ' {
[T . , Tx No es pot avaluar el tumor primari• . ... I TO No existeixen signes de tumor primari
Tumor " _ _, ., . . .Ta Carcinoma papil- lar no invasiu
| primari ', Tis Carcinoma in situ : tumor pla| ' '.- Tl Tumor que envaeix teixit connectiu subepitelial; T2 Tumor que envaeix el múscul:1." , j T2a Tumor que envaeix el múscul superficial (meitat interior)
T2b Tumor que envaeix el múscul profund (meitat exterior)' T3 Tumor que envaeix el teixit perivèsicalI . í T3a Microscòpicamenti , T3b Microscòpicament (massa extravèssical)
(: j T4 Tumor que envaeix qualsevol dels òrgans adjacents : pròstata, úter, vagina, paret
v ; - • - pelviana o paret abdominalT4a Tumor que envaeix la pròstata, úter, vagina
j • ' ; T4b Tumor que envaeix la pared pelviana o pared abdominal.
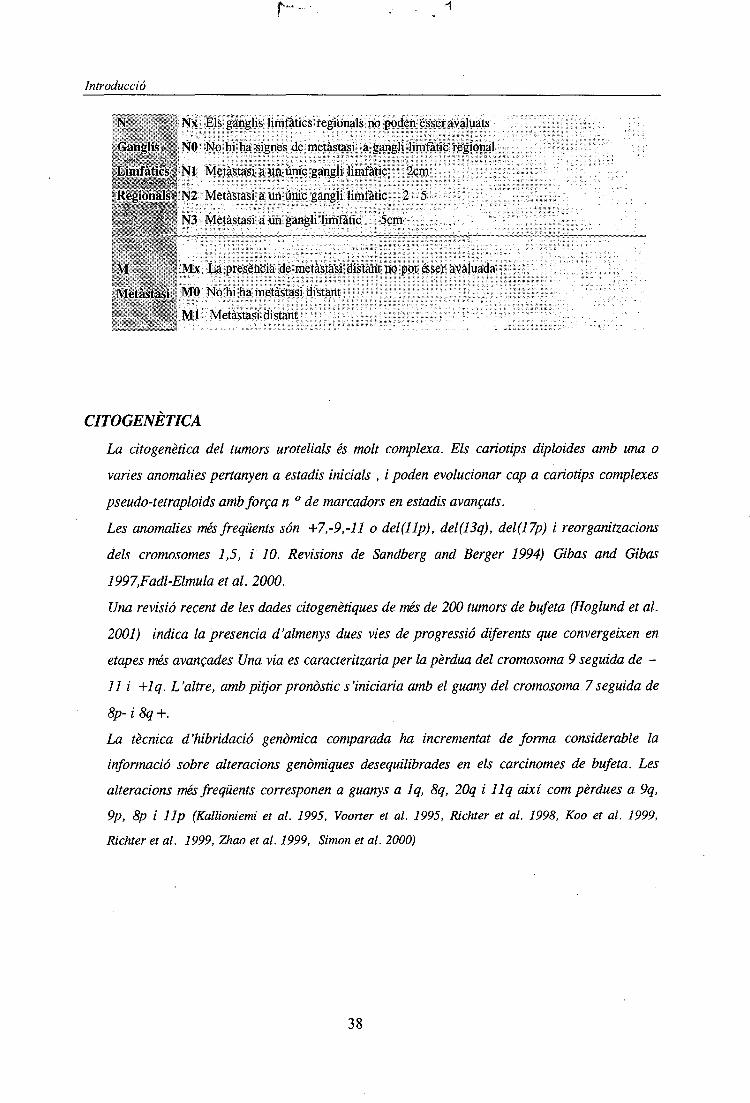
^N , NX Els ganglis limfàtics regionals no poden ésser avaluats
I - • NO No hi ha signes de metàstasi a gangli limfàtic regional, NI Metàstasi a un únic gangli limfàtic <2cm
f Limfàtics N2 Metàstasi a un únic gangli limfàtic > 2 < 5t»-,- • i- s N3 Metàstasi a un gangli limfàtic > 5cmf Regionals ï
Ï l MX La presència de metàstasi distant no pot ésser avaluada' - ' , MO No hi ha metàstasi distant, Metàstasi : Ml Metàstasi distant
34

Introducció
plis pTa pT1 pT2 pT3a pT3b
iiiiiiiiiiiiiiiiiiiiiiiiiiiiiiiniiiiniisuperficial muscle
other organs bladder cancer
Figura 8. Estadis d'invasió dels tumors de cèl·lules transicionals de bufeta
Epitelitransitional
Làmina pròpia
Músculsuperficial
Teixit perivèsic
^^J .J.** 'A- "':¿**a .'.'' if'"^iF'•.•-••RSiïfítjfòftr* í**- í*^^-.-/' ' •:.<>">'" " " ''Ul
r5^^?^ • • ..A • üsX :• ^^w"í~- ¿f .SjO* -,M» X;/-.:1*, ¿w!>r" i1* 7*vSf, •Vi·*T 4' *"~:'
^^*.* - , - -
Serosa
0.5mm
Figura 9. Secció transversal. Morfologia bufeta(Adap.Junfisl999)
35

Introducció
HISTORIA NATURAL
Tumor Vesical Superficial.
El 75-80% dels tumors de bufeta es presenten inicialment com un tumor superficial. La seva
evolució es difícil de predir i amb el temps, entre el 50-88% presenten recidives. Encara que la
gran majoria mantenen el mateix grau i el mateix estadi que el tumor inicial, al voltant del 10-
30% dels pacients amb recidiva presenten infiltració muscular.
La probabilitat de progressió (invasió muscular) d'un tumor superficial papil -lar es per terme mig
d' un 12% als 5 anys, oscil·lant entre un 4-6%per els tumors d'estadi Ta, del 29%per els Tl,
un 40% per els Tl G3 i un 60-80% per aquells que tenen associat un CIS multifocal.
Tumor vesical infiltrant
Podem trobar dos tipus:
1) Els que són infiltrants des de l'inici . Solen ser d'alt grau, patró de creixement sòlid i
presenten un comportament agressiu. Tot i que s'utilitzi el tractament radical, la
supervivència als dos anys es troba al voltant del 50%.
2) Els que tenen una historia prèvia de tumor superficial (15-20%) que a partir de
successives recidives ha evolucionat en grau i estadi. La impossibilitat de preveure
l'evolució d'aquests tumors en pacients concrets obliga a la cerca de marcadors de
pronòstic fins ara poc definits.
Multifocalitat
Una de les característiques dels tumors urotelials es la multifocalitat o multiplicitat de lesions
sincròniques o metacroniques, que pot aparèixer en totes les variants cel -lulars però amb molta
més freqüència en els carcinomes de cèl·lules transicionals. La multifocalitat sincrònica es dona
en el 34,7% dels casos i la metacrònica en un 61%.
La causa d'aquesta multifocalitat no està clara. Alguns investigadors es decanten per una
implantació cel·lular mentre que altres consideren que és el resultat d'una inestabilitat genòmica
present a l'uroteli.
36

Introducció
CANCER D 'URETER I DE PEL VIS RENAL
Els carcinomes de pelvis renal són relativament rars, constituint un 5% de tots els tumors renals.
El 90% dels tumors de pelvis renal són de cèl·lules transicionals i poden ésser papil·lars, sòlids o
CIS (carcinomes in situ d' a It grau).
Els carcinomes de pelvis de cèl·lules escamases representen un 7% de la totalitat dels tumors de
pelvis renal i són freqüentment molt invasius . Els adenocarcinomes de pelvis són poc freqüents i
van associats a infeccions, inflamacions o càlculs renals. »
Les escasses dades de tumors o carcinomes de cèl·lules transicionals (CCT) que afecten a pelvis
renal i urèter indiquen que aquests tumors presenten les mateixes característiques citogenètiques i
moleculars que els que afecten a la bufeta. El sistema de classificació TNMper aquests tumors es
similar al de tumors de bufeta amb certs canvis tenint en compte aspectes estructurals de la pelvis„•••renal i l'urèter (taula .7).
Taula 7. Classificació TNM de cèl·lules*de transició de la pelvis reñaí i urèter
T ' Tx No es pot avaluar el tumor primari
Tumor N TO No existeixen signes de tumor primarif
priman;; ~> Ta Carcinoma papil- lar no invasor1 ~ ' V " ° !
. v '¥-/ Tis Carcinoma in situ
| Tl Tumor que envaeix teixit connectiu subepitelial
T2 Tumor que envaeix túnica muscular
T3 (Per pelvis renal)Tumor que envaeix mes enllà de la túnica muscular en el teixit
adipós peripèlvic o parènquima renal '
-, , T3 (Per urèter)Tumor que envaeix mes enllà de la túnica muscular en el teixit adipós
.;!'_; periutèric '• , - ""'•' ?"'• '
; T4 Tumor que envaeix òrgans adjacents o a través del ronyó al teixit adipós •; , •; perinèfric.
37
Introducció
N ': • Nx Els ganglis limfàtics regionals no poden ésser avaluats
. Ganglis j!»,,-* NO No hi ha signes de metàstasi a gangli limfàtic regional; *^,., ,f .'x. j
rLiihfàtiësfj- NI Metàstasi a un únic gangli limfàtic 2cm|,i!4!s-X*^%^
íRègiéhais.l N2 Metàstasi a un únic gangli limfàtic 2 5
' ', jpr¡ N3 Metàstasi a un gangli limfàtic 5cm
;,' i> **•-*,- ^
: M . •; MX La presència de metàstasi distant no pot ésser avaluada
Metàstasi,; MO No hi ha metàstasi distant
i • < - -."'Á,-,-¡ Ml Metàstasi distant
CITOGENETICA
La cito genètica del tumors urotelials és molt complexa. Els caríotips diploides amb una o
varíes anomalies pertanyen a estadis inicials , i poden evolucionar cap a caríotips complexes
pseudo-tetraploids amb força n ° de marcadors en estadis avançats.
Les anomalies més freqüents són +7,-9,-ll o del(llp), del(13q), del(17p) i reorganitzacions
dels cromosomes 1,5, i 10. Revisions de Sandberg and Berger 1994) Gibas and Gibas
1997,Fadl-Elmula et al. 2000.
Una revisió recent de les dades citogenètiques de més de 200 tumors de bufeta (Hoglund et al.
2001) indica la presencia d'almenys dues vies de progressió diferents que convergeixen en
etapes més avançades Una via es caracteritzaria per la pèrdua del cromosoma 9 seguida de -
11 i +lq. L'altre, amb pitjor pronòstic s'iniciaría amb el guany del cromosoma 7 seguida de
8p- i 8q +.
La tècnica d'hibridació genòmica comparada ha incrementat de forma considerable la
informació sobre alteracions genòmiques desequilibrades en els carcinomes de bufeta. Les
alteracions més freqüents corresponen a guanys a Iq, 8q, 20q i llq així com pèrdues a 9q,
9p, 8p i llp (Kallioniemi et al. 1995, Voorter et al. 1995, Richter et al. 1998, Koo et al. 1999,
Richter et al. 1999, Zhao et al. 1999, Simon et al. 2000)
38
Introducció
Hi ha per tant, nombrosos estudis citogenètic i moleculars que han aportat dades interessants
sobre les alteracions genètiques que contribueixen al desenvolupament dels carcinomes
d'uroteli (veure Taula 8 ). Es coneix que alguns oncogens i gens supressors estan alterats
(HRAS, FGFR3, ERBB2, CCND1, MDM2, INK4A-ARF, RBI, TP53, PTEN, PTC entre
altres). Les pèrdues repetides d'heterocigositat indica la possible presència de gens candidats
a supressors tumorals en: 3p, 4p, 4q, 8p, 9q, llp, llq i 14q (revisat per Knowles 2001). El
gen DBCCRl (deleted in bladder cancer chromosome region candidate 1) localitzat a 9q32-33 ha estat
proposat com a possible gen supressor relacionat amb els tumors de cèl·lules transicionals d'uroteli
(Nishiyama et al. 1999).
A la taula 8. s'indiquen, per cromosomes, les dades mes rellevants sobre l'estudi citogenètic
i molecular d'aquests tumors.
39
Introducció
Cromosoma Alíeracions-Bibliografia
CROMOSOMA
1
"i-p34.2"-p33
I-P13-p12
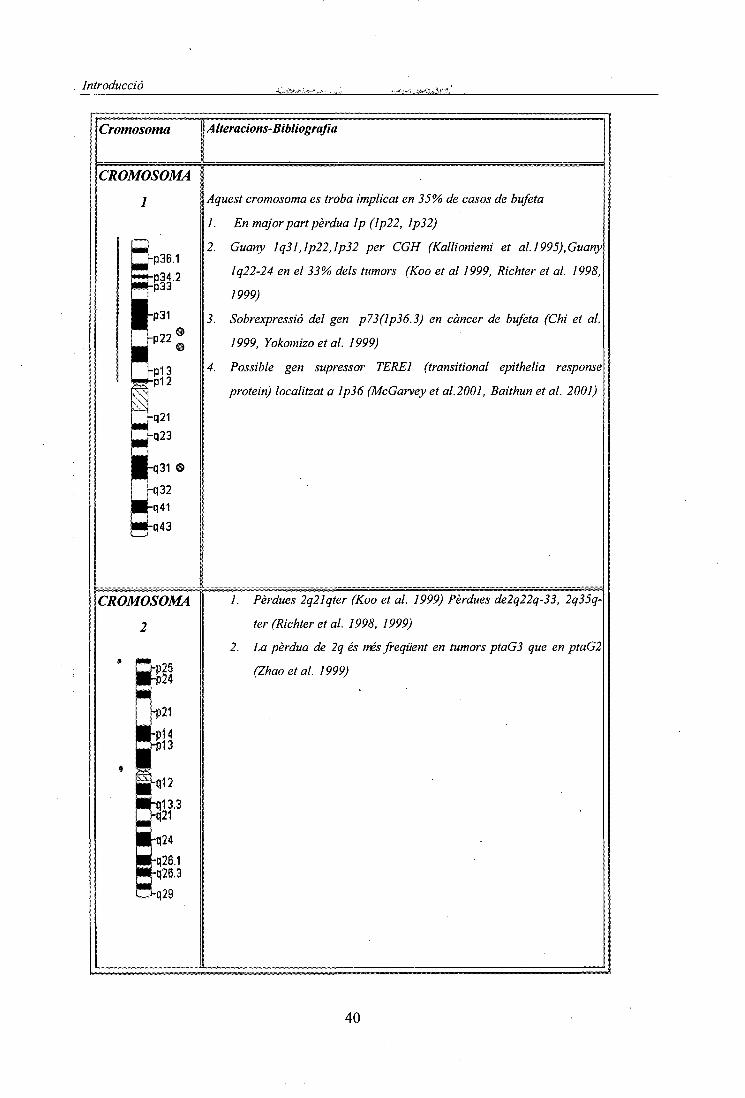
Aquest cromosoma es troba implicat en 35% de casos de bufeta
1. En major part pèrdua Ip (Ip22, Ip32)
2. Guany Iq31,lp22,lp32 per CGH (Kallioniemi et al. ¡995),Guany
lq22-24 en el 33% dels tumors (Koo et al 1999, Richter et al. 1998,
1999)
3. Sobrexpressió del gen p73(lp36.3) en càncer de bufeta (Chi et al.
1999, Yokomizo et al. 1999)
4. Possible gen supressor TERE1 (transitional epithelia response
protein) localitzat a Ip36 (McGarvey et al. 2001, Baithun et al. 2001)
CROMOSOMA
2
rp21
-p14rp13
q24
0.26.1026.3
/. Pèrdues 2q21qter (Koo et al. 1999) Pèrdues de2q22q-33, 2q35q-
ter (Richter et al. 1998, 1999)
2. La pèrdua de 2q és més freqüent en tumors ptaG3 que en ptaG2
(Zhao et al. 1999)
40
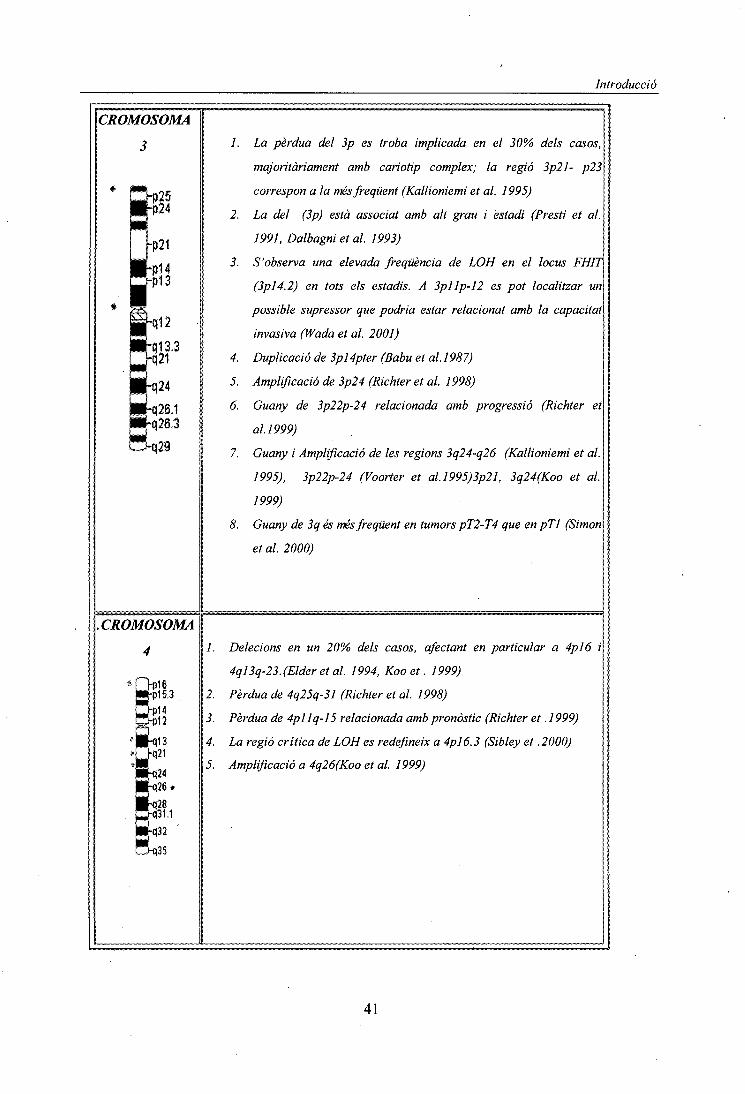
Introducció
CROMOSOMA
3
-q12
_t|13.3H21
324
/. La pèrdua del 3p es troba implicada en el 30% dels casos,
majoritàriament amb caríotip complex; la regió 3p21- p23
correspon a la més freqüent (Kallioniemi et al. 1995)
2. La del (3p) està associat amb alt grau i estadi (Presti et al.
1991, Dalbagni et al. 1993)
3. S'observa una elevada freqüència de LOH en el locus FHIT
(3pl4.2) en tots els estadis. A 3pllp-12 es pot localitzar un
possible supressor que podria estar relacionat amb la capacitat
invasiva (Wada et al. 2001)
4. Duplicació de 3pl4pter (Babu et al.1987)
5. Amplificació de 3p24 (Richter et al. 1998)
6. Guany de 3p22p-24 relacionada amb progressió (Richter et
al. 1999)
7. Guany i Amplificació de les regions 3q24-q26 (Kallioniemi et al.
1995), 3p22p-24 (Voorter et al.l995)3p21, 3q24(Koo et al.
1999)
8. Guany de 3q és més freqüent en tumors pT2-T4 que en pTl (Simón
et al. 2000)
CROMOSOMA
4 1. Delecions en un 20% dels casos, afectant en particular a 4pl6 i
4ql3q-23.(Elderetal. 1994, Koo et. 1999)
2. Pèrdua de 4q25q-31 (Richter et al. 1998)
3. Pèrdua de 4pllq-l5 relacionada amb pronòstic (Richter et .1999)
4. La regió crítica de LOH es redefineix a 4pl6.3 (Sibley et .2000)
5. Amplificació a 4q26(Koo et al. 1999)
41
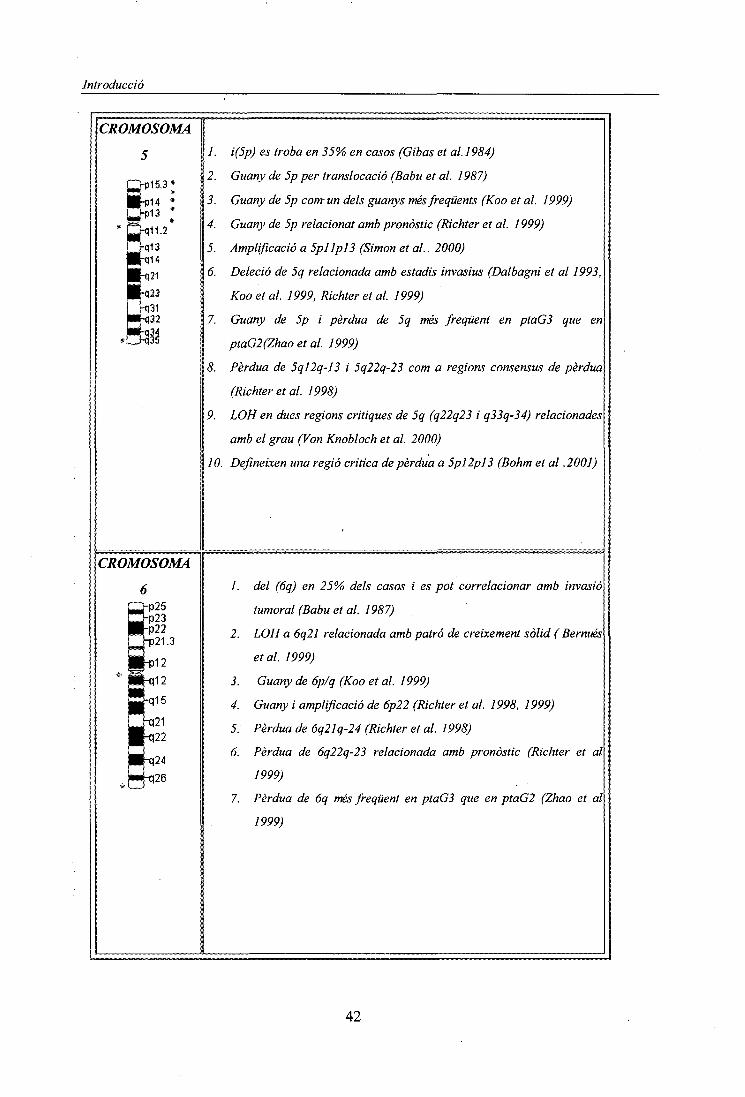
Introducció
CROMOSOMA
5
h)15.3<
/. i(5p) es troba en 35% en casos (Gibas et al. 1984)
2. Guany de 5p per translocació (Babu et al. 1987)
3. Guany de 5p com un dels guanys més freqüents (Koo et al. 1999)
4. Guany de 5p relacionat amb pronòstic (Richter et al. 1999)
5. Amplificació a 5pllpl3 (Simon et al.. 2000)
6. Deleció de 5q relacionada amb estadis invasius (Dalbagni et al 1993,
Koo et al. 1999, Richter et al. 1999)
7. Guany de 5p i pèrdua de 5q més freqüent en ptaG3 que en
ptaG2(Zhao et al. 1999)
8. Pèrdua de 5ql2q-13 i 5q22q-23 com a regions consensus de pèrdua
(Richter et al. 1998)
9. LOH en dues regions crítiques de 5q (q22q23 i q33q-34) relacionades
amb el grau (Von Knobloch et al. 2000)
10. Defineixen una regió critica de pèrdua a 5pl2pl3 (Bohm et al .2001)
CROMOSOMA
1. del (6q) en 25% dels casos i es pot correlacionar amb invasió
tumoral (Babu et al. 1987)
2. LOH a 6q21 relacionada amb patró de creixement sòlid ( Bernués
et al. 1999)
3. Guany de 6p/q (Koo et al. 1999)
4. Guany i amplificació de 6p22 (Richter et al. 1998, 1999)
5. Pèrdua de 6q21q-24 (Richter et al. 1998)
6. Pèrdua de 6q22q-23 relacionada amb pronòstic (Richter et al
1999)
7. Pèrdua de 6q més freqüent en ptaG3 que en ptaG2 (Zhao et al
1999)
42
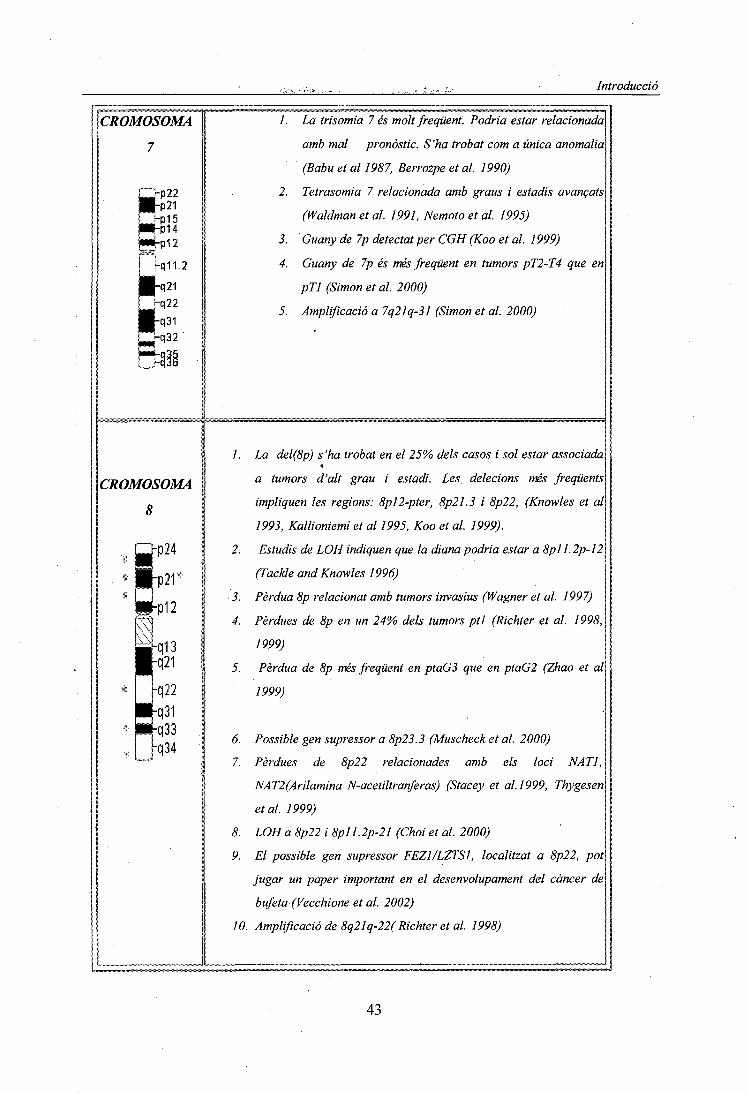
Introducció
CROMOSOMA
7
1. La trisomia 7 és molt freqüent. Podria estar relacionada
amb mal pronòstic. S'ha trobat com a única anomalia
(Babu et al 1987, Berrozpe et al. 1990)
2. Tetrasomia 7 relacionada amb graus i estadis avançats
(Waldman et al. 1991, Nemoto et al. 1995)
3. 'Guany de 7p detectat per CGH (Koo et al. 1999)
4. Guany de 7p és més freqüent en tumors pT2-T4 que en
pTl (Simon et al. 2000)
5. Amplificació a 7q21q-31 (Simon et al. 2000)
CROMOSOMA
8
34
1. La del(8p) s'ha trobat en el 25% dels casos i sol estar associada*
a tumors d'alt grau i estadi. Les delecions més freqüents
impliquen les regions: 8pl2-pter, 8p21.3 i 8p22, (Knowles et al
1993, Kallioniemi et al 1995, Koo et al. 1999).
2. Estudis de LOH indiquen que la diana podria estar a 8pl 1.2p-12
(Tackle and Knowles 1996)
3. Pèrdua 8p relacionat amb tumors invasius (Wagner et al. 1997)
4. Pèrdues de 8p en un 24% dels tumors ptl (Richter et al. 1998,
1999)
5. Pèrdua de 8p més freqüent en ptaG3 que en ptaG2 (Zhao et al
1999)
6. Possible gen supressor a 8p23.3 (Muscheck et al. 2000)
7. Pèrdues de 8p22 relacionades amb els loci NATI,
NAT2(Arilamina N-acetiltranferas) (Stacey et al.1999, Thygesen
et al. 1999)
8. LOH a 8p22 iSpll. 2p-21 (Choi et al. 2000)
9. El possible gen supressor FEZ1/LZTS1, localitzat a 8p22, pot
jugar un paper important en el desenvolupament del càncer de
bufeta (Vecchione et al. 2002)
10. Amplificació de 8q21q-22( Richter et al. 1998)
43

Introducció
11. Guanys de 8q en un 28% de tumors ptl (Richter et al. 1999)
12. Guanys de 8g concretament 8q23-qter poden estar associats
amb la progressió tumoral (Sauter et al. 1995), el c-myc (8q24)
rarament es troba amplificat (Kallioniemi et al. 1995). Guanys
de 8q21qter ( Koo et al. 1999)
13. amplificació del c-MYC pot estar lligada a progressió (Mahdy et
al.2001)
CROMOSOMA
9
b23hp21Up13
12
K21
q34
1. Monosomia 9 o delecions del cromosoma 9 es troben en un 50%
dels casos, a vegades s'ha trobat com a única anomalia. Present
en estadis primerencs, pTa (Gibas et al. 1984, Hopman et
al.l991,Waldmanet al. 1991, Dalbagni et al. 1993, Kallioniemi
et al. 1995, Baud et al. 1998) i estadis molt tardans però no
correlacionat amb l'expressió de la p53 (Spruck et al. 1994).
S 'ha hipotetitzat que la monosomia 9 pot indicar risc de
recurrència (Bartlett et al. 1998).
2. la monosomia 9 s'ha detectat també per FISH (Hopman et al
1991, Sauter et al. 1995, i per CGH (Koo et al. 1999, Richter et
al. 1999)
3. Pèrdua de 9p present a tots els estadis (Erbersdobler et al
1998)
4. S 'ha trobat LOH a 9p21, 9q22, 9q31q-32, 9q33, 9q34 i
delecions en homozigosi a CDKN2B/INK4B/P16 (9p21). (Olumi
et al. 1990,Orlow et al. 1995, Stadler et al. 1996, Baud et
al. 1999, Czerniak et al. 1999)
5. Les delecions a CDKN2B/INK4B/P16 (9p21) s'han correlacionat
amb inactivació de Rb (Benedict et al. 1999)
6. La pèrdua d'expressió de pi6 és inversament proporcional a la
sobrexpressió de ciclina Dl (localitzada a Uql3) (Yang et al.
2002)
7. LOH + mutació del segon al·lel de CDKN2A és rar però
significatiu. CDKN2A esta implicat en estadis pla
8. Amplificació a 9p24 (Simon et al. 2000)
9. PAX5 (9pl3) pot estar sobreexpressat en tumors urotelials
44

Introducció
P21rp13
q12
||q21
I h22
Pq31q33
I rq34
(Adshead et al. 1999)
10. CDKN2B/INK4B/P15 (9p21) està implicat en pocs casos.
11. Pèrdues a 9p i 9q22q-33 detectades per CGH (Richter et al.
1998, Richter et al. 1999)
12. LOH a 9p21p-22, 9q21q.31, 9q32q34 en tots els estadis
(Louhelainen et al. 2000)
13. Segons Cairns et al. (1993), un possible locus supressor estaria
a 9q22 i l'altre entre 9pl2-pl3
14. GSN (9q34) està molt poc expressat en tumors en comparació
amb la seva expressió en bufeta normal.
15. LOH+mutació en el segon al·lel de TSC1 (9q33q-34). També
s'ha descrit LOH d'un possible supressor a 9q32q-33(Habuchi et
al. 1997, Hornigold et al. 1999)
16. Pèrdua al·lèlica en homocigosi a 9q32q-33. El gen
DBCCR1 (deleted in bladder cancer chromosome region
candidate 1) localitzat a 9q32q-33 com a possible supressor
(Nishiyamaetal. 1999)
17. Hipermetilació de la regió DBCCR1 com un dels pasos iniciáis
en
fy&/ ific.iuui¿uj wo tu i G£ti/ Ljij\^^i\-i wiyi/i urt MC-IO ^ywjvo trttuiutt
el desenvolupament dels TCC de bufeta (Habuchi et al. 2001)
18. S'observa la pèrdua de heterocigositat de très loci (INK4A,^
TSC1 i DBC1) en un 25% dels tumors amb recurrència i en un
0% dels que no en presentaven (Edwards et al. 2002)
19. Identifiquen 4 dianes per gens supressors: 9q22.3 (gen Patched)
9q31q-32 (gens disautonia i distrofia muscular tipus Fukuyama),
9q33 (locus GSN), 9q34(gen telangiectasia hemorràgica)(Simoneau et
al. 1999)
20. S'han detectat LOH a 9q en lesions hiperplàstiques de bufeta
confirmant que la pèrdua de 9q és una de les alteracions
primerenques en aquests tumors (Chow et al. 2000)
45
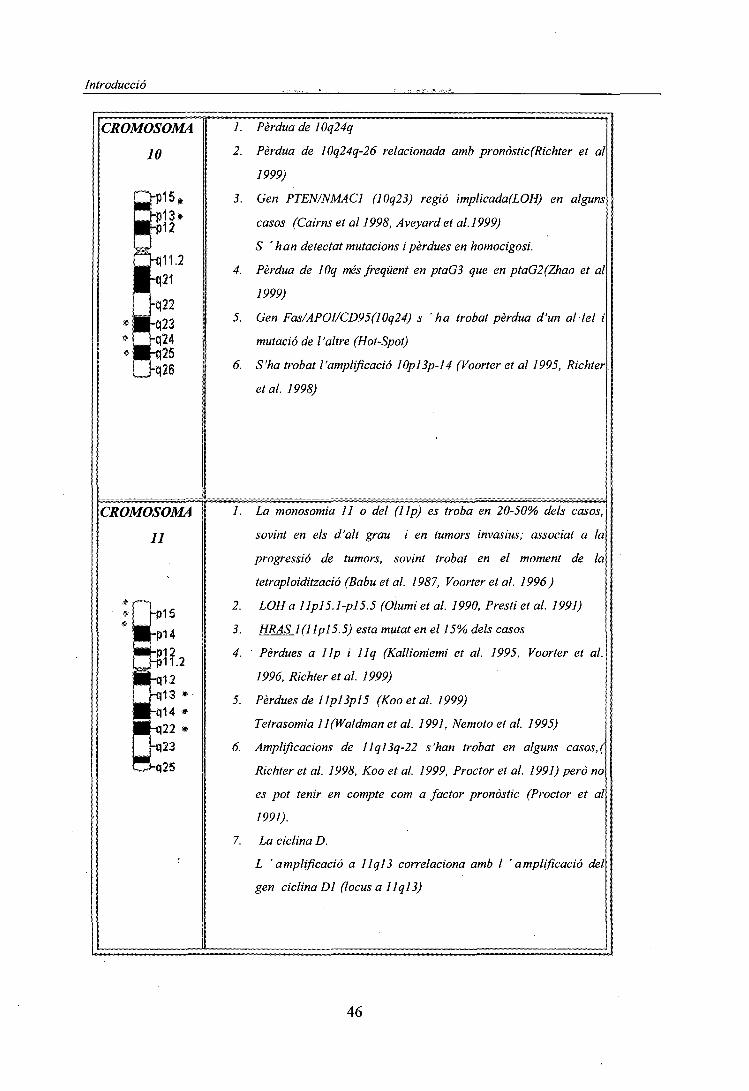
Introducció
CROMOSOMA
10
1. Pèrdua de 10q24q
2. Pèrdua de 10q24q-26 relacionada amb pronòstic(Richter et al
1999)
3. Gen PTEN/NMAC1 (10q23) regió implicada(LOH) en alguns
casos (Cairns et al 1998, Aveyard et al. 1999)
S 'han detectat mutacions i pèrdues en homocigosi.
4. Pèrdua de Wq més freqüent en ptaG3 que en ptaG2(Zhao et al
1999)
5. Gen Fas/APOI/CD95(10q24) s 'ha trobat pèrdua d'un al·lel i
mutació de l'altre (Hot-Spot)
6. S'ha trobat l'amplificació 10pl3p-14 (Voorter et al 1995, Richter
et al. 1998)
CROMOSOMA
11
1. La monosomia 11 o del (Up) es troba en 20-50% dels casos,
sovint en els d'alt grau i en tumors invasius; associat a la
progressió de tumors, sovint trobat en el moment de la
tetraploidització (Babu et al. 1987, Voorter et al. 1996)
2. LOH a Ilpl5. l-pl5.5 (Olumi et al. 1990, Presti et al. 1991)
3. HRAS KllplS. 5) esta mutât en el 15% dels casos
4. Pèrdues a 1 Ip i llq (Kallioniemi et al. 1995, Voorter et al.
1996, Richter et al. 1999)
5. Pèrdues de Ilpl3pl5 (Koo et al. 1999)
Tetrasomia ll(Waldman et al. 1991, Nemoto et al. 1995)
6. Amplificacions de llql3q-22 s'han trobat en alguns casos,(
Richter et al. 1998, Koo et al. 1999, Proctor et al. 1991) però no
es pot tenir en compte com a factor pronòstic (Proctor et al
1991).
7. La ciclina D.
L 'amplificació a llq]3 correlaciona amb I 'amplificació del
gen ciclina Dl (locus a Ilql3)
46
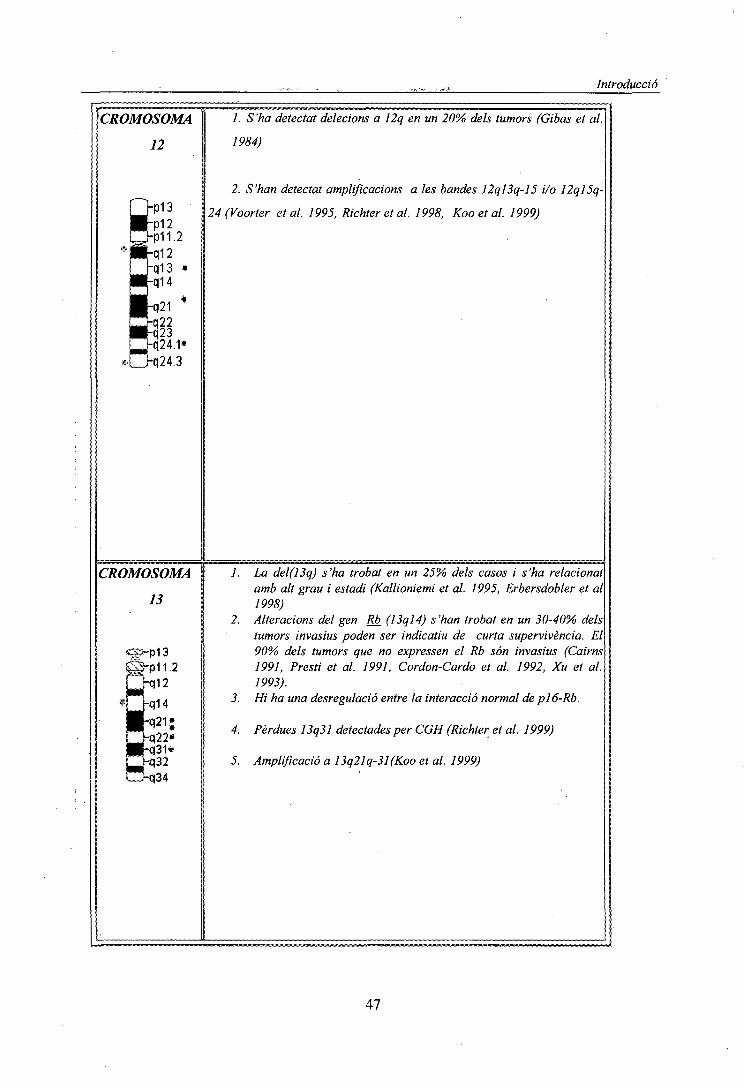
Introducció
CROMOSOMA
12
24.3
1. S'ha detectat deletions a 12q en un 20% dels tumors (Gibas et al.
1984)
2. S'han detectat amplificacions a les bandes 12ql3q-15 i/o 12ql5q-
24(Voorter et al. 1995, Richter et al. 1998, Koo et al. 1999)
CROMOSOMA
13
1. La del(13q) s'ha trobat en un 25% dels casos i s'ha relacionatamb alt grau i estadi (Kallioniemi et al. 1995, Erbersdobler et al1998)
2. Alteracions del gen Rb_ (13ql4) s'han trobat en un 30-40% delstumors invasius poden ser indicatiu de curta supervivència. El90% dels tumors que no expressen el Rb són invasius (Cairns1991, Presti et al. 1991, Cordon-Cardo et al. 1992, Xu et al.1993).
3. Hi ha una desregulació entre la interacció normal de pl6-Rb.
4. Pèrdues 13q31 detectades per CGH (Richter et al. 1999)
5. Amplificació a 13q21q-31(Koo et al. 1999)
47
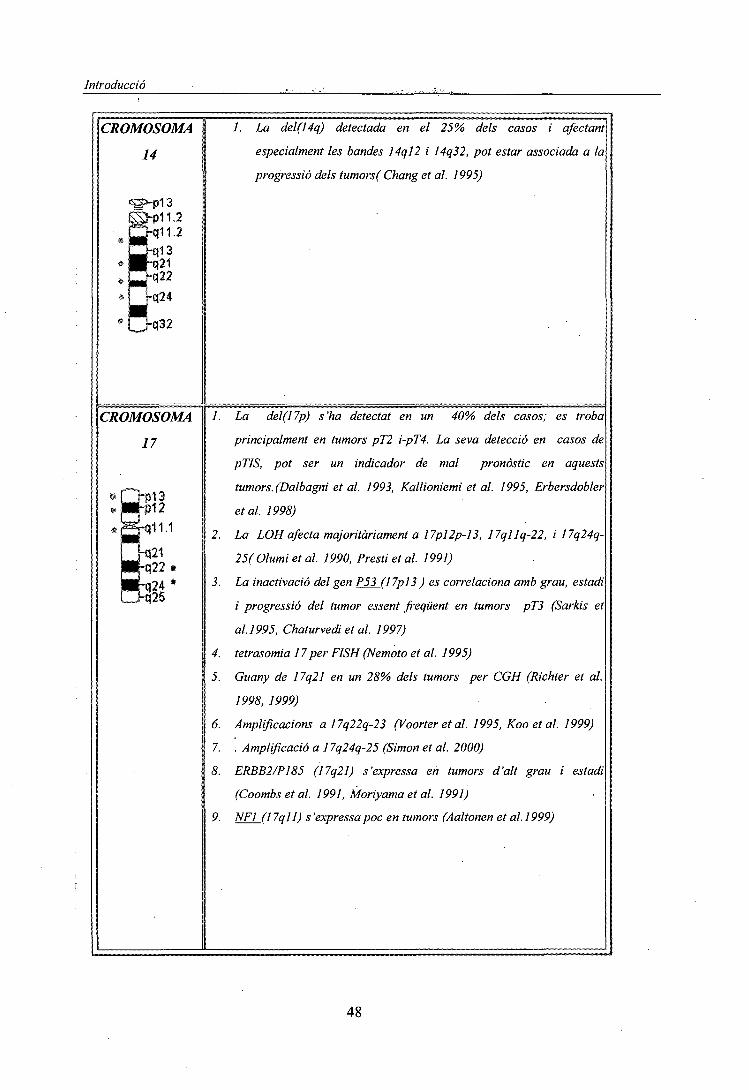
Introducció
CROMOSOMA
14
32
/. La del(14q) detectada en el 25% dels casos i afectant
especialment les bandes 14ql2 i 14q32, pot estar associada a la
progressió dels tumors( Chang et al. 1995)
CROMOSOMA
17
pi 3•p12
1. La del(17p) s'ha detectat en un 40% dels casos; es troba
principalment en tumors pT2 i-pT4. La seva detecció en casos de
pTIS, pot ser un indicador de mal pronòstic en aquests
tumors. (Dalbagni et al. 1993, Kallioniemi et al. 1995, Erbersdobler
et al 1998)
2. La LOH afecta majoritàriament a 17pl2p-l3, 17qllq-22, i 17q24q-
25( Olumi et al. 1990, Presti et al. 1991)
3. La inactivació del gen P5_3_(l 7pl3 ) es correlaciona amb grau, estadi
i progressió del tumor essent freqüent en tumors pT3 (Sarltis et
al. 1995, Chaturvedi et al. ¡997)
4. tetrasomia 17 per FISH (Nemoto et al. 1995)
5. Guany de 17q21 en un 28% dels tumors per CGH (Richter et al.
1998, 1999)
6. Amplificacions a 17q22q-23 (Voorter et al. 1995, Koo et al. 1999)
7. . Amplificació a 17q24q-25 (Simon et al. 2000)
8. ERBB2/P185 (17q21) s'expressa en tumors d'alt grau i estadi
(Coombs et al. 1991, Moriyama et al. 1991)
9. NF] (17qll) s'expressapoc en tumors (Aaltonen et al.1999)
48

Introducció
CROMOSOMA
18
CROMOSOMA
20
p12
CROMOSOMA
•S?
ta-.•l-q1 2
-q13
CROMOSOMA
Y« i—rp11.3 '
?s=!-n11 1
1-q'11.2
-q12
/. del(18q) en el 25% dels casos i està associat a alt grau i estadi. LOH
a 18q21( Presti et al. 1991)
2. Pèrdua de 18ql2q-23 relacionada amb pronòstic(Richter et al. 1999)
3. Pèrdua de 18q més freqüent en ptaG3 que en ptaG2 (Zhao et al 1999)
4. Guany de 18p és més freqüent en tumors pT2-T4 que en pTl (Simon et
al. 2000)
5. Amplificacions a ISpll (Voorter et al. 1995) 18qll i 18q22(Koo et
al. 1999)
1. Guany de 20p/q per CGH (Koo et al. 1999)
2. Guany de 20qll.2q-ter en un 33% de tumorsptl(Richter et al. 1999)
3. Amplificació de 20ql3 (Richter et al. 1998)
4. Guany de 20q més freqüent enptaGS que enptaG2(Zhao et al. 1999)
1. Amplificacions a 22qllq-12 (Voorter et al. 1995)
1. Pèrdua en el 30% dels casos , probablement no associat ni amb el grau
ni l'estadi (Sauter et al. 1995b)
Altres :
1-Diminuts dobles es troben en casos i està relacionat amb estadis i grau elevats (Milasin and
Micic 1992).
49

Objectius
2. OBJECTIUS

,,.., . ._ ..... Objectius
OBJECTIUS
L'objectiu general consisteix en la detecció i identificació d'alteracions cromosòmiques
desequilibrades constitucionals i adquirides mitjançant l'aplicació de la tècnica de Hibridació
Genòmica Comparada (CGH)
Aquest objectiu general compren els següents Objectius concrets:
1. Posta a punt i optimització de la tècnica de CGH a partir de diferents teixits, i
determinació dels possibles factors que poden influir en la obtenció de resultats.
2. Caracterització de anomalies cromosòmiques constitucionals prèviament detectades,
encara que no identificades, per bandes G en pacients amb malformacions congènites a fi
de correlacionar les amb les anomalies fenotíp iques.
• Caracterització d'anomalies cromosòmiques constitucionals en amniòcits.
• Caracterització d'anomalies cromosòmiques constitucionals en limfòtits.
• Valoració de l'aplicació de la CGH al diagnòstic pré i postnatal.
3. Caracterització i identificació de desequilibris cromosòmics adquirits en tumors urotelials
i renals
• Valoració de la tècnica de CGH en la detecció de desequilibris cromosòmics
presents en dons minoritaris mitjançant comparació amb titogenètica
convencional
• Identificació de regions cromosòmiques que la seva pèrdua o guany origina la
aparició i/o progressió de tumors urotelials i renals.
50

Material i Mètodes
3. MATERIAL I MÈTODES

Material i Mètodes
L MATERIAL BIOLOGIC
L'estudi s'ha portat a terme a partir de 60 individus. En aquest treball podem diferenciar dos
grups:
'A. Pacients amb anomalies cromosòmiques constitucionals.
B. Pacients afectats de tumors urotelials o renals.
A. PACIENTS AMB ANOMALIES CROMOSÒMIQUES CONSTITUCIONALS
El material biològic processat per la caracterització de les anomalies cromosòmiques
constitucionals, detectades prèviament per bandes G, es va obtenir a partir de sang perifèrica
. o de líquid amniòtic. Tots els pacients que es detallen a continuació, procedien del Centre de
', Patologia Cel·lular i Diagnòstic Prenatal (CPC) exceptuant la família del cas 3 que prové del
'. Servei de Genètica de I ' Hospital Materno-Infantil de la Vall d 'Hebron (SGVH).
\ Pacient de 3 anys, sexe masculí, que presentava hipotonia al moment de néixer, observant el
pediatre, una fades rara i un ronyó en ferradura. L'estudi cromosòmic en sang perifèrica va
demostrar la presència d'un cromosoma Y derivatiu: 46,X,der(Y). Per identificar-ho es van
aplicar les tècniques de FISH Multipainting (Kit Chromoprobe-M Multiprobe, Cytocell) i
CGH.
CAS 2
Pacient de 35 anys, sexe femení, que presentava menopausa precoç. L' estudi cromósòmica
en sang perifèrica va demostrar la presència d'un cromosoma X derivatiu: 46,X,der(X). Per
identificar-lo, es van aplicar les tècniques de FISH Multipainting (Kit Chromoprobe-M
Multiprobe, Cytocell) i CGH.
CAS 3
Dona gestant de 26 anys, amb indicació de diagnòstic prenatal per fill previ afectat de retard
mental. El cariotip del fetus realitzat a les 16 setmanes de gestació va mostrar la presència
d'un cromosoma X derivatiu der(X), t(X;Y) i d'una deleció en el 18p. Posterior anàlisi
citogenètica practicada als pares i germà, evidencia la presència de la mateixa deleció 18p a
la mare, essent els cariotips del pare i germà normals. Per identificar aquesta alteració es van
aplicar les tècniques de painting del cromosoma 18 i la tècnica CGH.
51
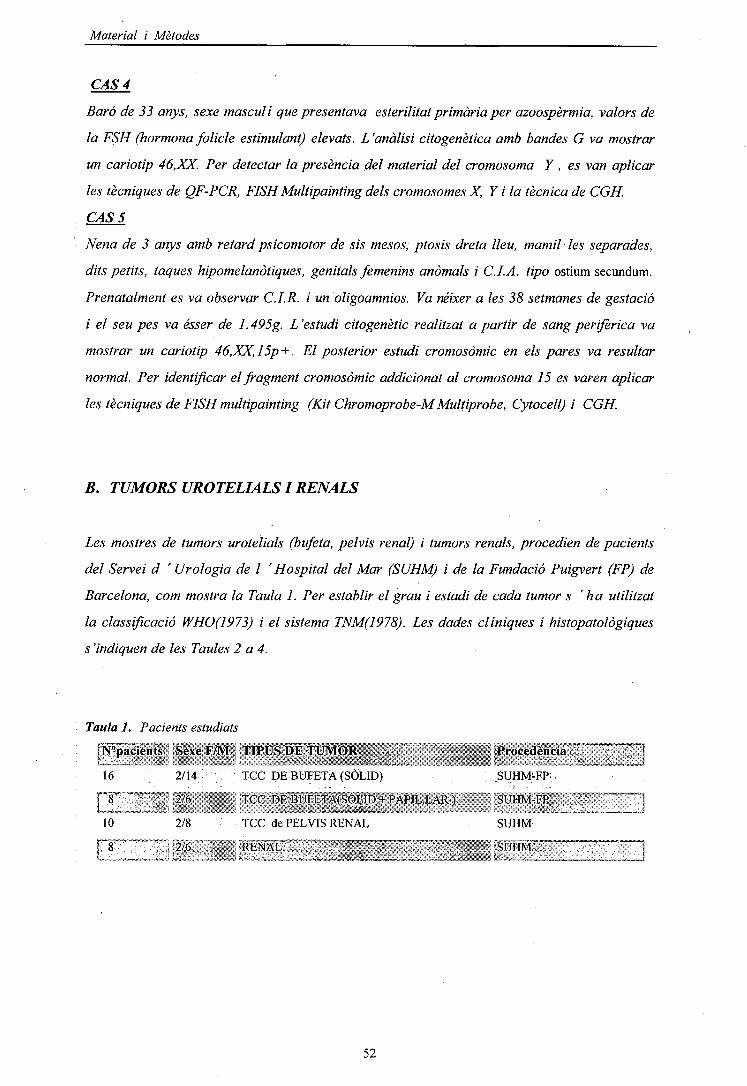
Material i Mètodes
f
é
CAS 4
Baró de 33 anys, sexe masculí que presentava esterilitat primària per azoospèrmia, valors de
la FSH (hormona folíele estimulant) elevats. L'anàlisi citogenètica amb bandes G va mostrar
un cariotip 46,XX. Per detectar la presència del material del cromosoma Y, es van aplicar
les tècniques de QF-PCR, FISH Multipainting dels cromosomes X, Y i la tècnica de CGH.
CAS 5
Nena de 3 anys amb retard psicomotor de sis mesos, ptosis dreta lleu, mamil·les separades,
dits petits, taques hipomelanòtiques, genitals femenins anòmals i C.LA. tipo ostium secundum.
Prenatalment es va observar C. I. R. i un oligoamnios. Va néixer a les 38 setmanes de gestació
i el seu pes va ésser de 1.495g. L'estudi citogenètic realitzat a partir de sang perifèrica va
mostrar un cariotip 46,XX,15p + . El posterior estudi cromosòmic en els pares va resultar
normal. Per identificar el fragment cromosòmic addicionat al cromosoma 15 es varen aplicar
les tècniques de FISH multipainting (Kit Chromoprobe-M Multiprobe, Cytocell) i CGH.
B. TUMORS UROTELIALSI RENALS
Les mostres de tumors urotelials (bufeta, pelvis renal) i tumors renals, procedien de pacients
del Servei d ' Urologia de I ' Hospital del Mar (SUHM) i de la Fundació Puigvert (FP) de
Barcelona, com mostra la Taula 1. Per establir el grau i estadi de cada tumor s 'ha utilitzat
la classificació WHO(1973) i el sistema TNM(1978). Les dades clíniques i histopatològiques
s'indiquen de les Taules 2 a 4.
Taula 1. Pacients estudiats
ÍN°pacients :Sexe F/M TIPUS DE TUMORw^^^.* "^ ^ rrm* ^ 5 t_i „•",;/;*£, -¿, j;. , „„,, y _ ,
16 2/14 TCC DE BUFETA (SÒLID)
FIT """*"""" " i 12/6 v ' " TCC'WBÜFEfA(^ÒlÍD''+:PÀPIL.LÀR)
1.0
FÎT"
2/8
¡J2/6
TCC de PEL VIS RENAL
RENAL""""" •—»-—
Procedència
SUHM-FP
"SUHM-'FP
SUHM:SÜHM~T"
52

Material i Mètodes
Taula
1
Sill3
5
iSISÏfSfcttïfllffí
7
w:s"mis¡is«í?í:lïÍl
9
Ü*
11
¡ï|l
13
15**,
M^iiiiígf»^^
¡sSBBBÉÍití
17
ñff^Jilllijíí.l|O||p$:::;::&£
19**
pi21
23*
11
2. PACIENTS AMB TUMORS DE CÈL·LULES TRANSICIONALS
\ tiflillÇM/61 ;
M/58
Í 'ffif^Mismï:-. -fíf,\ :;;.;í.x¡!|¡¡¡p¡¡!$
M/76
F/63 .
M/60 ' : ,
M/81
M/79
M/75
i
M/73
I
M/66
s í:Ml6ÍBIi; í^ïí.íï^isaiïïSis^&í
M/74 .
' • ^^^"¿--^¡mfS'sm
M/85 ;,
;
pTa/GII . - - . . . :
;pTi;/Gii
lli líï···l· ,.,,,¡aiii ^«
pTl/GÍII
pT2/GIÍI
C'S 'SgfîPSi MISiPi
pT3a/GIII:
miiSfmmm^,• ""-"S
pT3/GIII
ííSSiSS: l ^ fi1.-;-?;" . . ·r:·:: S^^zltÍlÍlE«;l
pT3/GIII
pT2/Gni; : v
i;.: í S II»'1.1';:. ' .;
pTl/GIII
pT2/GIII
IIII^rM s-««*^fcp;sr-- • . ,-.:ill ^t'''^i^^^KSíll!~''
pT3a/GIII
pT3/GIH
DE BUFETA
RTU, BCG, Mit - (84) - (84)
RTU;;;BCG, Mit: - (48) -
:RTU; BCG, Mît. + (19) ^ -fPulmonar, Hepàtica
Cistectomia Radical -
ta|| lí™Çip|í|ii|H||||p|:Ç^
- : .
B iiiiSïoni BalljBii B lSI%llnóila^pliítSlp©ssïa|Spi
; : Cistectomia Radical ; - (30) - (30)
• . ?:• : : ; : - • : • - . ' '
^
Cistectomia Radical
" • , . + .'?(':is)í ^ "
?
. Gistectomia Radical; ; - : ;(24) - (24)!
g
RTU, BCG, Mit. - (4)
• .RTU . • v . ; . . ' / - • , : : :
Cistectomia Radical
i ::í5¡^^^^^^
Cistectomia Parcial ?
.-:**(4) ,::'* *""'
•; - . -• ' . ' •
^Bss'iBlHeÇàîiëâpiiu'ïnîSnlTl
?
- (30)
Abreviacions: RTU, ressecció transuretal del tumor; BCG, immunoterapia; Mit, Quimioterapia *recurrencia** MRC mort relacionada amb la malaltia (càncer)
53
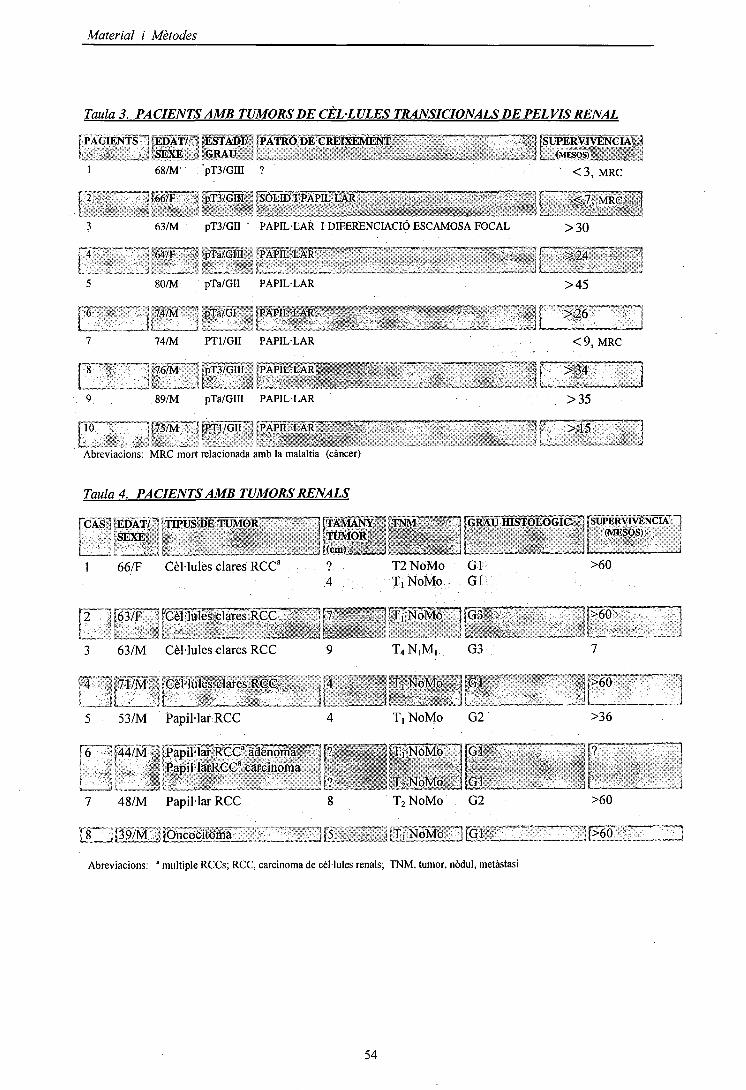
Material i Mètodes
Taula 3. PACIENTS AMB TUMORS DE CÈL·LULES TRANSICIONALS DE PELVIS RENAL
\ PACIENTS"] {EDAT/ ~< ÍESTAÍM?" ¡PATRÓ 'm^casa^M^~~~~~~ """ ~ ' ~ ~ "! 'SF.YP, í 'CRAir !'iGRAU
68/M pT3/GIII ?
1 fgg/p—- • ; pTa/oTn" - [sSOm'pAra^LAR"
63/M pT3/GII PAPIL·LAR I DIFERENCIACIÓ ESCAMOSA FOCAL
T64/F~~T pTa/GIÍÏ l"PAPTL·L"AT~"" " ™~~"~~ — .-.•—...—,• r
80/M pTa/GII PAPIL·LAR
<3, MRC
<1\ MRCjv
>30
_ _„ ][„-. „«: .J>45
r7
r9
!;74/M"] j
74/M
J-76/M
89/M
; pTa/GIi í
PT1/GII
j -pT3/GIII
pTa/GIII
ÍPAPIL·LAR - ' -
PAPIL·LAR
jp^jL.'LÀR^»,; . , , .
, í ' '«'-"_ i.'.. -
PAPIL·LAR
- j l >26
<9,
- ' U >34• • ' - . - l i
>35
MRC
río™""," ï(75/M ! fpTi/Gii ""•.' ÍPAPIL·LAR ?L :: . ' : •••„.. " ' ,
Abreviacions: MRC mort relacionada amb la malaltia (càncer)
Taula 4. PACIENTS AMB TUMORS RENALS
ICA
1
i2
3
•'4ï
5
|6
SfSEDÀT/:JSEXEt
66/F,
5J63/F~
63/M
J7Î/M
JL53/M
, ' î44/JVl* í1 ï
*[fÏPUS DE TUMOR ""IffÀMANY : TNM :"— 1 ¡GRAU mSTÓLÓGIC '1 SUPERVIVÈNCIA H1 TUMOR , \Í ] (M^08) '
. . . H(,.mv-'."í.. n - - , YjL |l i
Cèl·lules clares RCC" ? T2NoMo Glí >604 T, NoMo Gl
. pHules clares RCC ,^-¡ ^niÏTS^fo— ]p • . ^p60 J
Cèl·lules clares RCC 9 T4N|M, G3 7
;|Cèl·lules clares RCC , ¡,4 , •.j!TJNoMo "jfGl ij>60 jj[ ' ¡L_ ; i ? JL '• 'L— __ 1
Papil·lar RCC 4 T, NoMo G2 >36
"ÍPapil·lar RCCa adenoma -"][? , ^jTíÑoMb JGl . . ,j[? ™~j•Papil·larRCC" carcinoma i ? ' *' : ^
7 48/M Papil·lar RCC 8
Material i Mètodes
2. TÈCNIQUES DE CULTIU ICITOGENÈTICA CONVENCIONAL
2.1. CULTIU DE SANG PERIFÈRICACada mostra de sang perifèrica s'extreu en condicions d'esterilitat amb l'anticoagulant
heparina sódica al'1%.
2.1.1. Protocol de la tècnica
2.1.1.1. Cultiu normal
Es cultiven 0.5 ml (0.3 ml si és nou nat) de sang en tub cònic, amb 5 ml de RPMI-1640, medi
idoni pel cultiu de limfòcits.
Cada 100 ml de medi base es suplementen amb:
20 % Sèrum fetal boví (FCS-Foetal calf serum), serum de vedella fetal que té
factors essencials pel creixement cel -lular.
2 % L-glutamina (Gibson), és un aminoàcid essencial per la viabilitat cel -lular.
: 2 % Penicil -lina i estreptomicina (lOOU/ml), antibiòtics per evitar contaminacions.
4% Fitohematoglutinina (PUA) (10/j.g/ml), mitògen que estimula la proliferació dels
limfòcits T.
S'incuba a 37 °C en una estufa al 5% de CO2 durant 72 hores, temps en el que s'arriba al pic
' màxim exponencial de creixement cel iular. Passat aquest temps, s 'afegeix al cultiu 0.1-0.5
ml de I ''antimitòtic Colcemid (KaryoMAXmax), s'incuba a una concentració final de 0.04
Hg/ml. El colcemid atura les cel -Iules en metafase perquè impedeix la despolimerització del
,fus acromàtic. S'incuba a 37 °C durant 15-20 min, essent convenient no sobrepassar aquest
temps ja que afecta a la morfologia dels cromosomes. Es centrífuga a 650 g durant 8 min, i es
decanta el sobrenadant. La suspensió cel -lular es sotmet a un xoc hipotònic amb una solució
de Clorur Potàsic (KO 0.075M), afegint de 7-10 ml durant 30 min a 37 °C. L'acció de
\ l'hipotònic permet que s'inflin les cel iules per osmosi, dilueix el citoplasma; i facilita la
posterior fixació de cromatina. La llargada en el temps d 'exposició a la solució amb
hipotònic en el cultiu se sap que afecta a la morfologia dels cromosomes. Es centrífuga a
1800 rpm o 400 g durant 8 min i es decanta. Posteriorment, es fixa el material cromat inic,
rentant 3 vegades amb 7-10 ml de Carnoy que resulta de la barreja de metanol i àcid acètic,
en proporció 3:1. El metanol precipita la cromatina i l'àcid acètic trenca les membranes i
estructures cel -lulars que, en no precipitar-les, seran eliminades per les successives rentades.
El procés de fixació es repeteix 3-4 vegades disminuint la velocitat i el temps de centrifugado
300 g, 6 min, per intentar no perdre gaire material en cada rentat. Quan el material està ben
net, es procedeix a fer les extensions de la suspensió de material nuclear, en divisió i en
interfase, sobre el portaobjectes. Aquest han estat prèviament desengreixats amb metanol al
70% a 4 °C durant 20 min, per evitar que s'hi enganxin residus i aconseguir unes bones
55
Material i Mètodes
extensions. Es deixen assecar i es procedeix a realitzar la tècnica de bandeig cromosòmic de
bandes G. La resta de material fixat, es pot guardar en el tub segellat amb plàstic parafilm
per evitar l'evaporació a -20°C fins a la seva utilització, poden restar així durant 5-6-
anys.
2.1.1.2. Cultiu dálta resolució
Per obtenir cromosomes d ' alta resolució o prometafàsics, el protocol que es fa servir va
ser el mateix que I ' explicat anteriorment, però amb alguns canvis.
L'incubació és més llarga, de 96 h. A les 72 h d' iniciar el cultiu amb medi suplemental, s'hi
afegeix Metotrexat (MTX), a una concentració final de 10~6 M. El MTX és un antimetabolit
antagonista de l'àcid fòlic que produeix un bloqueig del cicle cel·lular per inhibició de la
síntesi del DNA durant la fase S. Després de 17-19 hores d' incubació, les cèl·lules són
, alliberades del bloqueig, rentant amb medi RPMI-1640. S'afegeix Timidina, que indueix, la
síntesi de DNA, a una concentració final de 10~5 M, per desbloquejar i reactivar la divisió.
Aquest procés permet induir la sincronització de la divisió cel·lular. Es deixa incubar a 37° C
perquè les cèl·lules es divideixin de forma sincronitzada. En el cultiu s'hi afegeix
l'antimitòtic, colcemid, 5 hores despresa' haver afegit la Timidina. A les 94 h de l'inici del
cultiu s'afegeix 50 \d (5^g/ml) de bromur d' etidi (EtBr), per descondensar la cromatina.
Aquest compost químic és un tipus de fluorocrom que s'uneix a l'àcid nucleic, i s'ha de
manipular amb molta cura ja que està catalogat com a producte carcinogenic i teratogènic.
Seguit, es posa el colcemid a una concentració de 0.04 ¡¿g/ml durant 2 h, i es realitza la
fixació igual que en el procés anterior.
Heparina sódica 1% (Rovi)
RPM1-1640 (Gibco)
Sèrum fetal boví (FCS-Foetal calf serum) (Gibco)
L-glutamina (Gibco)
Penicilina i estreptomicina (JOOU/ml) (Gibco)
Fitohematoglutinina (PHA) (Difco)
Colcemid (KaryoMAXmax) (Gibco)
KC10.075M (Merck)
Carnoy:metanol:àcidacètic-(3:l) (Merck)
Metotrexat (MTX) (Sigma)
Timidina (Sigma)
Bromur d'Etidi (EtBr) (Sigma)
56
Material i Mètodes
2.2. CULTIU DELIQUIO AMNIOTIC
En I ' amniocentesi, la quantitat de líquid amniòtic (LA) que s'extreu had 'ésser superior o
igual a 20 ml ja que sinó s' obté molt poc material. El volum de LA va augmentant al llarg
de la gestació, a les 16 setmanes és de uns 200 ml i al final arriba a 500-J 000 ml. Es
considera que en la amniocentesi es pot extreure 1 ml de líquid per cada setmana de gestació.
Aquesta tècnica es realitza durant les 16-20 setmanes i per tant la quantitat de LA que es pot
extreure és de 16-20 ml. La majoria de cèl·lules presents en el LA són amniòcits i per tant
són les més utilitzades per realitzar estudis citogenètics.
2.2.1. Protocol de la tècnica
S'extreuen els 16-20 ml de LA , el material es reparteix en dos tubs cònics i es centrifuga a
1800 rpm (650 g) durant 8-10 min . El sobrenadant s'utilitzarà per l'anàlisi bioquímica amb
el triple screening. La suspensió cel·lular se sembra en flascons (12,5 cm2 de 25 ml) que
contenen 4-5 ml de medi AmnioMAXIM-C100; (Solució amb sals, Glucosa amb pH i pressió
osmótica controlats, hormones i vitamines). Aquest medi és suplementat amb 20% de serum de
vedella fetal (FCS), 2% Penicilina-Estreptomicina, 2% L-glutamina, i de forma opcional 1%
Hepes que actua com a fungida. En el cultiu en flascó al incubador de 37° C i amb una
atmosfera del 5% de CO2 les cèl·lules creixen en monocapa sobre el fons i quan són
confluents es tracten amb tripsina (0.25%) durant 10 min i després es renten amb medi, la
tripsina és una proteassa que produeix la pèrdua d'adhesió en cultius cel·lulars. Es deixen 5 o
6 dies a 37 "C, llavors es fa canvi de medi i als 8 dies es mira el cultiu al microscopi invertit
i quan hi ha prou material es processa. Es posa 0.2 ml de Colcemid a una concentració final
de 0.04 ug/ml per aturar les divisions cel·lulars en metafase, però només si les colònies estan
ben repartides, o bé es tripsinitza si hi ha molt creixement. Es posa Iml de tripsina deixant-la
actuar a 37 "C durant 2.5 min. Es neutralitza I 'efecte enzimàtic amb 3ml de medi
AmnioMAX™-C100 a 37 ° C. A continuació, tota la suspensió es traspassa a un tub cònic, on
es centrífuga 5 min a 600 g. Al pel-let s'hi afegeix 5ml de la solució hipotònica (KCl 0.075M)
atemperada a 37 "C. Es centrífuga 7 min a 600 g. Seguidament, es procedeix a fer tres
fixacions amb 5 ml de Carnoy, 5 min a 600 g. Finalment, es fan les extensions i es procedeix
al bandeix i anàlisi cromosòmica.
Amniomax
Hepes
Tripsina
2xSSC citrat sòdic sali
(Gibco)
(Gibco)
(Difco)
(Merck)
57
Material i Mètodes
2.3. CULTIU DE CÈL·LULES TUMORALS
La mostra tumoral s 'obté immediatament a I 'extirpació del tumor. Quan arriba la mostra,
es separa una part per fer citogenètica i I 'altra es congela immediatament en nitrogen
líquid per realitzar posteriorment I ' extracció del DNA.
2.3.1. Protocol de la tècnica
Les mostres de tumor es processen, descartant el greix, el teixit sa adjacent i les àrees
necròtiques, llavors es sotmeten a disgregació mecànica, amb bisturí o tisores, i enzimàtica
amb 2000U/ml col• lagenasa IIa 37 °C durant 1-2 h.
La suspensió cel·lular obtinguda es sembra en medi DMEM, és MEM (medi mínim essencial
de Eagle modificat per Dulbeco) que conté els aminoàcids essencials, suplemental amb 10%
de FCS (sèrum boví fetal), antibiòtics penicilina-estreptomicina-fungizona al 1% (100U/ml),
gentamicina (0.02 mg/ml), insulina bovina (0,02 ug/ml), transferrina (0,02 ug/ml), glutatió
(0,1 ug/ml), i selenit sòdic (5ng/ml). Un cop les cèl·lules epitelials s 'han adherit al substrat,
es renova el medi per descartar les cèl·lules inviables i els detritus que queden en suspensió.
Quan el nombre de cèl·lules en divisió és elevat, de 4 a 5 dies des del cultiu primari, es
sotmeten a tractament antimitòtic amb colcemid (0.0J-0.03 ug/ml) durant 1-4 h, per acumular
el màxim nombre possible de cèl·lules en metafase. Després de I 'incubació a 37 °C es
tripsinitza i posteriorment les cèl·lules es sotmeten a un xoc hipotònic (KCl 0.075 M) durant
25-30 min, per facilitar la separació dels cromosomes. Posteriorment es procedeix a fixar i
rentar amb Carnoy, per tal d 'eliminar les membranes i estructures citoplasmàtiques.
Finalment, es realitzen les extensions cromosòmiques segons el mètode habitual en el nostre
laboratori.
Col.lagenasa II (Gibco), Medi DMEM (Gibco)Penicilina-estreptomicina-fungizona (Gibco)Gentamicina (Gibco)Insulina bovina (Gibco)Transferrina (Gibco)Glutatió (Gibco)Selenit sòdic (Gibco)
58

Material i Mètodes
3. TÉCNICA DE BANDEIG CROMOSÒMIC
3.1. BANDES C
La tècnica de bandes C permet la tinció selectiva de la heterocromatina constitutiva, material
que es troba sobretot en regions centromèriques i pericentromèriques. Tant es pot utilitzar
hidròxid de sodi o de bari per desnaturalitzar el DNA cromosòmic, observant-se el mateix
patró de bandes C. Aquesta tècnica té com a conseqüència una extracció de fins el 50% del
DNA cromosòmic, preferentment s'extreu el DNA localitzat en els braços cromosòmics , per
tant cal suposar que la heterocromatina localitzada a les regions centromèriques manté una
estructura més compacta i resistent als tractaments, posant-se de manifest amb bandes C. La
metodologia és la següent: es submergeixen les preparacions en una cubeta amb HCl 0.02N
(2ml HCl+lOOml H2O destil·lada) a temperatura ambient durant 30 min, es renten amb aigua
i s'assequen. Seguidament, s'introdueixen en una cubeta de Ba(OH)2saturat a 60 "C (100ml
H¡O + 304gr de Ba(OH)i), al bany marià durant 2-3 min. Es renten les preparacions amb H2O
destil·lada i metanol, dues vegades per eliminar els restes de bari, es deixa assecar i s'incuba
en solució salina 2xSSC a 65 "C 30 min, es renten amb aigua i s'assequen. Finalment es
tenyeixen les preparacions amb Leishman al 20% de 5-10 minuts. Es decanta el colorant, es
renten i es deixen assecar.
3.2. BANDES G
La tècnica habitual de bandeix cromosòmic és la de bandes G, que posa de manifest un patró
•• de bandes clares i fosques al llarg de cada cromosoma. La metodologia és la següent: les
preparacions s'envelleixen durant 24-48 h a temperatura ambient o 8-10 h a una estufa a
37 "C. Posteriorment, es submergeixen en una solució salina de 2xSSC a 65 "C, per tal
d'obrir les cadenes de DNA i a continuació es procedeix a afegir la solució de Wright durantí2-5 min, finalment es renta amb aigua i es deixa assecar. L'estudi dels cromosomes amb
bandes G es pot fer a diferents resolucions, com mes alta millor (Figura I ).
Solució de 2xSSC (citrat sòdic salí)(Merck): Citrat trissòdic es dissol amb NaCl (0.3M).
Solució Wright: Colorant Wright (Sigma): tampó Sôrensen (Merck) (1:3)
Colorant Wright : 0,25% del colorant es dissol en metanol i s 'agita durant
uns 45 min, es filtre i s 'envelleix a temperatura ambient una setmana o 3
dies a 37 "C.
Tampó Sôrensen: solució A (KH2PO4, 9.08g/l)/ solució B(Na2HPO4, 12,88 g/l) volum(l:l)
apH6.8.
59

Material i Mètodes
Figurai. Idiograma del cromosoma 1.
a) Cariotip amb nivell de ressoluáó de bandes 550 G (b) i de 650G
•35•34.2•33•322•31.3
— 22.2
M"Ve
-* i
IT- fiM
13.212
_ ¡g Centrómero
-212-22!-24
-31
I — 32:2
-42.2-43
f ¡ «c *•*,f- -U_
B U P il| M * »
13 I'l
i 5ÍIS
-li
10
16
-If-«is
«2
li
| tt
17
-
n
«, jü
-|T
1»
í*1 ** ^ AS-
II %\ /
Í ï \ t /
f ? ' * Í -tí ¿ "W*4**ït *»í í»
t t
5 1í Í *> £ ï í
1 1 ^ í í ï11 Ji h /i! f í t f Ï '« >í í ^ *fií j; •• A
* * ? •Ï! ï ff S í
^ íl I?fi :| Mïï y ft * 'í
*i W 13
ü s 81?:H K» P *Ssi si# 5 *" "
** •** ¿.( ^3T- _;(* 'IK iïl tii _
jf (, |j* p '^ &•
íí \ 8 ¥ í' '**.M 4* SI ;É* * «i.ï^ *A w $ & %V *^ .g ^ v #,
| \ / 3'W *'
•» * «
<# ^ «ï "à, é' 'k í
< / % | l I1! 11^i •** 'y *< ^0 1» II 1»
te » *í rJ I \ |» ï! ïf
|1 11 fiU 17 10
! '% :<>2 1 | £'• | 1t) § "ó P b
60

Material i Mètodes
4. EXTRACCIÓ DE DNA
4.1. EXTRACCIÓ DE DNA EN SANG
La mostra de sang s'ha de recollir amb l 'anticoagulant EDTA (ImM) i el volum ha d'ésser
de 10-20 ml, ja que si és inferior s'obté poc material.
4.1.1. Protocol de la tècnica
La mostra es renta amb sèrum fisiològic (NaCl 0.9%) a 3000 rpm durant 10 min i es treu el
sobrenadant. A continuació, s ' afegeix 30 ml de buffer de Usi (ELB-Eritròcits Usi Buffer); es
deixa 15-30 min en gel, per trencar els glòbuls vermells quedant la resta de tipus cel·lulars.
Es centrifuga 20 min a 3000 g a 4 "C. Es decanta el sobrenadant.
Per la Usi dels leucòcits s' afegeix al pel-let 25¡ú de Nonidet P-40 (detergent) al 1%, es
barreja i es centrifuga 15 min a 3.500 rpm. El precipitat es resuspèn en 5ml de tampó
d ' homogeneització, durant 2 h. Es realitza una digestió enzimàtica de les proteïnes tissulars
mitjançant la incubació d' aquesta solució amb prote ïnassa K (0.2 mg/ml) durant un per í ode
de 12 a 18 hores a 56° C, o tota la nit (overnight). Seguidament, s ' aconsegueix la
purificació del DNA o desproteïnització realitzant una sèrie d 'extraccions amb fenol i
fenol:cloroform:alcohol-isoamílic (25:24:1). L'ús de fenol a un pH>7 i la utilització de
cloroform desnaturalitza les proteïnes i facilita la formació de complexes RNA-proteïnes.
\ Aquest procés fa possible que aquests complexes RNA-proteïnes siguin solubles a la fase
orgànica i a la interfase mentre que el DNA es manté a la fase aquosa. Es recull la fase
aquosa i es centrifuga a 8 "C 10 min a 1700 g. Es recupera de nou la fase aquosa, es
realitza l 'última extracció amb fenol:cloroform:alcohol-isoamílic. A continuació, se l'hi
afegeix 0.5 volums d ' acetat amònic o NaCl. Seguidament, s'afegeixen 2.5 volums
d 'etanol absolut que altera l'estructura dels àcids nucleics i els fa precipitar. S 'agita el
tub per inversió fins que apareix la medusa de DNA, aquesta es pesca amb una pipeta Pasteur
i la resta s 'elimina. Finalment, el DNA es precipita amb etanol al 70% i amb 0.4 M NaCl,
s'elimina el sobrenadant i es deixa assecar. Es resuspèn el DNA amb 1 ml d aigua miliQ o
TE (TRIS- EDTA) i es conserva a 4 "C fins la seva utilització.
Nonidet P-40 (Fluka)Proteinassa K (Vysis.Inc).Fenol- Cloroform (Merck)Acetat Amònic (Merck)TE (IOmMTRIS.ClpH7.4, ImMEDTApHS)Buffer de Usis (ELB-Eritròcits Usis Bufer) (lOmMTris-HClpH 7.5, 0.32M sacarosa, 5mM MgCl2)Tampó d'homogeneització (WOmMNaCl, lOmMTRIS.CIH, 25mMEDTA, 0.5%SDS,pH8)
61
Material i Mètodes
4.2. EXTRACCIÓ DE DNA EN TUMORS
La mostra tumoral ha de pesar entre 50-200 mgper obtenir 100-500 ¡¿g de DNA.
4.2.¡.Protocol de la tècnica
Les mostres congelades es disgreguen en un morter fins a la seva pulverització.
El material es resuspèn amb 20 ml de tampó d 'h omogeneització i es manté a 37 °C 2-3
hores. Es realitza una digestió enzimàtica de les prote ïnes tissulars mitjançant la incubació
d 'aquesta solució amb prote ïnassa K (0.2mg/ml) a 56 "C durant un període de 12 a 18 ho
overnight. Seguidament s' aconsegueix la purificació del DNA afegint a la mostra igual
volum de fenol i deixant-ho durant 15 min per precipitar les proteïnes i desnaturalitzar
I 'excés de prote ïnassa K. Es centrifuga a 3000 rpm durant 15 min. Es recull la fase aquosa
\ i s 'aspira la fase orgànica. A la fase aquosa es realitza una sèrie d 'extraccions amb fenol
i fenol: clor of or m (50:50). Es procedeix afer I 'extracció del cloroform dues vegades, i es
centrifuga. L'última extracció es realitza amb fenol:cloroform:alcohol-isoamílic. A
continuació, s'afegeix a la fase aquosa 0.5 volums d' acetat amònic o NaCl. Seguidament,
s 'afegeixen 2.5 volums d' etanol absolut que altera I 'estructura dels àcids nucleics i els
fa precipitar. S 'agita el tub per inversió fins que apareix la medusa de DNA. Aquesta es
pesca amb una pipeta Pasteur i la reste s 'elimina. Finalment, el DNA es precipita amb
etanol al 70% i amb 0.4 M NaCl. S 'elimina el sobrenadant i es deixa assecar. Es resuspèn
el DNA amb 1 ml d 'aigua miliQ o TE i es conserva a 4 °C fins la seva utilització.
Acetat Amònic (Merck)NaCl (Merck)Tampó d'homogeneització ISOmM NaCl (Sèrum fisiològic) , 20mM TRIS-CIH,
50 mMEDTA, 4% Na lauroyl sarcosine , pH 8
62
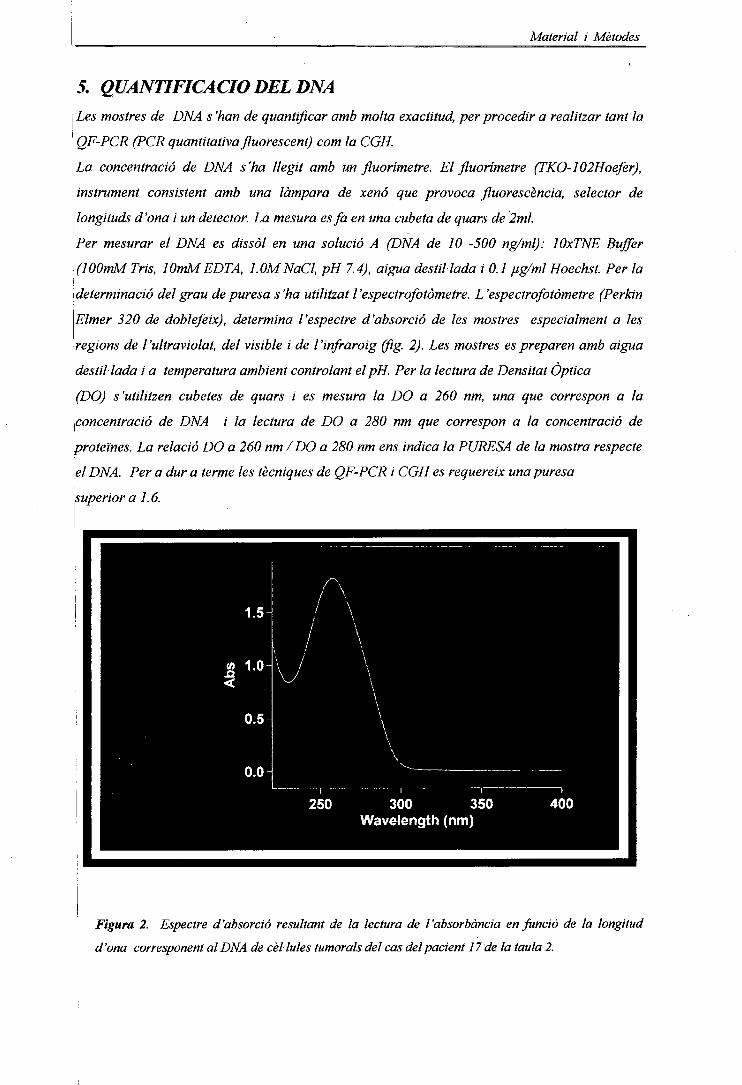
Material i Mètodes
5. QUANTIFICACIODELDNALes mostres de DNA s 'han de quantificar amb molta exactitud, per procedir a realitzar tant la
' QF-PCR (PCR quantitativa fluorescent) corn la CGH.
La concentració de DNA s'ha llegit amb un fluorímetre. El fluorímetre (TKO-102Hoefer),
instrument consistent amb una lámpara de xenó que provoca fluorescencia, selector de
j longituds d'ona i un detector. La mesura esfa en una cubeta de quars de 2ml.
Per mesurar el DNA es dissol en una solució A (DNA de 10 -500 ng/ml): lOxTNE Buffer
(lOOmM Tris, lOmMEDTA, LOMNaCl, pH 7.4), aigua destil·lada i 0.1 ug/ml Hoechst. Per la
\determinacio del grau de puresa s'ha utilitzat l'espectrofotòmetre. L'espectrofotòmetre (Perkin
Elmer 320 de doblefeix), determina l'espectre d'absorció de les mostres especialment a les
regions de l'ultraviolat, del visible i de l'infraroig (fig. 2). Les mostres es preparen amb aigua
destil·lada i a temperatura ambient controlant el pH. Per la lectura de Densitat Òptica
\(DO) s'utilitzen cubetes de quars i es mesura la DO a 260 nm, una que correspon a la
concentració de DNA i la lectura de DO a 280 nm que correspon a la concentració de
proteïnes. La relació DO a 260 nm /DO a 280 nm ens indica la PURESA de la mostra respecte
el DNA. Per a dur a terme les tècniques de QF-PCR i CGH es requereix una puresa
superior a 1.6.
300 350Wavelength (nm)
Figura 2. Espectre d'absorció resultant de la lectura de l'absorbància en funció de la longitud
d'ona corresponent al DNA de cèl·lules turnarais del cas del pacient 17 de la taula 2.
Material i Mètodes
6. PCR quantitativa fluorescent (QF-PCR)Aquesta tècnica molecular només l'hem utilitzada per la identificació d'una alteració
cromosòmica constitucional en un pacient baró amb cariotip XX (cas 4). Consisteix en
I ' amplificació de diversos marcadors polimòrfics específics, amb encebadors fluorescents i
la posterior anàlisi quantitativa dels productes d' amplificació fluorescents en un
seqüenciador de DNA.
6.1. Protocol de la QF-PCR
| El DNA genòmic total va ésser obtingut segons el mètode anteriorment descrit. Es va procedir
a realitzar múltiples amplificacions QF-PCR utilitzant marcadors altament polimòrfics STR
(Short Tandem Repeats), pel gen SRY i el gen de l'amelogenina (AMG) ubicat aprop de la
regió pseudoautosòmica del Xp (AMGX) i del Yp (AMGY).
Aquest seqüències es van marcar amb diferents molècules fluorescents o fluorocroms per
' permetre la determinació del tamany i la quantitat de producte de PCR corresponent, d'acord
amb la metodologia descrita prèviament per Cirígliano et al. 1999 i 2001.
Les amplificacions de la PCR, van ésser estandaritzats amb un volum final de 25\d,
composades per: 4\dde DNA, 200\imolll dNTP, 4-35 pmol de cada primer, 2mmol II MgCl2i
¡ IxTaq buffer,!U de Taq polimerasa (Promega. Madison WI, USA). Després de la
desnaturalitzada a 95° C durant 2 min, es realitza la PCR, 28 cicles repetits a 94°C
durant 35 segons, 58°C durant 35 segons, 72°C durant 40 segons amb una extensió final a
15 minuts a 72°C en un GeneAmp 9700 (Applied PE Biosystems. Foster City. CA. USA).
Els productes QF- PCR (l\d) són recullits recullits amb 12\d de formamida, per col·locar-los
í en un seqüenciador automàtic de ADN, ABI PRISM 310 (ABI310). Les anàlisis dels resultats
van ésser realitzades amb un GeneScan sofware 3.1 (PE Biosystems) com prèviament descrit
(Applied Biosystems. Foster City. CA. USA). El electroforetograma obtingut es mostra a la
figura 3.
64
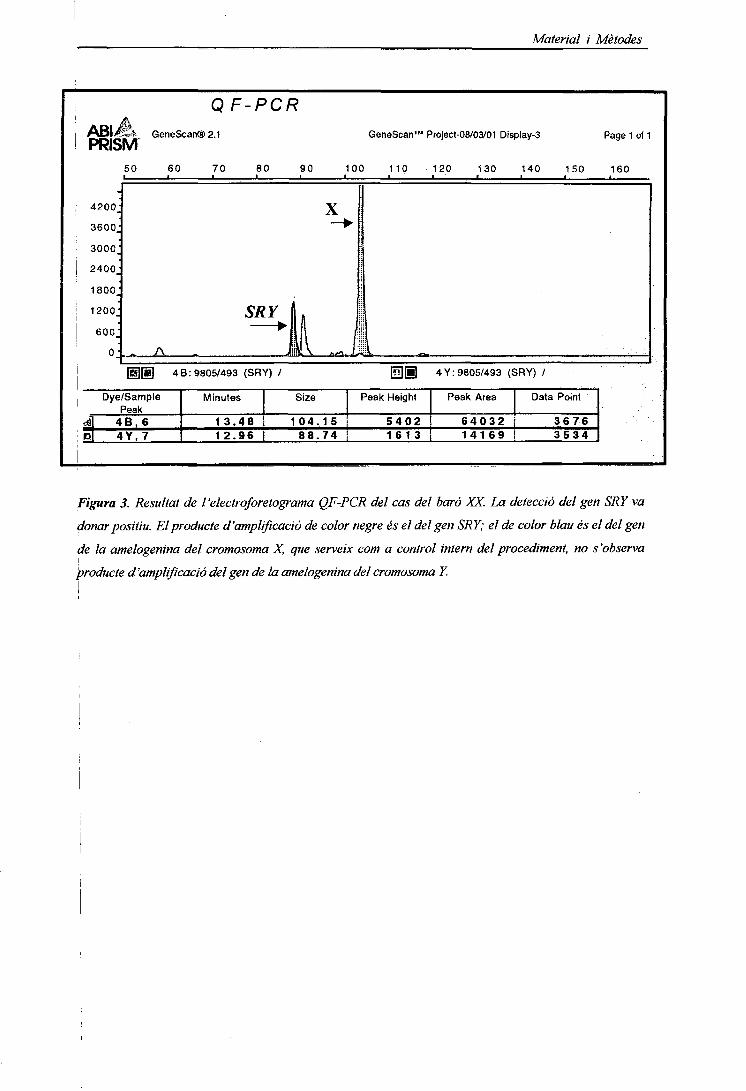
Material i Mètodes
QF-PCR
PRÉ GeneScan@2-1
4200.
3600.
3000:
2400.
1800:
1200:
G:
50 60
- A
GeneScan™ Project-08/03/01 Display-3
70 80 90 100 110
CIÒJ<
X~~*
"à
120 130 140 150
Page 1 of 1
160
'
[U[âj 48:9805/493 (SRY) / H][ll
-
E!
Dye/SamplePeak
4B, 64 Y . 7
Minutes
13.4812.96
Size
104 .15
Peak Height
5 4 0 288.74 i 1613
4 Y: 9805/493 (SRY) /
Peak Area
6 4 0 3 214169
Data Point
36763 5 3 4
Figura 3. Resultat de l'electroforetograma QF-PCR del cas del baró XX. La detecció del gen SRY va
^donar positiu. El producte d'amplificació de color negre és el del gen SRY; el de color blau és el del gen
de la amelogenina del cromosoma X, que serveix com a control intern del procediment, no s'observa
producte d'amplificació del gen de la amelogenina del cromosoma Y.
Material i Mètodes
7. Hibridació in situ Fluorescent (FISH).
Aquesta tècnica d'hibridació s'ha utilitzat per confirmar el cromosoma implicat en
determinades alteracions cromosòmiques constitucionals emprant sondes específiques
comercials (Vysis- Cytocell).
7.1. Painting
7.1.1. Protocol de la tècnica.
Les extensions amb les metafases obtingudes del cultiu de limfòcits o d'amniòcits han d'ésser
envellides abans de procedir a la hibridació. Si no s'ha de realitzar aquesta tècnica
d'immediat, es guarden a -20 °C fins la seva utilització. La tècnica requereix una
preparació dels portes i de les sondes prèvia a la hibridació i de un rentat post- hibridació.
Per la post-fixació de les preparacions, les introduïm durant 10 min en una solució del 1% de
Formaldèhid en 2xSSC, es renten dues vegades amb 2xSSC durant 5 min, es renten amb aigua
bidestil·lada i es deixen assecar. En aquest pas podem guardar les extensions congelades a -
20 "C, fins la seva utilització.
7.1.2. Preparació dels portes
Abans de realitzar la FISH es passen els portes per una solució 2xSSC , pH 5.3, 0.2% twen-
20 a temperatura ambient. Els portes es submergeixen en la solució de desnaturalització; 49
ml formamida 100% (Boehringer Mannheim): 7ml de 20xSSC, pH 5.3: 14 ml d 'aigua
tridestil·lada. durant 5 min a temperatura adequada; 73 "C-74 "C. Es realitza un pre-
tractament de les preparacions en 2xSSC, pH 5.3, a 37 "C durant 30 min i després es
desnaturalitzen en una solució de 70% de formamida/2xSSC, durant 2 min a 72 "C.
Posteriorment, es procedeix a la deshidratació de la preparació utilitzant concentracions
d 'etanols freds a 70%-85%-100% durant 1 min a cadascun d 'ells. S'assequen a
temperatura ambient.
7.1.3. Preparació de sondes
Es prepara: una barreja de lui de sonda comercial del cromosoma a estudiar, 7ui de buffer,
2 ui d 'aigua tridestil·lada a temperatura ambient. S'ha de tenir cura amb la llum ja que les
sondes estan marcades amb fluorocroms i perdran afinitat si no es tapen. Es fa un pols amb la
microcentrifuga (eppendorf-centrifuge 5415 c) durant 1 a 3 seg per barrejar bé. La sonda es
posa a desnaturalitzar al bany de 73 °C durant 5 min.
7.1.4. Hibridació
Els portes s 'atemperen a 40 °C i s'hi afegeix uns 10-15 ui de la sonda . Es segella el
cubre sobre el portaobjectes amb goma líquida i es posa a hibridar en una caixa fosca i
humida o s'utilitza I 'aparell Hibrite (Izasa) de 12-16 h i a 37 "C-42 "C depenent del tipus
de sonda.
66
Material i Mètodes
7.1.5. Rentáis post-hibridació
Després de les 12-16 h d'hibridació es treu el cubre del portaobjectes. La preparado es
submergeix en una cubeta amb 0.4x SSC /0.3 NP-40 2 min agitant 1-3 seg, i després en una
altra cubeta 2x SSC 10.1.1% NP-40 a temperatura ambient 3 min agitant 1-3 seg.
Seguidament, les preparacions es deixen assecar i es procedeix a la contratinció DAPI i a
I 'observació i estudi al microscopi de fluorescencia.
7.2. Multipainting
7.2.1.Optimització de la tècnica
Per realitzar el pintat de tots els cromosomes (painting) simultàniament, s'ha utilitzat el Kit
Chromoprobe-M Multiprobe System, ( CytoCell Ltd, UK), que permet l'observació del painting
de tots els cromosomes en el mateix portaobjectes però cadascun de forma separada en
meta/ases independents.
Aquest portaobjectes està dividit en 24 àrees, enumerat respecte els diferents parells
cromosòmics i un suport multisonda de la mateixa mida del portaobjectes que conté 24 pouets
on cadascun d'ells conté la sonda d'un cromosoma marcada amb el fluorocrom Cy3. La
mostra es va col·locant a cada àrea del pona subministrat pel kit (2\dlàrea). A cada pouet
del suport multisondes s'hi afegeixen 2\d de solució d' h i bridado escalfat prèviament, 2min
, a 37 °C. A continuació, es fa coincidir el portaobjectes amb el suport de forma que quedin
correctament encaixades les diferents àrees del portaobjectes amb el seu pouet corresponent.
Un cop encaráis i unit el portaobjectes amb el suport, es posen a la placa calefactora a 75 °C
; durant 5 min, col·locant-se després a la cambra d'hibridació a 37 °C overnight. Finalment,
es realitzen els rentáis post-hibridació (tal com s'indica a l'apartat anterior) i la contratinció
amb DAPI seguint el protocol de la casa comercial.
67

Material i Mètodes
8. HIBRIDACIÓ GENOMICA COMPARADA
Aquesta técnica va ser descrita per Kallionemi et al. (1992), i permet una anàlisi global del
genoma humà.
Es basa en la hibridació competitiva simultània de DNA problema i DNA control o normal
marcats diferencialment sobre cromosomes metafàsics normals .
8.L OPTIMITZACIÓ DE LA TÉCNICA
En la figura 4 s'esquematitza el protocol de CGH utilitzat.
8.1.1. Preparado dels poríaobjectes
La major part de I 'estudi s 'ha realitzat amb portes comercials (Vysis - CGH Metaphase
Target Slides 46,XY). Però inicialment es van preparar els portes controls, amb la següent
metodologia:
S 'extreu sang d 'un individu normal, es posa a cultivar i es processa fins a obtenir
preparacions on hi ha cromosomes en estadi metafàsic ben extesos per facilitar al màxim
I ' òptima hibridació. Aquests cromosomes, han d ' ésser évaluais al microscopi de contrast
de fases tant cromato (cromosomes foscos) com morfològicament (cromosomes ben llargs,
sense sol·lapacions). Cal asegurar que la preparació sigui ben neta i sense restes
citoplasmàtiques, ja que dificultaria la hibridació. Aquestes preparacions s' envelleixen a
• í / 'estufa a 37 "C de 15-40 hores o durant 5 dies a temperatura ambient, perquè el material
es faci més resistent ja que sinó a la hibridació els destruiria. Aquest material es pot guardar
fins a la seva utilització, durant un màxim de 6 mesos, congelat a -20 "C.
8.1.2. Marcatge del DNA per NICK TRANSLATION
El DNA problema extret a partir de sang, líquid amniòtic o tumor, i el DNA control es
marquen amb nucleòtids que porten els fluorocroms incorporats, la Fluoresceïna F1TC (verd)
• i el Texas Red 77?® (vermell), respectivament o a l'inrevés. El marcatge es va estandaritzar
marcant el DNA problema amb Texas Red i el DNA normal amb Fluoresceïna, ja que el
Texas Red marca més intens i es controlava millor el DNA problema.
\ Pel marcatge dels DNAs es prepara segons s'indica a continuació:
68

Material i Mètodes
Per un volum total de 5Q\d,
DNA concentració
22.5pÏH2Ô miliQ -X
2,5 ¡¿l FluorocromVerd/ Vermell
Sui OJmMdTTP
10 fil dNTP mix 10 \dC +A +G
5 ni 10 x Buffer Nick
\
5-10 ni Nick Translation Enzim
DNA Pol-1/Dnase I
Volum Total: 5Q\d
X
22.5
-X
2.5
5
10
5
5
50^1
X ¡il de DNA per obtenir una quantitat total de 700-1 OOOng
Aigua estèril miliQ
2,5\d Fluorocroms:
Verd- 2.5^1 0.2mM de Spectrum Green (FITC)
Vermell-2.5\d 0.2mM de Spectrum Red (TexasRed)
Equivalència: ¡Oui ¡mM dUTP (¡nmol de Fluorescein-12- dUTP o
Texas Red-5-dUTP) 40 ¡il aigua tridestil·lada estèril
5¡íl 0 .ImM dTTP : lOulO.SmMdTTP
20/Ltl d 'aigua estèril-miliQ
lOiílO.lmMdNTP mix: 10\d de 0.3mM dATP
lOfíldeO.SmMdCTP
lOfjil de 0.3mM dGTP
(bases nitrogenades, dCTP 200/jM, dGTP 200 fiM, dATP 200 pM)
5¡íl de buffer: lOx Nick Translation Buffer
(Tris-HCl SOOmMpH 7.2, 10mMMgSO4 , ImM DDT)
5¡íl d 'enzim: Nick Translation Enzyme.
(Dnase I -stock 3mg/ml. 1:2000 aigua estèril miliQ DNA-polymerasa I- 5
U/ul; en 50% glycerol)
Aquesta barreja s 'afegeix en tubs de microcentrífuga (o eppendorfs) i s ' incuba en un
bany a 15 °C durant 1-2 hores. La reacció s 'atura amb una incubado a 75°C durant 10
minuts per desnaturalitzar els enzims, i evitar la degradació del DNA.
69
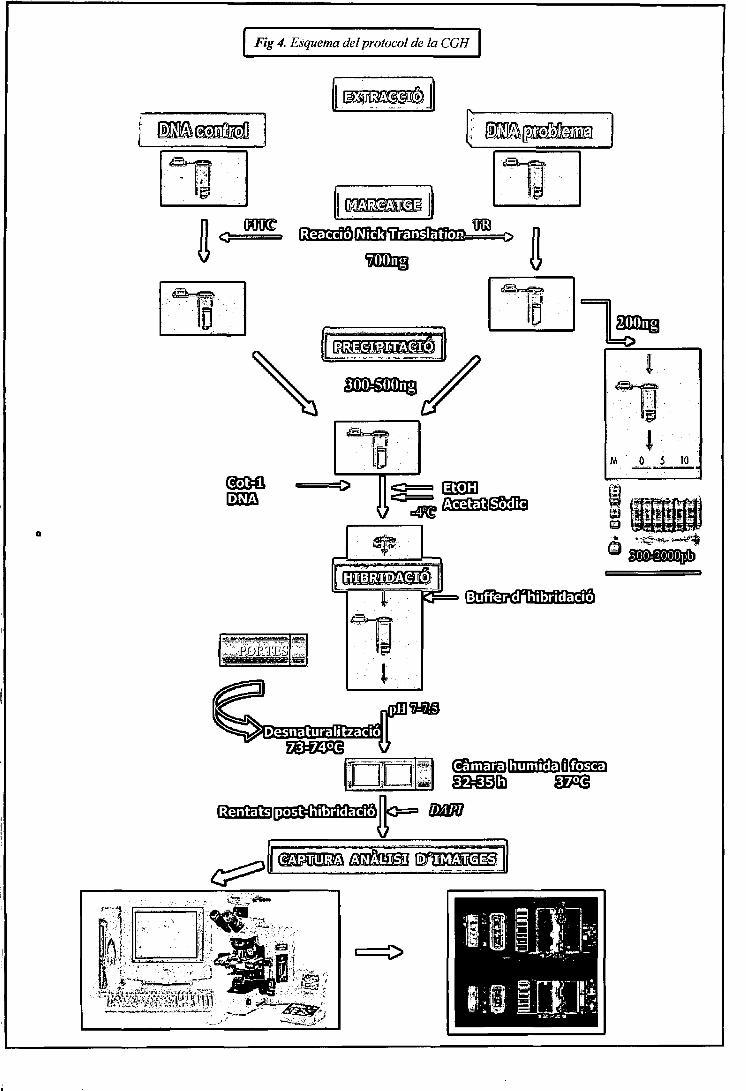
Oç,é
ó
ï^ ¿ Esquema del protocol de la CGH
ffé ¡i
oD€féoofe
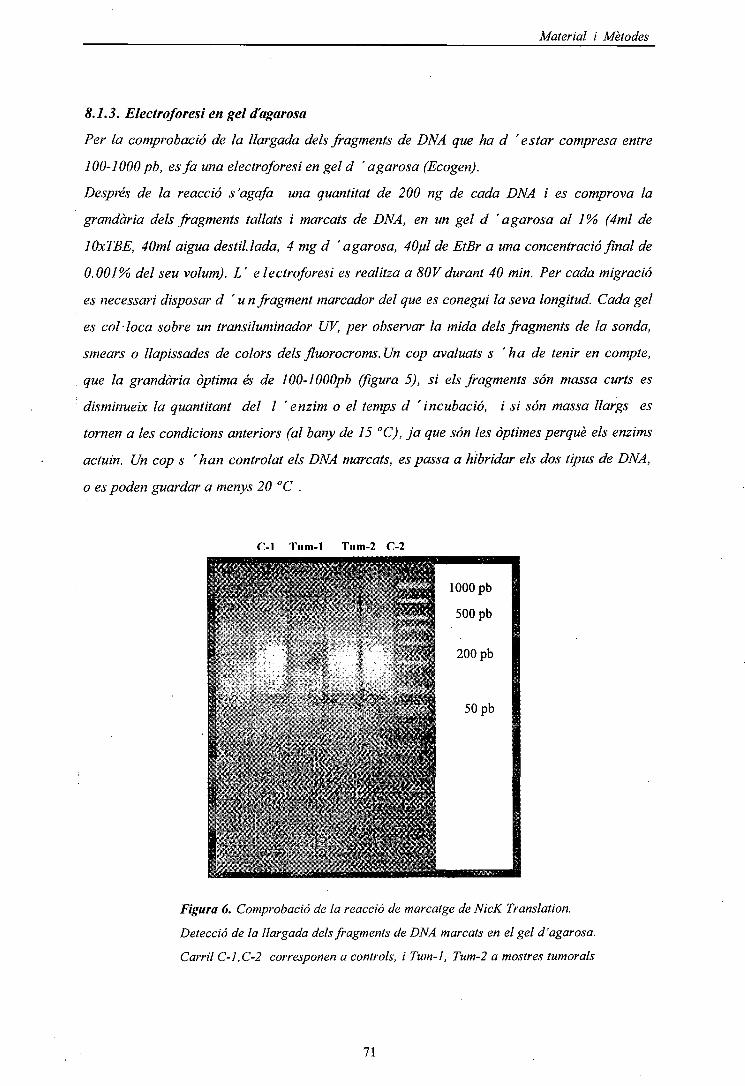
Material i Mètodes
8.1.3. Electroforesi en gel d'agarosa
Per la comprobado de la llargada dels fragments de DNA que ha d 'estar compresa entre
J 00-1000 pb, es fa una electroforesi en gel d ' a garosa (Ecogen).
Després de la reacció s'agafa una quantitat de 200 ng de cada DNA i es comprova la
grandària dels fragments tallats i marcats de DNA, en un gel d ' a garosa al 1% (4ml de
lOxTBE, 40ml aigua destil·lada, 4 mg d ' a gar osa, 40ul de EtBr a una concentrado final de
0.001% del seu volum). L' electroforesi es realitza a 80Vdurant 40 min. Per cada migració
es necessari disposar d ' u n fragment marcador del que es conegui la seva longitud. Cada gel
es col·loca sobre un transiluminador UV, per observar la mida dels fragments de la sonda,
smears o llapissades de colors dels fluorocroms. Un cop avaluats s ' ha de tenir en compte,
que la grandària òptima és de 100-lOOOpb (figura 5), si els fragments són massa curts es
disminueix la quantitant del I 'enzim o el temps d 'incubació, i si són massa llargs es
tornen a les condicions anteriors (al bany de 15 °C), ja que són les òptimes perquè els enzims
actuin. Un cop s 'han controlat els DNA marcats, es passa a hibridar els dos tipus de DNA,
o es poden guardar a menys 20 °C .
r-1 Tnm-T Tiim-2 C-2
Figura 6. Comprobado de la reacció de marcatge de NicK Translation.
Detecció de la llargada dels fragments de DNA marcats en el gel d'agarosa.
Carril C-l,C-2 corresponen a controls, i Tum-1, Tum-2 a mostres turnarais
71

Material i Mètodes
8.1.4. Precipitació de les sondes
S 'hibriden quantitats iguals de 300ng-500ng de DNA problema i de DNA normal.
S 'afageix 10-15 \d de DNA Cot-1 huma (15 ng) (Vysis), ja que la Cot bloqueja la
heterocromatina o DNA rie en seqüències altament repetitives, així s 'evita que el DNA
hibridi de forma inéspecífica en zones que no resulten informatives, o en zones que puguin
donar falsos positius. Tot junt es co-precipita amb 2,5 volums d 'etanol pur fred (EtOH
100%)(Merck) i 0.1 volums d 'acetat sòdic 3MpH 5.5, en gel o al congelador uns 20 min.
Es pasa a centrifugar a 12.000 rpm durant 30 min, a 4 °C. Es decanta el sobrenadan! i
s 'intenta fer evaporar tot I 'etanol, retingut a les parets del eppendorff, a 37 °C durant
10-15 min, ja que podria interferir en la desnaturalització dels DNAs. Es resuspèn en 15 [d de
buffer d 'hibridació o Solució A*. Es procedeix a una centrifugada curta (spin), i es deixa a
temperatura ambient uns 15-20 min per permetre una total dissolució.
*Solució A: 50% de Formamida desionitzada +150% Master Mix (20% dextrà sulfat : 2g dextrà sulfat +
lml20xSSC, +9 ml d'aigua miliQ).
8.1.5. Desnaturalització de les sondes
Les sondes son desnaturalitzades durant 6-8 min en un bany a 72-74 °C
8.1.6. Desnaturalització dels portaobjectes
1 Es seleccionen les àrees dels portaobjectes on hi ha més metafases i es marca per sota el
vidre amb llapis de diamant. Es desnaturalitzen en una solució de: 49ml Formamida, 7ml
2xSSC, 14ml aigua miliQ, durant 5-8 min a 73-74 °C, a pH 7-7.5 equilibrant-ho amb HCl al
,35%. Quan la solució de desnaturalització arriba a 73-74 °C s 'hi introdueixen els
portaobjectes amb metafases normals (Vysis) durant 5-6 min. Es convenient no fer servir més
de 4 portaobjectes alhora. Es deshidraten 1 min en una sèrie d 'etanols freds al 70%- 90%-
100 %, per treure I 'excés d 'etanol i es deixent assecar a la foscor a temperatura
ambient.
8.1.7. Hibridació
Els portaobjectes s 'escalfen a 37 °C uns 3 min. Paral -lelament es desnaturalitza la sonda
6-8 min a 72-74 °C per tal d'obrir les cadenes de DNA per hibridar amb els cromosomes
dels portaobjectes. S'aplica la sonda desnaturalitzada sobre del portaobjectes on s 'ha
escullit I 'àrea òptima. Es col·loca el cubreobjectes (20x20mm) i es sella amb goma líquida
í especial. Es posa a hibridar tot junt en una caixa humida i fosca durant 2-3 dies en una
estufa a 37 °C.
72
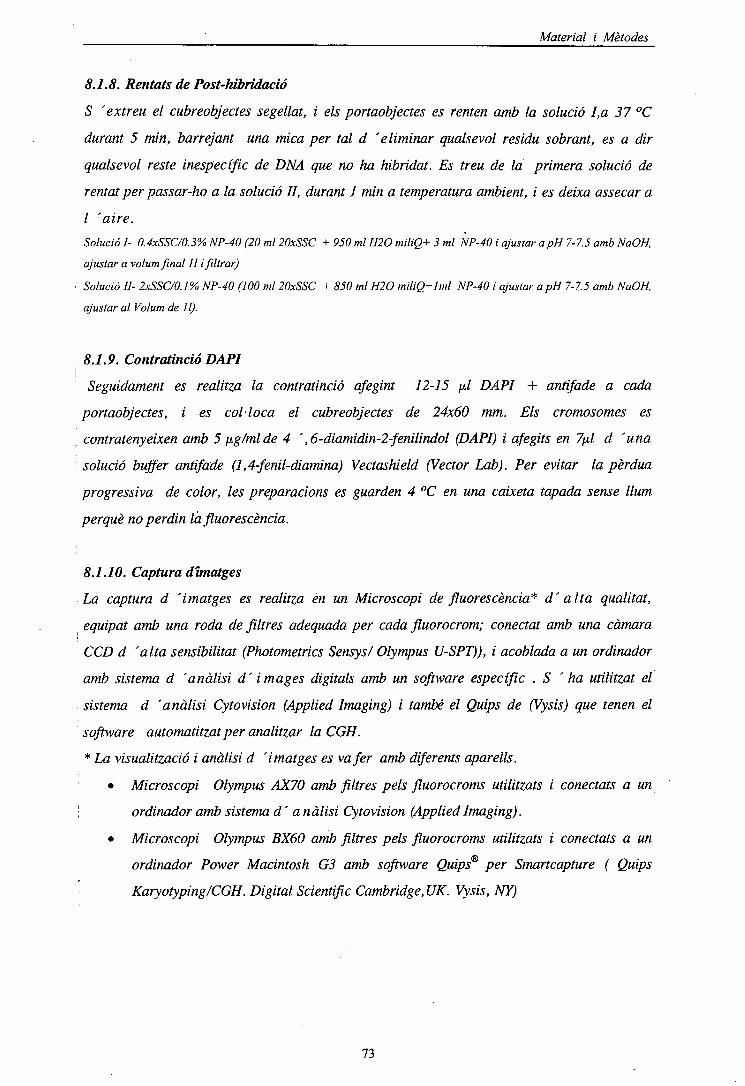
Material i Mètodes
8.1.8. Rentáis de Post-hibridació
S 'extreu el cubreobjectes segellat, i els portaobjectes es renten amb la solució I,a 37 °C
durant 5 min, barrejant una mica per tal d 'eliminar qualsevol residu sobrant, es a dir
qualsevol reste inespecífic de DNA que no ha hibridat. Es treu de la primera solució de
rentat per passar-ho a la solució II, durant 1 min a temperatura ambient, i es deixa assecar a
I 'aire.
Solució I- 0.4xSSC/0.3% NP-40 (20 ml 20xSSC + 950 ml H2O miliQ+ 3 ml NP-40 i ajustar apH 7-7.5 amb NaOH,
ajustar a volum final 11 i filtrar)
Solució II- 2xSSC/0.1% NP-40 (100 ml 20xSSC + 850 ml H2O miUQ+lml NP-40 i ajustar apH 7-7.5 amb NaOH,
ajustar al Volum de 11).
8.1.9. Contratinció DAPI
Seguidament es realitza la contratinció afegint 12-15 \d DAPI + antifade a cada
portaobjectes, i es col·loca el cubreobjectes de 24x60 mm. Els cromosomes es
contratenyeixen amb 5 pg/mlde 4 ',6-diamidin-2-fenilindol (DAPI) i afegits en 7^1 d 'una
solució buffer antifade (1,4-fenil-diamina) Vectashield (Vector Lab). Per evitar la pèrdua
progressiva de color, les preparacions es guarden 4 °C en una caixeta tapada sense llum
perquè no perdin la fluorescencia.
8.1.10. Captura dímatges
La captura d 'imatges es realitza en un Microscopi de fluorescencia* d'alta qualitat,
t equipat amb una roda de filtres adequada per cada fluorocrom; conectat amb una cámara
CCD d 'alta sensibilitat (Photometries Sensys/ Olympus U-SPT)), i acoblada a un ordinador
amb sistema d 'anàlisi d' images digitals amb un software específic . S ' ha utilitzat el
sistema d 'anàlisi Cytovision (Applied Imaging) i també el Quips de (Vysis) que tenen el
software automatitzat per analitzar la CGH.
* La visualització i anàlisi d 'imatges es va fer amb diferents aparells.
• Microscopi Olympus AX70 amb filtres pels fluorocroms utilitzats i conectáis a un
! ordinador amb sistema d ' a nàlisi Cytovision (Applied Imaging).
• Microscopi Olympus BX60 amb filtres pels fluorocroms utilitzats i conectáis a un
ordinador Power Macintosh G3 amb software Quips® per Smartcapture ( Quips
i Karyotyping/CGH. Digital Scientific Cambridge, UK. Vysis, NY)
73
Material i Mètodes
Per visualitzar cada fluorocrom, respecte la seva longitud d'ona o combinacions, hi ha
diferents filtres* específics que s'han d'acomodar als microscopis:
• Filtre de fluorescencia pel color vermell U-MWIY, per captar el marcatge del
fluorocrom amb vermell del TR (Texas Red).
• Filtre de fluorescencia pel color verd U-MNIBA per captar el marcatge del fluorocrom
amb verd FITC (Fluorescein isothiocyanate)
• Filtre de fluorescencia pel color blau U-MNU per captar el marcatge del fluorocrom
amb blau DAPI.
• Filtre de fluorescencia triple P/F/Pi 510.
A la figura 6, es mostra els diferents tipus de fluorocroms amb els seus nivells d'exitació i
emissió, i filtres utilitzats per l'anàlisi de CGH
Barrier Finer'í/ • •
Extíter Pllwr"
Dichrolc Mirror
Figura 6. Tipus de fluorocroms i filtres utilitzats per l'anàlisi de CGH:
(a) Tipus de filtres
(b) Nivells d'excitació i emissió dels diferents fluorocroms
Material i Mètodes
8.1.11. Anàlisi dîmatges
Les imatges més idònies són aquelles en que les meta/ases tenen els cromosomes llargs, poc
solapáis, i amb la fluorescencia verda i vermell equivalent. Per l'anàlisi de cada mostra van
ser captades de 10-25 metafases amb hibridacions uniformes d'alta intensitat. El software de
CGH permet obtenir un perfil de fluorescencia de tots els cromosomes de cada metafase.
Però, prèviament cal controlar que hi hagi un patró d'hibridació uniforme, no granulos, amb
una adequada intensitat, mínim de background de fluorescencia, una segmentació dels
cromosomes, una normalització d'intensitat de fluorescencia, una determinació dels perfils
d 'intensitat per integració dels valors pixel normalitzats al llarg de línies perpendiculars a
l'eix del cromosoma, i una determinació del quocient de fluorescencia del perfil d'intensitats
de fluorescencia verd/vermell, que representa el perfil de cada cromosoma.
Per cada metafase es van capturar les imatges corresponents a la fluorescencia verd, vermell
i blau i van ser analitzades com a imatges separades (fig 7). L'imatge que representa el
contrast D API blau va ésser invertida i utilitzada per cariotip semiautomatic. Les
fluor es cències o intensitats fluorescent verdes (DNA control) i vermelles (DNA problema) van
ésser determinades per cada cromosoma des del telòmer p fins el telòmer q integrant
intensitats a intervals de 1 pixel al llarg de l 'eix medial del cromosoma després de la
correcció del background i de la normalització del ratio entre verd i vermell per cada
metafase sencera establert en 1.0, es van calcular després els perfils del ratio d'intensitat
fluorescent de verd a vermell, en tots els cromosomes. La intensitat total depèn de molts
factors, per tant a la captura s'ha de procedir a una normalització dels factors que hi actuen.
L'aparell combina les dades de totes les metafases analitzades en cada hibridació i es va
. determinar un perfil de ratio mig per cada cromosoma. Cada idiograma del cromosomes
mostra el perfil de CGH de cadascun, i els ratio valorats estan entre 1.25 i 0.75 per
representar els guanys i pèrdues respectivament de cada cromosoma. L'expressió d'alts nivells
de DNA (amplificació o grans guanys) està considerat quan la fluorescencia mitjana
sobrepassa de 1.5. La selecció dels límits s'ha defer enfundó de laploïdia del tumor i de la
qualitat de les hibridacions en casos que s'analitzi DNA tumoral. Els resultats es van
comprovar amb interval de confiança del 95%. En la figura 8 es mostren els perfils obtinguts
de l'anàlisi de CGH.
75
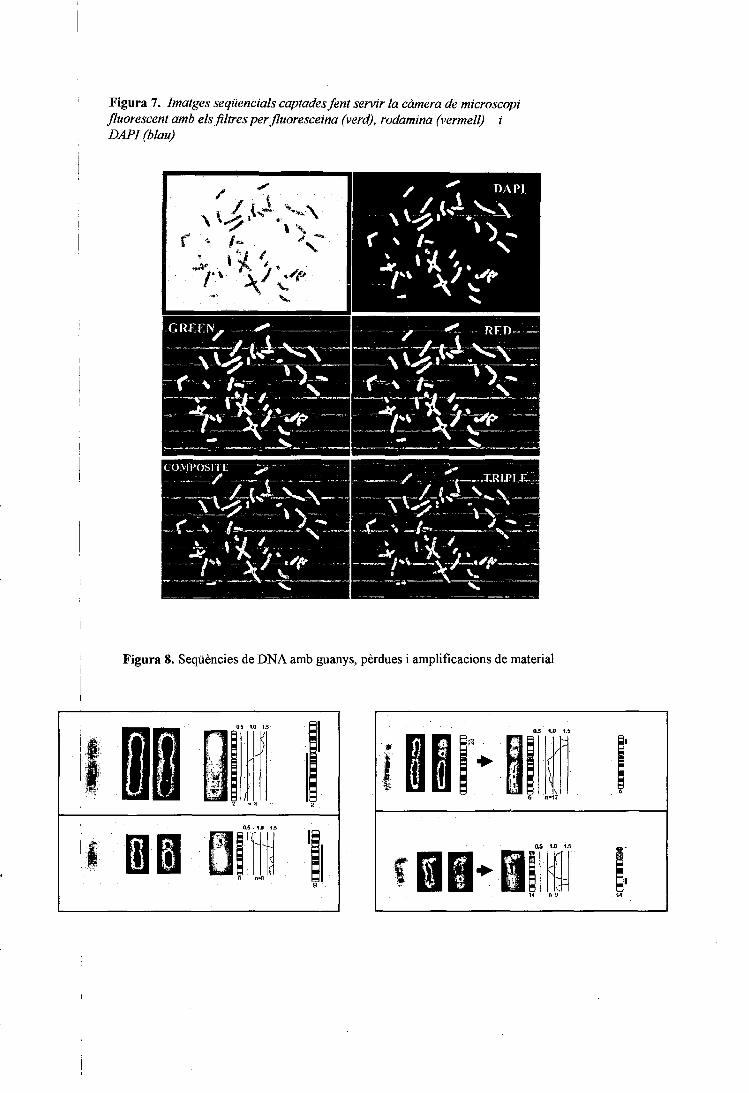
Figura 7. Imatges seqüencials captades fent sen'ir la camera de microscopifluorescent amb els filtres per fluoresceina (verd), rodamina (vermell) iDAPI (blau)
Figura 8. Seqüències de DNA amb guanys, pèrdues i amplificacions de material
0.5 U) 1.5
J
l\2 n=8
05 . 1J) 1.S
d
f
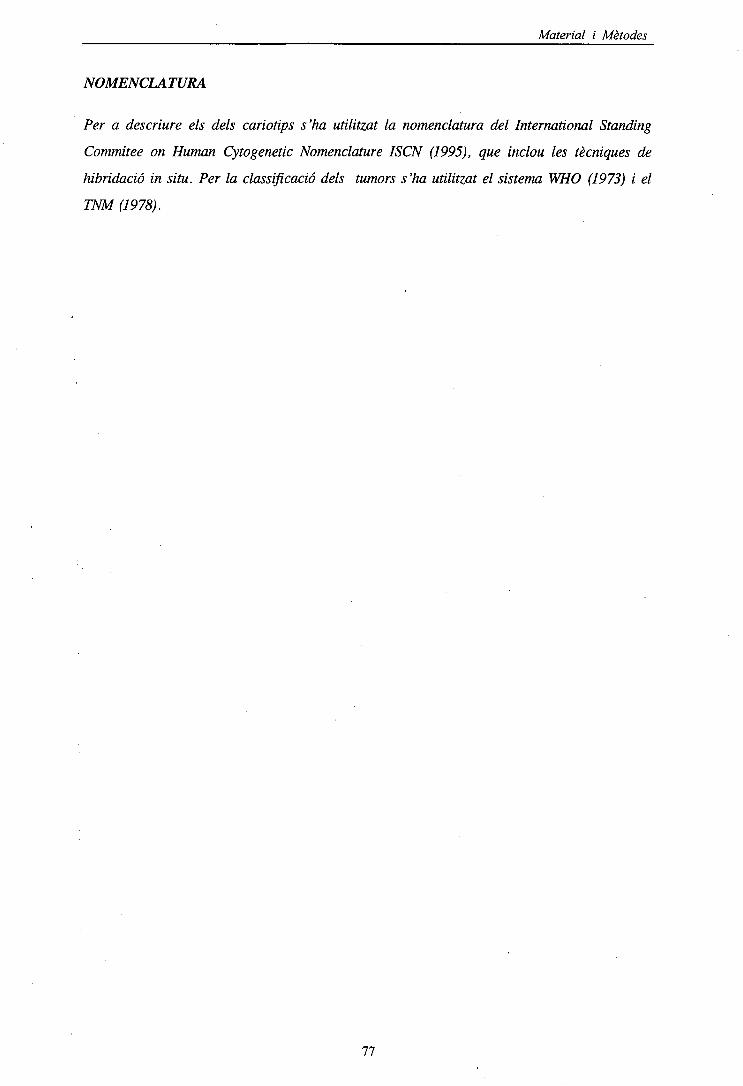
Material i Mètodes
NOMENCLATURA
Per a descriure els dels caríotips s'ha utilitzat la nomenclatura del International Standing
Commitee on Human Cytogenetic Nomenclature ISCN (1995), que inclou les tècniques de
hibridació in situ. Per la classificació dels tumors s'ha utilitzat el sistema WHO (1973) i el
TNM (1978).
77

Resultats
4. RESULTATS
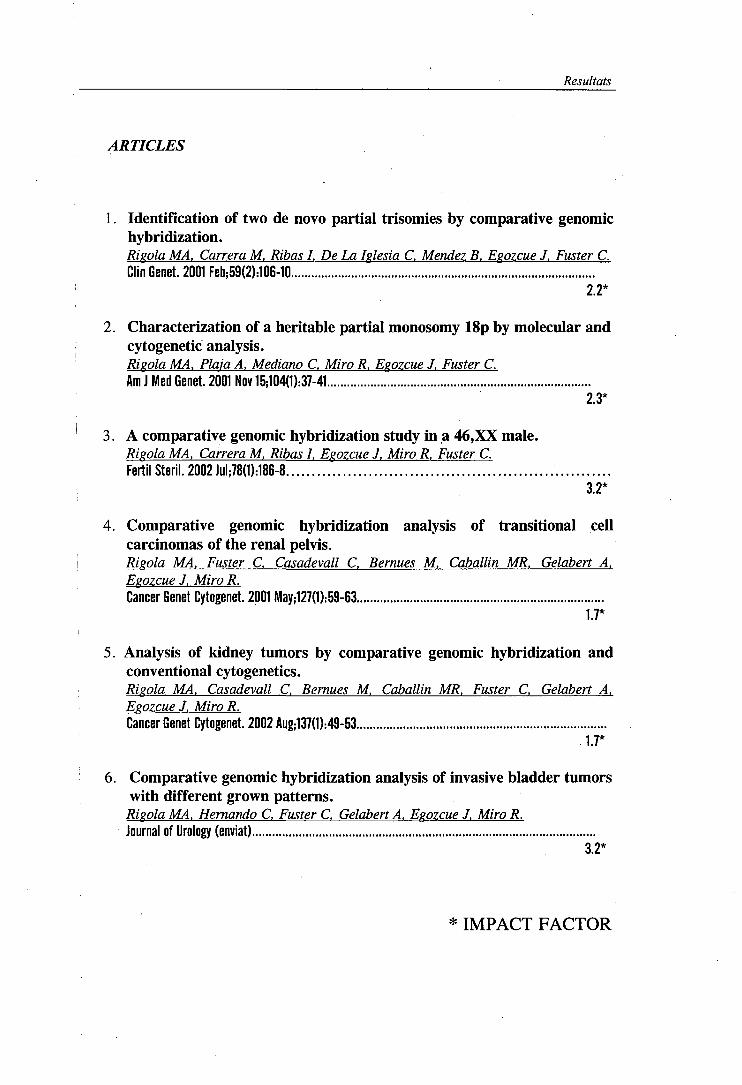
Resultats
ARTICLES
1. Identification of two de novo partial trisomies by comparative genomichybridization.Rigola MA, Carrera M, Ribas I, De La Iglesia C, Méndez B, Esozcue J, Fuster C.Clin Genet. 2001 Feb;59(2):106-10
2.2*
2. Characterization of a heritable partial monosomy 18p by molecular andcytogenetic analysis.Rigola MA, Plaia A, Mediano C. Miro R, Egozcue J, Fuster C.Am J Med Genet. 2001 Nov 15;104(1):37-41
2.3*
3. A comparative genomic hybridization study in a 46,XX male.Rigola MA, Carrera M, Ribas 7. Eçozcue J, Miro R, Fuster C.Fèrtil Steril. 2002 Jul;78(1):186-8
3.2*
4. Comparative genomic hybridization analysis of transitional cellcarcinomas of the renal pelvis.Rigola MA, Fuster C, Casadevall C, Bernues M, Caballin MR, Gelabert A,Egozcue J, Miro R.Càncer Genet Cytogenet. 2001 May;127(1):59-63
1.7*
5. Analysis of kidney tumors by comparative genomic hybridization andconventional cytogenetics.Risola MA, Casadevall C. Bemues M, Caballin MR, Fuster C, Gelabert A,Egozcue J, Miro R.Cancer Genet Cytogenet. 2002 Aug;137(1):49-53
.1.7*
6. Comparative genomic hybridization analysis of invasive bladder tumorswith different grown patterns.Rigola MA, Hernando C, Fuster C, Gelabert A, Egozcue J, Miro R.Journal of Urology (enviat)
3.2*
* IMPACT FACTOR
Resultats
Identification of two de novo partial trisomies by comparative genomichybridization.Rigola MA, Carrera M, Ribas I, De La Iglesia C, Méndez B, Egozcue J, Fuster C.Clin Genet. 2001 Feb;59(2):106-10
2.2*
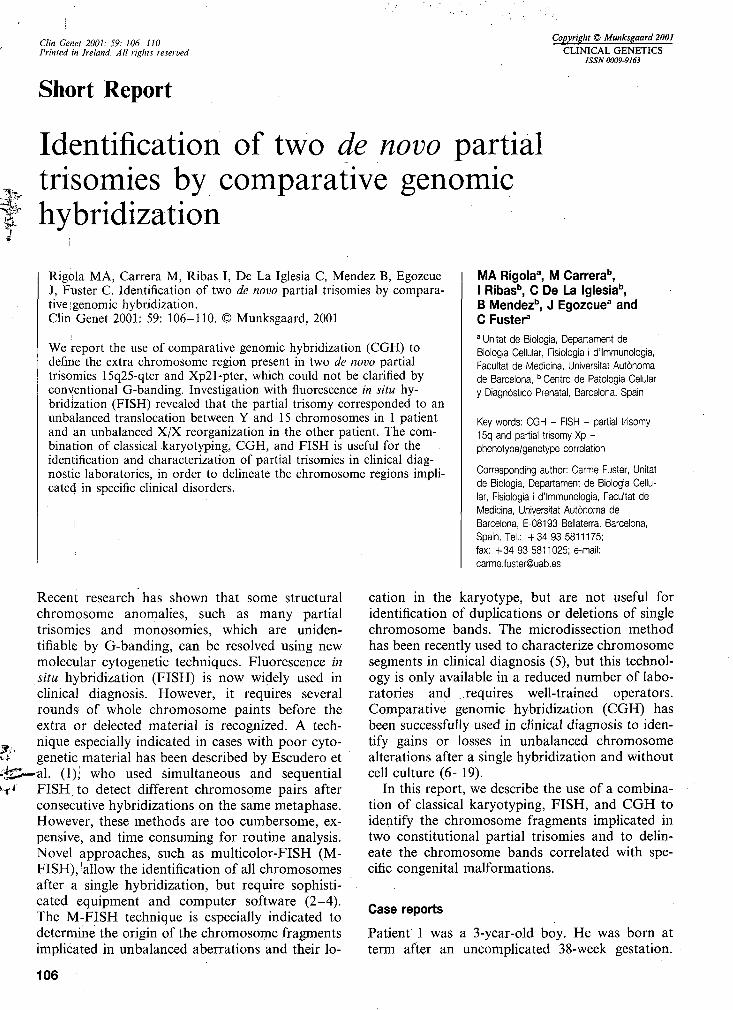
Clin Genet 2001: 59: 106-110Printed in Ireland. All rights reserved
Copyright © Munksgaard 2001
CLINICAL GENETICSISSN 0009-9163
Short Report
:
Identification of two de novo partialtrisomies by comparative genomichybridization
Rigola MA, Carrera M, Ribas I, De La Iglesia C, Méndez B, EgozcueJ, Fuster C. Identification of two de novo partial trisomies by compara-tive igenomic hybridization.Clin Genet 2001: 59: 106-110. © Munksgaard, 2001
We report the use of comparative genomic hybridization (CGH) todefine the extra chromosome region present in two de novo partialtrisomies 15q25-qter and Xp21-pter, which could not be clarified byconventional G-banding. Investigation with fluorescence in situ hy-bridization (FISH) revealed that the partial trisomy corresponded to anunbalanced translocation between Y and 15 chromosomes in 1 patientand 'an unbalanced X/X reorganization in the other patient. The com-bination of classical karyotyping, CGH, and FISH is useful for theidentification and characterization of partial trisomies in clinical diag-nostic laboratories, in order to delineate the chromosome regions impli-cated in specific clinical disorders.
Recent research has shown that some structuralchromosome anomalies, such as many partialtrisomies and monosomies, which are uniden-tifiable by G-banding, can be resolved using newmolecular cytogenetic techniques. Fluorescence insitu hybridization (FISH) is now widely used inclinical diagnosis. However, it requires severalrounds of whole chromosome paints before theextra or delected material is recognized. A tech-nique especially indicated in cases with poor cyto-genetic material has been described by Escudero etal. (1); who used simultaneous and sequentialFISH, to detect different chromosome pairs afterconsecutive hybridizations on the same metaphase.However, these methods are too cumbersome, ex-pensive!, and time consuming for routine analysis.Novel approaches, such as multicolor-FISH (IM-PISH), ^allow the identification of all chromosomesafter a single hybridization, but require sophisti-cated equipment and computer software (2-4).The M-FISH technique is especially indicated todetermine the origin of the chromosome fragmentsimplicated in unbalanced aberrations and their lo-
MA Rigola3, M Carrera",I Ribasb, C De La Iglesia0,B Méndez13, J Egozcue3 andC Fuster3
a Unitat de Biologia, Departament deBiologia Cellular, Fisiologia i d'Immunologia,Facultat de Medicina, Universitat Autònomade Barcelona,b Centro de Patología Celulary Diagnóstico Prenatal, Barcelona, Spain
Key words: CGH - FISH - partial trisomy15q and partial trisomy Xp -phenotype/genotype correlation
Corresponding author: Carme Fuster, Unitatde Biologia, Departament de Biologia Cellu-lar, Fisiologia i d'Immunologia, Facultat deMedicina, Universitat Autònoma deBarcelona, E-08193 Bellaterra, Barcelona,Spain. Tél.: +3493 5811175;fax: +34935811025; e-mail:[email protected]
cation in the karyotype, but are not useful foridentification of duplications or deletions of singlechromosome bands. The microdissection methodhas been recently used to characterize chromosomesegments in clinical diagnosis (5), but this technol-ogy is only available in a reduced number of labo-ratories and ..requires well-trained operators.Comparative genomic hybridization (CGH) hasbeen successfully used in clinical diagnosis to iden-tify gains or losses in unbalanced chromosomealterations after a single hybridization and withoutcell culture (6-19).
In this report, we describe the use of a combina-tion of classical karyotyping, FISH, and CGH toidentify the chromosome fragments implicated intwo constitutional partial trisomies and to delin-eate the chromosome bands correlated with spe-cific congenital malformations.
Case reports
Patient 1 was a 3-year-old boy. He was born atterm after an uncomplicated 38-week gestation.
'l 06
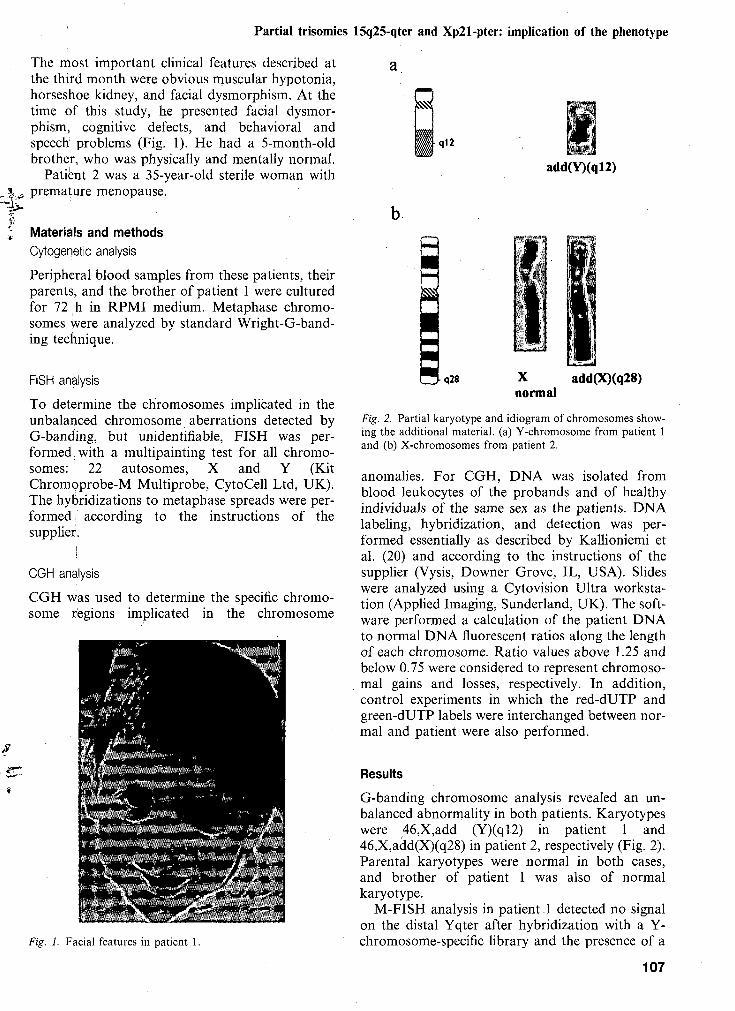
Partial trisomies 15q25-qter and Xp21-pter: implication of the phenotype
The most important clinical features described atthe third month were obvious muscular hypotonia,horseshoe kidney, and facial dysmorphism. At thetime of this study, he presented facial dysmor-phism, cognitive defects, and behavioral andspeech problems (Fig. 1). He had a 5-month-oldbrother, who was physically and mentally normal.
Patient 2 was a 35-year-old sterile woman withpremature menopause.
• q 1 2
add(Y)(q!2)
Materials and methodsCytogenetic analysis
Peripheral blood samples from these patients, theirparents, and the brother of patient 1 were culturedfor 72 h in RPMI medium. Metaphase chromo-somes were analyzed by standard Wright-G-band-ing technique.
FISH analysis
To determine the chromosomes implicated in theunbalanced chromosome aberrations detected byG-banding, but unidentifiable, FISH was per-formed; with a multipainting test for all chromo-somes: ' 22 autosomes, X and Y (KitChromoprobe-M Multiprobe, CytoCell Ltd, UK).The hybridizations to metaphase spreads were per-formed ; according to the instructions of thesupplier.
CGH analysis
CGH was used to determine the specific chromo-some regions implicated in the chromosome
q28 add(X)(q28)
Fig. 2. Partial karyotype and idiogram of chromosomes show-ing the additional material, (a) Y-chromosome from patient 1and (b) X-chromosomes from patient 2.
anomalies. For CGH, DNA was isolated fromblood leukocytes of the probands and of healthyindividuals of the same sex as the patients. DNAlabeling, hybridization, and detection was per-formed essentially as described by Kallioniemi etal. (20) and according to the instructions of thesupplier (Vysis, Downer Grove, IL, USA). Slideswere analyzed using a Cytovision Ultra worksta-tion (Applied Imaging, Sunderland, UK). The soft-ware performed a calculation of the patient DNAto normal DNA fluorescent ratios along the lengthof each chromosome. Ratio values above 1.25 andbelow 0.75 were considered to represent chromoso-mal gains and losses, respectively. In addition,control experiments in which the red-dUTP andgreen-dUTP labels were interchanged between nor-mal and patient were also performed.
:^tfiÍ^i9fS^^^^ÍK-''*4
Fig. 1. Facial features in patient 1.
Results
G-banding chromosome analysis revealed an un-balanced abnormality in both patients. Karyotypeswere 46,X,add (Y)(ql2) in patient 1 and46,X,add(X)(q28) in patient 2, respectively (Fig. 2).Parental karyotypes were normal in both cases,and brother of patient 1 was also of normalkaryotype.
M-FISH analysis in patient _1 detected no signalon the distal Yqter after hybridization with a Y-chromosome-specific library and the presence of a
107
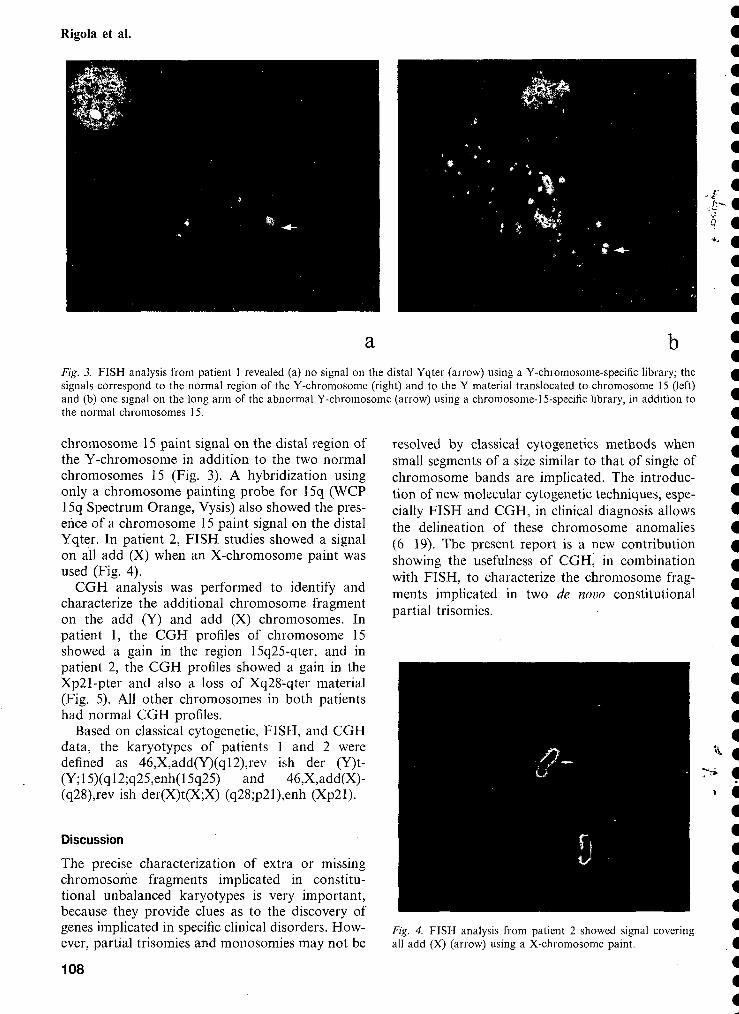
Rigola et al.
a bFig. 3. FISH analysis from patient 1 revealed (a) no signal on the distal Yqter (arrow) using a Y-chromosome-specific library; thesignals correspond to the normal region of the Y-chromosome (right) and to the Y material translocated to chromosome 15 (left)and (b) one signal on the long arm of the abnormal Y-chromosome (arrow) using a chromosome-15-specific library, in addition tothe normal chromosomes 15.
chromosome 15 paint signal on the distal region ofthe Y-chromosome in addition to the two normalchromosomes 15 (Fig. 3). A hybridization usingonly a chromosome painting probe for 15q (WCP15q Spectrum Orange, Vysis) also showed the pres-ence of a chromosome 15 paint signal on the distalYqter. In patient 2, FISH studies showed a signalon all add (X) when an X-chromosome paint wasused (Fig. 4).
CGH analysis was performed to identify andcharacterize the additional chromosome fragmenton the add (Y) and add (X) chromosomes. Inpatient 1, the CGH profiles of chromosome 15showed a gain in the region 15q25-qter, and inpatient 2, the CGH profiles showed a gain in theXp21-pter and also a loss of Xq28-qter material(Fig. 5). All other chromosomes in both patientshad normal CGH profiles.
Based on classical cytogenetic, FISH, and CGHdata, the karyotypes of patients 1 and 2 weredefined as 46,X,add(Y)(ql2),rev ish der (Y)t-(Y;15)(ql2;q25,enh(15q25) and 46,X,add(X)-(q28),rev ish der(X)t(X;X) (q28;p21),enh (Xp21).
Discussion
The precise characterization of extra or missingchromosome fragments implicated in constitu-tional unbalanced karyotypes is very important,because they provide clues as to the discovery ofgenes implicated in specific clinical disorders. How-ever, partial trisomies and monosomies may not be
108
resolved by classical cytogenetics methods whensmall segments of a size similar to that of single ofchromosome bands are implicated. The introduc-tion of new molecular cytogenetic techniques, espe-cially FISH and CGH, in clinical diagnosis allowsthe delineation of these chromosome anomalies(6-19). The present report is a new contributionshowing the usefulness of CGH, in combinationwith FISH, to characterize the chromosome frag-ments implicated in two de novo constitutionalpartial trisomies.
Fig. 4. FISH analysis from patient 2 showed signal coveringall add (X) (arrow) using a X-chromosome paint.

Pardal trisomies 15q25-qter and Xp21-pter: implication of the phenotype
V11-12
n-7
f
n-10
Fig. 5. CGH results from patients 1 and 2. Lines, from left toright on CGH profiles, represent fluorescence ratio values of0.5, 0.75, 1.0, 1.25, and 1.5. The vertical lines on the right sideof the chromosome indicate gains; those on the left indicatelosses of the corresponding chromosomal regions. Chromo-somes and profiles obtained by CGH showed a gain of (a)15q25-qter in patient 1 and (b) Xp21-pter in patient 2.
A comparison of the clinical features from pa-tients 1, and 2 with previous published cases withthe sanie trisomies reveals similar common clinicalabnormalities in both cases. The severe hypotonia,horseshoe kidney, and facial asymmetry present inpatient, 1 are common clinical features associatedwith partial trisomy 15 (21). The review by Chan-der et al. (21) described that most cases with aduplication of the distal part of 15q have resultedfrom unbalanced translocations frequently derivedfrom a balanced translocation carried by a parent,usually i the mother. Only a few patients with a46,X,der(Y)t(Y; 15) karyotype have been describedin the literature; the chromosome translocationinvolved the Yql2 and 15pll breakpoints in mostcases (22). Until now, only a case with ader(Y)t(Y;15q) has been published (23), corre-sponding to a boy with mental and growth retar-dation, microcephaly, spastic quadriplegia, andundescended testes; in this paper, the breakpointsimplicated in this reorganization are not indicated.Our patient 1 is the second case in the literaturewith, a der(Y)t(Y; 15) affecting the long arm ofchromosome 15, which suggests that the geneticunbalance of 15q25-qter expressed in our patientcan account for this abnormal phenotype.
The CGH results from patient 2 show not onlythe Xp21-pter region duplication, but also theXq28-qter region loss. Kallionemi et al. (20) ob-served that the green and red fluorescence intensi-
ties gradually decrease at the _ chromosometelomeres and suggest that caution should, there-fore, be exercised in the interpretation of ratiochanges at chromosome telomeres. In our case,due to our knowledge of the G-banded and FISHresults, we can accept the Xq28-qter deletion.
Females with duplication of segments of theX-chromosome are fertile, provided that there areno X/X rearrangements, while patients with X/Xrearrangements leading to a duplication of theshort or long arm (without significant deletions)may or may not be fertile (24). Our patient 2, witha partial trisomy Xp produced de novo by X/Xrearrangements, presents sterility and early-onsetmenopause as phenotype alterations. The last clini-cal alteration is also seen in 47,XXX females andin females with duplications of Xp or Xq (25). Nocorrelation with specific phenotype or clinical fea-tures other than sterility and premature menopausewas found in our case.
In this paper, we describe the combined use ofFISH and CGH techniques; first FISH was used toidentify the origin and localization of the extrachromosome material detected by G-banding [inpatient 1 the add (Y) corresponded to a 15 chro-mosome fragment located in Yqter, and in patient2 the add (X) was from the X-chromosome] andthe CGH method to characterize the chromosomefragment gains (the 15q25-qter region and Xp21-pter in patients 1 and 2, respectively). In conclu-sion, according to previous data (8, 9, 13-19), thecombination of conventional and molecular cyto-genetic techniques is useful to characterize un-known extra chromosome material in partialtrisomies and to contribute to establish genotype/phenotype correlations.
AcknowledgementsFinancial support was given by DGESIC (PB 98-0891),UAB (1999, EMER-21), and CIRIT (1998, SGR00061 and1999, SGR-00104).
References
1. Escudero T, Fuster C, Coll MD, Egozcue J. Cytogeneticanalysis using simultaneous and sequential fluorescence insitu hybridization. Cancer Genet Cytogenet 1998: 100:111-113.
2. Schròck E, du Manoir S, Veldman T et al. Multicolorspectral karyotyping of human chromosomes. Science1996: 273: 494-497.
3. Speicher MR, Ballard SG, Ward DC. Karyotyping humanchromosomes by combinatorial multifluor FISH. NatureGenet 1996: 12: 368-375.
4. Hadd RB, Schrôk E, Meek J et al. Identification of denovo chromosomal markers and derivatives by spectralkaryotyping. Hum Genet 1998: 103: 619-625.
109
Rigola et al.
5. Stone D, Ning Y, Guan X-Y, Kaiser-Kupfer M, Wyn-shaw-Boris A, Biesecker L. Characterization of familialpartial lOp trisomy by chromosomal microdissection,FISH, and microsatellite dosage analysis. Hum Genet1996: 98: 396-402.
6. Bryndorf T, Kirchhoff M, Rose H et al. Comparativegenomic hybridization in clinical cytogenetics. Am J HumGenet 1995: 57: 1211-1220.
7. Wang BBT, Yu LC, Peng W, Falk RE, Williams J. Prena-tal identification of i (Yp) by molecular cytogenetic analy-sis. Prenatal Diagnosis 1995: 15: 1115-1119.
8. Erdel M, Duba HC, Verdorfer I et al. Comparative ge-nomic hybridization reveals a partial de novo trisomy6q23-qter in an infant with congenital malformations: de-lineation of the phenotype. Hum Genet 1997: 99: 596-601.
9. Levy B, Gershin IF, Desnick RJ et al. Characterization ofa de novo unbalanced chromosome rearrangements bycomparative genomic hybridization and fluorescence insitu hybridization. Cytogenetic Cell Genet 1997: 76: 68-71.
10. Yu LC, Moore DH, II, Magrane et al. Objective aneu-ploidy detection for fetal and neonatal screening usingcomparative genomic hybridization (CGH). Cytometry1997: 28: 191-197.
11. Nacheva EP, Grace CD, Bittner M, Ledbetter DH, JenkisRB, Green AR. Comparative genomic hybridization: acomparison with molecular and cytogenetic analysis. Can-cer Genet Cytogenet 1998: 100: 93-105.
12. Daniely M, Aviram-Goldring A, Barkai G, Goldman B.Deletion of chromosomal aberration in fetuses arisingfrom recurrent spontaneous abortion by comparative ge-nomic hybridization. Human Reproduction 1998: 13: 805-809.
13. Boceno M, Rival JM, Nomballais MF, David A, Avet-Loiseau H. Characterization of two add (4qter) chromo-somes by comparative genomic hybridization. Ann Genet1998:41:83-86.
14. Lapierre JM, Cacheux V, Collot N-et al. Comparision ofcomparative genomic hybridization with conventionalkaryotype <and classical fluorescence in situ hybridization
for prenatal and postnatal diagnosis of unbalanced chro-mosome abnormalities. Ann Genet 1998: 41: 133-140.
15. Benzacken B, Lapierre JM, Siffroi JP, Chalvon A, Tachd-jian G. Identification and characterization of a de novopartial trisomy lOp by comparative genomic hybridization(CGH). Clin Genet 1998: 54: 334-340.
16. Daniely M, Barkai G, Golman B, Aviram-Goldring A.Structural unbalanced chromosome rearrangements re-solved by comparative genomic hybridization. CytogenetCell Genet 1999: 86: 51-55.
17. Lapierre JM, Cacheux V, Luton D et al. Analysis ofuncultured amniocytes by comparative genomic hybridiza-tion: a prospective prenatal study. Prenat Diagn 2000: 20:123-131.
18. Breen CJ, Barton L, Carey A et al. Applications of com-parative genomic hybridization in constitutional chromo-some studies. J Med Genet 1999: 36: 511-517.
19. Lestou VS, Desilets V, Lomax BL et al. Comparativegenomic hybridization: a new approach to screening forintrauterine complete or mosaic aneuploidy. Am J MedGenet 2000: 92: 281-284.
20. Kallioniemi OP, Kallioniemi A, Piper J et al. Optimizingcomparative genomic hybridization for analysis of DNAsequence copy number changes in solid tumors. GenesChromosom Cancer 1994: 10: 231-243.
21. Chandler K, Schrander-Stumpel RM, Engelen J, Theunis-sen P, Fryns JP. Partial trisomy 15q: report of a patientand literature review. Genetic Counseling 1997: 8: 91-97.
22. Hsu LYF. Phenotype/karyotype correlations of Y chromo-some aneuploidy with emphasis on structural aberrationsin postnatally diagnosed cases. Am J Med Genet 1994: 53:108-140.
23. Distèche CM, Brown L, Saal H et al. Molecular detectionof a translocation (Y; 15) in a 45,X male. Hum Genet 1986:74: 372-377.
24. Emery AFH, Rimoins DL. Principles and Practice of Med-ical Genetics. New York: Churchill Livingstone, 1996.
25. Schinzel A; ed. Catalogue of Unbalanced ChromosomeAberrations in Man. New York, Berlin: De Gruyter, 1984:781-784.
110

Resultats
Characterization of a heritable partial monosomy 18p by molecular andcytogenetic analysis.Rigola MA, Piafa A, Mediano C, Miro R, Egozcue J, Fuster C.Am J Med Genet. 2001 Nov 15;104(1):37-41
2.3*
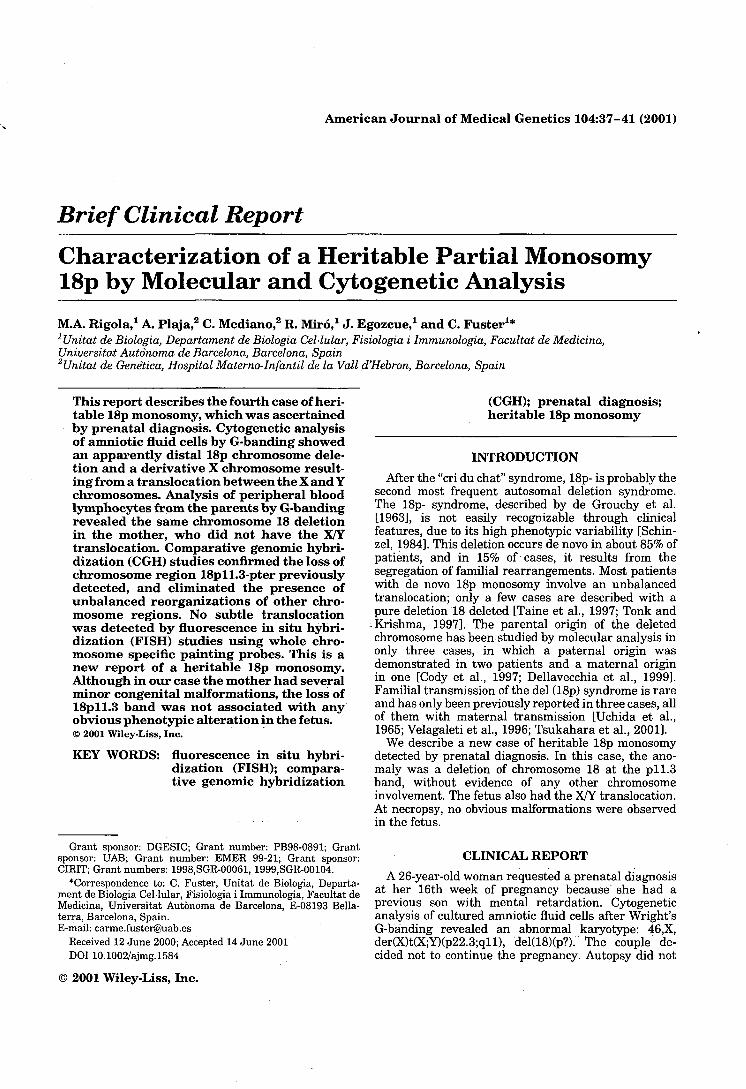
American Journal of Medical Genetics 104:37-41 (2001)
Brief Clinical Report
Characterization of a Heritable Partial Monosomy18p by Molecular and Cytogenetic Analysis
M.A. Rigola,1 A. Plaja,2 C. Mediano,2 R. Miró,1 J. Egozcue,1 and C. Fuster1*'Unitat de Biologia, Departament de Biologia Cel·lular, Fisiologia i Immunologia, Facultat de Medicina,Universitat Autònoma de Barcelona, Barcelona, Spain2Unitat de Genètica, Hospital Materno-Infantil de la Vall d'Hebron, Barcelona, Spain
This report describes the fourth case of heri-table 18p monosomy, which was ascertainedby prenatal diagnosis. Cytogenetic analysisof amniotic fluid cells by G-banding showedan apparently distal 18p chromosome dele-tion and a derivative X chromosome result-ing from a translocation between the X and Ychromosomes. Analysis of peripheral bloodlymphocytes from the parents by G-bandingrevealed the same chromosome 18 deletionin the mother, who did not have the X/Ytranslocation. Comparative genomic hybri-dization (CGH) studies confirmed the loss ofchromosome region 18pll.3-pter previouslydetected, and eliminated the presence ofunbalanced reorganizations of other chro-mosome regions. No subtle translocation•was detected by fluorescence in situ hybri-dization (FISH) studies using whole chro-mosome specific painting probes. This is anew report of a heritable 18p monosomy.Although in our case the mother had severalminor congenital malformations, the loss of18pll.3 band was not associated with anyobvious phenotypic alteration in the fetus.© 2001 Wiley-Liss, Inc.
KEY WORDS: fluorescence in situ hybri-dization (FISH); compara-tive genomic hybridization
(CGH); prenatal diagnosis;heritable 18p monosomy
Grant sponsor: DGESIC; Grant number: PB98-0891; Grantsponsor: UAB; Grant number: EMER 99-21; Grant sponsor:CIRIT; Grant numbers: 1998.SGR-00061, 1999,SGR-00104.
"Correspondence to: C. Fuster, Unitat de Biologia, Departa-ment de Biologia Cel·lular, Fisiologia i Immunologia, Facultat deMedicina, Universitat Autònoma de Barcelona, E-08193 Bella-terra, Barcelona, Spain.E-mail: [email protected]
Received 12 June 2000; Accepted 14 June 2001DOI 10.1002/ajmg.l584
© 2001 Wiley-Liss, Inc.
INTRODUCTION
After the "cri du chat" syndrome, 18p- is probably thesecond most frequent autosomal deletion syndrome.The 18p- syndrome, described by de Grouchy et al.[1963], is not easily recognizable through clinicalfeatures, due to its high phenotypic variability [Schin-zel, 1984]. This deletion occurs de novo in about 85% ofpatients, and in 15% of cases, it results from thesegregation of familial rearrangements. Most patientswith de novo 18p monosomy involve an unbalancedtranslocation; only a few cases are described with apure deletion 18 deleted [Taine et al., 1997; Tonk and
-Krishma, 1997]. The parental origin of the deletedchromosome has been studied by molecular analysis inonly three cases, in which a paternal origin wasdemonstrated in two patients and a maternal originin one [Cody et al., 1997; Dellavecchia et al., 1999].Familial transmission of the del (18p) syndrome is rareand has only been previously reported in three cases, allof them with maternal transmission [Uchida et al.,1965; Velagaleti et al., 1996; Tsukahara et al., 2001].
We describe a new case of heritable 18p monosomydetected by prenatal diagnosis. In this case, the ano-maly was a deletion of chromosome 18 at the p 11.3band, without evidence of any other chromosomeinvolvement. The fetus also had the X/Y translocation.At necropsy, no obvious malformations were observedin the fetus.
CLINICAL REPORT
A 26-year-old woman requested a prenatal diagnosisat her 16th week of pregnancy because" she had aprevious son with mental retardation. Cytogeneticanalysis of cultured amniotic fluid cells after Wright'sG-banding revealed an abnormal karyotype: 46,X,der(X)t(X;Y)(P22.3;qll), del(18)(p?). The couple de-cided not to continue the pregnancy. Autopsy did not

38 Rigola et al.
reveal any obvious congenital malformations in thefetus.
The woman had borderline mental retardation(WAIS, adult intelligence scale and Rawen tests werebelow the 5th centile). She weighed 50 kg (below 25thcentile), measured 162.5 cm (25th centile), and hadan occipitofrontal circumference of 54.5 cm (below50th centile). She had a normal face with a clinicalimpression of hypertelorism (interpupillary distance6.15 cm, above 75th centile), a broad nasal bridge, andnormal ears. She had a large mouth (5.4 cm, above the90th centile). She had no heart defects, strabismus,ptosis, or history of seizures.
MATERIALS AND METHODS
Cytogenetic Analysis
Peripheral blood samples obtained from the parentsand their son were cultured for 72 hr in RPMI medium.Metaphase chromosomes were analyzed by the stan-dard Wright's G-banding technique.
Comparative Genomic Hybridization(CGH) Analysis
For CGH, DNA was isolated from blood leukocytes ofthe patient and of a healthy individual of the same sex.DNA labelling, hybridization, and detection wereperformed essentially as described by Kallioniemiet al. [1994], and according to the instructions ofthe supplier (Vysis, Downer Grove, IL). Slides wereanalyzed using a Cytovision Ultra workstation (AppliedImaging, Sutherland, UK). The software performed acalculation of the patient DNA to normal DNA fluo-rescent ratios along the length of each chromosome.
Ratio values of CGH above 1.25 and below 0.75 wereconsidered to represent chromosomal gains and losses,respectively.
Fluorescence In Situ Hybridization(FISH) Analysis
In order to confirm the CGH findings, we used FISHwith a whole chromosome-18-specific painting probe.Chromosome painting was performed using indirectly-labelled chromosome paints (Cambio, Cambridge, UK)according to the manufacturer's instructions.
RESULTS
Cytogenetic Analysis
In the fetus, cytogenetic analysis of the culturedamniotic fluid cells after Wright's G-banding revealedan abnormal karyotype: 46,X, der(X)t(X;Y)(p22.3;qll),del(18)(p?) (Fig. 1). In the mother, evaluation ofG-banded chromosome preparations showed the pre-sence of a non-mosaic, unbalanced 46,XX, del(18)(pll.3) karyotype. The father and a previous child(with obvious psychomotor retardation and epilepsy)had normal karyotypes, but no paternity tests wereperformed.
FISH and CGH Analyses
To confirm the presence of the chromosome deletion(18)(pll.3) in the woman and detect possible partialtrisomies or monosomies involving other chromosomeregions in this family, CGH was used. CGH findings inthe mother defined only the loss of 18pll.3-pter; otherchromosomes from this patient had normal CGHprofiles (Fig. 2).
14É f
if j «r *»s f»
I ri* *,
Fig. 1. Unbalanced karyotypes from the fetus showing an apparent distal 18p chromosome deletion and a derivative X chromosome resulting from achromosome translocation between the X and Y chromosomes.
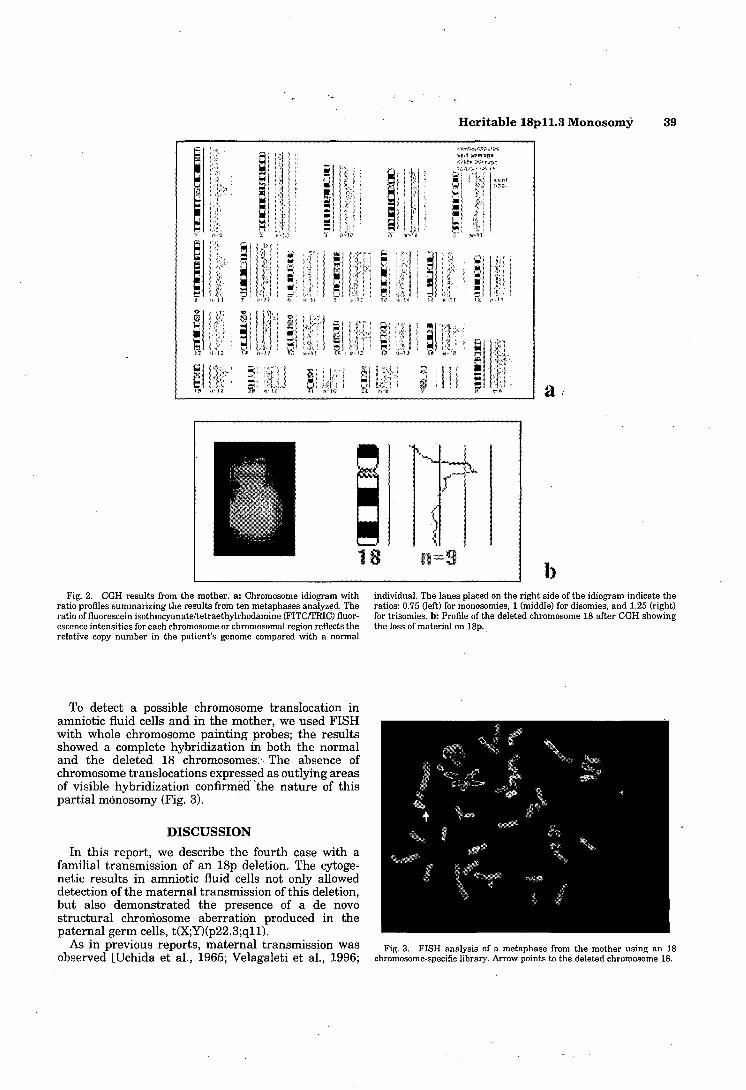
Heritable lSpll.3 Monosomy 39
ï•!íiui
ï«í
„
i«M
ÉH
, ¡m i ' *' - il13. !' ? 3 !
« • S' B >l i s g ¡:
1 t ' * ! ! J
, li = ' p ' r != • "3 b k «
«" II *" ' • r , I - T I M
1u
iï''"' 0'
1 '
x 1»
' îS ' (ü ¡* r^
§| È E ;tâ i î 2 ti ft * í' V ï *i Ï "ft ' *•>• 'i í *í T ( ' J
1 • ? « ? ! f» >"? ; i o , r • „
-if»"-»
4M * Os.
" 1
• ' ,
m \
¿'i i Î-.Î
* n
à s3 { i S 1"1 ! * U V » " ! ? '
«^ -!.
3a « ir —
J i Í
i',* -
¡I -
13 3 "í S .28 *»" 1 1 it tí" î# .ï* ïf « V K «"£• a
Fig. 2. CGH results from the mother, a: Chromosome idiogram withratio profiles summarizing the results from ten metaphases analyzed. Theratio of fluorescein isothiocyanate/tetraethylrhodamine (FITC/TRIC) fluor-escence intensities for each chromosome or chromosomal region reflects therelative copy number in the patient's genome compared with a normal
individual. The lanes placed on the right side of the idiogram indicate theratios: 0.75 (left) for monosomies, 1 (middle) for disomies, and 1.25 (right)for trisomies, b: Profile of the deleted chromosome 18 after CGH showingthe loss of material on 18p.
To detect a possible chromosome translocation inamniotic fluid cells and in the mother, we used FISHwith whole chromosome painting probes; the resultsshowed a complete hybridization in both the normaland the deleted 18 chromosomes. The absence ofchromosome translocations expressed as outlying areasof visible hybridization confirmed 'the nature of thispartial monosomy (Fig. 3).
DISCUSSION
In this report, we describe the fourth case with afamilial transmission of an 18p deletion. The cytoge-netic results in amniotic fluid cells not only alloweddetection of the maternal transmission of this deletion,but also demonstrated the presence of a de novostructural chromosome aberration produced in thepaternal germ cells, t(X;Y)(p22.3;qll).
As in previous reports, maternal transmission wasobserved [Uchida et al., 1965; Velagaleti et al., 1996;
Fig. 3. FISH analysis of a metaphase from the mother using an 18chromosome-specific library. Arrow points to the deleted chromosome 18.
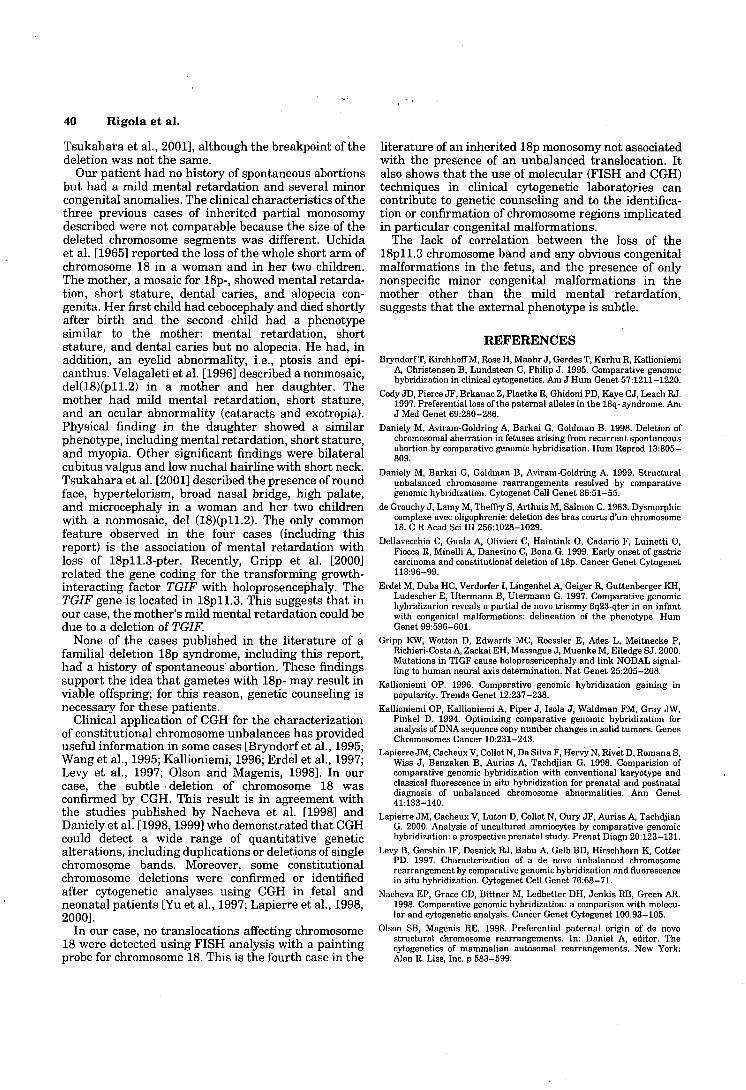
40 Rigola et al.
Tsukahara et al., 2001], although the breakpoint of thedeletion was not the same.
Our patient had no history of spontaneous abortionsbut had a mild mental retardation and several minorcongenital anomalies. The clinical characteristics of thethree previous cases of inherited partial monosomydescribed were not comparable because the size of thedeleted chromosome segments was different. Uchidaet al. [1965] reported the loss of the whole short arm ofchromosome 18 in a woman and in her two children.The mother, a mosaic for 18p-, showed mental retarda-tion, short stature, dental caries, and alopecia con-gènita. Her first child had cebocephaly and died shortlyafter birth and the second child had a phenotypesimilar to the mother: mental retardation, shortstature, and dental caries but no alopecia. He had, inaddition, an eyelid abnormality, i.e., ptosis and epi-canthus. Velagaleti et al. [1996] described a nonmosaic,del(18)(pll.2) in a mother and her daughter. Themother had mild mental retardation, short stature,and an ocular abnormality (cataracts and exotropia).Physical finding in the daughter showed a similarphenotype, including mental retardation, short stature,and myopia. Other significant findings were bilateralcubitus valgus and low nuchal hairline with short neck.Tsukahara et al. [2001] described the presence of roundface, hypertelorism, broad nasal bridge, high palate,and microcephaly in a woman and her two childrenwith a nonmosaic, del (18)(pll.2). The only commonfeature observed in the four cases (including thisreport) is the association of mental retardation withloss of 18pll.3-pter. Recently, Gripp et al. [2000]related the gene coding for the transforming growth-interacting factor TGIF with holoprosencephaly. TheTGIF gene is located in 18pll.3. This suggests that inour case, the mother's mild mental retardation could bedue to a deletion of TGIF.
None of the cases published in the literature of afamilial deletion 18p syndrome, including this report,had a history of spontaneous abortion. These findingssupport the idea that gametes with 18p- may result inviable offspring; for this reason, genetic counseling isnecessary for these patients.
Clinical application of CGH for the characterizationof constitutional chromosome unbalances has provideduseful information in some cases [Bryndorf et al., 1995;Wang et al., 1995; Kallioniemi, 1996; Erdel et al., 1997;Levy et al., 1997; Oison and Magenis, 1998]. In ourcase, the subtle deletion of chromosome 18 wasconfirmed by CGH. This result is in agreement withthe studies published by Nacheva et al. [1998] andDaniely et al. [1998,1999] who demonstrated that CGHcould detect a wide range of quantitative geneticalterations, including duplications or deletions of singlechromosome bands. Moreover, some constitutionalchromosome deletions were confirmed or identifiedafter cytogenetic analyses using CGH in fetal andneonatal patients [Yu et al., 1997; Lapierre et al., 1998,2000].
In our case, no translocations affecting chromosome18 were detected using FISH analysis with a paintingprobe for chromosome 18. This is the fourth case in the
literature of an inherited 18p monosomy not associatedwith the presence of an unbalanced translocation. Italso shows that the use of molecular (FISH and CGH)techniques in clinical cytogenetic laboratories cancontribute to genetic counseling and to the identifica-tion or confirmation of chromosome regions implicatedin particular congenital malformations.
The lack of correlation between the loss of thelSpll.3 chromosome band and any obvious congenitalmalformations in the fetus, and the presence of onlynonspecific minor congenital malformations in themother other than the mild mental retardation,suggests that the external phenotype is subtle.
REFERENCESBryndorfT, KirchhoffM, Rose H, Maahr J, Gerdes T, Karhu R, Kallioniemi
A, Christensen B, Lundsteen C, Philip J. 1995. Comparative genomichybridization in clinical cytogenetics. Am J Hum Genet 57:1211-1220.
Cody JD, Pierce JF, Brkanac Z, Plaetke R, Ghidoni PD, Kaye CJ, Leach RJ.1997. Preferential loss of the paternal alíeles in the 18q- syndrome. AmJ Med Genet 69:280-286.
Daniely M, Aviram-Goldring A, Barkai G, Goldman B. 1998. Deletion ofchromosomal aberration in fetuses arising from recurrent spontaneousabortion by comparative genomic hybridization. Hum Reprod 13:805-809.
Daniely M, Barkai G, Goldman B, Aviram-Goldring A. 1999. Structuralunbalanced chromosome rearrangements resolved by comparativegenomic hybridization. Cytogenet Cell Genet 86:51-55.
de Grouchy J, Lamy M, Theffry S, Arthuis M, Salmon C. 1963. Dysmorphiccomplexe avec oligophrenie: deletion des bras courts d'un chromosome18. C R Acad Sci III 256:1028-1029.
Dellavecchia C, Guala A, Olivieri C, Haintink 0, Cadario F, Luinetti O,Fiocca R, Minelli A, Danesino C, Bona G. 1999. Early onset of gastriccarcinoma and constitutional deletion of 18p. Cancer Genet Cytogenet113:96-99.
Erdel M, Duba HC, Verdorfer I, Lingenhel A, Geiger R, Guttenberger KH,Ludescher E, Utermann B, Utermann G. 1997. Comparative genomichybridizarion reveals a partial de novo trisomy 6q23-qter in an infantwith congenital malformations: delineation of the phenotype. HumGenet 99:596-601.
Gripp KW, Wotton D, Edwards MC, Roessler E, Ades L, Meitnecke P,Richieri-Costa A, Zackai EH, Massague J, Muenke M, Elledge SJ. 2000.Mutations in TIGF cause holoprosericephaly and link NODAL signal-ling to human neural axis determination. Nat Genet 25:205-208.
Kallioniemi OP. 1996. Comparative genomic hybridization gaining inpopularity. Trends Genet 12:237-238.
Kallioniemi OP, Kallioniemi A, Piper J, Isola J, Waldman FM, Gray JW,Pinkel D. 1994. Optimizing comparative genomic hybridization foranalysis of DNA sequence copy number changes in solid tumors. GenesChromosomes Cancer 10:231-243.
Lapierre JM, Cacheux V, Collot N, Da Silvà F, Hervy N, Rivet D, Romana S,Wiss J, Benzaken B, Aurias A, Tachdjian G. 1998. Comparision ofcomparative genomic hybridization with conventional karyotype andclassical fluorescence in situ hybridization for prenatal and postnataldiagnosis of unbalanced chromosome abnormalities. Ann Genet41:133-140.
Lapierre JM, Cacheux V, Luton D, Collot N, Oury JF, Aurias A, TachdjianG. 2000. Analysis of uncultured amniocytes by comparative genomichybridization: a prospective prenatal study. Prenat Diagn 20:123-131.
Levy B, Gershin IF, Desnick RJ, Babu A, Gelb BD, Hirschhorn K, CotterPD. 1997. Characterization of a de novo unbalanced chromosomerearrangement by comparative genomic hybridization and fluorescencein situ hybridization. Cytogenet Cell Genet 76:68-71.
Nacheva EP, Grace CD, Bittner M, Ledbetter DH, Jenkis RB, Green AR.1998. Comparative genomic hybridization: a comparison with molecu-lar and cytogenetic analysis. Cancer Genet Cytogenet 100:93-105.
Olson SB, Magenis RE. 1998. Preferential paternal origin of de novostructural chromosome rearrangements. In: Daniel A, editor. Thecytogenetics of mammalian autosomal rearrangements. New York:Alan R. Liss, Inc. p 583-599.
Heritable lSpll.3 Monosomy 41
Schinzel A. 1984.18p- syndrome. In: Catalogue of unbalanced chromosome Uchida IA, Me Rae KN, Wang HC, Ray M. 1965. Familial short armaberrations in man. Berlin: Walter de Gruyter & Co. p 604-607. deficiency of chromosome 18 concomitant with arrinencephaly and
Taine L, Goizet C, Wen ZQ, Chateil JF, Battin J, Saura R, Lacombe D. al°Penia congènita. Am J Hum Genet 17:410-419.1997. 18p monosomy with midline defects and a de novo satellite Velagaleti GV, Harris S, Carpenter NJ, Coldwell J, Say B. 1996. Familialidentified by FISH. Ann Genet 40:158-163. deletion of chromosome 18 (pll.2). Ann Genet 39:201-204.
Tonk V, Krishma J. 1997. De novo inherited 18p deletion in a mother-fetus Wang BBT, Yu LC, Peng W, Falk RE, Williams J. 1995. Prenatalpair with extremely variable expression, confirmed by fluorescence in identification of i(Yp) by molecular cytogenetic analysis. Prenat Diagnsitu hybridization (FISH) analysis. Eur J Obstet Gynecol Reprod Biol 15:1115-1119.73:193-196. Yu LC, Moore DH, Magrane G, Granin J, Pinkel D, Lebo RV, Gray JW. 1997.
Tsukahara M, Imaizumi K, Fugita K, Tateishi H, Uchida M. 2001. Familial Objective aneuploidy detection for fetal and neonatal screening usingdel(18p) syndrome. Am J Med Genet 99:67-69. comparative genomic hybridization (CGH). Cytometry 28:191-197.
Resultats
A comparative genomic hybridization study in a 46,XX male.Rigola MA. Carrera M, Ribas I, Egozcue J. Miro R, Fuster C.Fèrtil Steril. 2002 Jul;78(1):186-8
3.2*

FERTILITY AND STERILITY®VOL. 78, NO. 1, JULY 2002
Copyright ©2002 American Society for Reproductive MedicinePublished by Elsevier Science Inc.
Printed on acid-free paper in U.S.A.
A comparative genomic hybridization studyin a 46,XX male
M. Angels Rigola, M.S.,a Marta Carrera, M.S.,b Isabel Ribas, M.S.,b
Josep Egozcue, M.D.,a Rosa Miró, Ph.D.,a and Carme Fuster, Ph.D.a
Universitat Autònoma de Barcelona and Centro de Patología Celular y Diagnóstico Prenatal, Barcelona, Spain
Received November 21,2001; revised andaccepted February 21,2002.
Supported by DGICYTPB98-0891 (DirecciónGeneral de Investigación-Ministerio de Ciencia yTecnologia) and CIRIT(Comissionat per aUniversitats i Recerca-Generalitat de Catalunya)1998, SGR-00061 and1999, and SGR-00104.
Reprint requests: CarmeFuster, Ph.D., Unitat deBiologia, Facultat deMedicina, UniversitatAutònoma de Barcelona,E-08193, Bellaterra,Barcelona, Spain (FAX: 34-93-5811025; E-mail:[email protected]).a Unitat de Biologia,Departament de BiologiaCellular, Fisiologia iImmunologia, Facultat deMedicina, UniversitatAutònoma de Barcelona.b Centro de PatologiaCelular y DiagnósticoPrenatal (CPC).
Orj15-0282/02/$22.00PN 50015-0282(02)03165-5
Objective: To identify Y chromosome material in an azoospermic male with an XX karyotype.
Design: Case report.
Setting: Faculty of medicine and Centro de Patologia Celular (CPC) medical center.
Patient(s): A 33-year-old man with infertility.
Intervention(s): G-banding, fluorescence in situ hybridization (FISH), polymerase chain reaction (PCR), andcomparative genomic hybridization (CGH).
Main Outcome Measure(s): FISH for X and Y chromosomes, PCR for the SRYgene and amelogenin genein the Xp (AMGX) and (AMGY), and losses or gains with CGH.
Result(s): FISH analysis using X and Y chromosome-specific probes showed an X chromosome containingY chromosome sequences on the top of the short arm; this Y chromosome region was not visible byconventional cytogenetic analysis. PCR amplification of DNA showed the presence of the sex-determiningregion of the Y chromosome (SRY) and the amelogenin gene in the pseudoautosomal boundary of the Xchromosome (AMGX). CGH confirmed the presence of the chromosome region Ypl 1.2-pter and detected thepresence of the two otherwise normal X chromosomes.
Conclusion(s): The two Xpter (XPAR1) pseudoautosomal regions present in this XX male suggest the needto reevaluate XX males using CGH and PCR to characterize the clinical variability in XX males due to genesother than those located on the Y chromosome. (Fértil Steril® 2002;78:186-8. ©2002 by American Societyfor Reproductive Medicine.)
Key Words: XX males, FISH, PCR, CGH
The human X and Y chromosomes areknown to pair during meiosis. This occurs inthe distal short arms of the X and Y because ofa sharing of bases in the pseudoautosomal re-gion (PARI), which consists of some 3,000 kbof DNA in each chromosome (1). Homology ofthe PARI in the X and Y chromosomes resultsin regular crossing-over during spermatogene-sis. Most XX males originate from an abnormalX-Y interchange (2), with transfer of the SRYgene (for sex-determining region Y) from dis-tal Yp near the YPAR1 to distal Xp (XPAR1)during meiosis in the father (3).
Recent research has shown that comparativegenomic hybridization (CGH) can be success-fully used in clinical diagnosis to identify gainsor losses in unbalanced chromosome alter-ations (4-9).
We describe the combined use of fluores-cence in situ hybridization (FISH), polymerase
chain reaction (PCR), and CGH for the identi-fication of Y chromosome material in anazoospermic male with an XX karyotype. Toour knowledge, this is the first use of the CGHmethod to identify the small unbalanced chro-mosome rearrangement implicated in an XXmale.
CASE REPORT
The 46,XX karyotype was found during ex-amination of the patient to find the cause ofinfertility. The patient was a 33-year-old manwith a normal phenotype; genitalia and testeswere normal and no gynecomastia was found.There was no evidence of mental retardation.Sperm analysis showed azoospermia. Familialcytogenetic investigations have not yet beenpossible.
186

MATERIAL AND METHODS
Cytogenetic and FISH AnalysesA peripheral blood sample from this patient was cultured
for 72 hours in RPMI-1640 medium. Metaphase chromo-somes were analyzed by the standard Wright-G-bandingtechnique. FISH was performed with multipainting probes(Kit Chromoprobe-M Multiprobe, CytoCell Ltd., UK). Hy-bridization to metaphase spreads was performed accordingto the manufacturer's instructions.
PCR and CGH AnalysesThe patient's DNA was extracted from a blood sample
according to standard procedure. PCR analyses for the SRY-gene and amelogenin gene in the Xp (AMGX) and Yp(AMGY) pseudoautosomal boundary were performed usingprimers and conditions as described elsewhere (10). Afteramplification, the fluorescent PCR products were mixed witha reference molecular standard (GeneScan-500 TAMRA;Applied Biosystems, Foster City, CA) and electrophoresiswas performed with an automated DNA sequencer (ABI310Genetic Analyser; Applied Biosystems).
CGH was carried out to identify the origin of a small,excess chromosomal segment on the Y chromosome. ForCGH, the red-labeled patient DNA and the green-labeledcontrol reference DNA were hybridized on normal malemetaphases following the manufacturer's instructions (Vy-sis, Downers Grove, IL) and standard nick translation wasperformed using a commercial kit. The 1:1 probe mixture(500 ng) was hybridized in combination with unlabeledhuman Cot-1 DNA on normal male metaphase spreads.
Slides were analyzed using a Cytovision Ultra Worksta-tion (Applied Imaging, Sunderland, UK). The software per-formed a calculation of the patient DNA to normal DNAfluorescent ratios along the length of each chromosome.Ratio values of CGH above 1.25 and below 0.75 wereconsidered to represent chromosomal gains and losses, re-spectively.
RESULTS
Evaluation of G-banded chromosome preparations fromphytohaemagglutinin-stimulated lymphocytes of the patientrevealed a 46,XX karyotype. Cytogenetic studies confirmeda nonmosaic karyotype in all metaphases analyzed.
FISH analysis using multipainting probes showed an Xchromosome containing Y chromosome sequences on thetop of the short arm; this Y chromosome region is not visibleby conventional Cytogenetic analysis. PCR analysis detectedthe presence of the X-derived sequence of the AMGX geneand the sequence of the Y chromosome SRY gene but not theAMGY gene.
When CGH was carried out Using normal male referenceDNA (46,XY), we detected the loss of the Ypll.2-qterregion and the gain of an entire X chromosome (Fig. 1A).
When'CGH was performed with normal female referenceDNA (46,XX), we identified the gain of region Ypll.2-pterand otherwise, normal profiles were observed for the entireX chromosome (Fig. IB). In two experiments, normal pro-files were also found for the autosomes.
Based on the FISH, PCR, and CGH data, the patient'skaryotype was defined as 46,X,der(X)t(X;Y)(p22.3;pll.2).
DISCUSSION
Identification of the chromosomal material in unbalancedtranslocation is important for the determination of the genesimplicated in the pathology. It has been demonstrated thatCGH is a powerful technique to identify the gain and loss ofchromosomal material (5-9).
The 46.XX male condition is genetically heterogeneous,and the phenotype does not always correlate with the pres-ence or absence of Y sequences (11-15). Our purpose was todetermine whether CGH could identify the small excess of Ychromosome material on the X chromosome.
The results, using male and female controls, allowed forthe identification of Y chromosome material in this 46,XXmale as Ypll.2-pter and detected the presence of the twonormal X chromosomes. According to Tateno et al. (16),azoospermia in this individual could be caused by the dele-tion of Yq involving the DAZ gene.
In the two different CGH assays using normal male orfemale controls, we did not detect any loss of chromosomalmaterial on Xpter, corresponding to XPAR1. This could beexplained by the small size of the regions putatively lost (<5Mb) or by the implication of telomeric regions, because thetwo most important limitations of the use of CGH are theidentification of deletions smaller than 5-10 Mb and theimplication of telomeric, pericentromeric, and heterochro-matic regions. However, in recent years the greater use ofCGH for the identification of constitutional chromosomealterations has shown its usefulness in the detection of lossesor gains of telomeric regions.
Taking into account the resolution observed, CGH clini-cal reports, and the most frequent origin of the XX conditionin males (17-19), the presence of two XPARl's (i.e., theconservation of the pseudoautosomal region in Xpter) ob-served by CGH in our 46,XX male could also be explainedby an unbalanced translocation between terminals XPAR1and Ypll.2 that produced the derivative der(X)t(X;Y)(p22.3;pll.2) during spermatogenesis in the father.
Our findings suggest the need to reevaluate 46,XX malesusing CGH and PCR to evaluate the complete presence ofone or two PARX1 regions in these individuals and tocorrelate it with possible phenotypic differences. Our resultscorroborate that the XX male condition may result from thepresence of Xp segments of different lengths in der(X)t(X;Y),as previously suggested by other authors (2, 20, 21). Molec-
FERTILITY & STERILITY® 187

Profiles and chromosomes obtained by CGH: (A), When a normal male reference DNA was used, the profiles showed the lossof Yp11.2-ter and the gain of the entire X. (B), When a normal female reference DNA was used, the profiles showed the gainof Yp11.2-pter and normal profiles for the entire X. The lines from left to right on the CGH profiles represent fluorescence ratiovalues of 0.5, 0.75,1.0, 1.25, and 1.5. The vertical green lines on the right of the chromosome ¡diograms indicate gains, whilethe red lines on the left indicate losses of the corresponding chromosomal regions.
«=•10
B
Rigola. CGH study in a 46,XX male. Fértil Steril 2002.
ular studies may allow a better characterization of the clin-ical variability in XX males due to genes other than thoselocated in the Y chromosome.
References1. Ellis N, Goodfellow PN. The mammalian pseudoautosomal region.
Trends Genet 1989;5:406-10.2. Ferguson-Smith MA. Karyotype-phenotype correlations in gonadal
dysgenesis and their bearing on the pathogenesis of malformations.J Med Genet 1965;2:142-55.
3. Sinclair AH, Bertra P, Palmer MS, Hawkins JR, Griffiths BL, SmithMJ, et al. A gene for the human sex-determining region encodes aprotein with homology to a conserved DNA-binding motif. Nature1990;346:240-4.
4. Bryndorf T, Kirchchhoftt M, Rose H, Maahr J, Gerdes T, Karhu R, etal. Comparative genomic hybridization in clinical cytogenetics. Am JHum Genet 1995;57:1211-20.
5. Yu LC, Moore DH II, Magrane G, Gronin J, Pinkel D, Lebo RV, et al.Objective aneuploidy detection for fetal and neonatal screening usingcomparative genomic hybridization. Cytometry 1997;28(3): 191-7.
6. Lapierre JM, Cacheux V, Collot N, Da Silva F, Hervy N, Rivet D, et al.Comparison of comparative genomic hybridization with conventionalkaryotype and classical fluorescence in situ hybridization for prenataland postnatal diagnosis of unbalanced chromosome abnormalities. AnnGenet 1998;41:133-40.
7. Daniely M, Barkai G, Godman B, Avidam-Goldring A. Structuralunbalanced chromosome rearrangements resolved by comparativegenomic hybridization. Cytogenet Cell Genet 1999;86:51-5.
8. Breen CJ, Barton L, Carey A, Dunlop A, Clancy M, Hall K, et al.Applications of comparative genomic hybridization in constitutionalchromosome studies. J Med Genet 1999;36:511-7.
9. Rigola MA, Carrera M, Ribas I, De la Iglesia C, Méndez B, Egozcue J,et al. Identification of two de novo partial trisomies by comparativegenomic hybridization. Clin Genêt 2001;59:106-10.
10. Cirigliano V, Sherlock J, Conway G, Quilter C, Rodeck C, Adinolfi M.Rapid detection of chromosomes X and Y aneuploidies by quantitativefluorescent PCR. Prenat Diagn 1999;19:1099-103.
11. Numabe H, Nagafuchi S, Nakahori Y, Tamura T, Kiuchi H, Namiki M,et al. DNA analyses of XX and XX-hypospadiac males 1992;90:211-4.
12. Lopez M, Torres L, Méndez JP, Cervantes A, Perez-Palacios G, Erick-son RP, et al. Clinical traits and molecular findings in 46.XX males.Clin Genet 1995;l:29-34.
13. Mittwoch U. Sex determination and sex reversal: genotype, phenotype,dogma and semantics. Hum Genet 1992;89:467-79.
14. Plochl E, Vlasak I, Rittinger O, Bergendi E, Stopar M, Kurnik P, et al.Clinical, cytogentic and molecular analysis of three 46;XX. J PediatrEndocrino! Metab 1999;12:389-95.
15. Kusz K, Kotecki M, Wojda A, Szarras-Czapnik M, Latos-Bielenska A,Warenik-Szymankiewicz A, et al. Incomplete masculinisation of XXsubjects carrying the SRY gene on inactive X chromosome. J MedGenet 1999;36:452-6.
16. Tateno T, Sasagawa I, Ashida J, Nakada T. Deletion of Y chromosomeinvolving the DAZ (deleted in azoospermia) gene in XX males. ArchAndrol 1999;42:179-83.
17. Weil D, Wang I, Dietrich A, Poustka A, Wessenbach J, Petit C. Highlyhomologous loci on the X and Y chromosomes are hot-spots for ectopicrecombinations leading to XX maleness. Nat Genet 1994;7:4514-9.
18. Schiebel K, Winkelman M, Mertz A, Xu X, Page DC, Weil D, et al.Abnormal XY interchange between a novel isolated protein kinasegene, PRK.Y, and its homologue, PRKX, accounts for one third of all(Y+)XX males and (Y-)XY females. Hum Mol Genet 1997;6:1985-9.
19. Suzuki Y, Sasagawa I, Yazawa H, Tateno T, Nakada T, Saito H, et al.Localization of the sex-determining region—Y gene in XX males. ArchAndrol 2000;44:133-6. . .
20. Madan K, Walker S. Possible evidence for Xp+ in an XX male. Lancet1974;1:1223.
21. Evans H, Buckton KE, Spowart G, Carothers AD. Heteromorphic Xchromosomes in XX males: evidence for the involvement of X-Yinterchange. Hum Genet 1979;49:11-31.
188 Rigola et al. CGH study in a 46,XX male Vol. 78, No. 1, July 2002
Resultats
Comparative genomic hybridization analysis of transitional cellcarcinomas of the renal pelvis.Rigola MA, Fuster C, Casadevall C, Remues M, Caballin MR, Gelabert A,Egozcue J, Miro R.Cancer Genet Cytogenet. 2001 May¡127(1):59-63
1.7*
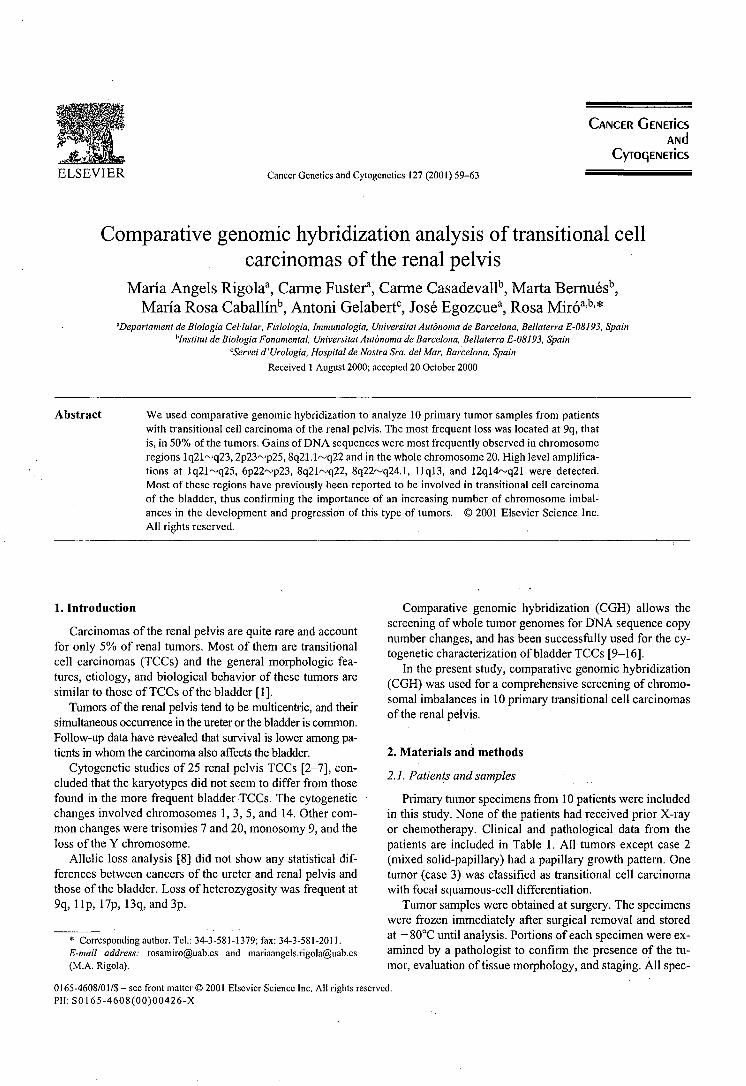
ELSEVIER
CANCER GENETÍCSANcl
CyroqENEiics
Cancer Genetics and Cytogenctics 127 (2001) 59-63
Comparative genomic hybridization analysis of transitional cellcarcinomas of the renal pelvis
Maria Angels Rigola3, Carme Fuster3, Carme Casadevall13, Marta Bernuésb,María Rosa Caballínb, Antoni Gelabert0, José Egozcue8, Rosa Miróa'b>*
'Departament de Biologia Cel·lular, Fisiologia, Immunologia, Universitat Autònoma de Barcelona, Bellaterra E-08J93, Spain^Institut de Biologia Fonamental, Universitat Autònoma de Barcelona, Bellaterra E-08193, Spain
'Servei d'Urologia, Hospital de Nostra Sra. del Mar, Barcelona, Spain
Received 1 August 2000; accepted 20 October 2000
Abstract We used comparative genomic hybridization to analyze 10 primary tumor samples from patientswith transitional cell carcinoma of the renal pelvis. The most frequent loss was located at 9q, thatis, in 50% of the tumors. Gains of DNA sequences were most frequently observed in chromosomeregions Iq21~q23, 2p23~p25,8q21.1~q22 and in the whole chromosome 20. High level amplifica-tions at Iq21~q25, 6p22~p23, 8q21~q22, 8q22~q24.1, Ilql3, and 12ql4~q21 were detected.Most of these regions have previously been reported to be involved in transitional cell carcinomaof the bladder, thus confirming the importance of an increasing number of chromosome imbal-ances in the development and progression of this type of tumors. © 2001 Elsevier Science Inc.All rights reserved.
1. Introduction
Carcinomas of the renal pelvis are quite rare and accountfor only 5% of renal tumors. Most of them are transitionalcell carcinomas (TCCs) and the general morphologic fea-tures, etiology, and biological behavior of these tumors aresimilar to those of TCCs of the bladder [1].
Tumors of the renal pelvis tend to be multicentric, and theirsimultaneous occurrence in the ureter or the bladder is common.Follow-up data have revealed that survival is lower among pa-tients in whom the carcinoma also affects the bladder.
Cytogenetic studies of 25 renal pelvis TCCs [2-7], con-cluded that the karyotypes did not seem to differ from thosefound in the more frequent bladder TCCs. The cytogeneticchanges involved chromosomes 1, 3, 5, and 14. Other com-mon changes were trisomies 7 and 20, monosomy 9, and theloss of the Y chromosome.
Allelic loss analysis [8] did not show any statistical dif-ferences between cancers of the ureter and renal pelvis andthose of the bladder. Loss of heterozygosity was frequent at9q, lip, 17p, 13q, and 3p.
* Corresponding author. Tel.: 34-3-581-1379; fax: 34-3-581-201).E-mail address: [email protected] and [email protected](M.A. Rigola).
Comparative genomic hybridization (CGH) allows thescreening of whole tumor genomes for DNA sequence copynumber changes, and has been successfully used for the cy-togenetic characterization of bladder TCCs [9-16].
In the present study, comparative genomic hybridization(CGH) was used for a comprehensive screening of chromo-somal imbalances in 10 primary transitional cell carcinomasof the renal pelvis.
2. Materials and methods
2.]. Patients and samples
Primary tumor specimens from 10 patients were includedin this study. None of the patients had received prior X-rayor chemotherapy. Clinical and pathological data from thepatients are included in Table 1. All tumors except case 2(mixed solid-papillary) had a papillary growth pattern. Onetumor (case 3) was classified as transitional cell carcinomawith focal squamous-cell differentiation.
Tumor samples were obtained at surgery. The specimenswere frozen immediately after surgical removal and storedat — 80°C until analysis. Portions of each specimen were ex-amined by a pathologist to confirm the presence of the tu-mor, evaluation of tissue morphology, and staging. All spec-
0165-4608/01/$ - sec front matter © 2001 Elsevier Science Inc. All rights reserved.PII: S0165-4608(00)00426-X
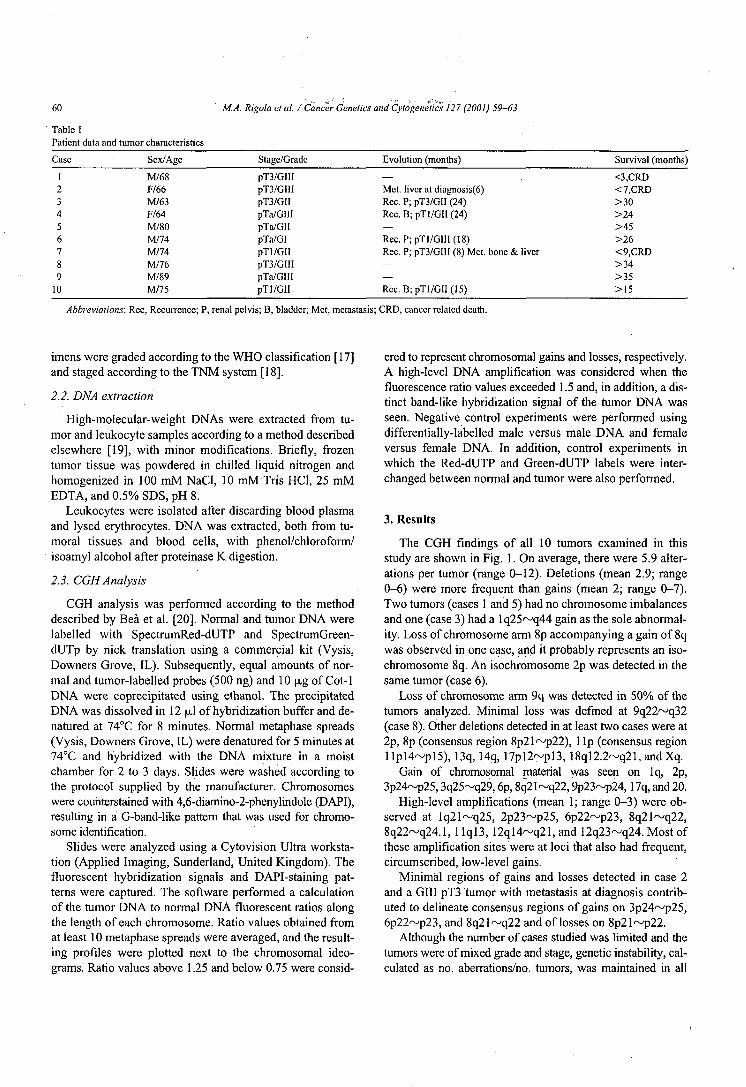
60 M.A. Rigola et al. / Cancer Genetics and Cytôgenetics 127 (2001) 59-63
Table 1Patient data and tumor characteristics
Case
123456789
10
Sex/Age
M/68F/66M/63F/64M/80M/74M/74M/76M/89M/75
Stage/Grade
pT3/GIIIpT3/GIIIpT3/GIIpTa/GIIIpTa/GIIpTa/GIpTl/GIIpT3/GIIIpTa/GIIIpTl/GII
Evolution (months)
— . . .Met. liver at diagnosis(6)Rcc. P; pT3/GII (24)Rcc. B; pTl/GII (24)—Rcc. P;pTl/GIII(18)Rec. P; pT3/GIII (8) Met. bone & liver——Rcc.B;pTl/GII(15)
Survival (months)
<3,CRD<7,CRD>30>24>45>26<9,CRD>34>35>15
Abbreviations: Rec, Recurrence; P, renal pelvis; B, bladder; Met, metastasis; CRD, cancer related death.
imens were graded according to the WHO classification [17]and staged according to the TNM system [18].
2.2. DNA extraction
High-molecular-weight DNAs were extracted from tu-mor and leukocyte samples according to a method describedelsewhere [19], with minor modifications. Briefly, frozentumor tissue was powdered in chilled liquid nitrogen andhomogenized in 100 mM NaCl, 10 mM Tris HC1, 25 mMEDTA, and 0.5% SDS, pH 8.
Leukocytes were isolated after discarding blood plasmaand lysed efythrocytes. DNA was extracted, both from tu-moral tissues and blood cells, with phenol/chloroform/isoamyl alcohol after proteinase K digestion.
2.3. CGHAnalysis
CGH analysis was performed according to the methoddescribed by Beà et al. [20]. Normal and tumor DNA werelabelled with SpectrumRed-dUTP and SpectrumGreen-dUTp by nick translation using a commercial kit (Vysis,Downers Grove, IL). Subsequently, equal amounts of nor-mal and tumor-labelled probes (500 ng) and 10 |xg of Cot-1DNA were coprecipitated using ethanol. The precipitatedDNA was dissolved in 12 jxl of hybridization buffer and de-natured at 74°C for 8 minutes. Normal metaphase spreads(Vysis, Downers Grove, IL) were denatured for 5 minutes at74°C and hybridized with the DNA mixture in a moistchamber for 2 to 3 days. Slides were washed according tothe protocol supplied by the manufacturer. Chromosomeswere counterstained with 4,6-diamino-2-phenylindole (DAPI),resulting in a G-band-like pattern that was used for chromo-some identification.
Slides were analyzed using a Cytovision Ultra worksta-tion (Applied Imaging, Sunderland, United Kingdom). Thefluorescent hybridization signals and DAPI-staining pat-terns were captured. The software performed a calculationof the tumor DNA to normal DNA fluorescent ratios alongthe length of each chromosome. Ratio values obtained fromat least 10 metaphase spreads were averaged, and the result-ing profiles were plotted next to the chromosomal ideo-grams. Ratio values above 1.25 and below 0.75 were consid-
ered to represent chromosomal gains and losses, respectively.A high-level DNA amplification was considered when thefluorescence ratio values exceeded 1.5 and, in addition, a dis-tinct band-like hybridization signal of the tumor DNA wasseen. Negative control experiments were performed usingdifferentially-labelled male versus male DNA and femaleversus female DNA. In addition, control experiments inwhich the Red-dUTP and Green-dUTP labels were inter-changed between normal and tumor were also performed.
3. Results
The CGH findings of all 10 tumors examined in thisstudy are shown in Fig. 1. On average, there were 5.9 alter-ations per tumor (range 0-12). Deletions (mean 2.9; range0-6) were more frequent than gains (mean 2; range 0-7).Two tumors (cases Í and 5) had no chromosome imbalancesand one (case 3) had a Iq25~q44 gain as the sole abnormal-ity. Loss of chromosome arm 8p accompanying a gain of 8qwas observed in one case, and it probably represents an iso-chromosome 8q. An isochromosome 2p was detected in thesame tumor (case 6).
Loss of chromosome arm 9q was detected in 50% of thetumors analyzed. Minimal loss was defined at 9q22~q32(case 8). Other deletions detected in at least two cases were at2p, 8p (consensus region 8p21fNjp22), 1 Ip (consensus regionIlpl4~pl5), 13q, 14q, 17pl2~pl3,18ql2.2~q21, andXq.
Gain of chromosomal material was seen on Iq, 2p,3p24~p25,3q25~q29,6p, 8q21~q22,9p23~p24,17q, and 20.
High-level amplifications (mean 1 ; range 0-3) were ob-served at Iq21~q25, 2p23~p25, 6p22~p23, 8q21~q22,8q22~q24.1, Ilql3, 12ql4~q21, and 12q23~q24. Most ofthese amplification sites were at loci that also had frequent,circumscribed, low-level gains.
Minimal regions of gains and losses detected in case 2and a GUI pT3 tumor with metastasis at diagnosis contrib-uted to delineate consensus regions of gains on 3p24~p25,6p22~p23, and 8q21~q22 and of losses on 8p21~p22.
Although the number of cases studied was limited and thetumors were of mixed grade and stage, genetic instability, cal-culated as no. aberrations/no, tumors, was maintained in all
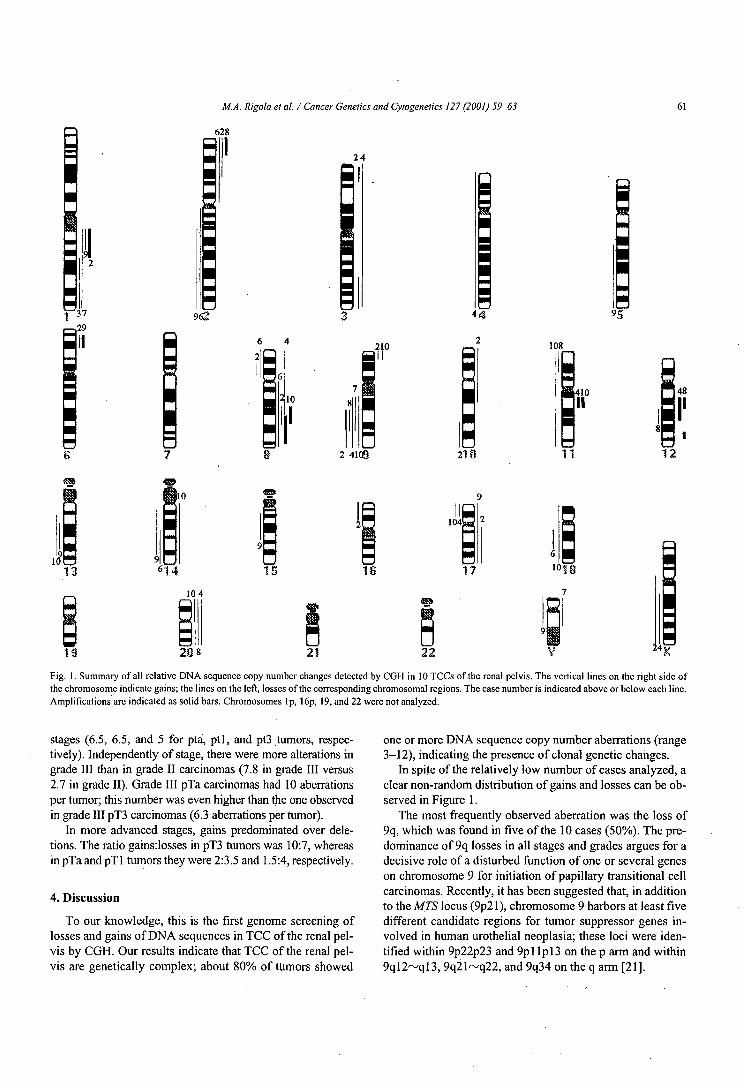
M.A. Rigola et al. / Cancer Genetics and Cytogenetics 127 (2001) 59-63 61
628
24
37-.29
962
210
10
108
|410]H
148
II
2 4100 27 Ü 11 12
18
208
Fig. 1. Summary of all relative DNA sequence copy number changes detected by CGH in 10 TCCs of the renal pelvis. The vertical lines on the right side ofthe chromosome indicate gains; the lines on the left, losses of the corresponding chromosomal regions. The case number is indicated above or below each line.Amplifications arc indicated as solid bars. Chromosomes Ip, 16p, 19, and 22 were not analyzed.
stages (6.5, 6.5, and 5 for pta, ptl, and pt3 tumors, respec-tively). Independently of stage, there were more alterations ingrade III than in grade II carcinomas (7.8 in grade III versus2.7 in grade II). Grade III pTa carcinomas had 10 aberrationsper tumor; this number was even higher than the one observedin grade III pT3 carcinomas (6.3 aberrations per tumor).
In more advanced stages, gains predominated over dele-tions. The ratio gains:losses in pT3 tumors was 10:7, whereasin pTa and pTl tumors they were 2:3.5 and 1.5:4, respectively.
4. Discussion
To our knowledge, this is the first genome screening oflosses and gains of DNA sequences in TCC of the renal pel-vis by CGH. Our results indicate that TCC of the renal pel-vis are genetically complex; about 80% of tumors showed
one or more DNA sequence copy number aberrations (range3-12), indicating the presence of clonal genetic changes.
In spite of the relatively low number of cases analyzed, aclear non-random distribution of gains and losses can be ob-served in Figure 1.
The most frequently observed aberration was the loss of9q, which was found in five of the 10 cases (50%). The pre-dominance of 9q losses in all stages and grades argues for adecisive role of a disturbed function of one or several geneson chromosome 9 for initiation of papillary transitional cellcarcinomas. Recently, it has been suggested that, in additionto the MTS locus (9p21), chromosome 9 harbors at least fivedifferent candidate regions for tumor suppressor genes in-volved in human urothelial neoplàsia; these loci were iden-tified within 9p22p23 and 9pl Ipl3 on the p arm and within9ql2~ql3, 9q21~q22, and 9q34 on the q arm [21].

62 M.A. Rigola et al. / Cancer Genetics and Cylogenetics 127 (2001) 59-63
Gains (including high-level amplifications) most frequentlyinvolved four different chromosome regions: 8q21.2^q22(40% of the tumors), Iq21~q23, 2p23~p25, and 20 (30%each). The remaining gains and losses mentioned in the resultssection were observed in 20% of cases. Cytogenetic analysisof renal pelvis TCCs [2-7] had previously revealed the oc-currence of structural aberrations involving gains on Iq anddeletions on 5q, Ip, 14q, and 8p. Trisomies for chromo-somes 7 and 20 were also frequent, as well as losses of chro-mosomes 9 and Y.
Overall, our CGH results confirmed those obtained byconventional cytogenetics, and revealed a more extensivenumber of chromosome anomalies involved, includinghigh-level amplifications at eight chromosome sites. In pre-vious studies, some discrepancies with respect to gains ofchromosome 7 have been observed that were not observedin the present study. Another remarkable difference con-cerns the high frequency (12/19) of tumors with normalkaryotypes described in the largest series of renal pelvisTCCs studied by conventional cytogenetics [7]. The resultsseem to be in contradiction with those obtained in thepresent study. Perhaps conventional cytogenetic analyses donot provide enough information about the chromosome im-balances present in these tumors, or the metaphases karyo-typed did not correspond to the main cell populations of thetumors. However, taking into consideration the data ob-tained by Dutrillaux [22] in colon cancers, it can be sug-gested that renal pelvis carcinomas, as well as other types ofsolid tumors, could present at least three patterns of chro-mosomal behavior: one characterized by gross aneuploidyand multiple structural chromosome changes, another withno chromosome abnormalities, and a third characterized bya limited number of numerical chromosome abnormalities,such as trisomies for chromosomes 7 and 20 and the loss ofthe Y chromosome.
In two of the 10 tumors of the present study (cases 1 and5), no chromosome anomalies were detected by CGH, indi-cating that 1) genetic aberrations, if any, might have beenbeyond the detection limit of the CGH or 2) only a minorityof the cells carried specific chromosomal changes, whichagain could result in normal CGH profiles. A karyotype anal-ysis of one of these tumors (case 1) was carried out in our lab-oratory. A normal karyotype, 46,XY, was observed in 11metaphases; the remaining cells were heterogeneous, with acomposite karyotype: 25-41,X,-Y[7],del(6)(q23)[2],+7[6],-14[4],-19[3][cpl7]. These results indicate that the exist-ence of clonal chromosome abnormalities present in a minor-ity cell population can only be detected by cytogenetic anal-ysis. This intratumor karyotype variability may also have acentral role in tumor development and progression.
To determine if TCCs of the renal pelvis and bladdershared the same chromosome imbalances, we compared ourresults with those obtained in bladder tumors of the papil-lary type [11-16]. Our comparison revealed a close concor-dance with respect to losses at 2q, 8p, 9q, 1 Ip, 13q, 17p, and18q and gains at 1 q, 6p, 8q, and 17q.
We can conclude that most of the genetic changes de-tected in the present study have been reported previously inbladder cancer, confirming that these tumors have a com-mon biological behavior and similar genetic abnormalities.
Acknowledgments
Financial support by CICYT (SAP 96-0177) and CIRIT(1998, SGR-00061; 1999, SGR-00104).
References
[1] Kvist E, Lauritzen AF, Brcdcscn J, Luke M, Sjolin KE. A compara-tive study of transitional cell tumors of the bladder and upper urinarytract. Cancer 1988;61:2109-I2.
[2] Hccht F, Berger CS, Sandbcrg AA. Nonrcciprocal chromosometranslocation t(5;I4) in cancers of the kidney: adcnocarcinoma of therenal parenchyma and transitional cell carcinoma of the kidney pel-vis. Cancer Genet Cytogenet 1985;14:197-200.
[3] Berger CS, Sandberg AA, Todd IAD, Pennington R, Haddad F,Hccht B, Hccht F. Chromosomes in kidney, ureter, and bladder can-cer. Cancer Genet Cytogenet 1986;23:1-24.
[4] Norderson I, Ljungberg B, Roos R. Chromosomes in renal carcinomawith reference to intratumor heterogeneity. Cancer Genet Cytogenet1988;32:35-41.
[5] Vanni R, Nieddu M, Scarpa R, Migliari R, Usai E. Trisomy 7 in acase of transitional cell carcinoma of the kidney. Cancer Genet Cyto-genet 1989;41:149-51.
[6] Fadl-Elmula I, Gorunova L, Mandahl N, Elfving P, Lundgren R,Rademark C, Hcim S. Cytogenetic analysis of upper urinary tract tran-sitional cell carcinomas. Cancer Genet Cytogenet 1999; 115:123-7.
[7] Dal Cin P, Roskams T, Van Poppcl H, Balzarini P, Van den BerghcH. Cytogenetic investigation of transitional cell carcinomas of the up-per urinary tract. Cancer Genet Cytogenet 1999;! 14:117-20.
[8] Habuchi T, Ogawa K, Koshiba M, Hamazaki S, Takahashi R, Sug-iyama T, Yoshida O. Accumulated allclic losses in the developmentof invasive urothelial cancer, int J Cancer 1993;53:579-84.
[9] Kallioniemi A, Kallioniemi OP, Citro G, Sauter G, DcVrics S, Ker-schmann R, Carroll R, Waldan F. Identification of gains and losses ofDNA sequences in primary bladder cancer by comparative gcnomichybridization. Genes Chromosom Cancer 1995;12:213-9.
[ 10] Voorter C, Jóos S, Bringuicr PP, Vallinga M, Poddigghe P, Schalkcn J,Du Manoir S, Ramaekers F, Lichtcr P, Hopman A. Detection of chro-mosomal imbalances in transitional cell carcinoma of the bladder bycomparative gcnomic hybridization. Am J Pathol 1995;146:134I-54.
[11] Richtcr J, Jiang F, Góïò'g J, Sartorius G, Moch H, Egentcr G, CasserT, Mihatsch M, Sauter G. Marked genetic "differences between pTaand pTl papillary bladder cancer detected by comparative genomichybridization. Cancer Res 1997;57:2860-4.
[12] Richter J, Beffa L, Wagner U, Schrami P, Casser TC, Moch H, Mi-hatsch MJ, Sauter G. Patterns of chromosomes imbalances in ad-vanced urinary bladder cancer detected by comparative genomic hy-bridization. Am J Pathol 1998;153:1615-21.
[13] Simon R, Biireger H, Brinkschmidt C, Bòckcr W, Hcrtkcr L, TerpeHJ. Chromosomal aberrations associated with invasion in papillarysuperficial bladder cancer. J Pathol 1998;185:345-51.
[14] Bruch J, Wôhr G, Hautmann R, Mattfcldt T, Brudcrlcin S, Môllcr P,Sauter S, Hameister H, Vogcl W, Paiss T. Chromosomal changes dur-ing progression of transitional cell carcinoma of the bladder and de-lineation of the amplified interval on chromosome arm 8q. GenesChromosom Cancer 1998;23:167-74.
[15] Richter J, Wagner U, Schrami P, Maurcr R, Alund G, Knònagcl H,Moch H, Mihatsch MJ, Casser TC, Sauter G. Chromosomal imbal-
MA. Rigola et al. / Cancer Genetics and Cytogenetics 127 (2001) 59-63 63
anees arc associated with a high risk of progression in early invasive(pTl) urinary bladder cancer. Cancer Res 1999;59:5687-91.
[16] Zhao J, Richter J, Wagner U, Roth B, Schrami P, Zellweger T, Acker-mann D, Schmid U, Moch H, Mihatsch MJ, Casser TC, Sauter G.Chromosomal imbalances in noninvasive papillary bladder neoplasm(pTa). Cancer Res 1999;59:4658-61.
[17] WHO (1973): Histológica! typing of urinary bladder tumors. In: In-ternational classification of tumors No. 10. Geneva.
[18] Union International Contre le Cancer. TNM Classification of Malig-nant Tumors. Geneva: Union International Contre le Cancer, 1978.
[19] Sambrook J, Fritsch EF, Maniatis T. Molecular cloning. A laboratory"manual. 2nd ed. Cold Spring Harbor: Cold Spring Harbor LaboratoryPress, 1989.
[20] Beà S, Ribas M, Hernández JM, Bosch F, Pinyol M, Hernández L,
Garcia JL, Flores T, González M, Lopez-Guillcrmo A, Firis MA,Cardesa A, Montserrat E, Miró R, Campo E. Increased number ofchromosomal imbalances and high-level DNA amplifications in man-tle cell lymphoma are associated with blastoid variants. Blood 1999;23:4365-74.
[21] Czerniak B, Chaturvedi V, Li L, Hodges S, Johnston D, Ro JY, Rajy-alakshmi L, Logothctis C, Von Eschcnbach AC, Grossman HB,Benedict WF, Batsakis JG. Superimposed histologie and geneticmapping of chromosome 9 in progression of human urinary bladderneoplàsia: implications for a genetic model of multistcp urothclialcarcinogenesis and early detection of urinary bladder cancer. Onco-gcncl999;18:l 185-96.
[22] Dutrillaux B. Pathways of chromosome alteration in human epithelialcancers. Adv Cancer Res 1995;67:59-82.
Resultats
Analysis of kidney tumors by comparative genomic hybridization andconventional cytogenetics.Rigola MA, Casadevall C, Bernues M, Caballin MR, Fuster C, Gelabert A,Egozcue J, Miro R.Cancer Genet Cytogenet. 2002 Aug;137(1):49-53
1.7*
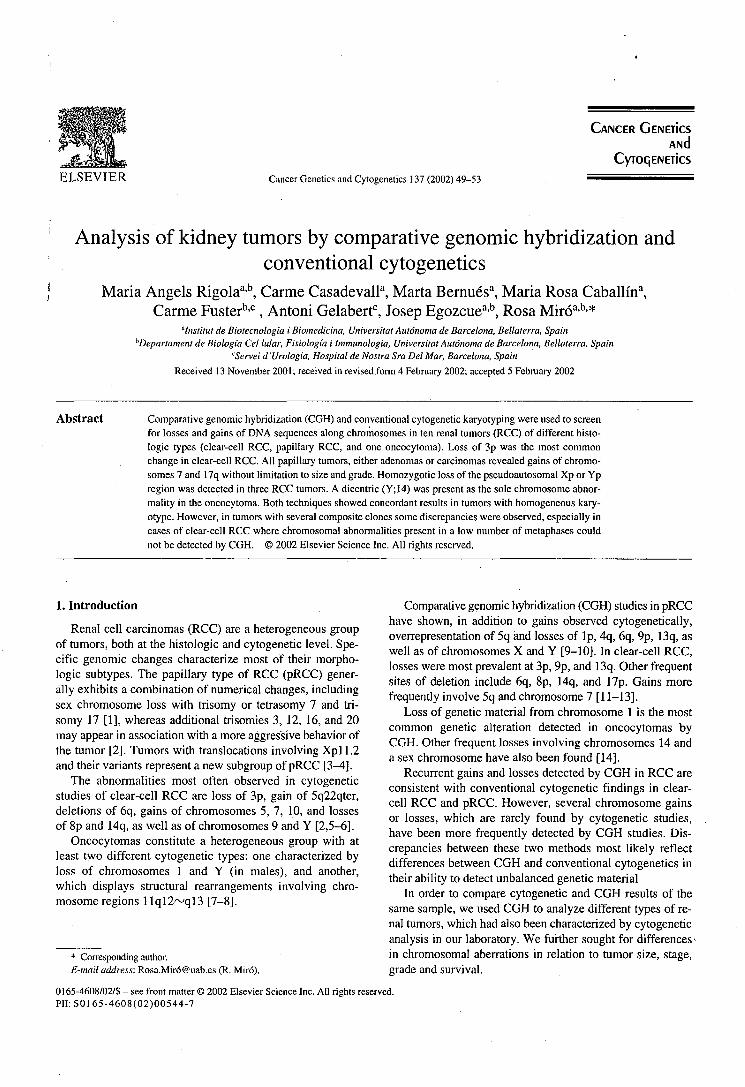
ELSEVIER
CANCER GENETÎCSANC)
CyroqENETicsCancer Genetics and Cytogenetics 137 (2002) 49-53
Analysis of kidney tumors by comparative genomic hybridization andconventional cytogenetics
Maria Angels Rigolaa'b, Carme CasadevalP, Marta Bernués3, Maria Rosa Caballin3,Carme Fusterb>c, Antoni Gelabert0, Josep Egozcuea>b, Rosa Miróa'bi*
"Institut de Biotecnología i Biomedicina, Universitat Autónoma de Barcelona, Bellaterra, Spain^Departament de Biologia Cel lular, Fisiología i Immunologia, Universitat Autònoma de Barcelona, Bellaterra, Spain
'Servei d'Urologia, Hospital de Nostra Sra Del Mar, Barcelona, SpainReceived 13 November 2001 ; received in revised form 4 February 2002; accepted 5 February 2002
Abstract Comparative genomic hybridization (CGH) and conventional cytogenetic karyotyping were used to screenfor losses and gains of DNA sequences along chromosomes in ten renal tumors (RCC) of different histo-logie types (clear-cell RCC, papillary RCC, and one oncocytoma). Loss of 3p was the most commonchange in clear-cell RCC. All papillary tumors, either adenomas or carcinomas revealed gains of chromo-somes 7 and 17q without limitation to size and grade. Homozygotic loss of the pseudoautosomal Xp or Ypregion was detected in three RCC tumors. A dicentric (Y;14) was present as the sole chromosome abnor-mality in the oncocytoma. Both techniques showed concordant results in tumors with homogeneous kary-otype. However, in tumors with several composite clones some discrepancies were observed, especially incases of clear-cell RCC where chromosomal abnormalities present in a low number of metaphases couldnot be detected by CGH. © 2002 Elsevier Science Inc. All rights reserved.
1. Introduction
Renal cell carcinomas (RCC) are a heterogeneous groupof tumors, both at the histologie and cytogenetic level. Spe-cific genomic changes characterize most of their morpho-logic subtypes. The papillary type of RCC (pRCC) gener-ally exhibits a combination of numerical changes, includingsex chromosome loss with trisomy or tetrasomy 7 and tri-somy 17 [1], whereas additional trisomies 3, 12, 16, and 20may appear in association with a more aggressive behavior ofthe tumor [2]. Tumors with translocations involving Xpll.2and their variants represent a new subgroup of pRCC [3-4].
The abnormalities most often observed in cytogeneticstudies of clear-cell RCC are loss of 3p, gain of 5q22qter,deletions of 6q, gains of chromosomes 5, 7, 10, and lossesof 8p and 14q, as well as of chromosomes 9 and Y [2,5-6].
Oncocytomas constitute a heterogeneous group with atleast two different cytogenetic types: one characterized byloss of chromosomes 1 and Y (in males), and another,which displays structural rearrangements involving chro-mosome regions Ilql2~ql3 [7-8].
* Corresponding author.E-mail address: Rosa.Miró@uab.es (R. Miró).
Comparative genomic hybridization (CGH) studies in pRCChave shown, in addition to gains observed cytogenetically,overrepresentation of 5q and losses of Ip, 4q, 6q, 9p, 13q, aswell as of chromosomes X and Y [9-10]. In clear-cell RCC,losses were most prevalent at 3p, 9p, and 13q. Other frequentsites of deletion include 6q, 8p, 14q, and 17p. Gains morefrequently involve 5q and chromosome 7 [11-13].
Loss of genetic material from chromosome 1 is the mostcommon genetic alteration detected in oncocytomas byCGH. Other frequent losses involving chromosomes 14 anda sex chromosome have also been found [14].
Recurrent gains and losses detected by CGH in RCC areconsistent with conventional cytogenetic findings in clear-cell RCC and pRCC. However, several chromosome gainsor losses, which are rarely found by cytogenetic studies,have been more frequently detected by CGH studies. Dis-crepancies between these two methods most likely reflectdifferences between CGH and conventional cytogenetics intheir ability to detect unbalanced genetic material
In order to compare cytogenetic and CGH results of thesame sample, we used CGH to analyze different types of re-nal tumors, which had also been characterized by cytogeneticanalysis in our laboratory. We further sought for differences^in chromosomal aberrations in relation to tumor size, stage,grade and survival.
0165-4608/02/$ - see front matter © 2002 Elsevier Science Inc. All rights reserved.PII: SOI 65-4608(02)00544-7
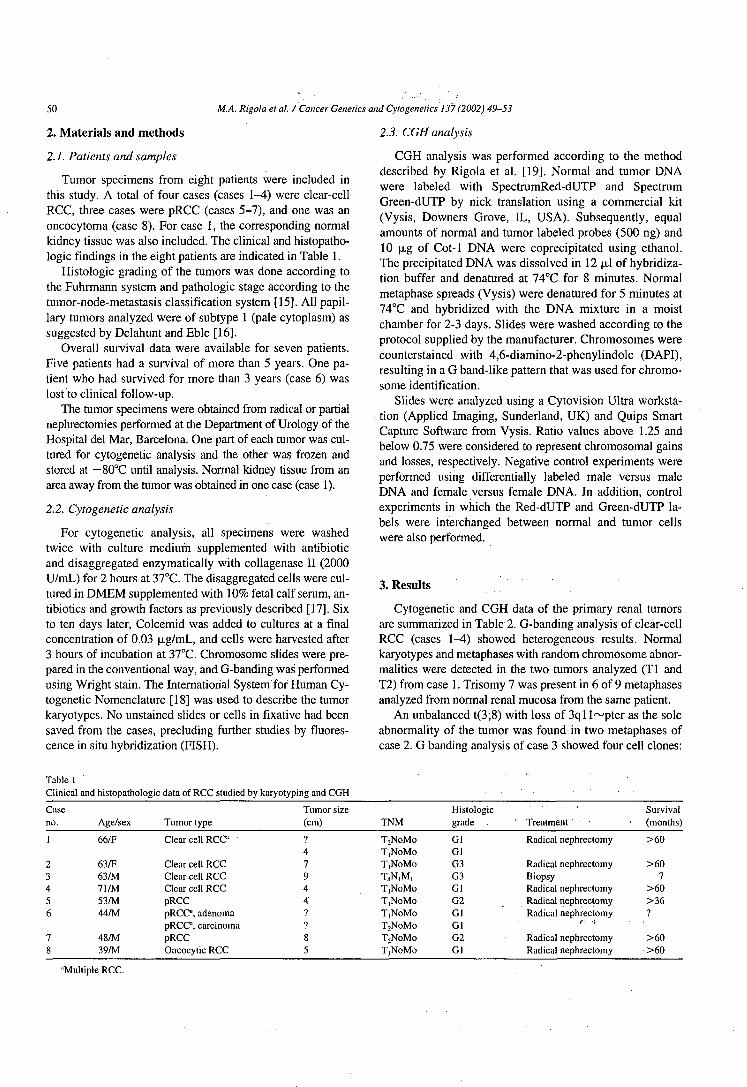
50 MA. Rigola et al. / Cancer Genetics and Cylogenetics 137 (2002) 49-53
2. Materials and methods
2.1. Patients and samples
Tumor specimens from eight patients were included inthis study. A total of four cases (cases 1-4) were clear-cellRCC, three cases were pRCC (cases 5-7), and one was anoncocytoma (case 8). For case 1, the corresponding normalkidney tissue was also included. The clinical and histopatho-logic findings in the eight patients are indicated in Table 1.
Histologie grading of the tumors was done according tothe Fuhrmann system and pathologic stage according to thetumor-node-metastasis classification system [15]. All papil-lary tumors analyzed were of subtype 1 (pale cytoplasm) assuggested by Delahunt and Eble [16].
Overall survival data were available for seven patients.Five patients had a survival of more than 5 years. One pa-tient who had survived for more than 3 years (case 6) waslost to clinical follow-up.
The tumor specimens were obtained from radical or partialnephrectomies performed at the Department of Urology of theHospital del Mar, Barcelona. One part of each tumor was cul-tured for cytogenetic analysis and the other was frozen andstored at — 80°C until analysis. Normal kidney tissue from anarea away from the tumor was obtained in one case (case 1).
2.2. Cytogenetic analysis
For cytogenetic analysis, all specimens were washedtwice with culture medium supplemented with antibioticand disaggregated enzymatically with collagenase II (2000U/mL) for 2 hours at 37°C. The disaggregated cells were cul-tured in DMEM supplemented with 10% fetal calf serum, an-tibiotics and growth factors as previously described [17]. Sixto ten days later, Colcemid was added to cultures at a finalconcentration of 0.03 jig/mL, and cells were harvested after3 hours of incubation at 37°C. Chromosome slides were pre-pared in the conventional way, and G-banding was performedusing Wright stain. The International System for Human Cy-togenetic Nomenclature [18] was used to describe the tumorkaryotypes. No unstained slides or cells in fixative had beensaved from the cases, precluding further studies by fluores-cence in situ hybridization (FISH).
2.3. CGH analysis
CGH analysis was performed according to the methoddescribed by Rigola et al. [19]. Normal and tumor DNAwere labeled with SpectrumRed-dUTP and SpectrumGreen-dUTP by nick translation using a commercial kit(Vysis, Downers Grove, IL, USA). Subsequently, equalamounts of normal and tumor labeled probes (500 ng) and10 (jug of Cot-1 DNA were coprecipitated using ethanol.The precipitated DNA was dissolved in 12 |o,l of hybridiza-tion buffer and denatured at 74°C for 8 minutes. Normalmetaphase spreads (Vysis) were denatured for 5 minutes at74°C and hybridized with the DNA mixture in a moistchamber for 2-3 days. Slides were washed according to theprotocol supplied by the manufacturer. Chromosomes werecounterstained with 4,6-diamino-2-phenylindole (DAPI),resulting in a G band-like pattern that was used for chromo-some identification.
Slides were analyzed using a Cytovision Ultra worksta-tion (Applied Imaging, Sunderland, UK) and Quips SmartCapture Software from Vysis. Ratio values above 1.25 andbelow 0.75 were considered to represent chromosomal gainsand losses, respectively. Negative control experiments wereperformed using differentially labeled male versus maleDNA and female versus female DNA. In addition, controlexperiments in which the Red-dUTP and Green-dUTP la-bels were interchanged between normal and tumor cellswere also performed.
3. Results
Cytogenetic and CGH data of the primary renal tumorsare summarized in Table 2. G-banding analysis of clear-cellRCC (cases 1^) showed heterogeneous results. Normalkaryotypes and metaphases with random chromosome abnor-malities were detected in the two tumors analyzed (Tl andT2) from case 1. Trisomy 7 was present in 6 of 9 metaphasesanalyzed from normal renal mucosa from the same patient.
An unbalanced t(3;8) with loss of 3ql l^pter as the soleabnormality of the tumor was found in two metaphases ofcase 2. G banding analysis of case 3 showed four cell clones:
Table 1Clinical and histopathologic data of RCC studied by karyotyping and CGH
Caseno.
1
23456
78
Age/sex
66/F
63/F63/M71/M53/M44/M
48/M39/M
Tumor type
Clear cell RCC"
Clear cell RCCClear cell RCCClear cell RCCpRCCpRCCa, adenomapRCCa, carcinomapRCCOncocytic RCC
Tumor size(cm)
747944??85
TNM
T2NoMoT,NoMoT|NoMoT,N,M,T,NoMoT,NoMoT,NoMoT2NoMoTjNoMoTjNoMo
Histologiegrade
GlGlG3G3GlG2GlGlG2Gl
' Treatment
Radical nephrectomy
Radical nephrectomyBiopsyRadical nephrectomyRadical nephrectomyRadical nephrectomy
f <¡
Radical nephrectomyRadical nephrectomy
Survival(months)
>60
>607
>60>367
>60>60
"Multiple RCC.

MA. Kigola et al. / Cancer Genetics and Cytogenetics 137 (2002) 49-53 51
Table 2Summary of results obtained by karyotyping and CGH
Caseno.
1
23
Tumor type
Clear-cell TlT2normal mucosa
Clear-cellClear-cell
Karyotype
46,XX[cp5]46,XX[cpl8]43~47,XX,+7[cp6]/46,XX[3]45,XX,-3,der(8)t(3;8)(ql l;pl 1 )[2]/46,XX[7]47,XY,+7[3]/46,X,idem,-Y[7]/46,XY[3]/
CGH
No imbalances detectedNo imbalances detectedNo imbalances detectedNo imbalances detectedrev ish dim(Y)
Clear-cell
PapillaryPapillary adenoma
Papillary
Oncocytoma
58~60,X,t(X;?;3)(q21;?;pll)[3],-Y[3],del(l)(q22q25)[3],t(l;8)(ql2;q23)[2],+del(2)(q22)[2], +del(3)(pl3)X2[3],t(4;5)(P14;P13)[3],+del(5)(pl5.1)[2], t(5;8)(pl2;pl2)[2],del(7)(pl5)[3],+12,+ 12)[2],del(13)(ql4)[2], inv(14)(pl2ql3)[3], + 16,+16[3],+t(6;17;17)(p!2;pl3;ql2)[3],+21[2][cp3]46,XY[cp7]
57,XY,+2,+3,+5,+7,+7, + 12,+ 16, + 17,+ 17,+18,+20[3]48,X,-Y,+7,+7, + 17[12]47~99,X,-Y[IO],t(2;3)(p25;ql2)[4],+7,+7[12],-9[5],t(15;17)(q21;q24)[10],+16[10],+mar[4][cpl2]47,X,-Y,+12,t(17;21)(qll.2;pll.2),+20,-21[5]
45,X,dic(Y;14)(pll;pl3)[3]/46,XY[4]
rev ish enh(5q23qter,16),dim(Y,Xp22.3,3p2Ipter,4q21)revishenh(7,17)rev ish enh(Xpl lp21,7,17),dim(Y)rev ish enh(7,16,17),dim(Y,Xp22.3)
rev ish enh(12,17ql 1.2qter,20,]8pl 1.2),dim(Y,Xp22.3)No imbalances detected
one clone (3/16 metaphases) was karyotypically normal. Theother two chromosome complements were related showing47,XY,+7 (3/16 metaphases) and 47,X,-Y,+7(7/16 meta-phases), respectively. A fourth clone (3/16 metaphases) waspseudotriploid with multiple structural and numerical chromo-some abnormalities characteristic of advanced stages. Normalkaryotype and random chromosome abnormalities were de-tected in case 4.
Comparative genomic hybridization results (Table 2)showed no imbalances in the two tumors from case 1. In theother cases, no concordance was observed: CGH analysisdid not detect the loss of 3p in case 2 or the complex ab-normalities in case 3. Contrarily, in case 4, with a normalG-banding karyotype, CGH showed gain on 5q and losses on3p in addition to other imbalances (Table 2). Trisomy 7,which was present in normal mucosa from case 1 and in twolines from case 2 was not detected by CGH.
Cytogenetic data from the four tumors of the papillarytype (cases 5-7) were in concordance with those from pre-vious reports. All pRCC, either adenomas or carcinomas re-vealed gains of chromosomes 7 and 17, without limitationto size and grade. Two imbalanced translocations leading topartial trisomy of 17q were observed in cases 6 and 7. Com-parative genomic hybridization results of these tumors re-vealed a close correlation with cytogenetic karyotypes.Moreover some unexpected changes such as loss of Xp22.3in cases 6 and 7 were only detected by CGH. However, incase 5, the karyotype of the tumor included numerical abnor-malities but CGH showed only gains on chromosomes 7 and17 (tetrasomic in G-banded metaphases). Deviations of theCGH fluorescence ratio profiles beyond the 35% thresholds
were observed affecting chromosomes that appeared in-volved in trisomies or monosomies by cytogenetic analysis.
In the oncocytoma (case 8), a dicentric chromosome,dic(Y;14), was detected as the sole abnormality of the tumorand no imbalances were detected by CGH.
4. Discussion
In our study, both cytogenetic and CGH results, whentaken as a whole, coincide in general with those reported inthe literature [1-2,5-14]. All papillary tumors, either ade-nomas or carcinomas revealed gains of chromosome 7 and 17qwithout limitation to size and grade. Gain of chromosomes 12,16, and 20 as well as losses of Xp and the Y chromosome werefound in the carcinomas. Loss of 3p was the most commonchange in clear-cell RCC and gain of 5q in addition to otherabnormalities was detected in 2/3 tumors with imbalances.
No relation was found between chromosomal abnormali-ties and tumor grade, stage, and survival. Only in patient 3,the complex G-banding karyotype of the tumor could be re-lated to the presence of métastases and poor clinical survival(Table 1).
Our results revealed a close relation between cytogeneticand CGH data in papillary RCC. It is noteworthy that insome cases, the same regions were found to be involved us-ing both methods. For example in case 7, G-banding revealeda t(17; 21) with gain of chromosome 17qll.2~qter, andCGH showed a gain in exactly the same region. However,some unexpected changes such as loss of Xp22.3 in cases 6and 7 were only detected by CGH.
Loss of Xp22.3 was also detected by CGH in one clear-

52 M.A. Rigola et al. / Cancer Genetics and Cytogenetics 137 (2002) 49-53
cell RCC (case 4). Interestingly, all three tumors showedloss of the Y chromosome. It has been suggested that tumorsuppressor genes are located in the pseudoautosomal region(PAR) of Xp and Yp and that these genes could have a rolein tumorigenesis of papillary and oncocytic renal tumors[10,20]. In our study, homozygotic loss of the PAR regionin one clear cell as well as in two papillary tumors stronglysupport this hypothesis. According to Jiang et al. [10], lossesof Xp are associated with poor prognosis in pRCC. In thepresent study, a relation between Xp22.3 losses and poorclinical survival was not found in the two patients withknown clinical follow up (cases 4 and 7).
Four of the 10 tumors analyzed by CGH showed no im-balances. Three of them were tumors in which cytogeneticdata indicated random abnormalities (Tl and T2 from case 1)or a dicentric chromosome, dic(Y;14), without net chromo-some changes (oncocytoma, case 8). A limitation of CGH isthat it cannot detect balanced translocations, inversions, ordicentric chromosomes. In our study the presence of a die(Y;14) as the sole abnormality of the tumor was not detectedby CGH. The presence of dicentric chromosomes is not infre-quent in oncocytomas [8,21]. We suggest that this semi-in-stable chromosome alteration could precede the loss of thetwo chromosomes involved. In this case, it is interesting tonote that losses of chromosomes Y and 14 have been fre-quently detected in oncocytomas [8,14].
When comparing conventional Cytogenetics and CGHresults obtained in the same case, some discrepancies wereobserved. These discrepancies might be due to: 1) CGH anal-ysis allows to detect gains or losses that are not identified bycytogenetic analysis; 2) chromosomal abnormalities that arepresent in a low number of metaphases and in tumors withheterogeneous cell populations cannot be detected by CGH;and 3) in tumors with numerical chromosome abnormalitiesand a quasitriploid chromosome number, CGH results onlydetect clearly those chromosomes that show gains and lossesover or under the trisomie complement (case 5)
A discrepancy was observed in clear cell RCC, wheresome changes affecting small cell populations were observedby Cytogenetics but not by CGH. In cytogenetic studies, theobservation of a few cells displaying a given anomaly such asthe loss of 3p through an imbalanced t(3;8) in twometaphases of case 2 is the criterion for acceptance of clonal-ity. In contrast, a high percentage of cells should generallydisplay a given anomaly in order to be detected by CGH. Onthe same respect, CGH results were comparable to cytoge-netic results in tumors with simple chromosome abnormali-ties, but there were many discrepancies between cytogeneticresults and CGH in tumors with several composite clones.For example, case 3 showed a very complex karyotype in asmall cell subpopulation, but no abnormalities, except for theloss of the Y chromosome, were detected by CGH. This dis-crepancy might be due to intratumor heterogeneity.
Again, it is important to note that CGH data provide anaverage of imbalances: they are representative of a majorproportion of the cell population under investigation. The
advantage is that the risk of analyzing only a small cellclone which may not be representative of the tumor is mini-mized, but there is no measure of the degree of heterogene-ity within a tumor, and a subclone with additional genomicalterations related to aggressiveness may escape to analysis.CGH avoids problems of selection due to an in vitro growthadvantage of certain tumor cells used for chromosomebanding analysis. In case 3, CGH was unable to detect gainof chromosome 7 that appeared in 10 of 16 metaphases ana-lyzed. According to Meloni et al. [5], cells carrying a tri-somy 7 could be more susceptible to abnormal proliferationin vivo or in vitro. We suggest that in this tumor, cells withtrisomy 7 did not correspond to a large cell population, andthat they acquired proliferative advantage during in vitrocell culture for cytogenetic analysis. Supporting this possi-bility is the fact that in case 1, CGH analysis did not detectthe gain of chromosome 7 that appeared as trisomie in nor-mal renal mucosa around tumors Tl and T2. It has beenconfirmed that trisomy of this chromosome is present innormal kidney tissue and it is not an in vitro artifact [22],but it seems logical to think that cells with trisomy 7 are notthe major population in normal renal mucosa, and acquireproliferative advantages in culture.
In summary, our results confirm that CGH provides impor-tant information, which cannot be obtained by G-bandinganalysis alone. However, Cytogenetics detects balanced rear-rangements and intratumor karyotype variability that may alsohave a central role in tumor development and progression.
References
[1] Kovacs G, Fuzesi L, Emanuel A. Cytogenetics of papillary renal celltumors. Genes Chromosomes Cancer 1991 ;3:249-55.
[2] Kovacs G. Molecular differential pathology of renal cell tumours. His-topathology 1993;22:l-8.
[3] Meloni AM, Dobbs RM, Pontes JE, Sandberg AA. Translocation (X;l)in papillary renal cell carcinoma. A new cytogenetic subtype. CancerGenet Cytogenet 1993;65:l-6.
[4] Dijkhuizen T, van den Berg E, Wilbrink M, Weterman M, Geurts vanKessel A, Stôrkel S, Folkers RP, Braam A, de Jong B. DistinctXpll.2 breakpoints in two renal cell carcinomas exhibiting X;auto-some translocations. Genes Chromosomes Cancer 1995; 14:43-50.
[5] Meloni A, Bridge J, Sandberg AA. Reviews on chromosome studiesin urological tumors. I. Renal tumors. J Urol 1992;148:253-65.
[6] Kovacs G. Molecular Cytogenetics of renal tumors. Adv Cancer Res1993;62:89-124.
[7] Dobin SM, Harris CP, Reynolds JA, Coffield KS, Klugo RC, Peter-son RF, Speights VO. Cytogenetic abnormalities in renal oncocyticneoplasms. Genes Chromosomes Cancer 1992;4:25-31.
[8] Neuhaus C, Dijkhuizen T, van den Berg E, Storkel S, Stbckle M,Mensch B, Huber C, Decker HJ. Involvement of the chromosomal re-gion I lq l3 in renal oncocytoma: case report and literature review.Cancer Genet Cytogenet 1997;94:95-8.
[9] Bentz M, Bergerheim US, Li C, Jóos S, Werner CA, Baudis M,Gnarra J, Merino MJ, Zbar B, Linehan WM, Lichter P. Chromosomeimbalances in papillary renal cell carcinoma and first cytogenetic dataof familial cases analyzed by comparative genomic hybridization.Cytogenet Cell Genet I996;75:17-21.
[10] Jiang F, Richter J, Schraml P, Bubendorf L, Casser T, Sauter G, Mi-hatsch MJ, Moch H. Chromosomal imbalances in papillary renal cell
M.A. Rigola et al. / Cancer Genetics and Cytogenetics 137 (2002) 49-53 53
carcinoma. Genetic differences between histological subtypes. Am. JPathol 1998;153:1467-73.
[11] Moch H, Presti JC Jr, Sauter G, Buchholz N, Jordan P, Mihatsch MJ,Waldman FM. Genetic aberrations detected by comparative genomichybridization are associated with clinical outcome in renal cell carci-noma. Cancer Res 1996;56:27-30.
[12] Presti JC Jr, Moch H, Reuter VE, Cordon-Cardo C, Waldman FM.Renal cell carcinoma genetic analysis by comparative genomic hy-bridization and restriction fragment length polymorphism analysis. JUroll996;156:281-5.
[13] Gronwald J, Stòrkel S, Holtgreve-Grez H, Hadaczek P, BrinkschmidtC, Jauch A, Lubinski J, Cremer T. Comparison of DNA gains andlosses in primary renal clear cell carcinomas and metastatic sites: im-portance of Iq and 3p copy number changes in metastatic events.Cancer Res 1997;57:481-7.
[14] Presti JC Jr, Moch H, Reuter V, Huynh D, Waldman FM. Comparativegenomic hybridization for genetic analysis of renal oncocytomas.Genes Chromosomes Cancer 1996; 17:199-204.
[15] American Joint Committee on Cancer: Kidney. In: Behars OH, HensonDE, Hutter RVP, Myers MH, editors. Manual for staging of cancer. 3rdedition. Philadelphia: JB Lippincott Co, 1988, pp. 199-201.
[16] Delahunt B, Eble J. Papillary renal cell carcinoma: a clinicopatho-logic and immunohistochemical study of 105 tumors. Mod Pathol1997;10:537-44.
[17] Berrozpe G, Caballin MR, Miró R, Gelabert A, Egozcue J. Centromeresplitting in bladder cancer. Hum Genet 1990;85:184-6.
[18] ISCN. An international system for human cytogenetic nomenclature.Mitelman F, editor. Basel: S. Karger, 1995.
[19] Rigola MA, Fuster C, Casadevall C, Bernués M, Caballin MR, Gelab-ert A, Egozcue J, Miró R. Comparative genomic hybridization analysisof transitional cell carcinomas of the renal pelvis. Cancer Genet Cyto-genet2001;127:59-63.
[20] Feder M, Liu Z, Apostolou S, Greenberg RE, Testa JR. Loss of chro-mosomes 1 and X i n a renal oncocytoma: implications for a possiblepseudoautosomal tumor suppressor locus. Cancer Genet Cytogenet2000;123:71-2.
[21] Dal Cin P, Roskams T, De Vos R, Van Poppel H, Balzarini P, Van denBerghe H. Involvement of chromosomes 1 and 18 in renal cell tumors.Cancer Genet Cytogenet 2000;! 16:54-8.
[22] Johansson B, Heim S, Mandahl N, Mertens F, Mitelman F. Trisomy7 in nonneoplastic cells. Genes Chromosomes Cancer 1993;6:199-205.
Resultats
Comparative genomic hybridization analysis of invasive bladder tumorswith different grown patterns.Rigola MA, Hernando C, Fuster C, Gelabert A, Egozcue J, Miro R.Journal of Urology (enviat)
3.2*
COMPARATIVE GENOMIC HYBRIDIZATION ANALYSIS OF INVASIVE
BLADDER TUMORS WITH DIFFERENT GROWTH PATTERNS
Ma Àngels Rigola,1'2 Cristina Hernando,1 Carme Fuster,1 Antoni Gelabert,3 Josep
Egozcue,1'2 Rosa Miró.1'2
1. Departament de Biologia Cel·lular, Fisiologia i Immunologia. Universitat
Autònoma de Barcelona, Bellaterra, Spain.
2. Institut de Biotecnología i Biomedicina. Universitat Autònoma de Barcelona,
Bellaterra, Spain.
3. Servei d'Urologia, Hospital del Mar, Barcelona, Spain.
Runninghead: CGH analysis of bladder tumors with different growth pattern
Key words: bladder cancer, chromosome imbalances, comparative genomic hybridization
ABSTRACT
Purpose: To identify the genetic alterations that may be associated with the growth pattern
of invasive bladder cancers
Materials and Methods: A total of 24 specimens of transitional cell carcinoma of the
bladder with solid and mixed solid-papillary growth patterns were analyzed by
Comparative Genomic Hybridization.
Results. For both groups combined, the most frequent chromosome imbalances involved
gains at 20ql3.3, Iq21, 17qll-q22, 8q and 10pl2-pl5. Losses were most frequently
detected in 6ql6-q22 and 5ql5-q23. High level amplifications were detected in 18
different chromosome regions. When comparing genetic changes according to growth
pattern, the most striking differences corresponded to gains on Iq, 1 Iql3, 17q and 13q and
losses in lip, l lq and 17p, that were more frequent in mixed solid papillary tumors,
whereas gains on 2p, 5p and losses in 13q were more frequent in solid growth pattern
tumors.
Conclusions: invasive and high grade non invasive tumors may represent distinct groups of
bladder cancer characterized by a high grade of genetic instability and frequent occurrence
of genetic changes including +20ql3, +lq21, +17qll-q22, +8q21-q22, +6p, +10pl2-pl5, -
6ql6q22, -5ql5-q23, - 4q; these tumors may arise de novo and not through progression of
a low grade pTa precursor. On the other hand, the pattern of CGH gains seems very similar
in invasive and high grade tumors irrespective of their growth pattern. These results suggest
a convergent pathway in the last stages of bladder tumor development as has been
suggested by conventional cytogenetic analysis.

INTRODUCTION
Transitional cell carcinoma (TCC) of the bladder comprises a heterogeneous group of
tumors. Apart of the heterogeneity observed in specimens of a defined histopathologic
category, an intratumoral heterogeneity also exists. Heterogeneity could explain differences
in the behavior of tumors of identical classification.1
It has been demonstrated that progression from minimally invasive to deeply invasive
cancer goes along with the acquisition of genomic alterations increasing the malignant
potential of cancer cells. Cytogenetic changes that are more frequents in pT2-T4 than in
pTl TCC of the bladder include gains at 3q, 5p, 7p, 18p, Xq and losses in 5q, 6q, 15q.2"4
These chromosome regions may carry genes that play a role for tumor progression.
Clinical and genetic data support the existence of multiple pathways in the genesis of
invasive urothelial cancers.2'5"7 Some of these invasive tumors may develop from low grade
superficial papillary tumors, while most of invasive tumors are considered not to have a
history of papillary superficial tumors.
On the other hand, it has been described that bladder tumors have a different biological
1 £ ff
behavior depending on their growth pattern. ' Studies carried out in our laboratory
suggested that allelic losses at 6q were associated with rumors with a solid growth pattern.
In this type of tumors, allelic losses at 3p were associated with invasion. These results
supported the lack of involvement of these genetic alterations in the progression of low-
grade papillary bladder tumors. On the other hand, by comparative genomic hybridization

analysis, Richter et al.2 demonstrated an association of +l lql3 and —9q with a papillary
growth pattern.
Altogether, these data suggest that the identification of changes linked to tumor progression
could be problematic because genetic differences between pTl and pT2-T4 might be due
to their different growth patterns and could represent different evolutionary pathways.
To further identify chromosome imbalances related to growth pattern, we analyzed 16 solid
(S) and 8 mixed solid-papillary (mSP) bladder tumors by comparative genomic
hybridization.

MATERIALS AND METHODS
Patients and samples
Tumor specimens from 24 patients (20 men and 4 women) were included in this study.
Clinical and pathological data from the patients are indicated in table 1
16 tumors (cases 1-16) showed a solid growth pattern. Eight tumors (cases 17-24) showed
a mixed solid- papillary growth pattern. Three tumors showed a sarcomatoid evolution in
addition to a solid, (cases 8,15) and a mixed solid-papillary (case 23) growth pattern
Tumor samples were obtained at surgery. The specimens were frozen immediately after
surgical removal and stored at -80°C until analysis. Portions of each tumor specimen were
examined by a pathologist to confirm the presence of the tumor, to evaluate tissue
morphology, and stage. All specimens were graded according to the World Health
Organization classification9 and staged according to the TNM system.10
CGH Analysis.
DNA was extracted from frozen tissue sections following standart methods. CGH analysis
was performed according to the method described by Rigola et al." Normal and tumor
DNA were labeled with Spectrum Red-dUTP and Spectrum Green-dUtp by nick translation
using a commercial kit (Vysis, Downers Grove, IL). Subsequently, equal amounts of
normal and tumor labeled probes (500 ng) and 10 u.g of Cot-1 DNA were co precipitated
using ethanol. The precipitated DNA was dissolved in 12ul of hybridization buffer and
denatured at 74°C for 8 min. Normal metaphase spreads (Vysis, Downers Grove, IL) were
denatured for 5 min at 74°C and hybridized with the DNA mixture in a moist chamber for 2

to 3 days. Slides were washed according to the protocol supplied by the manufacturer.
Chromosomes were counterstained with 4,6-diamino-2-phenylindole (DAPI), resulting in a
G band-like pattern that was used for chromosome identification.
Slides were analyzed using a Cytovision Ultra workstation (Applied Imaging, Sunderland,
United Kingdom) and Quips Smart Capture Software from Vysis. The fluorescent
hybridization signals and DAPI-staining patterns were captured. Ratio values above 1.25
and below 0.75 were considered to represent chromosomal gains and losses respectively. A
high-level DNA amplification was considered when the fluorescence ratio values exceeded
1.5 and, in addition, a distinct band-like hybridization signal of the tumor DNA was seen.
Negative control experiments were performed using differentially labeled male versus male
DNA and female versus female DNA. In addition, control experiments in which the Red-
dUTP and Green-dUTP labels were interchanged between normal and tumor cells were also
performed.
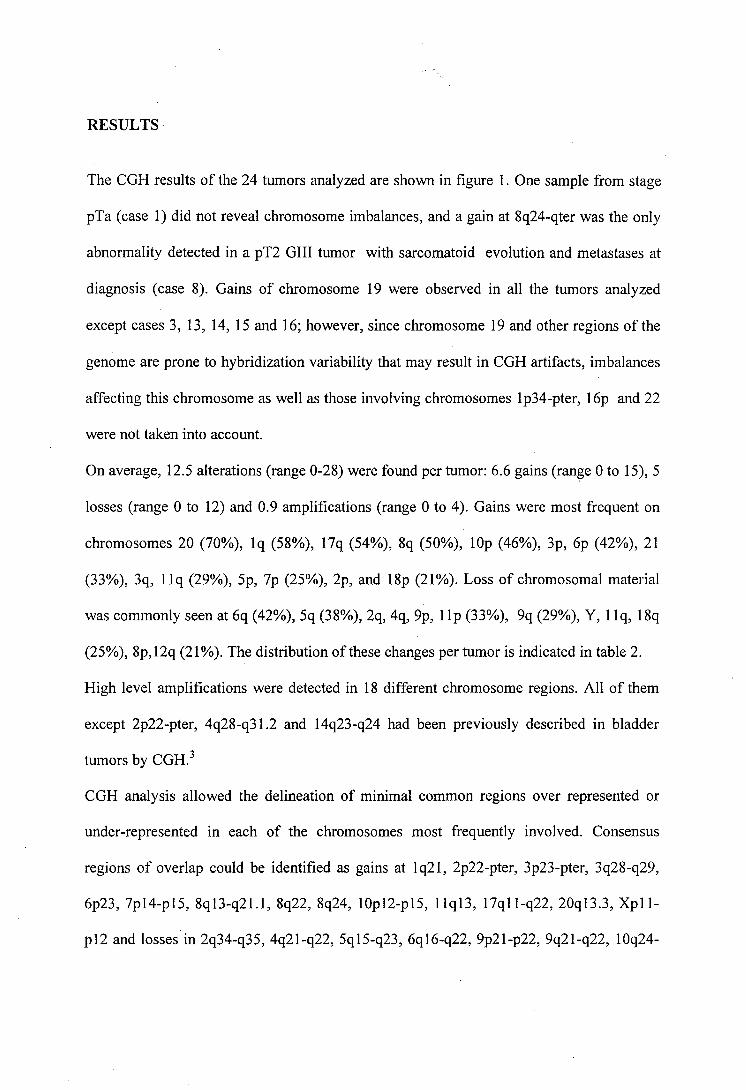
RESULTS
The CGH results of the 24 tumors analyzed are shown in figure 1. One sample from stage
pTa (case 1) did not reveal chromosome imbalances, and a gain at 8q24-qter was the only
abnormality detected in a pT2 GUI tumor with sarcomatoid evolution and métastases at
diagnosis (case 8). Gains of chromosome 19 were observed in all the tumors analyzed
except cases 3, 13, 14, 15 and 16; however, since chromosome 19 and other regions of the
genome are prone to hybridization variability that may result in CGH artifacts, imbalances
affecting this chromosome as well as those involving chromosomes Ip34-pter, 16p and 22
were not taken into account.
On average, 12.5 alterations (range 0-28) were found per tumor: 6.6 gains (range 0 to 15), 5
losses (range 0 to 12) and 0.9 amplifications (range 0 to 4). Gains were most frequent on
chromosomes 20 (70%), Iq (58%), 17q (54%), 8q (50%), lOp (46%), 3p, 6p (42%), 21
(33%), 3q, l lq (29%), 5p, 7p (25%), 2p, and 18p (21%). Loss of chromosomal material
was commonly seen at 6q (42%), 5q (38%), 2q, 4q, 9p, 1 Ip (33%), 9q (29%), Y, 1 Iq, 18q
(25%), 8p,12q (21%). The distribution of these changes per tumor is indicated in table 2.
High level amplifications were detected in 18 different chromosome regions. All of them
except 2p22-pter, 4q28-q31.2 and 14q23-q24 had been previously described in bladder
tumors by CGH.3
CGH analysis allowed the delineation of minimal common regions over represented or
under-represented in each of the chromosomes most frequently involved. Consensus
regions of overlap could be identified as gains at Iq21, 2p22-pter, 3p23-pter, 3q28-q29,
6p23, 7pl4-pl5, 8ql3-q21.1, 8q22, 8q24, 10pl2-pl5, Ilql3, 17qll-q22, 20ql3.3, Xpll-
p!2 and losses in 2q34-q35, 4q21-q22, 5ql5-q23, 6ql6-q22, 9p21-p22, 9q21-q22, 10q24-

q25, Ilpl3-pter, Ilq23, 12q21-q22, 13q21-q22 and 18qll.2-qter.
We observed a general correlation between the grade/stage of the tumors and the
complexity of chromosome imbalances, indicating that progressive accumulation of
acquired genetic alterations is the driving force of multistep bladder TCC carcinogenesis.
When genetic changes present in solid (S) and in mixed solid-papillary (mSP) growth
pattern tumors were analyzed separately, we found small differences on the averages of
total number of imbalances (15 in mixed solid-papillary versus 11 in solid), and the
averages of gains (9 versus 6.7) and losses (6.3 versus 4.39). These differences were not
significant and they are probably due to the advanced stage-grade of most tumors with
mixed S-P growth pattern (7/8 tumors). We observed that gains on 3q, lOp, l lq 12q and
17q as well as losses on 2q, 1 Ip, 1 Iq and 13q were more frequent in T2-T4 solid-papillary
tumors than in solid tumors at the same stages. Gains of chromosome 2p was only
observed in tumors with solid growth pattern. Gains on 5p and 13q were observed in a 36%
of invasive solid tumors versus 14% of mSP invasive tumors. Chromosome alterations
such as gains on 6p, 8q, 20q and losses on 6q and 9p can be found with similar frequencies
in mSP and S invasive tumors. Loss of 9q was detected with a low frequency (14%) in mSP
tumors. Gains of 20q were detected in 100% of the mSP tumors irrespective of their stage
and grade.

DISCUSSION
As shown in previous reports, no particular alteration was significantly linked to advanced
tumor stage. A progressive increase in the number of chromosome alterations with tumor
grade and stage was evident in the majority of cases (table 2).
The genetic findings in solid and mixed solid papillary tumors were comparable regarding
the average number of changes per tumor as well as the average of gains and losses. The
most frequent chromosome imbalances involved gains at 20ql3.3, Iq21, 17ql l-q22, 8q and
10pl2-pl5. Losses were most frequently detected in 6ql6-q22 and 5ql5-q23. Except in
case 2, a pTIGII tumor with a very poor outcome, none of these changes was detected in
the superficially or minimally invasive low grade tumors analyzed.
In spite of the high number of imbalances observed, it is interesting to note that most of
them involved losses and/or gains in different arms of the same chromosome. Thus gains at
5p, 6p, 8q, lOp, 17q and 18p as well as losses in 5q, 6q, 8p, lOq, 17p and 18q were detected
as frequent chromosome changes in our series of tumors. Moreover, the simultaneous
presence of 5p+ and 5q- (5p+/5q-) was detected in cases 5, 13, 16 and 20; 6p+/6q- and
10p+/10p- were detected in cases 5, 12, 13, 21 and cases 13, 20 respectively. Cases 12, 15,
16 and 20 showed 8p-/8q+ whereas 17p-/17q+ was detected in cases 7, 23 and 24. In some
of these cases, the pattern of gains and losses in different arms of the same chromosome
was indicative of an isochromosome; however, in other of these cases the gains and losses
affected small areas of the chromosome arms, and were not indicative of an
isochromosome.
Moreover, high amplification of I lq l3 was frequently associated with losses at l ip and
llq (cases 5, 12 and 23). These results agree with a preferential involvement of specific
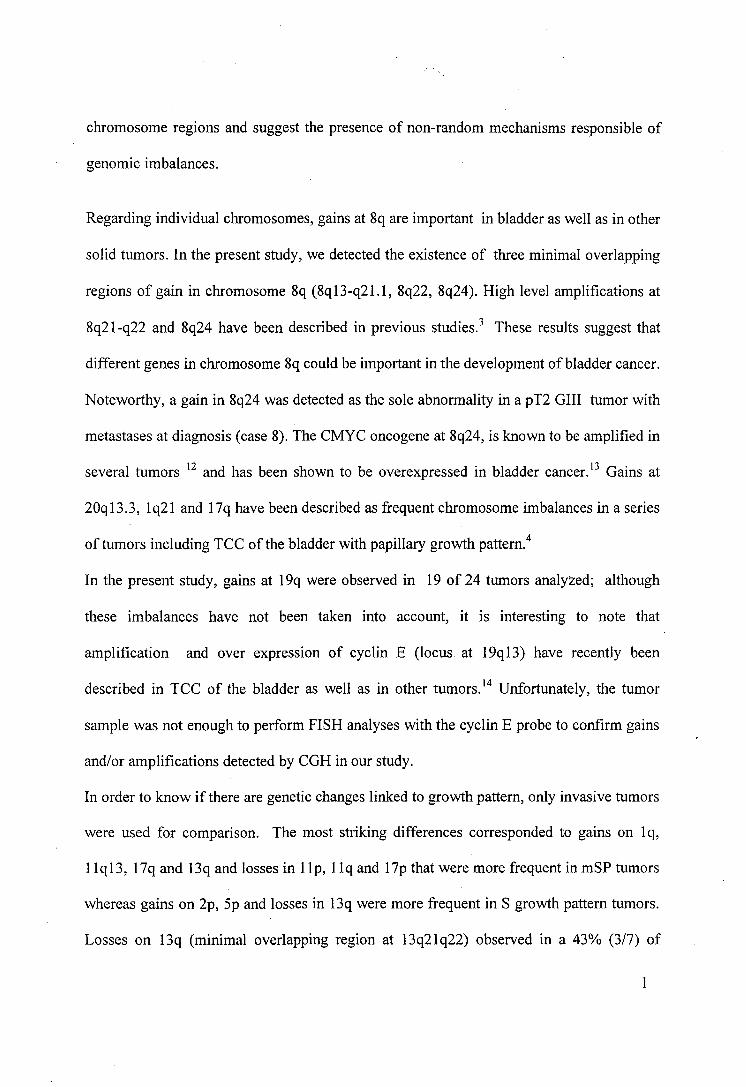
chromosome régions and suggest the presence of non-random mechanisms responsible of
genomic imbalances.
Regarding individual chromosomes, gains at 8q are important in bladder as well as in other
solid tumors. In the present study, we detected the existence of three minimal overlapping
regions of gain in chromosome 8q (8ql3-q21.1, 8q22, 8q24). High level amplifications at
8q21-q22 and 8q24 have been described in previous studies.3 These results suggest that
different genes in chromosome 8q could be important in the development of bladder cancer.
Noteworthy, a gain in 8q24 was detected as the sole abnormality in a pT2 GUI tumor with
métastases at diagnosis (case 8). The CMYC oncogene at 8q24, is known to be amplified in
several tumors u and has been shown to be overexpressed in bladder cancer.13 Gains at
20ql3.3, Iq21 and 17q have been described as frequent chromosome imbalances in a series
of tumors including TCC of the bladder with papillary growth pattern.4
In the present study, gains at 19q were observed in 19 of 24 tumors analyzed; although
these imbalances have not been taken into account, it is interesting to note that
amplification and over expression of cyclin E (locus at 19ql3) have recently been
described in TCC of the bladder as well as in other tumors.14 Unfortunately, the tumor
sample was not enough to perform FISH analyses with the cyclin E probe to confirm gains
and/or amplifications detected by CGH in our study.
In order to know if there are genetic changes linked to growth pattern, only invasive tumors
were used for comparison. The most striking differences corresponded to gains on Iq,
1 Iql3, 17q and 13q and losses in 1 Ip, 1 Iq and 17p that were more frequent in mSP tumors
whereas gains on 2p, 5p and losses in 13q were more frequent in S growth pattern tumors.
Losses on 13q (minimal overlapping region at 13q21q22) observed in a 43% (3/7) of
1

invasive mSP versus a 1% (1/11) of S tumors contrast with gains of 13q observed more
frequently in S tumors (36%,4/ll S versus 14%, 1/7 mSP). Gains of Iq and 17q were
detected in 100% and 85% of the mSP invasive tumors with mSP versus 36% of S growth
pattern tumors
Gains of 2p were exclusively seen in tumors with solid growth pattern in the present study,
however similar imbalances, have been reported by other authors in superficial and
invasive papillary tumors.2'3 The higher frequency of l lq gains in papillary carcinomas
than in solid ones is in line with previous studies suggesting that llq gains may be
characteristic of papillary tumors.2'3 Contrarily to the data of Richter et al., 2 the frequency
of chromosome 9q losses was lower in mSP than in S growth pattern tumors.
The number of alterations and the occurrence of particular changes can vary broadly in
individual tumors; however a preferential order in the occurrence of chromosomal gains
and losses was observed in several cases, suggesting the existence of common evolutive
pathways irrespective of growth pattern For example, when comparing the changes
observed in two tumors with different growth patterns such as case 12 (S) and case 20
(mSP) a striking similar pattern of gains can be seen (coincident chromosome or
chromosome regions are indicated in bold):
Case 12:
enh(lq21,3p21p24,3ql3qter,7,8q,10pl2pter,14,16q21qter,17pllq21,18p,20,Xq21qter,Y)
amp(3p24pter, 6p22pter, Ilql2ql3)
Case 20:
enh(lq21q25,3q27qter,5p,7p,8q21.3q22,10p22pter,17pl2qter,18p,20q,21q22, Xpl Ipl4)
amp(6p21.3p24)
1
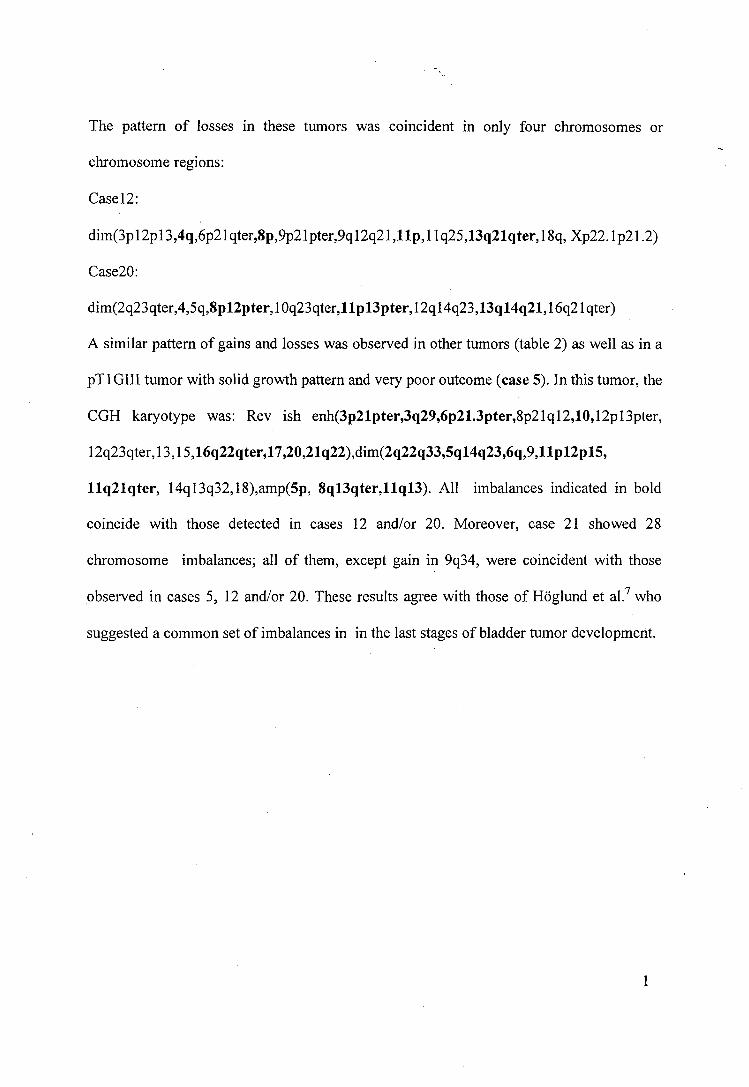
The pattern of losses in these tumors was coincident in only four chromosomes or
chromosome regions:
Casel2:
dim(3pl2pl3,4q,6p21qter,8p,9p21pter,9ql2q21,llp,llq25,13q21qter,18q, Xp22.1p21.2)
Case20:
dim(2q23qter,4,5q,8pl2pter, 1 Oq23qter,l IplSpter, 12q 14q23,13q 14q21,16q21 qter)
A similar pattern of gains and losses was observed in other tumors (table 2) as well as in a
pTIGIII tumor with solid growth pattern and very poor outcome (case 5). In this tumor, the
CGH karyotype was: Rev ish enh(3p21pter,3q29,6p21.3pter,8p21ql2,10,12pl3pter,
12q23qter,13,15,16q22qter,17,20,21q22),dim(2q22q33,5ql4q23,6q,9,llpl2pl5,
Ilq21qter, 14ql3q32,18),amp(5p, 8ql3qter,llql3). All imbalances indicated in bold
coincide with those detected in cases 12 and/or 20. Moreover, case 21 showed 28
chromosome imbalances; all of them, except gain in 9q34, were coincident with those
observed in cases 5, 12 and/or 20. These results agree with those of Hôglund et al.7 who
suggested a common set of imbalances in in the last stages of bladder tumor development.
CONCLUSIONS
According to our results and those of other authors,2'3 we can conclude that invasive and
high grade non invasive tumors may represent a distinct group of bladder cancer
characterized by a high grade of genetic instability and frequent occurrence of genetic
changes including +20ql3, +lq21, +17qll-q22, +8q21-q22, +6p, +10pl2-pl5, -6ql6q22,
-5ql5-q23, - 4q; these tumors may arise de novo and not through the progression of a low
grade pTa precursor. $s
On the other hand, the pattern of CGH gains seems very similar in invasive and high grade
tumors irrespective of their growth pattern. These results suggest a convergent pathway in
the last stages of bladder tumor development as has been suggested by conventional
cytogenetic analysis.7

REFERENCES
1. Schalken, J.A., Van Moorselaar, R. J. A., Bringuier, P. P., Debruyne, M. 1: Critical
review of the models to study the biologic progression of bladder cancer. Semin
SurgOncol, 8:274, 1992
2. Richter, J., Beffa, L., Wagner, U., Schrami, P., Gasser, T. C., Moch, H. et al.:
Patterns of chromosomes imbalances in advanced urinary bladder cancer detected
by comparative genomic hybridization. Am J Pathol, 153: 1615, 1998
3. Simon, R., Burger, H., Semjonov, A., Hertle, L., Terpe, H-J., Bòcker W.: Patterns
of chromosomal imbalances in muscle invasive bladder cancer. Int J Oncol, 17:
1025,2000
4. Prat, E., Bernués, M., Caballín, M. R., Egozcue, J., Gelabert, A., Miró, R.:
Detection of chromosomal imbalances in papillary bladder tumors by comparative
genomic hybridization. Urology, 57: 986, 2001
5. Kakizoe, T., Tobisu, K., Takai, K., Tanaka T., Kishi, K., Teshima, S.: Relationship
between papillary and nodular transitional cell carcinoma in the human urinary
bladder. Cancer Res, 48: 2293, 1998
6. Spruck, C. H. III., Ohneseit, P. F., González-Zulueta, M., Esrig, D., Miyao, N.,
Tsai, Y. C. et al.: Two molecular pathways to transitional cell carcinoma of the
bladder. Cancer Res, 54: 784, 1994
7. Hoglund, M., Sail, T., Heim, S., Mitelman, F., Mandahl, N., Fadl-Elmula, I.:
Identification of cytogenetic subgroups and karyotypic pathways in transitional cell
carcinoma. Cancer Res, 61: 8241, 2001
8. Bernués, M., Casadevall, C., Caballín, M. R., Miró, R., Ejarque, M. J., Chéchile, G.
et al.: Study of allelic losses on 3p, 6q, and 17p in human urothelial cancer. Cancer
1
Genet Cytogenet, 112: 42, 1999
9. World Health Organization: Histological typing of urinary bladder tumors, in
International classification of tumors, No. 10. Geneva, World Health Organization,
1973
10. Union International Contre le Cancer: TNM Classification of Malignant tumors.
Geneva, Union International Contre le Cancer, 1978
11. Rigola, M. A., Fuster, C., Casadevall, C., Bernués, M., Caballín, M. R., Gelabert, A.
et al.: Comparative genomic hybridization análisis of transitional cell carcinomas of
the renal pelvis. Cancer Genet Cytogenet, 127: 59, 2001
12. Brison, O.: Gene amplification and tumor progression. Biochem Biophys Acta,
1165: 25, 1993
13. Sardi, I., Dal Canto, M., Bartoletti, R., Guazzelli, R., Travaglini, F., Montali, E.:
Molecular genetic alterations of c-myc oncogene in superficial and locally advanced
bladder cancer. Eur Urol, 33: 424, 1998
14. Schraml, P., Bûcher, C., Bissig, H., Mocito, A., Haas, P., Wilber, K. et al.: Cyclin E
overexpression and amplification in human rumours. J Pathol, 200: 375, 2003
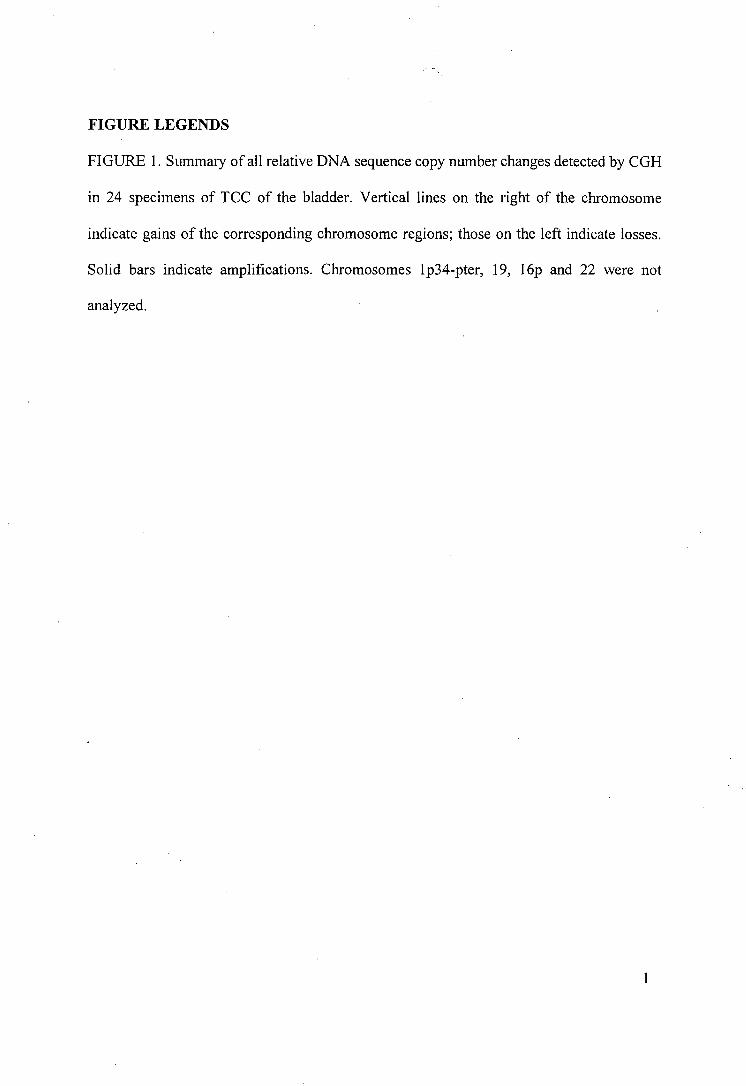
FIGURE LEGENDS
FIGURE 1. Summary of all relative DNA sequence copy number changes detected by CGH
in 24 specimens of TCC of the bladder. Vertical lines on the right of the chromosome
indicate gains of the corresponding chromosome regions; those on the left indicate losses.
Solid bars indicate amplifications. Chromosomes Ip34-pter, 19, 16p and 22 were not
analyzed.
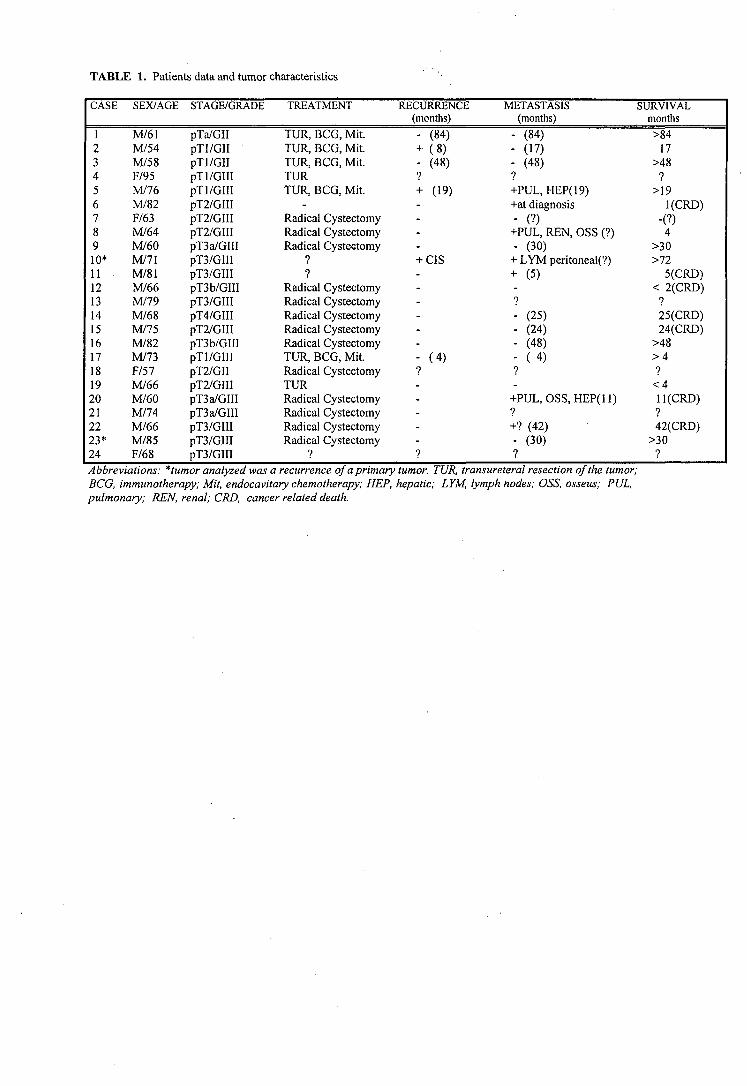
TABLE 1. Patients data and tumor characteristics
CASE
12345678910*11121314151617181920212223*24
SEX/AGE
M/61M/54M/58F/95M/76M/82F/63M/64M/60M/71M/81M/66M/79M/68M/75M/82M/73F/57M/66M/60M/74M/66M/85F/68
STAGE/GRADE
pTa/GIIpTl/GIIpTl/GIIpTl/GIIIpTl/GIIIpT2/GIIIpT2/GHIpT2/GIIIpT3a/GIIIpT3/GIIIpT3/GIIIpT3b/GIIIpT3/GIHpT4/GIIIpT2/GIIIpT3b/GIIIpTl/GIIIpT2/GIIpT2/GIIIpT3a/GIIlpT3a/GIIIpT3/GIIIpT3/GIIIpT3/GIII
TREATMENT
TUR, BCG, Mit.TUR, BCG, Mit.TUR, BCG, Mit.TURTUR, BCG, Mit.
-Radical CystectomyRadical CystectomyRadical Cysteetomy
9
?Radical CystectomyRadical CystectomyRadical CystectomyRadical CystectomyRadical CystectomyTUR, BCG, Mit.Radical CystectomyTURRadical CystectomyRadical CystectomyRadical CystectomyRadical Cystectomy
?
RECURRENCE(months)
- (84)+ (8)- (48)?+ (19)----+ CIS------- (4)9-----?
METASTASIS(months)
- (84)
- (H)- (48)?+PUL, HEP(19)+at diagnosis- (?)
+PUL, REN, OSS (?)- (30)
+ LYM peritoneal(?)+ (5)-?- (25)- (24)- (48)- ( 4 )?-
+PUL, OSS, HEP(ll)9
+? (42)- (30)?
SURVIVALmonths
>8417
>489
>19l(CRD)
-(?)4
>30>72
5(CRD)< 2(CRD)
9
25(CRD)24(CRD)
>48> 4?<4ll(CRD)?42(CRD)
>30?
Abbreviations: *tumor analyzed was a recurrence of a primaryBCG, immunotherapy; Mit, endocavitary chemotherapy; HEP,pulmonary; REN, renal; CRD, cancer related death.
tumor. TUR, transureteral resection of the tumor;hepatic; LYM, lymph nodes; OSS, osseus; PUL,

TA
BLE
2.
Dis
trib
utio
n o
f the
mos
t fre
quen
t chr
omos
ome
imba
lanc
es p
er tu
mor
• ,*
•» • • • • • *
+ •
m • • •
• • •
« •
SO
LID
GR
OW
TH
PA
TT
ER
NP
AP
ILLA
RY
GR
OW
TH
P
AT
TE
RN
pT
I/GII
pT
I/GIII
pT2/
GII,
GIII
pT3,
T4/
GIII
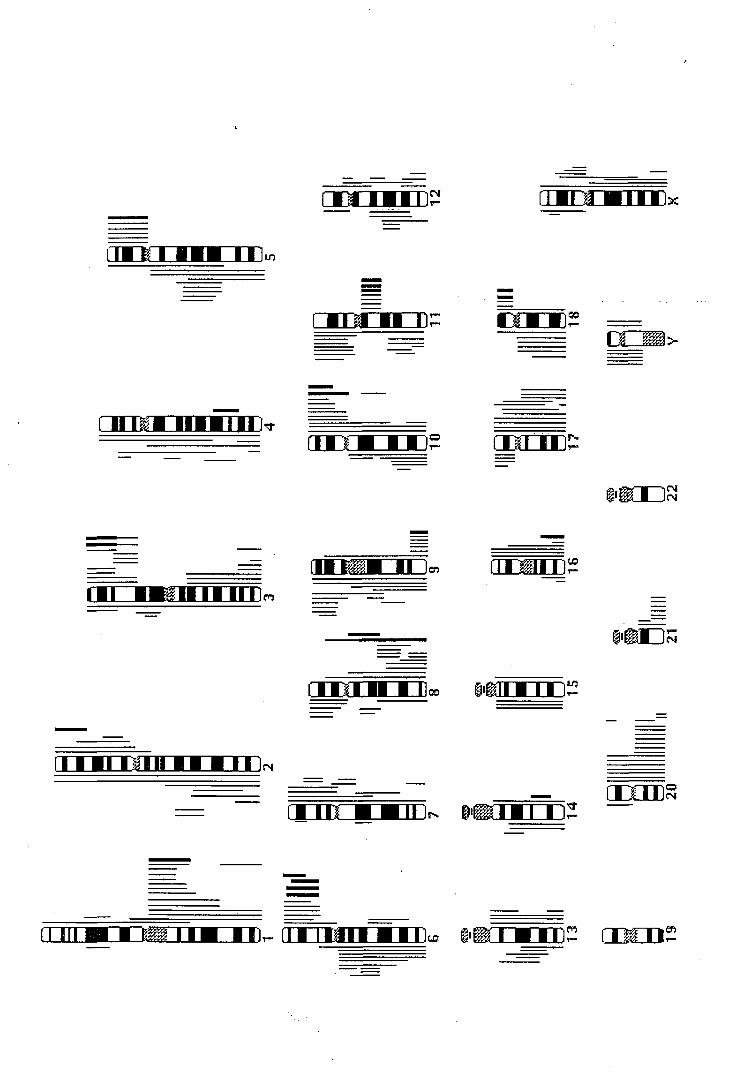
iCNI ÍHEUUJLU;
• ••i i
•Ti •• I
I II I
(N
rmi •• • .11»
I ••• ilMI •• • ••
nrrnaii ••» .

A Discussió
*•
*
5. DISCUSSIÓ
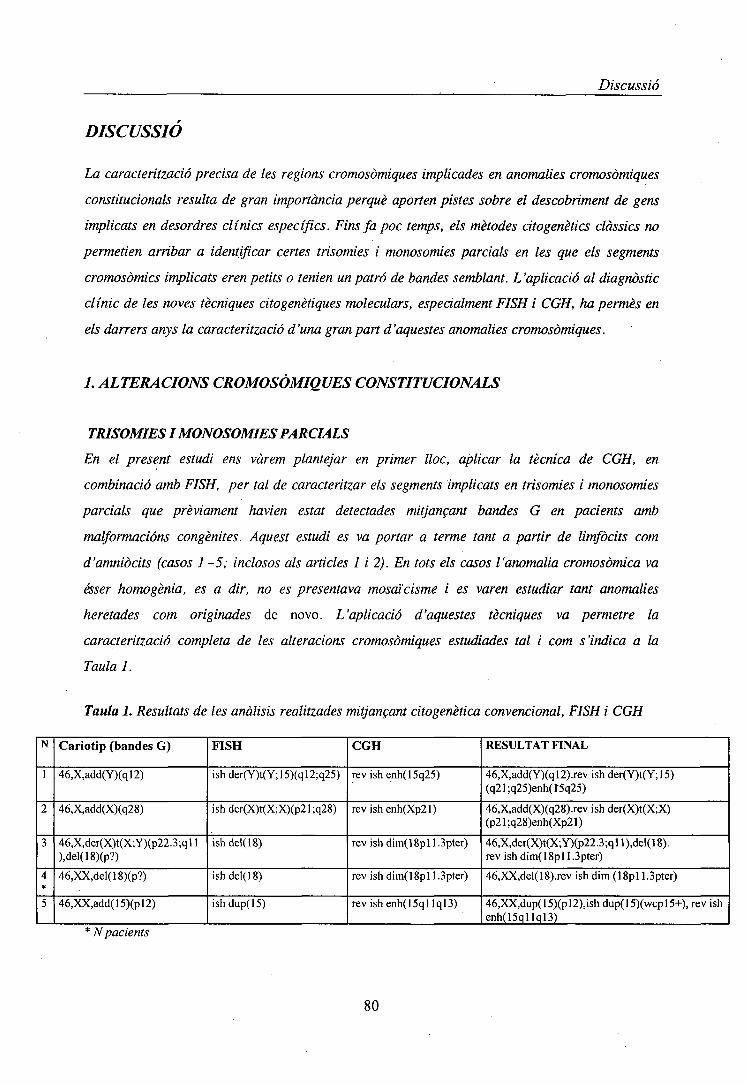
Discussió
DISCUSSIÓ
La caracterització precisa de les regions cromosòmiques implicades en anomalies cromosòmiques
constitucionals resulta de gran importància perquè aporten pistes sobre el descobriment de gens
implicats en desordres clínics específics. Fins fa poc temps, els mètodes citogenètics clàssics no
permetien arribar a identificar certes trisomies i monosomies parcials en les que els segments
cromosòmics implicats eren petits o tenien un patró de bandes semblant. L'aplicació al diagnòstic
clínic de les noves tècniques citogenètiques moleculars, especialment FISH i CGH, ha permès en
els darrers anys la caracterització d'una gran part d'aquestes anomalies cromosòmiques.
1. ALTERACIONS CROMOSÒMIQUES CONSTITUCIONALS
TRISOMIES I MONOSOMIES PARCIALS
En el present estudi ens vàrem plantejar en primer lloc, aplicar la tècnica de CGH, en
combinació amb FISH, per tal de caracteritzar els segments implicats en trisomies i monosomies
parcials que prèviament havien estat detectades mitjançant bandes G en pacients amb
malformacions congènites. Aquest estudi es va portar a terme tant a partir de limfòcits com
d'amniòcits (casos 1 -5; inclosos als articles 1 i 2). En tots els casos l'anomalia cromosòmica va
ésser homogènia, es a dir, no es presentava mosaïcisme i es varen estudiar tant anomalies
heretades com originades de novo. L'aplicació d'aquestes tècniques va permetre la
caracterització completa de les alteracions cromosòmiques estudiades tal i com s'indica a la
Taula 1.
Taula 1. Resultats de les anàlisis realitzades mitjançant citogenètica convencional, FISH i CGH
N
1
2
3
4*
5
Cariotip (bandes G)
46,X,add(Y)(ql2)
46,X,add(X)(q28)
46,X,der(X)t(X;Y)(p22.3;ql 1),del(18)(p?)
46,XX,del(18)(p?)
46,XX,add(15)(pl2)
FISH
ishder(Y)t(Y;15)(ql2;q25)
ishder(X)t(X;X)(p21;q28)
ishdel(18)
ishdel(18)
ishdup(15)
CGH
revishenh(15q25)
revishenh(Xp21)
rev ishdim(18pll.3pter)
rev ish dim(18pl l.Spter)
rev ishenh(15qllql3)
RESULTAT FINAL
46,X,add(Y)(ql2).rev ish der(Y)t(Y;15)(q21;q25)enh(15q25)
46,X,add(X)(q28).rev ish der(X)t(X;X)(p21;q28)enh(Xp21)
46,X,der(X)t(X;Y)(p22.3;qll),del(18).rev ish dim(18pl l.Spter)
46,XX,del(18).rev ish dim (18pl l.Spter)
46,XX,dup(15)(pl2),ish dup(15)(wcpl5+), rev ishenh(15qllql3)
* N pacients
80

Discussió
Es interessant destacar que si be la CGH ens ha permès identificar els segments cromosòmics
guanyats en totes les trisomies parcials analitzades (pacients 1,2 i 5), per caracteritzar
completament l'anomalies cromosòmiques s'han requerit les dades obtingudes per bandes G i
FISH per determinar els punts de trencament i el lloc exacta del caríotip on s'ubicaven els
fragments. Conèixer aquests dos aspectes, es de gran importància ja que el segment cromosòmic
addicionat pot tenir diferents repercussions fenotípiques segons es trobi en una o altre regió
cromosòmica.
Les nostres observacions, com les d'altres autors, confirmen com moltes alteracions
cromosòmiques constitucionals poden ésser identificades de una forma precisa en diagnòstic pre i
postnatal amb la utilització conjunta de les diferents tècniques de citogenètica convencional i
molecular (Nacheva et al. 1998; Daniely et al. 1999; Lapierre et al. 2000) incloent-hi delecions
críptiques (Breen et al 1999).
Interpretació dels perfils de CGH a l'analitzar anomalies cromosòmiques constitucionals
La tècnica de CGH originàriament va ésser desenvolupada per l'anàlisi citogenètica de mostres
turnarais. En aquest tipus de mostres, per tal d'evitar els artefactes tècnics deguts a supressió
insuficient del DNA repetitiu que poden comportat interpretacions errònies (falsos positius) es
varen acceptar les recomanacions proposades per Kallionemi et al. (1994) i DuManoir et al.
(1995). Segons aquests autors, en l'anàlisi dels perfils obtinguts per CGH s'han d'excloure les
regions centromèriques, telomèriques, les corresponents als braços curts dels cromosomes
acrocèntrics, les regions Ip32—pter, Iql2, 9ql2, 16ql2 i els cromosomes 19 i 22 sencers. Es a
dir, en relació als canvis (guanys i pèrdues) que afecten a regions telomèriques detectades en els
perfils de CGH, cal actuar amb precaució donat que a vegades es pot observar reducció de les
intensitats fluorescents verdes i vermelles sense existir desequilibris reals, induint per tant a
. errors.
Els resultats de CGH del pacient 2 no mostren només la duplicació de la regió Xp21-pter sinó que
també evidencià la pèrdua de la regió Xq28-qter. Si acceptéssim les recomanacions, anteriorment
descrites, respectes als canvis genòmics en regions telomèriques no podríem acceptar aquest
desequilibri a la regió Xqter. Però, en el nostre cas, basant-nos en els resultats obtingut per FISH
i Bandes G podem acceptar com real la existència de la deleció Xq28-qter en aquest pacient (en
el que no s'ha detectar mosaïcisme).
81
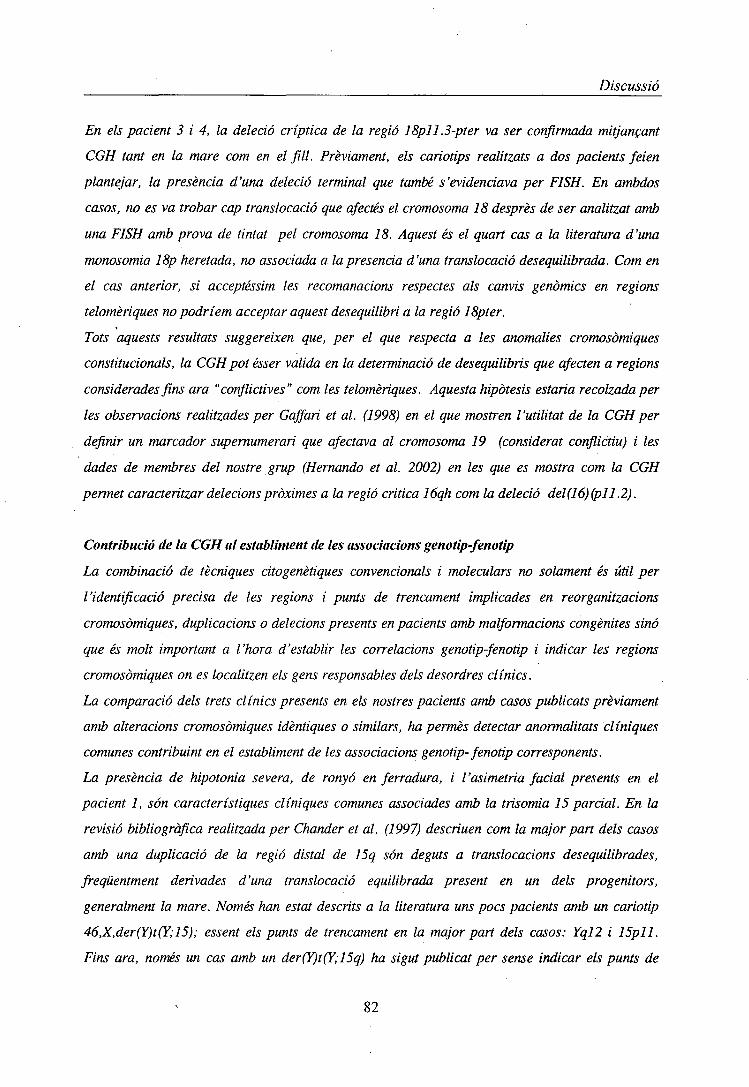
Discussió
En els pacient 3 i 4, la deleció críptica de la regió 18pll.3-pter va ser confirmada mitjançant
CGH tant en la mare com en el fill. Prèviament, els cariotips realitzats a dos pacients feien
plantejar, la presència d'una deleció terminal que també s'evidenciava per FISH. En ambdós
casos, no es va trobar cap translocació que afectés el cromosoma 18 desprès de ser analitzat amb
una FISH amb prova de tintat pel cromosoma 18. Aquest és el quart cas a la literatura d'una
monosomia 18p heretada, no associada a la presencia d'una translocació desequilibrada. Com en
el cas anterior, si acceptéssim les recomanacions respectes als canvis genòmics en regions
telomèríques no podríem acceptar aquest desequilibri a la regió ISpter.
Tots aquests resultats suggereixen que, per el que respecta a les anomalies cromosòmiques
constitucionals, la CGH pot ésser valida en la determinació de desequilibris que afecten a regions
considerades fins ara "conflictives" com les telomèríques. Aquesta hipòtesis estaría recolzada per
les observacions realitzades per Gaffari et al. (1998) en el que mostren l'utilitat de la CGH per
definir un marcador supernumerari que afectava al cromosoma 19 (considerat conflictiu) i les
dades de membres del nostre grup (Hernando et al. 2002) en les que es mostra com la CGH
permet caracteritzar delecionspròximes a la regió critica 16qh com la deleció del(16)(pll.2).
Contribució de la CGH al establiment de les associacions genotip-fenotip
La combinació de tècniques citogenètiques convencionals i moleculars no solament és útil per
l'identificació precisa de les regions i punts de trencament implicades en reorganitzacions
cromosòmiques, duplicacions o delecions presents en pacients amb malformacions congènites sinó
que és molt important a l'hora d'establir les correlacions genotip-fenotip i indicar les regions
cromosòmiques on es localitzen els gens responsables dels desordres clínics.
La comparació dels trets clínics presents en els nostres pacients amb casos publicats prèviament
amb alteracions cromosòmiques idèntiques o similars, ha permès detectar anormalitats clíniques
comunes contribuint en el establiment de les associacions genotip-fenotip corresponents.
La presència de hipotonia severa, de ronyó en ferradura, i l'asimetria facial presents en el
pacient 1, són característiques clíniques comunes associades amb la trísomia 15 parcial. En la
revisió bibliogràfica realitzada per Chander et al. (1997) descriuen com la major pari dels casos
amb una duplicació de la regió distal de 15q són deguts a translocacions desequilibrades,
freqüentment derivades d'una translocació equilibrada present en un dels progenitors,
generalment la mare. Només han estat descrits a la literatura uns pocs pacients amb un cariotip
46,X,der(Y)t(Y;15); essent els punts de trencament en la major pari dels casos: Yql2 i 15pll.
Fins ara, només un cas amb un der(Y)t(Y;15q) ha sigut publicat per sense indicar els punts de
82