Bioreceptivity optimisation of SIS - upcommons.upc.edu · en la portada de esta tesis, siempre...
184
Bioreceptivity optimisation of concrete substratum to stimulate biological colonisation Doctoral thesis written by: Sandra Manso Blanco Directed by: Antonio Aguado de Cea Ignacio Segura Pérez Nele De Belie Barcelona, May 2014 Universitat Politècnica de Catalunya – Departament d’Enginyeria de la Construcció Ghent University – Magnel Laboratory for Concrete Research DOCTORALTHESIS
-
Upload
duongthuan -
Category
Documents
-
view
222 -
download
0
Transcript of Bioreceptivity optimisation of SIS - upcommons.upc.edu · en la portada de esta tesis, siempre...
Bioreceptivity optimisation of concrete substratum to stimulate biological colonisation
Doctoral thesis written by:
Sandra Manso Blanco
Directed by:
Antonio Aguado de Cea
Ignacio Segura Pérez
Nele De Belie
Barcelona, May 2014
Universitat Politècnica de Catalunya – Departament d’Enginyeria de la Construcció
Ghent University – Magnel Laboratory for Concrete Research
DO
CT
OR
AL
TH
ES
IS
Ju
lio, 2
00
8
tesis
do
cto
ral re
aliz
ad
a p
or
Noé
Vill
eg
as F
lore
s
A
ná
lisis
de v
alo
r en
la
to
ma
de
de
cis
ione
s a
plic
ado
a
ca
rre
tera
s


A mis padres, Rafael e Isabel,
a mi hermano, Rafa, y mi cuñada, Carolina,
os quiero.
A la memoria de Luís Agulló Fité.


“Life is not easy for any of us. But what of that? We must have perseverance
and above all confidence in ourselves. We must believe that we are
gifted for something and that this thing must be attained”
“La vida no es fácil, para ninguno de nosotros. Pero... ¿y qué? Hay que
perseverar y, sobre todo, tener confianza en uno mismo. Hay que sentirse
dotado para realizar algo y que ese algo debe alcanzarse”
Marie Curie (1867-1934).

Acknowledgements ix
Sandra Manso Blanco
AGRADECIMIENTOS - ACKNOWLEDGEMENTS
Primero quiero agradecerles a mis co-directores de tesis que, a pesar de lo que aparece
en la portada de esta tesis, siempre serán cuatro para mí. Primero agradecer a Antonio Aguado
y Luís Agulló, los cuales son sin duda alguna los “culpables” de este trabajo. A Antonio tengo
mucho que agradecerle, pero sobretodo sus enseñanzas, su paciencia, su confianza y el haberme
propuesto junto con Luís este reto, el cual asumí con ilusión. Gracias por todos estos años,
Antonio. A Luis le diría también muchas cosas pero dadas las circunstancias, me quedo con su
calidad humana, con su gran vocación docente y con todas las anécdotas que guardo en mi
memoria de los años compartidos. Sigues presente Luís. A Ignacio Segura le agradezco el haber
aceptado el reto que se le propuso de involucrarse en un trabajo que llevaba ya un tiempo en
desarrollo, así como su paciencia y enseñanzas que han hecho de este tiempo un aprendizaje. I
would also like to thank Nele De Belie for her unbelievable kindness, for giving me the
opportunity to work at Ghent University and support me in that important part of the current
work. Asimismo, agradecer el apoyo económico recibido a través del proyecto de investigación
español BIA2010-17478.
Agradezco también a la prof. Mª Pau Ginebra del Departament de Ciència dels Materials
i Enginyeria Metal·lurgica y Gemma Mestres por su ayuda en los inicios del estudio referente a
los cementos de fosfato de magnesio. También me gustaría expresar mi agradecimiento al prof.
Antonio Gómez Bolea de la Facultad de Biología de la Universidad de Barcelona, quien siempre
ha estado disponible y dispuesto a ayudarme cuando lo he necesitado. Asimismo, a la prof. Mª
Àngels Calvo de la Facultad de Veterinaria de la Universidad Autónoma de Barcelona agradecerle
su tiempo, su predisposición y su amabilidad. Furthermore, I would like to thank prof. Nico Boon
for letting me work in LabMET and meeting great people there. Finally, to prof. Kathy Steppe
and the PhD student Ingvar Bauweraerts for their nice help and contribution. Aprovechar
también estas líneas para agredecerle a Marc Vandewalle su estima así como su interés por el
desarrollo de este trabajo.
Quisiera mostrar mi gratitud a las empresas y organizaciones que me han permitido
desarrollar parte de esta investigación en sus instalaciones o que han colaborado de alguna
forma en la misma. En primer lugar, agradecer a la empresa Escofet 1886 S.A. y en especial a
Marcos López y Gerard Faneca por su interés. A la empresa Cementos Portland Valderrivas, en
especial a Serafín Lizarraga, por permitirme desarrollar parte de mi campañana experimental en
las instalaciones de Olazagutía y al Departamento de I+D, en especial a Andrés, Ignacio y Josema
entre otros, por su colaboración durante ese tiempo. Finalmente agradecer al Instituto Eduardo
Torroja de ciencias de la construcción de Madrid, muy especialmente a Ana Mª Guerrero y Gloria
Pérez por su colaboración.
Estos mismos agradecimientos debo reconocérselos a Montse Santos, Mercè, Carme y
Carmeta, quienes fueron verdaderas compañeras durante mis primeros años en este
departamento. Asimismo, agradecer al personal de laboratorio, en especial a Tomás, Camilo,

x Acknowledgements
Bioreceptivity optimisation of concrete substratum to stimulate biological colonisation
Robert y Jordi Cabrerizo por todos los momentos compartidos y por haber estado siempre
disponibles para ayudarme cuando lo he necesitado.
I also thank Christel and Viviane, form the Magnel Laboratory for Concrete Research,
and Christine and Regine, from LabMET, for all their kind help with all the administrative tasks
at UGent. I would like to thank to the laboratory staff in both laboratories, especially to Tommy
and Dieter.
Me gustaría también agradecer a todos mis compañeros y amigos que han compartido
el día a día conmigo. Llevando tantos años en el Departamento, se hace difícil nombrarlos a
todos por lo que me gustaría agradecer a todos los miembros del Team 2.0 y a todos los que
formaron parte de mi vida en la UPC incluso antes del Team. Pero me gustaría destacar a algunos
de ellos, por haber sido especiales de alguna forma en las diferentes etapas que he vivido. Ellos
son: Albert, Ana, Bernat, Betty, Carlos, Catalina, Cristina, Filipe, Izelman, Martha Alejandra,
Matías, Sergio y Tina. I would also like to thank all the wonderful people I met in Ghent. First, I
would like to thank Willem for all our talks and all he teach me in the lab. Thank you for all your
time and help. I would like to thank all my colleagues in the Magnel laboratory and especially to
the people with who I shared more time: Arn, Corina, Didier, Eleni, Farid, Jianyun, João, Lijie,
Limin Lu Mathias, Raul, Tan and Tim among others. Then, all the people from LabMET, where I
spent a really nice time, and especially to my colleagues in the rotonde. However, I have to
especially thank the friends I met in Ghent: Alberto, Alessia, Antonin, Cristina, Eleni, Giovanni,
Joeri, Marta (Tona), Patricia, Pilar, Ramiro, Robin, Stephen, Yusuf. Thank you for the basketball
matches, the parties, the nice talks and every laugh together during and after my time in Ghent.
I miss you a lot guys!
Me gustaría también agradecer a todos mis amigos por la infinita paciencia por mis
ausencias, por haber estado ahí todo este tiempo, haberme apoyado y comprendido. Entre ellos
quiero destacar a Cristina, Jordi, Marina, Maru, Mau, Miriam, Patricia, Raquel, Raúl, Sandra y
Vanessa. ¡Sabéis de sobras lo que os quiero!
Por último, y reservando para el final a los que siempre están ahí, quiero agradecer a mi
familia. Muy especialmente quiero agradecerles a mis abuelos, Amparo, Antonio y Mª del
Carmen a los que ya no tengo cerca pero que siempre están en mi corazón. Y en especial a mi
iaio Francisco del que guardo tantos y tan buenos recuerdos, como el día que me dijo “¡Hay que
ver la niña…, tanto estudiar para acabar haciendo morteros!”.
Finalmente quiero agradecer todo el amor y apoyo a las personas más importantes para
mí, mis padres Rafael e Isabel, mi hermano Rafa y mi cuñada Carolina. A mis padres agradecerles
todo lo que me han dado porque soy quien soy gracias a ellos. Gracias por dejarme ser yo misma,
por dejarme tropezar, levantarme y seguir hacia adelante teniéndoos siempre al lado. Al
grandullón de mi hermano y a mi Caroline, a los que por las cosas de la vida tengo más lejos de
lo que me gustaría pero están siempre presentes. Ellos me han enseñado que por encima de
todo uno debe disfrutar con su trabajo y sentirse orgulloso de sus logros, lo demás… ¡ya vendrá!
Summary xi
Sandra Manso Blanco
SUMMARY
The lack of green areas into cities is caused by the increase in population and the
urbanisation process. However, an increasing interest in city greenery was observed since the
beginning of twentieth century. Several benefits are associated to green areas from a social,
economic and ecologic point of view. Consequently, the solution to increase the urban green
spaces lies in their inclusion on structures surfaces. In that sense, a great number of different
technologies were developed grouped into green walls and green roofs. Unfortunately, existent
systems for both green walls and green roofs present several disadvantages in terms of
installation and maintenance costs, low integration with the structure, extra loads, limitations
in their use in rehabilitation, and others.
The general objective of this dissertation is to provide a first approach to the possibility
of using a structure surface as biological substratum. This was treated considering two different
subjects or research lines. The first research line is the modification of the chemical and physical
properties of the cementitious material, which will be used as substratum. Then, the second
issue is the evaluation of materials’ bioreceptivity under both laboratory and environmental
conditions.
Regarding the material, chemical properties were firstly studied. pH was taken as a
priority from the diversity of involved chemical properties. In that sense, two different ways to
obtain a low pH cementitious material were studied. First, the reduction of the pH of the most
common hydraulic binder, Ordinary Portland Cement (OPC), was attempted. Then, the
characterisation of Magnesium Phosphate Cement (MPC) as a hydraulic binder of naturally low
pH was carried out. Insufficient reductions in pH of OPC were obtained and properties such as
flexural and compressive strengths were highly affected. In contrast, positive results were
obtained regarding the use of MPC as hydraulic binder for the specific purpose to be used as a
biological substratum.
Regarding the physical properties, porosity and roughness were main properties
considered. For that purpose, modifications of the dosage of different samples were carried out
by means of modifying the hydraulic binder, granular skeleton, the water to cement ratios and
the amount of cement paste. The methodology used for the estimation of the cement paste
content worked well for OPC specimens although MPC responded differently. The
characterisation of the twenty-three initial materials’ bioreceptivities provided significant
results. Consequently, six different mix designs were selected to be exposed to colonisation.
Afterwards, the evaluation of the materials’ bioreceptivity in terms of colonisation was
studied under both laboratory and environmental conditions. Regarding the experimental
program under laboratory conditions, an accelerated laboratory test was carried out to evaluate
the behaviour of different specimens when they were exposed to colonisation. Magnesium
Phosphate Cement specimens obtained better results than OPC mortars for algal colonisation
under those particular conditions.
xii Summary
Bioreceptivity optimisation of concrete substratum to stimulate biological colonisation
Finally, specimens were also evaluated under environmental conditions since conditions
significantly differ from what happens under laboratory conditions. Furthermore, two different
inclinations and three different locations were studied. Significant differences were observed
between inclinations (horizontal and vertical) and between locations with different
contamination levels (Barcelona city, Natural Park of Montseny and Ghent city). Horizontal
specimens obtained better results in terms of predominant genus diversity as well as
quantification. Moreover, specimens located in urban areas (Barcelona city) obtained also better
results. However, results showed that further research should be considered for environmental
experimental programs.
Resumen xiii
Sandra Manso Blanco
RESUMEN
La ausencia de espacios verdes en las ciudades es consecuencia del constante
incremento poblacional y el proceso de urbanización. Sin embargo, existe un interés social
creciente en aumentarlos desde inicios del siglo XX. Los beneficios asociados pueden englobarse
en tres niveles: social, económico y ecológico. Por ello, la incorporación de elementos vegetales
en los edificios se ha visto, principalmente, como una alternativa en aquellas ciudades con
escasez de espacios disponibles para la construcción de áreas verdes. En este sentido, diversos
sistemas han sido desarrollados tanto a nivel de fachadas como de cubiertas vegetales.
Desafortunadamente, los sistemas existentes presentan diversos inconvenientes, los cuales se
refieren a los costes de instalación y mantenimiento, a la baja integración entre los elementos
naturales y la estructura, la carga adicional que conlleva y, en algunos casos, la limitación en su
uso, entre otros.
El objetivo general de la presente tesis es demostrar que es posible utilizar el propio
material cementicio como soporte biológico, para lo cual se han considerado dos líneas
principales: modificar de forma controlada el material cementicio en base a sus propiedades
químicas y físicas y, evaluar la bioreceptividad del soporte en muestras colonizadas.
En lo referente al material, primero se abordaron las propiedades químicas, fijándose
como prioritario reducir el pH, para lo cual se abordaron dos vías: incorporación de ácidos en
morteros en base a cemento Portland y, empleo de cementos en base a fosfato de magnesio.
Las reducciones de pH alcanzadas para el cemento Portland no fueron significativas y sí, en
cambio, la afectación a nivel de resistencias fue elevada. Por contra, los resultados obtenidos
para el cemento en base a fosfato de magnesio fueron positivos, sin efectos secundarios.
Respecto a las propiedades físicas, se han considerado la porosidad y la rugosidad. Para
la modificación controlada de estas propiedades se realizaron cambios entre dosificaciones en
cuanto al tipo de cemento, al esqueleto granular, a la relación agua-cemento y a la cantidad de
pasta de cemento. La metodología usada para la estimación de la cantidad de pasta de cemento
funcionó correctamente para el mortero de cemento Portland. Sin embargo, el mortero en base
a cemento de fosfato de magnesio presentó particularidades que hicieron cambiar los criterios
de selección. Veintitrés tipos de mortero de diferente bioreceptividad fueron caracterizados y
los resultados obtenidos permitieron reducir dicho número a seis, los cuales fueron expuestos a
colonización.
En el proceso de evaluación del crecimiento biológico, las muestras fueron expuestas
tanto a condiciones controladas de laboratorio, mediante un ensayo acelerado, como a
condiciones ambientales, habiéndose obtenido los mejores resultados para las muestras en
base al cemento de fosfato de magnesio.
Finalmente, las muestras fueron expuestas a colonización ambiental, ya que los
resultados podrían diferir considerablemente. Además de evaluarse los diferentes grados de

xiv Resumen
Bioreceptivity optimisation of concrete substratum to stimulate biological colonisation
bioreceptividad de las muestras entre sí, también se evaluó la influencia de la inclinación
(horizontal y vertical) así como de la localización comparando tres emplazamientos (Barcelona
ciudad, parque natural del Montseny y Gante ciudad). Diferencias significativas fueron
observadas entre muestras con diferente inclinación así como entre las localizaciones con
diferente grado de contaminación ambiental. Las muestras horizontales presentaron mejores
resultados a nivel de diversidad y cuantificación. Y, además, las muestras colocadas en zonas
urbanas obtuvieron mejores resultados que aquellas en emplazadas en una zona no
contaminada. Sin embargo, los resultados muestran la necesidad de más investigación en
condiciones ambientales así como por periodos más prolongados.
Samenvatting xv
Sandra Manso Blanco
SAMENVATTING
Door de constante groei van de wereldbevolking en de toenemende urbanisatie, is een
gebrek ontstaan aan groene ruimten in steden. Sinds het begin van de twintigste eeuw is er wel
een toenemende interesse in de aanleg van stedelijk groen. Het incorporeren van groen in de
stad brengt vele positieve effecten met zich mee, zowel vanuit socio-economisch als vanuit
milieuperspectief. In vele Europese steden doen zich milieuproblemen voor, bijvoorbeeld op
vlak van luchtkwaliteit, waterverbruik en energieverbruik. Daarom zijn inspanningen
noodzakelijk om meer duurzame steden te bekomen, die alle sociale, ecologische en
economische noden kunnen vervullen.
Initieel was de belangrijkste reden om levende organismen, voornamelijk planten, te
introduceren in steden, de esthetische waarde. Nochtans hebben verschillende auteurs intussen
de vele bijkomende voordelen geduid, zoals op vlak van menselijke gezondheid, reductie van
CO2-concentraties, zuurstofproductie, zuivering van lucht en water, geluidsreductie, en
economische voordelen voor zowel de stad als de stedelingen. De stedelijke natuur vormt een
sleutelelement voor de leefbaarheid en duurzaamheid van de stad.
Het concept van het “vergroenen” van de stad bracht ook het concept van het
vergroenen van gebouwen met zich mee, vooral in steden waar de beschikbare ruimte voor
aanleg van groene ruimten schaars is. Dit houdt in dat men meer groen in de stad bekomt door
dit toe te voegen aan een gebouwoppervlak. Verschillende technieken werden ontwikkeld om
vegetatie aan te brengen op de gebouwschil, zoals groene wanden en groene daken. Een groen
dak, ook wel levend dak genoemd, is een conventioneel dak bedekt met vegetatie. Een groene
wand bestaat uit een façade van een gebouw met vegetatie die direct op het oppervlak groeit,
of op een afzonderlijke structurele eenheid die vrijstaand nabij de muur of bevestigd aan de
muur kan zijn.
Helaas zijn er verschillende nadelen verbonden aan zowel groene muren als groene
daken, op vlak van installatie- en onderhoudskosten, een laag niveau van integratie met de
structuur, bijkomende belasting, beperkingen voor de aanwending bij renovatieprojecten,
enzovoort. Enkel de installatiekosten van groene daken variëren reeds van 70 tot 220 €/m² en
voor groene wanden van 30 tot 1200 €/m².
Anderzijds wordt ook soms een ongewenste biologische kolonisatie vastgesteld op
constructies vervaardigd met cementgebonden materialen, zoals monumenten, historische
gebouwen, of gewoon oudere gebouwen. Deze kolonisatie is het gevolg van drie
geconnecteerde factoren, namelijk de aanwezigheid van pioniersorganismen in de omgeving,
de omgevingsomstandigheden en de eigenschappen van het materiaal. De term bioreceptiviteit
verwijst naar de laatste factor, namelijk de ontvankelijkheid van het materiaal voor kolonisatie
door levende organismen. De studie van biodeterioratie vormt een belangrijk gevestigd
onderzoeksdomein, waarin men tracht om de negatieve effecten van biologische groei op
bouwmaterialen te definiëren en mechanismen om de biologische vervuiling tegen te gaan te

xvi Samenvatting
Bioreceptivity optimisation of concrete substratum to stimulate biological colonisation
formuleren. De grens tussen biodeterioratie en bioprotectie is soms vaag, en deze kan
bovendien verschuiven door wijzigingen in omgevingsomstandigheden, substraat en
koloniserende organismen.
In dit doctoraat wordt getracht een antwoord te formuleren op sommige van de
aangehaalde problemen. Het objectief van dit onderzoek was om een eerste mogelijkheid aan
te brengen om een gebouwoppervlak te gebruiken als biologisch substraat. Hiertoe werden
twee verschillende onderzoeksfasen gedefinieerd. Vooreerst werd getracht de chemische en
fysische eigenschappen van het steenachtig materiaal, dat gebruikt zal worden als substraat, te
modificeren. Vervolgens werd de bioreceptiviteit van het ontwikkelde materiaal geëvalueerd
zowel via een versnelde proef in het laboratorium als door blootstelling aan een
buitenomgeving. Het uitgevoerde werk combineert hierbij theoretische en experimentele
componenten.
In de eerste fase van het onderzoek werden in twee stappen de chemische en nadien
de fysische eigenschappen van het materiaal aangepast. Ondanks de talloze parameters die
kunnen gewijzigd worden bij het ontwerp van een cementgebonden materiaal als biologisch
substraat, werd prioritair de pH gewijzigd. Hierbij werden twee strategieën gevolgd. Enerzijds
werd getracht om de pH van het meest gebruikte hydraulische bindmiddel, Portlandcement, te
reduceren. Anderzijds werd een ander hydraulisch bindmiddel met een natuurlijke lage pH,
magnesiumfosfaatcement, gekarakteriseerd.
Om een pH-reductie bij beton met Portlandcement te bekomen, werden zuren
toegevoegd aan het mengsel. De pH van de verse en verharde mengsels, de gewichtsvariaties,
de buigtrek- en druksterkte, de transmissiesnelheid van ultrasoongolven, en de chemische en
mineralogische samenstelling met behulp van FTIR en XRD werden bepaald. Er werd echter een
te beperkte reductie van de pH bekomen en eigenschappen zoals buigtrek- en druksterkte
werden sterk beïnvloed. Wat betreft de aanwending van magnesiumfosfaatcement als
bindmiddel voor biologische substraten, werden echter wel beloftevolle resultaten bekomen.
Wat betreft de modificatie van de fysische eigenschappen, werden porositeit en
ruwheid als de belangrijkste parameters aanzien. De samenstelling van het beton werd
aangepast om proefstukken te produceren met verschillende niveaus van porositeit en ruwheid.
De microporositeit werd gewijzigd door verschillende water/cementverhoudingen toe te passen
en de macroporositeit werd gevarieerd door in te spelen op de granulaatgrootte en het
cementpastavolume. Naast de bepaling van de bekomen porositeit en ruwheid – als maatstaf
voor de bioreceptiviteit – werden ook buigtrek- en druksterkte bepaald, en werden calorimetrie
en thermogravimetrische analyse toegepast om de materialen verder te karakteriseren.
De methodologie die werd aangewend voor de inschatting van de optimale hoeveelheid
cementpasta, functioneerde goed voor Portlandcement proefstukken, maar de monsters met
magnesiumfosfaatcement reageerden anders. Voor het verdere onderzoek werd het aantal
Samenvatting xvii
Sandra Manso Blanco
samenstellingen gereduceerd van 23 naar 6, om enkel proefstukken met significant
verschillende eigenschappen bloot te stellen aan biologische kolonisatie.
Vervolgens werd de bioreceptiviteit van de ontwikkelde materialen bestudeerd, zowel
in het laboratorium als in buitenomgeving. In het laboratorium werd een versnelde proef
uitgevoerd, waarbij de omstandigheden voor kolonisatie door algen optimaal waren. Het is
gekend dat levende organismen in een dergelijke versnelde proef niet op dezelfde wijze
reageren als in hun natuurlijke omgeving, vooral door het verschil in klimatologische condities
en door de competitie tussen soorten. Deze test had echter als doel om het gedrag van
proefstukken met verschillende eigenschappen onder gecontroleerde omstandigheden te
vergelijken. Bovendien konden zo resultaten bekomen worden in een relatief korte tijdspanne.
De proefstukken met zes verschillende niveaus van bioreceptiviteit, werden beoordeeld
via colorimetrische analyse, beeldverwerking en biomassa kwantificatie. De eerste twee
technieken verstrekten informatie over de intensiteit van de biofouling, de bedekte oppervlakte
en andere parameters zoals de helderheid en kleur van het (gekoloniseerde) materiaal. De
biomassametingen werden uitgevoerd met behulp van een niet-destructieve test waarbij
gebruik gemaakt werd van PAM fluorometrie. Bij deze laboratoriumproef bleek dat
proefstukken gemaakt met magnesiumfosfaatcement duidelijk sneller gekoloniseerd werden
door algen dan proefstukken met Portlandcement.
Tenslotte werden de proefstukken ook geëvalueerd in buitenomgeving, waarbij de
omstandigheden significant kunnen verschillen van de condities bij het
laboratoriumexperiment. Hierbij verschillen niet enkel de proefstukken onderling, maar ook de
omgevingsomstandigheden en aspecten die betrekking hebben op de levende organismen.
Twee verschillende opstellingen van de proefstukken (horizontale en verticale positie) en drie
verschillende locaties werden onderzocht (het stadscentrum van Barcelona, het natuurgebied
van Montseny nabij Barcelona en de stadsrand van Gent). Voor de verschillende proefstukken
en locaties werd het predominante genus van de koloniserende micro-organismen vastgesteld
en de aanwezige micro-organismen werden gekwantificeerd in termen van aantal
kolonievormende eenheden. Dit werd in verband gebracht met data betreffende
weersomstandigheden en luchtkwaliteit voor de verschillende locaties. Er werden significante
verschillen in kolonisatie vastgesteld tussen proefstukken met horizontale en verticale opstelling
en tussen proefstukken op de drie locaties die gekenmerkt worden door een duidelijk
verschillende contaminatie. Hierbij waren het de horizontaal opgestelde proefstukken die een
grotere diversiteit aan dominante genera vertoonden en ook kwantitatief gezien een sterkere
kolonisatie. Verder vertoonden de proefstukken opgesteld in stedelijk gebied (centrum van
Barcelona) duidelijk betere resultaten qua kolonisatie. Het werd echter ook duidelijk dat het
testprogramma in buitenomgeving langer zal moeten opgevolgd worden om tot sluitende
conclusies te komen.

xviii Samenvatting
Bioreceptivity optimisation of concrete substratum to stimulate biological colonisation
Index xix
Sandra Manso Blanco
INDEX
1. INTRODUCTION ................................................................................................................. 1
1.1. Scope of the research ................................................................................................ 1
1.2. Motivations ............................................................................................................... 3
1.3. General objective ...................................................................................................... 4
1.4. Specific objectives ..................................................................................................... 4
1.5. Methodology ............................................................................................................. 5
2. STATE OF THE ART ............................................................................................................. 9
2.1. Introduction .............................................................................................................. 9
2.2. Environmental situation of the major european cities .............................................. 11
2.3. Positive interactions between living organisms and structures................................. 14
2.4. Negative interactions between living organisms and structures ............................... 19
2.5. Concluding remarks ................................................................................................. 23
3. DEVELOPMENT OF A LOW-PH CEMENTITIOUS MATERIAL ................................................ 25
3.1. Introduction ............................................................................................................ 25
3.2. Materials and methods ............................................................................................ 26
3.2.1. Materials and hydration reactions .................................................................... 27
3.2.2. Dosages and methods ...................................................................................... 29
3.3. Results and analysis related to acid additions in opc ................................................ 31
3.3.3. pH .................................................................................................................... 32
3.3.4. Weight evolution and ultrasonic pulse velocity ................................................ 33
3.3.5. Compressive strength ...................................................................................... 35
3.3.6. pH of hardened specimens ............................................................................... 35
3.3.7. XRD and FTIR ................................................................................................... 36
3.4. Results and analysis related to characterization of different mpc formulations ........ 38
3.4.1. pH and real density .......................................................................................... 38
3.4.2. Normal consistency, setting times and volume stability.................................... 39
3.4.3. Consistency of fresh mortar and hydration heat ............................................... 40
3.4.4. Compressive strength and drying shrinkage ..................................................... 41
3.4.5. Scanning electron microscopy and chemical analysis........................................ 43
3.4.6. XRD .................................................................................................................. 44
3.5. Conclusions ............................................................................................................. 46
xx Index
Bioreceptivity optimisation of concrete substratum to stimulate biological colonisation
4. BIORECEPTIVITY MODIFICATIONS OF CEMENTITIOUS MATERIALS ................................... 49
4.1. Introduction ............................................................................................................ 49
4.2. Materials and methods ............................................................................................ 50
4.2.1. Methodology for bioreceptivity modification ................................................... 50
4.2.2. Materials and dosages ..................................................................................... 53
4.2.3. Specimens production and tests methodology ................................................. 55
4.3. Results and analysis ................................................................................................. 60
4.3.1. Heat of hydration ............................................................................................. 60
4.3.2. Flexural and compressive strength ................................................................... 62
4.3.3. Porosity ........................................................................................................... 64
4.3.4. Roughness ....................................................................................................... 69
4.3.5. DTA-TG ............................................................................................................ 71
4.4. Conclusions ............................................................................................................. 74
5. BIORECEPTIVITY EVALUATION UNDER LABORATORY CONDITIONS .................................. 77
5.1. Introduction ............................................................................................................ 77
5.2. Materials and methods ............................................................................................ 78
5.2.1. Mortar specimens ............................................................................................ 78
5.2.2. Accelerated algae fouling test .......................................................................... 79
5.2.3. Evaluation and quantification of biofouling ...................................................... 80
5.3. Results and analysis ................................................................................................. 86
5.3.1. Colorimetric measurements and analysis ......................................................... 86
5.3.2. Biomass quantification ..................................................................................... 92
5.4. Conclusions ............................................................................................................. 95
6. ANALYSIS OF NATURAL COLONISATION ........................................................................... 99
6.1. Introduction ............................................................................................................ 99
6.2. Materials and methods .......................................................................................... 100
6.2.1. Locations ....................................................................................................... 100
6.2.2. Specimens and setup ..................................................................................... 101
6.2.3. Samples collection and analysis...................................................................... 103
6.3. Results and analysis ............................................................................................... 106
6.3.1. Barcelona city ................................................................................................ 107
6.3.2. Natural Park of Montseny .............................................................................. 115
6.3.3. Ghent city ...................................................................................................... 119
6.3.4. Comparison between locations ...................................................................... 122
Index xxi
Sandra Manso Blanco
6.4. Conclusions ........................................................................................................... 123
7. CONCLUSIONS AND FUTURE PERSPECTIVES................................................................... 125
7.1. Introduction .......................................................................................................... 125
7.2. General conclusions ............................................................................................... 126
7.3. Specific conclusions ............................................................................................... 127
7.3.1. Cementitious material.................................................................................... 127
7.3.2. Biological growth ........................................................................................... 128
7.4. Future perspectives ............................................................................................... 129
REFERENCES ......................................................................................................................... 131
PUBLICATIONS…..………………………………………………………………………………………………………………… 145

xxii Index
Bioreceptivity optimisation of concrete substratum to stimulate biological colonisation
Index of tables xxiii
Sandra Manso Blanco
INDEX OF TABLES
Table 1.1.- Specific objectives.................................................................................................... 5
Table 2.1.- Data for some indicators affecting the Green Cities Index corresponding to 2009 .. 13
Table 2.2.- Main characteristics of extensive and intensive roofs ............................................ 15
Table 2.3.- Materials properties studied by several authors .................................................... 22
Table 3.1.- Composition of mortar specimens ......................................................................... 29
Table 3.2.- Ultrasonic pulse velocity (m/s) ............................................................................... 34
Table 3.3.- Compressive strength until 28 days (MPa) ............................................................. 35
Table 3.4.- Results of normal consistency, setting times and volume stability .......................... 40
Table 3.5.- Chemical composition of MPC samples and OPC (CEM I 52.5R) .............................. 44
Table 4.1.- List of authors who studied porosity and roughness related to bioreceptivity ........ 50
Table 4.2.- Dosage for OPC specimens production .................................................................. 54
Table 4.3.- Dosage for MPC specimens production .................................................................. 55
Table 4.4.- Weight of specimens under different conditions .................................................... 65
Table 4.5.- Ra and Rq values obtained. ..................................................................................... 71
Table 4.6.- DTA-TG quantification for OPC samples ................................................................. 73
Table 4.7.- DTA-TG quantification for MPC samples ................................................................ 74
Table 5.1.- Compositions and main characteristics of the specimens ....................................... 78
Table 5.2.- Colorimetric measurements. .................................................................................. 90
Table 5.3.- Fv/Fm values obtained between cycles 1 and 5 ....................................................... 94
Table 5.4.- Fv/Fm values obtained between cycle 1 and 5 under hydric stress. ......................... 95
Table 6.1.- Formula of the culture media in 1 L of distilled water. ......................................... 105
Table 6.2.- Main characteristics of the identified genus of bacteria ....................................... 108
Table 6.3.- Identification and counting of bacterial and fungal genera on horizontal specimens
placed in Barcelona city ....................................................................................... 110
Table 6.4.- Identification and counting of bacterial and fungal genera on vertical specimens
placed in Barcelona city ....................................................................................... 112
Table 6.5.- Identification and counting of bacterial and fungal genera on horizontal specimens
placed in Montseny (Unc.: uncountables) ............................................................ 116
Table 6.6.- Identification and counting of bacterial and fungal genera on vertical pecimens placed
in Montseny ........................................................................................................ 117
Table 6.7.- Identification and counting of bacterial and fungal genera on horizontal specimens
placed in Ghent city (NQ.: non-quantified) ........................................................... 120

xxiv Index of tables
Bioreceptivity optimisation of concrete substratum to stimulate biological colonisation
Table 6.8.- Bacterial and fungal genera on vertical specimens placed in Ghent city and plate
counting (NQ: non-quantified) ............................................................................. 121
Index of figures xxv
Sandra Manso Blanco
INDEX OF FIGURES
Figure 1.1.- Urban and rural populations in the world for the period comprised between 1950
and 2050 (adapted from United Nations, 2009) ....................................................... 2
Figure 1.2.- Urban green spaces in Europe. (Fuller and Gaston, 2009). ...................................... 2
Figure 1.3.- Evolution of urban green areas in Europe ............................................................... 3
Figure 1.4.- Urban green spaces per capita of European cities in 2006....................................... 4
Figure 1.5.- Outline of the thesis. .............................................................................................. 6
Figure 2.1.- The indicator set used in the Urban Ecosystem Europe report 2007...................... 11
Figure 2.2.- Indexes considered for the European Green City Index ......................................... 12
Figure 2.3.- Examples of different green roofs in a) Italy b) Austria and c) Singapore. .............. 14
Figure 2.4.- Green walls rooted into the ground: a) Fishers Place at Metro Centro and b) Offices
building ................................................................................................................. 17
Figure 2.5.- Examples of green walls systems not rooted into the ground: a) Climbers rooted into
containers; b) modular system and c) hydroponic system. ..................................... 17
Figure 2.6.- Green concrete proposed by Ottelé et al. (2010). ................................................. 19
Figure 2.7.- Causes of the colonisation of stone materials. ...................................................... 20
Figure 2.8.- Examples of colonised building materials: a) statue in Portugal, b) portico of a in
Argentina and c) detail of a church in Belfast. ........................................................ 21
Figure 3.1.- Scheme of the experimental program. .................................................................. 26
Figure 3.2.- General (a) and detailed (b) view of the heat of hydration test. ............................ 31
Figure 3.3.- Diagram of the chemical tests carried out. ............................................................ 31
Figure 3.4.- pH determination for specimens with boric and oxalic acid. ................................. 32
Figure 3.5.- Loss of weight for specimens with addition of (a) boric acid and (b) oxalic acid. .... 34
Figure 3.6.- Evolution of pH until 28 days for specimens with (a) boric acid & (b) oxalic acid. .. 36
Figure 3.7.- RXD for control specimens (OPC), with addition of boric acid (OPC + BA) and oxalic
acid (OPC + OA). .................................................................................................... 36
Figure 3.8.- RXD for specimens with addition of oxalic acid at 1, 7 and 28 days. ...................... 37
Figure 3.9.- FTIR for specimens control (OPC), with addition of oxalic acid (OPC + OA), with
addition of boric acid (OPC + BA) and anhydrous cement. ...................................... 38
Figure 3.10.- Evolution on time of pH for specimens (a) without borax and (b) with addition of
6 % in borax. .......................................................................................................... 39
Figure 3.11.- Segregation in standardize mortar production. ................................................... 40
Figure 3.12.- Evolution of heat hydration for reference specimen and MPC with lower and higher
P:M ratios. ............................................................................................................. 41
xxvi Index of figures
Bioreceptivity optimisation of concrete substratum to stimulate biological colonisation
Figure 3.13.- Compressive strength for MPC specimens and reference OPC values.................. 42
Figure 3.14.- Expansion of specimens after (a) air curing and (b) water curing. ........................ 42
Figure 3.15.- SEM images of specimens with a (a) P:M ratio of 1:1, (b) P:M ratio of 1:1.25, (c) P:M
ratio of 1:1.75 and (d) P:M ratio of 1:2 at one day. ................................................. 43
Figure 3.16.- XRD of different MPC formulations at 7 days. ..................................................... 45
Figure 4.1.- Flow chart of the dosage methodology. ................................................................ 51
Figure 4.2.- Granulometry of the silica aggregates used (0/2 mm and 2/4 mm). ...................... 53
Figure 4.3.- Apparatus used to compact. ................................................................................. 56
Figure 4.4.- Image of the high precision laser beam (a) and graphical explanation of roughness
parameters (Ra and Rq values) (b). .......................................................................... 59
Figure 4.5.- Heat of hydration under semi-adiabatic condition for MPC mortar ....................... 60
Figure 4.6.- Influence of cement paste content on heat of hydration....................................... 61
Figure 4.7.- Influence of w/c ratio on heat of hydration........................................................... 61
Figure 4.8.- Influence of the cement paste content on compressive (a) and flexural (b) strength
of OPC specimens at 80 days. ................................................................................ 62
Figure 4.9.- Influence of the cement paste content on compressive (a) and flexural (b) strength
of MPC specimens at 180 days. .............................................................................. 64
Figure 4.10.- Influence of cement paste content in percentage of voids for MPC and OPC
specimens estimated according to the standard ASTM C642-13............................. 65
Figure 4.11.- Influence of cement paste content in percentage of voids for MPC and OPC
specimens estimated according to Archimedes’ principle. ..................................... 66
Figure 4.12.- Porosity (a) and percentage-based distribution of pore diameter (b) obtained from
mercury intrusion porosimetry analysis. ................................................................ 67
Figure 4.13.- Influence of dosage on critical diameter. ............................................................ 68
Figure 4.14.- Images obtained by means of a binocular loupe. ................................................ 69
Figure 4.15.- Appearance of specimens surface of (a) PA30-1C, (b) Pa40-1C, (c) Pa60-1.75C, (d)
MA15-0.5C, (e) Ma20-0.75C and (f) Ma28-1C. ........................................................ 69
Figure 4.16.- An example of a roughness profile of dosages (a) PA30-1C, (b) Pa40-1C, (c) Pa60-
1.75C, (d) MA15-0.5C, (e) Ma20-0.75C and (f) Ma28-1C. ........................................ 70
Figure 4.17.- DTA curves for the calibration of the aggregates 0/2 mm (a) and 2/4 mm (b). .... 71
Figure 4.18.- Correlation between the area under the curve and the amount of silica aggregate
per granulometry................................................................................................... 72
Figure 4.19.- DTA-TG curves corresponding to PA30-1C, Pa40-1C and Pa60-1.75C samples. .... 72
Figure 4.20.- DTA-TG curves of MA15-0.5C, Ma20-0.75C and Ma28-1C samples ...................... 74
Figure 5.1.- 80 x 80 x 20 mm³ polyurethane moulds. ............................................................... 79

Index of figures xxvii
Sandra Manso Blanco
Figure 5.2.- Batch culture and its components (a) and cells count by means of the light
microscope (b). ...................................................................................................... 80
Figure 5.3.- Accelerated algal fouling test setup. ..................................................................... 80
Figure 5.4.- Representation of the CIELab system theory (adapted from Pitts et al., 1998) (a) and
image of the colorimeter used (b). ......................................................................... 81
Figure 5.5.- Characteristic absorbance spectrum for photosynthetic pigments. ....................... 82
Figure 5.6.- Influence of the humidity on the reflectance spectra of clean (a) PA30-1C, (b) Pa40-
1C, (c) Pa60-1.75C, (d) MA15-0.5C, (e) Ma20-0.75C and (f) Ma28-1C specimens. ... 82
Figure 5.7.- Better correlation between photograph (a) and threshold analysis on the a*
coordinate (b) tan between the first one and the threshold analysis in the b*
coordinates (c). ...................................................................................................... 83
Figure 5.8.- Scheme of possible energy fates (a) and a chlorophyll fluorescence measurement
by the saturation pulse method in dark conditions (b). .......................................... 84
Figure 5.9.- Chlorophyll a determination for calibration of the method (determined in dark
conditions). ........................................................................................................... 85
Figure 5.10.- Setup to standardize angle and distance between the simple and the sensor. .... 86
Figure 5.11.- Change in reflectance for different specimens in function of the number of weeks
subjected to accelerated fouling WBT: wet before test, a) MA15-0.5C, b) Ma20-0.75C,
c) Ma28-1C, d) PA30-1C, e) Pa40-1C and Pa60-1.75C. ............................................ 86
Figure 5.12.- Evolution of the visual appearance of MPC specimens subjected to accelerated
fouling and difference in initial colour between MPC and OPC specimens. ............. 87
Figure 5.13.- Difference in the drop of reflectance between MPC and OPC specimens in function
of the number of weeks subjected to accelerated fouling WBT: wet before test, a)
Ma20-B, b) Ma28-C, c) MA15-C, d) Pa40-C, e) Pa60-F and PA30-C. ......................... 88
Figure 5.14.- Heterogeneity of reflectance curves for different points (indicated as 1, 2, 3 and 4)
and replicates after 2 weeks of accelerated algal fouling........................................ 89
Figure 5.15.- Evolution of fouling intensity (FI). Range of standard errors per dosage during the
test: Pa40-1C: 0.19-1.67 %; Pa60-1.75C: 0.01-0.26 %; PA30-1C: 0.01-0.38 %; Ma20-
0.75C: 0.06-0.25 %; Ma28-1C: 0.14-0.35 % and MA15-0.5C: 0.15-0.47. .................. 91
Figure 5.16.- Differences in reflectance curves of MPC (a) and OPC (b) prior to and after 10 weeks
of accelerated fouling. ........................................................................................... 91
Figure 5.17.- Evolution of the area of biofouling. Range of standard errors per dosage during the
test: Pa40-1C: 0.01-11.16 %; Pa60-1.75C: 0.01-1.02 %; PA30-1C: 0.03-5.16 %; Ma20-
0.75C: 0.04-7.84 %; Ma28-1C: 0.05-13.67 % and MA15-0.5C: 0.33-10.56 %. ........... 92
Figure 5.18.- Standard curve for biomass quantification by means of a correlation between dry
weight and F0. ....................................................................................................... 93
Figure 5.19.- MPC specimens exhibited a higher amount (a) and a faster rate (b) of biomass
accumulation during the fouling tests compared to OPC specimens. ...................... 93

xxviii Index of figures
Bioreceptivity optimisation of concrete substratum to stimulate biological colonisation
Figure 5.20.- F0 response to hydric stress. ............................................................................... 95
Figure 6.1.- Location of the specimens under environmental exposure. ................................ 100
Figure 6.2.- Specimens randomly embedded in the expanded polystyrene plates. ................ 101
Figure 6.3.- Setup of specimens placed in Montseny. ............................................................ 102
Figure 6.4.- Setup of specimens placed in Barcelona city. ...................................................... 102
Figure 6.5.- Setup of specimens placed in Ghent city. ............................................................ 102
Figure 6.6.- Visual appearance of one specimen of each dosage in the city of Barcelona at the
beginning and the end of the test. ....................................................................... 106
Figure 6.7.- Taxonomy of the identified genera of specimens of Barcelona city. Genera written
in blue were found only on specimens’ surface. ................................................... 109
Figure 6.8.- Detail of Pa40-1C specimen with bacteria (b), which may belong to genus Aerococcus
(a) and Bacillus (c). ............................................................................................... 112
Figure 6.9.- Fungal hyphae (white arrow) on (a) Pa40-1C and on (b, c) Ma20-0.75C. ............. 113
Figure 6.10.- Monthly climate data for Barcelona city from January to October 2013
corresponding to (a) temperature, precipitation, (b) sunshine duration and
predominant wind. .............................................................................................. 113
Figure 6.11.- Air quality at Barcelona city in terms of amounts of (a) sulphur dioxide (SO2),
nitrogen oxides (NO, NO2, NOx), (b) monoxigen carbon (CO) and ozone (O3). ..... 114
Figure 6.12.- Surface particles (white arrows) on Ma20-0.75C specimen due to air pollution of
Barcelona city. ..................................................................................................... 114
Figure 6.13.- Collapsed pollen grains found on Pa40-1C specimens. ...................................... 118
Figure 6.14.- Monthly climate data for Montseny from January to October 2013 corresponding
to (a) temperature, precipitation, (b) sunshine duration and predominant wind. . 118
Figure 6.15.- Air quality in Montseny in terms of amounts of SO2, NOx, CO and O3. ............. 119
Figure 6.16.- Data of (a) monthly mean temperatures and precipitation as well as (b) sunshine
duration and predominant wind direction in Ghent. ............................................ 122
Simbols xxix
Sandra Manso Blanco
SIMBOLS
a* Green-red light component
AAgg Aggregate area (m²)
Agg% Percentage of aggregate retained in a mesh (%)
Aggmax% Percentage of aggregate retained in a mesh of the bigger
diameter considered (%)
b* Blue-yellow light component
B4O72- Borate
B(OH)-4 Tetrahydroxiborate
C Estimated amount of cement paste considered as the reference
value
Ca[B(OH)4]2 Calcium diborate
CaC2O4·H2O Calcium oxalate
CaCO3 Calcium carbonate
CaO Calcium oxide
Ca(OH)2 Calcium hydroxide (portlandite)
CO Carbon monoxide
CO2 Carbon dioxide
(COOH)2·2H2O Oxalic acid
C2O42- Oxalate
C2S Dicalcium silicate (belite)
C3S Tricalcium silicate (alite)
D Pore diameter (m)
DF Weight of a dried filter (mg)
DFA Weight of a dried filter with the filtrated algae after being dried
at 105° C until constant mass (mg)
DW Dry weight (mg/L or mg/cm²)
Fm Maximum fluorescence intensity
F0 Minimum fluorescence intensity
Fv Difference between the maximum and the minimum
fluorescence intensity
xxx Simbols
Bioreceptivity optimisation of concrete substratum to stimulate biological colonisation
Fv/Fm Maximum quantum efficiency of photosystem II (PS II)
FI Fouling intensity
G Gain
g Gravity (m/s²)
h Heigh (m)
HC2O4- Hydrogen oxalate ion
H2C2O4 Oxalic acid
H2O Water
H3O+ Hydronium ion
H3BO3 Boric acid
H2PO4 Dihydrogen phosphate ion
HPO4 Hydrogen phosphate ion
L* Lightness factor
Log DI Differential intrusion logarithm
mAgg Aggregate mass (kg)
Mg3(PO4)2·4H2O Bobierrite
MgHPO4·3H2O Newberyite
Mn Value of the mesh n (correspond to the maximum particle size not
retained in the mesh)
MSiO2 Amount of SiO2 (mole)
ML Measuring light intensity
N Nomber of the piston stroke
NH4+ Ammonium ion
NH4H2PO4 Ammonium Dihydrogen Phosphate
NH4MgPO4·H2O Dittmarite
NH4MgPO4·6H2O Struvite
(NH4)2Mg(HPO4)2·4H2O Schertelite
(NH4)2Mg3(HPO4)4·8H2O Hannayite
Na2B4O7·10H2O Borax
NO Nitrogen monoxide
NO2 Nitrogen dioxide
Simbols xxxi
Sandra Manso Blanco
NOx Nitrogen oxides
O2 Oxigen
O3 Ozone
P Preassure (Pa)
PM10 Particulate matter of diameters ranged from 2.5 to 10 µm
PO42- Phosphate ion
ra Average radius (mm)
R Reflectance
Ra Centre-line roughness (mm)
Rq Root mean square roughness (mm)
R2O3 The sum of aluminium oxide (Al2O3) and iron oxide (Fe2O3)
SAAgg Surface area of the aggregates (m²)
SiO2 Silicon dioxide
SO2 Sulfur dioxide
SO3 Sulfur trioxide
SSA Specific surface area (m²/kg)
te Equivalent thickness (m)
Ta Total area (m³)
Tmax Maximum temperature (° C)
V Volume of the mould (m³)
VAgg Aggregate volume (m³)
Vcp Volume of the cement paste (m³)
Vs Volum of the specimen (m³)
W Piston weight (kg)
Wcp Weight of cement paste (g)
Wds Weight of the dry specimen (kg)
Wh Hydrostatic weight (kg)
Wi Initial weight (g)
Wis Immersed weight (g)
Wsds Saturated specimen with dry surface (g)
Y Quantum yield
xxxii Simbols
Bioreceptivity optimisation of concrete substratum to stimulate biological colonisation
∆a* Green-red light colour difference
∆b* Blue-yellow light colour difference
∆C* Chromatic variations
∆E* Total colour difference
∆H* Changes in hue
∆L* Lightness difference
∆t Time differential
∆T Temperature differential
ρAgg Aggregate density (kg/m³)
ρf Density of the fluid (kg/m³)
εc Compaction energy (kg·cm/cm³)
γ Surface tension of mercury (N/m)
Ø Pore diameter
α-β SiO2 Transformation of siliceous aggregates, which occurs at around
575° C
ϑ Contact angle between mercury and the solid surface

Abbreviations xxxiii
Sandra Manso Blanco
ABBREVIATIONS
a:c:w Aggregates:cement:water ratio
ADP Ammonium Dihydrogen Phosphate
AF Calcium sulfoaluminate hydrates (Alumina, ferric oxide, mono-sulfate)
Aft Calcium sulfoaluminate hydrates (Alumina, ferric oxide, tri-sulfate)
BA Boric acid
CCAP Culture Collection of Algae and Protozoa
CFUs Colony Forming Units
Chl a Chlorophyll a
CIELab Colour space defined by the Commission Internationale de l'Eclairage
CSH Calcium silicate hydrate gel
DTA-TG Differential thermal analysis and thermogravimetry
FTIR Fourier Transform Infrared Spectroscopy
MgO Magnesium oxide, periclase
MIP Mercury Intrusion Porosimetry
MPC Magnesium Phosphate Cement
OA Oxalic acid
ocw Over cement ratio
OPC Ordinary Portland Cement
P:M ADP to MgO ratio
PAM Pulse Amplitude Modulation
PCR Polymerase Chain Reaction
PET Polyethylene terephthalate
RH Relative humidity
SEM Scanning Electron Microscopy
SPS Sulfite Polymixin Sulfadiazine Agar
TSA Tryptic Soy Agar
TSN Tryptic Sulfite Neomycin Agar
WHO World Health Organisation
w/c water to cement ratio
XRD X-Ray Diffraction

xxxiv Abbreviations
Bioreceptivity optimisation of concrete substratum to stimulate biological colonisation
Glossary xxxv
Sandra Manso Blanco
GLOSSARY
Autotroph: An organism capable of making nutritive organic molecules from inorganic sources
via photosynthesis (involving light energy) or chemosynthesis (involving chemical energy).
Biodegradation: A process by which microbial organisms transform or alter (through metabolic
or enzymatic action) the structure of chemicals introduced into the environment.
Biodeterioration: Any undesirable change in the properties of a material caused by the vital
activities of living organisms.
Biodiversity: The number and variety of living organisms found within a specified geographic
region or location.
Biofilm: Aggregate of bacteria held together by a mucuslike matrix of carbohydrate that adheres
to a surface. Biofilms can form on the surfaces of liquids, solids and living tissues.
Biofouling: The accumulation of living organisms on wetted surfaces.
Biomass: The total amount of living material in a given habitat, population, or sample. Specific
measures of biomass are generally expressed in dry weight (after removal of all water from the
sample) per unit area of land or unit volume of water.
Biophilia: Innate tendency to focus on life and lifelike processes.
Bioprotection: Active or passive microbially induced or mediated consolidation, cleaning,
and/or protection of stone materials affected by chemical, physical, and/or biological
weathering phenomena.
Bioreceptivity: The aptitude of a material (or any other inanimate object) to be colonised by one
or several groups of living organisms without necessarily undergoing any biodeterioration.
Chlorophyll: The green pigment found in the chloroplasts of higher plants and in cells of
photosynthetic microorganisms, which is primarily involved in absorbing light energy for
photosynthesis.
Colonisation: The action or process of setting up colonies of living organisms.
Colony forming units (CFUs): A measure of viable cells in which a colony represents an aggregate
of cells derived from a single progenitor cell.
Counting chamber: a device for counting microscopic objects suspended in fluid, as cells and
platelets in dilute whole blood or bacteria in broth culture. It consists of a microscope slide
containing a shallow cavity of uniform depth the floor of which is ruled with a grid and which,
when closed with a cover glass, holds a precise volume of fluid.
Dry weight: The dry matter of a sample or of an object when completely dried. It is a reliable
measure of the biomass.
Enzimatic process: Any chemical reaction or series of reactions catalysed by enzymes, which are
usually proteins with large complex molecules whose action depends on their particular

xxxvi Glosary
Bioreceptivity optimisation of concrete substratum to stimulate biological colonisation
molecular shape. Some enzymes control reactions within cells and some, such as the enzymes
involved in digestion, outside them.
Erlenmeyer: Type of laboratory flask which features a flat bottom, a conical body and a
cylindrical neck.
Evapotranspiration: Loss of water by evaporation from the soil and transpiration from plants.
Heterotroph: An organisms that is unable to synthesize its own organic carbon-based
compounds from inorganic sources, hence, feeds on organic matter produced by, or available
in, other organisms.
Inoculate: Introduce cells or organisms into a culture medium.
Isopolar: Pollen grains have identical proximal and distal poles.
Pellet: The material concentrated at the bottom of a centrifuge tube after centrifugation.
Petri dishes: A shallow circular dish with a loose-fitting cover, used to culture bacteria or other
microorganisms.
Photosynthetic electron transport chain: A group of compounds that pass electron from one to
another via redox reactions coupled with the transfer of proton across a membrane to create a
proton gradient that drive ATP synthesis.
Photosystem: A multisubunit complex found mainly in the thylakoid membranes of plants and
algae, and in the cytoplasmic membranes of photosynthetic bacteria. It is primarily involved in
capturing light to cause a series of redox reactions.
Plate count: An estimate of the number of viable cells in a culture. A plate count of a bacterial
culture is made by inoculating the culture plate with a dilute solution of the microorganisms and
counting the number of cells that appear in the resultant culture.
Polymerase Chain Reaction (PCR): A system for in vitro amplification of DNA.
Spore: A dormant, reproductive cell formed by certain organisms. It is thick-walled and highly
resistant to survive under unfavourable conditions so that when conditions revert to being
suitable it gives rise to a new individual.
Sporulation: Process of forming spores.
Stomata: Plural of stoma, which refers to any of various small apertures, especially one of the
minute orifices or slits in the epidermis of leaves, stems, etc., through which gases are
exchanged.
Sunshine duration: Time that direct radiation is higher than 120 W/m².
Taxonomy: The classification of organisms in a hierarchical system or in taxonomic ranks (e.g.
kingdom, phylum or division, class, genus, specie) based on shared characteristics or on
phylogenetic relationships inferred from the fossil record or established by genetic analysis.
Tricolpate: Pollen grain with a combination of colpus and porus per triplicate.
Introduction 1
Sandra Manso Blanco
1. INTRODUCTION
1.1. SCOPE OF THE RESEARCH
The lack of green areas into cities is caused by the constant increase in population and
the urbanisation process. In that sense, the United Nations (2009) stated the world population
is supposed to increase from 6.7 billion in 2007 to 9.2 billion in 2050. Moreover, the
aforementioned increase correspond to an increase of the urban population with 3.1 billion and
a decrease of the rural population with 0.6 billion between 2007 and 2050. In total, the world
urban population in 2050 is expected to be twice as large as in 2007. However, the rate of growth
of is expected to decrease from 1.8 % for the period 2007-2025 to lower than 1.3 % for the
period 2025-2050.
In 1920 less than 30 % of the developed countries population was living in urban areas
although the percentage increased to more than 50 % in 1950. In 2007 more than 80 % of the
Australian, New Zealand and North American population were living in urban areas, which is
expected to increase until 90 % in 2050. Accordingly, the urban population in Europe is predicted
to increase from 72 % in 2007 to 83 % in 2050. Consequently, the continued increase of urban
population combined with the pronounced deceleration of rural population growth lead to a
sustained urbanisation process as is shown in Figure 1.1. In that figure, real data regarding the
period comprised between 1950 and 2007 as well as expected values until 2050 are provided.

2 Chapter 1
Bioreceptivity optimisation of concrete substratum to stimulate biological colonisation
Figure 1.1.- Urban and rural populations in the world for the period comprised between 1950 and 2050 (adapted from United Nations, 2009)
However, the growth of the urban population is associated with a modification of the
urban landscape (McDonnell et al., 1997; Paul and Meyer, 2001). According to Czech et al. (2000)
and McKinney (2002), urban development has a high responsibility for local extinction rates and
loss of native species and has more influence on the environment than any other human activity.
Grimm et al. (2008) stated cities are hot spots that drive environmental change to multiple
scales. Those changes refer to five main points: land-use, biogeochemical cycles, climate change,
hydrologic systems and biodiversity.
According to the World Health Organisation (WHO) and other organisations, one of the
parameters involved in the society’s quality of life are the green areas surface per habitant
(Priego, 2011). The minimum value accepted by the WHO is 10 m² of green areas per habitant
and that value is not achieved in a high number of European cities. Figure 1.2 shows information
regarding the percentage of green areas of some European cities and the surface of green spaces
in the entire country per person. Points, which corresponds to cities, are coloured according to
the percentage of urban green spaces within the city and countries are coloured according to
the surface of green area per capita. As the figure shows, southern and eastern countries
recorded the lowest surfaces of green areas per capita. However, it is also remarkable that the
global situation of the country does not necessarily fit with the situation of its main cities.
Figure 1.2.- Urban green spaces in Europe. (Fuller and Gaston, 2009).
0
2000
4000
6000
8000
1950 1970 1990 2010 2030 2050
Po
pu
lati
on
(m
illio
ns)
Year
Rural population Urban population
Introduction 3
Sandra Manso Blanco
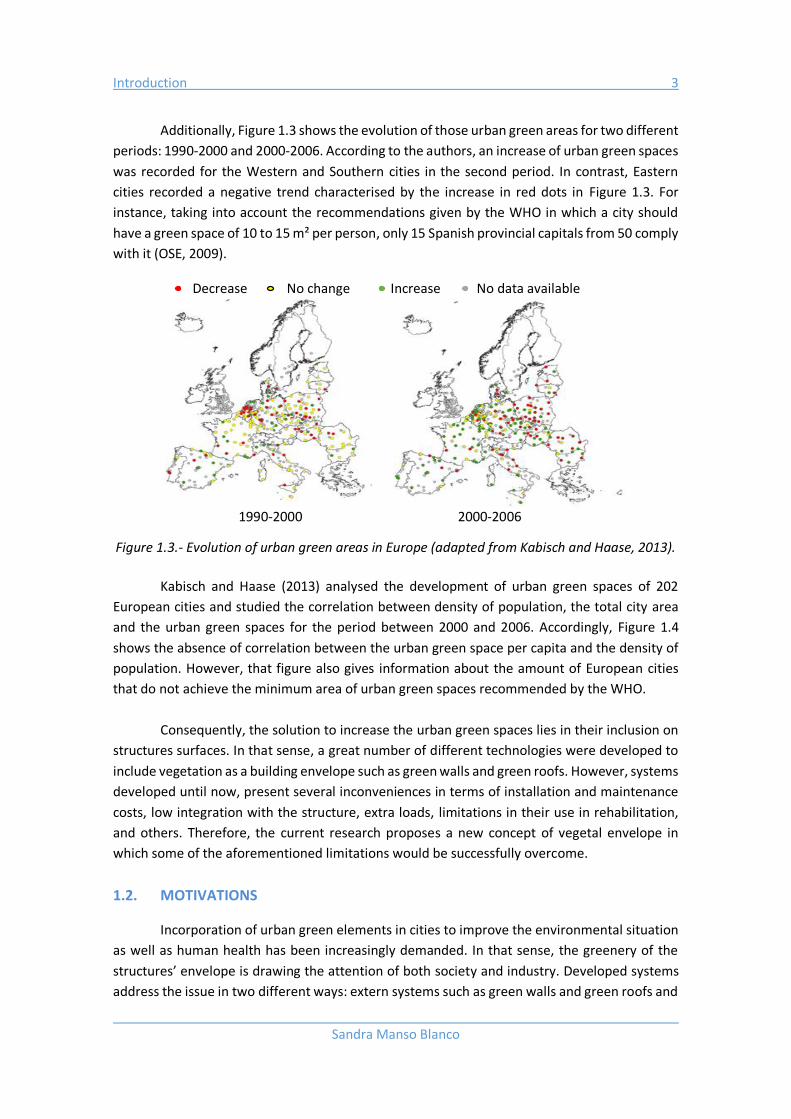
Additionally, Figure 1.3 shows the evolution of those urban green areas for two different
periods: 1990-2000 and 2000-2006. According to the authors, an increase of urban green spaces
was recorded for the Western and Southern cities in the second period. In contrast, Eastern
cities recorded a negative trend characterised by the increase in red dots in Figure 1.3. For
instance, taking into account the recommendations given by the WHO in which a city should
have a green space of 10 to 15 m² per person, only 15 Spanish provincial capitals from 50 comply
with it (OSE, 2009).
Figure 1.3.- Evolution of urban green areas in Europe (adapted from Kabisch and Haase, 2013).
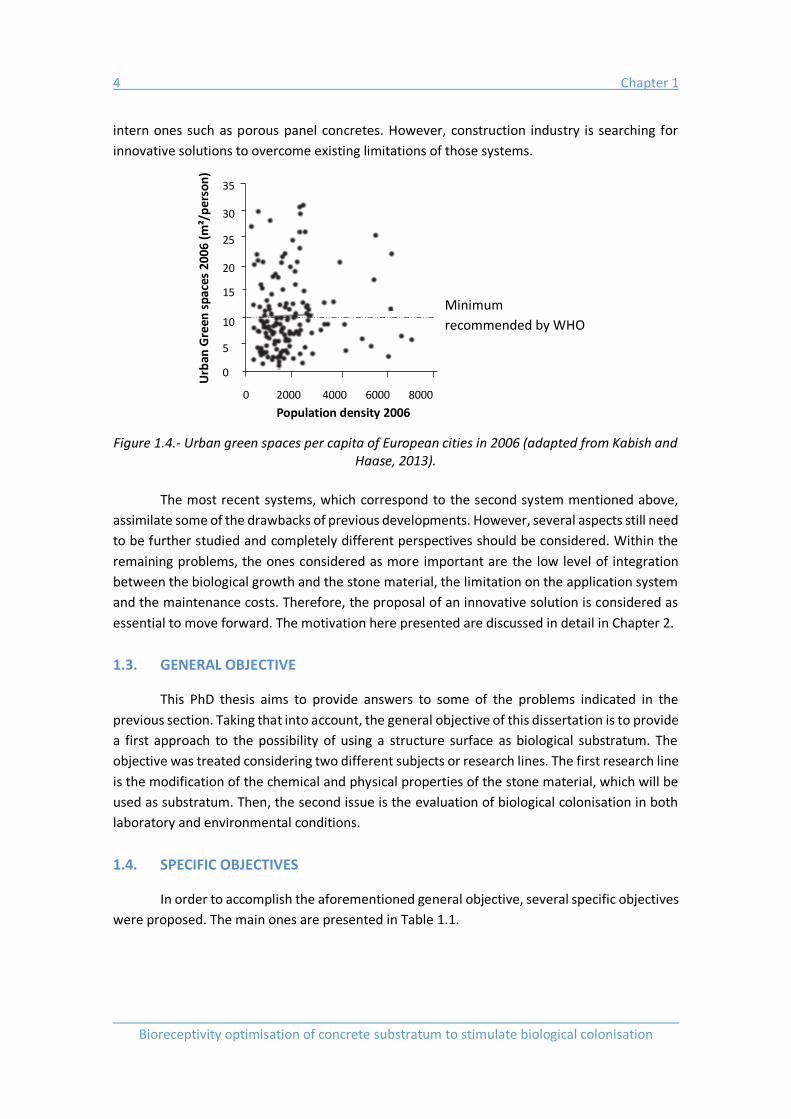
Kabisch and Haase (2013) analysed the development of urban green spaces of 202
European cities and studied the correlation between density of population, the total city area
and the urban green spaces for the period between 2000 and 2006. Accordingly, Figure 1.4
shows the absence of correlation between the urban green space per capita and the density of
population. However, that figure also gives information about the amount of European cities
that do not achieve the minimum area of urban green spaces recommended by the WHO.
Consequently, the solution to increase the urban green spaces lies in their inclusion on
structures surfaces. In that sense, a great number of different technologies were developed to
include vegetation as a building envelope such as green walls and green roofs. However, systems
developed until now, present several inconveniences in terms of installation and maintenance
costs, low integration with the structure, extra loads, limitations in their use in rehabilitation,
and others. Therefore, the current research proposes a new concept of vegetal envelope in
which some of the aforementioned limitations would be successfully overcome.
1.2. MOTIVATIONS
Incorporation of urban green elements in cities to improve the environmental situation
as well as human health has been increasingly demanded. In that sense, the greenery of the
structures’ envelope is drawing the attention of both society and industry. Developed systems
address the issue in two different ways: extern systems such as green walls and green roofs and
Decrease No change Increase No data available
1990-2000 2000-2006
4 Chapter 1
Bioreceptivity optimisation of concrete substratum to stimulate biological colonisation
intern ones such as porous panel concretes. However, construction industry is searching for
innovative solutions to overcome existing limitations of those systems.
Figure 1.4.- Urban green spaces per capita of European cities in 2006 (adapted from Kabish and Haase, 2013).
The most recent systems, which correspond to the second system mentioned above,
assimilate some of the drawbacks of previous developments. However, several aspects still need
to be further studied and completely different perspectives should be considered. Within the
remaining problems, the ones considered as more important are the low level of integration
between the biological growth and the stone material, the limitation on the application system
and the maintenance costs. Therefore, the proposal of an innovative solution is considered as
essential to move forward. The motivation here presented are discussed in detail in Chapter 2.
1.3. GENERAL OBJECTIVE
This PhD thesis aims to provide answers to some of the problems indicated in the
previous section. Taking that into account, the general objective of this dissertation is to provide
a first approach to the possibility of using a structure surface as biological substratum. The
objective was treated considering two different subjects or research lines. The first research line
is the modification of the chemical and physical properties of the stone material, which will be
used as substratum. Then, the second issue is the evaluation of biological colonisation in both
laboratory and environmental conditions.
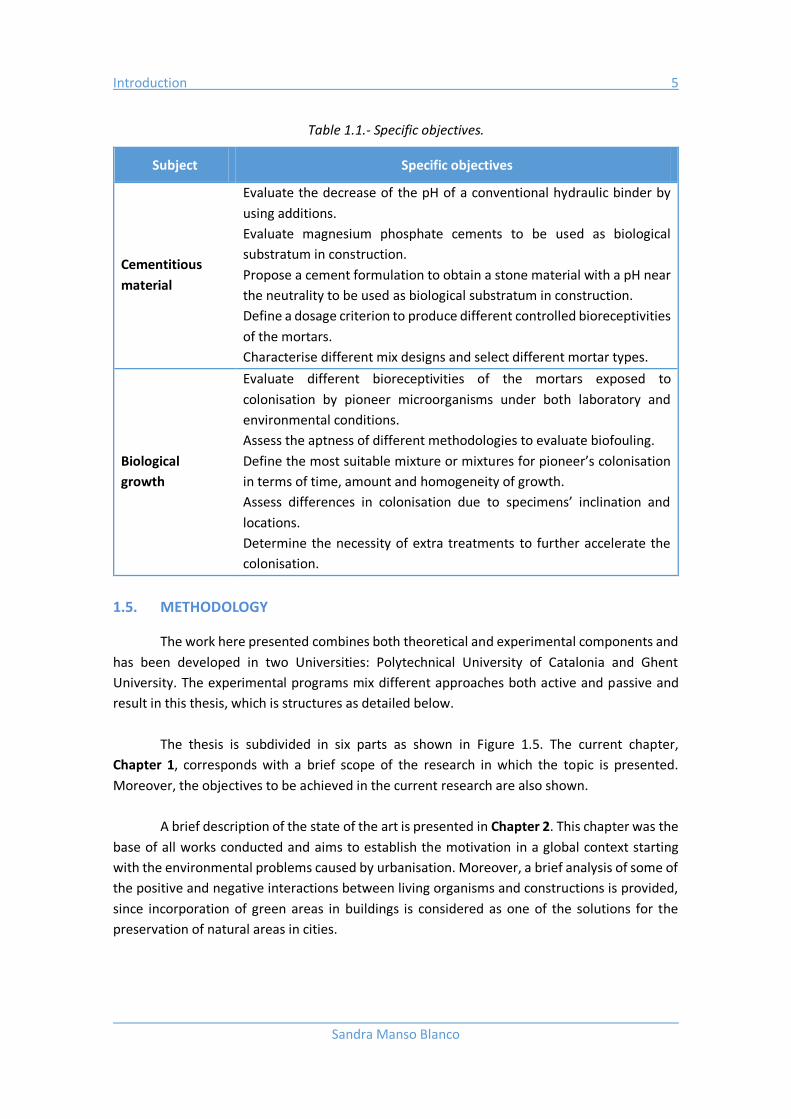
1.4. SPECIFIC OBJECTIVES
In order to accomplish the aforementioned general objective, several specific objectives
were proposed. The main ones are presented in Table 1.1.
0 2000 4000 6000 8000
Population density 2006
35
30
25
20
15
10
5
0
Urb
an G
reen
sp
aces
200
6 (m
²/p
erso
n)
Minimum
recommended by WHO
Introduction 5
Sandra Manso Blanco
Table 1.1.- Specific objectives.
Subject Specific objectives
Cementitious
material
Evaluate the decrease of the pH of a conventional hydraulic binder by
using additions.
Evaluate magnesium phosphate cements to be used as biological
substratum in construction.
Propose a cement formulation to obtain a stone material with a pH near
the neutrality to be used as biological substratum in construction.
Define a dosage criterion to produce different controlled bioreceptivities
of the mortars.
Characterise different mix designs and select different mortar types.
Biological
growth
Evaluate different bioreceptivities of the mortars exposed to
colonisation by pioneer microorganisms under both laboratory and
environmental conditions.
Assess the aptness of different methodologies to evaluate biofouling.
Define the most suitable mixture or mixtures for pioneer’s colonisation
in terms of time, amount and homogeneity of growth.
Assess differences in colonisation due to specimens’ inclination and
locations.
Determine the necessity of extra treatments to further accelerate the
colonisation.
1.5. METHODOLOGY
The work here presented combines both theoretical and experimental components and
has been developed in two Universities: Polytechnical University of Catalonia and Ghent
University. The experimental programs mix different approaches both active and passive and
result in this thesis, which is structures as detailed below.
The thesis is subdivided in six parts as shown in Figure 1.5. The current chapter,
Chapter 1, corresponds with a brief scope of the research in which the topic is presented.
Moreover, the objectives to be achieved in the current research are also shown.
A brief description of the state of the art is presented in Chapter 2. This chapter was the
base of all works conducted and aims to establish the motivation in a global context starting
with the environmental problems caused by urbanisation. Moreover, a brief analysis of some of
the positive and negative interactions between living organisms and constructions is provided,
since incorporation of green areas in buildings is considered as one of the solutions for the
preservation of natural areas in cities.

6 Chapter 1
Bioreceptivity optimisation of concrete substratum to stimulate biological colonisation
Figure 1.5.- Outline of the thesis.
Chapter 3 corresponds to the first experimental program, which main purpose is the
modification of the chemical properties of a cementitious material in order to obtain a low pH
substratum. Two different ways were evaluated: first, use of additions in Ordinary Portland
Cement mixtures and characterization of different formulations of Magnesium Phosphate
Cement.
In Chapter 4, the second experimental program regarding the modification of the
physical properties of the mortar is carried out. In that chapter, a dosage criterion is stipulated
in order to produce specimens with a certain controlled roughness and porosity. In that sense
modifications of the type of hydraulic binder, the granular skeleton, the water to cement ratios
and the amount of cement paste were made.
After the development of materials with different bioreceptivity, in Chapter 5 an
evaluation of the colonisation of the specimens under laboratory conditions was achieved.
Methodologies already used for biofouling of stone materials analyses were used and the
evaluation consisted in both qualitative and quantitative analysis by means of non-destructive
tests.
Chapter 6 aims to show the significant differences of results related to test conditions.
Consequently, specimens’ exposition to environmental conditions was carried out in order to
Motivations
(Chapter 2)
Design & characterisation
materials bioreceptivity
Evaluation of the colonisation
by living organisms
Modification
of chemical
properties (Chapter 3)
Modification
of physical
properties (Chapter 4)
Under
laboratory
conditions (Chapter 5)
Under
environmental
conditions (Chapter 6)
Concluding remarks and future
perspectives (Chapter 7)

Introduction 7
Sandra Manso Blanco
analyse the colonisation depending on the location and the weather conditions. In that sense,
preliminary studies for a period of less than a year are presented although the necessity of
thorough experimental programs for longer periods of time is clear.
Finally, Chapter 7 describes the conclusions of each of the subjects addressed in the
thesis and presents the future perspectives of the research.

8 Chapter 1
Bioreceptivity optimisation of concrete substratum to stimulate biological colonisation
State of the art 9
tyrthfghgf Sandra Manso Blanco
2. STATE OF THE ART
2.1. INTRODUCTION
An increasing interest in city greenery was observed since the beginning of twentieth
century. Biophilia is the term defined by Wilson (1984), which refers to the “innate tendency to
focus on life and lifelike processes”. According to the author, both environmental and genetic
components are involved in the positive reaction humans have towards living organisms.
Related to that fact, the incorporation of nature into cities is increasingly popular although
environmental benefits should be also taken into account. Consequently, the main reason to
include living organisms, mainly plants, initially was to provide an aesthetical value. Johnston
and Newton (2004) state life is more pleasant when green elements are added, understanding
green elements as plants and other greenery components.
This fact was evident since earlier times, when incorporation of climbing plants was
considered as providing an added aesthetical value (Laurie, 1977) and the first environmental
reaction to industrialisation (Kaltenbach, 2008). Moreover, European cities have been
constantly growing as the United Nations stated in 2002 and 2009. They estimated that the
proportion of people living in urban areas between 2000 and 2050 would rise from 46.6 % to
69.6 % with the consequent problems in environmental pollution, heat island effects and climate
change. The above results in a general lack of green areas inside cities, such as parks and
gardens. Consequently, building greenery is also an attempt to overcome this situation.
10 Chapter 2
tyrthfghgf Bioreceptivity optimisation of concrete substratum to stimulate biological colonisation
During the past years, perception of urban greenery has been changing. As mentioned
before, the aesthetical value has been clear from the start of the urban greenery trend.
However, presence of natural elements in cities has effect at three different levels such as the
social, the ecologic and the economic levels (Heidt and Neef, 2008). Those causes a change in
professionals’ interest, which encourages them to use sustainability criteria in the design of
construction elements (Pérez, 2011).
Regarding the social effect, health benefits have been widely described by several
authors (Ulrich, 1993; Dilani, 2001; Nielsen and Hansen, 2007; Lee and Maheswaran, 2011). In
general, different researches provide information regarding both physical and psychological
benefits linked to presence of green areas. Among them, Pretty et al. (2003) stated green areas
provide a natural space for the sports practice, which may stimulate physical activity
contributing to different benefits such as better cardio- and cerebra-vascular state, resistance
against depression, and others. Furthermore, Stigsdotter et al. (2010) stated green spaces
positively affect stress and quality of life.
The ecological benefits of green spaces are mainly the absorption of CO2 and production
of oxygen due to photosynthetic organisms (Jo, 2002), purification of the local air and water,
regulation of the microclimate and reduction of noise (Bolund and Hunhammar, 1999) as well
as maintenance of the biodiversity (Attwell, 2000). Finally, from an economic point of view,
general benefits are reported such as reduction in costs related to improvement of local areas.
For instance, the decrease of air pollution would lead to economic benefits for both cities and
citizens. The above may lead to reduced costs of measures to reduce pollution or prevention
actions (Chiesura, 2004).
Afterwards, the concept of greening cities involved also the concept of greening
buildings, especially in cities in which available spaces for green areas construction are scarce.
Ecological engineering was born as an applied and interdisciplinary science to integrate human
activities and the environment (Ottelé, 2011). According to the general benefits presented
above, incorporation of green living elements in the exterior of buildings also implies benefits
such as energy conservation or the provision of a more aesthetical environment (Getter and
Rowe, 2006).
This chapter aims to review the current situation and necessity of integrating nature into
the cities and more specifically the application on structures envelopes. In that sense, both
positive and negative interactions between living organisms and structures is reviewed.
Moreover, issues that still require improvement are identified. Hence, this state of the art
pursues two main goals: to identify the motivations for the thesis and briefly cover literature
concerning the subjects that will be addressed in this dissertation.
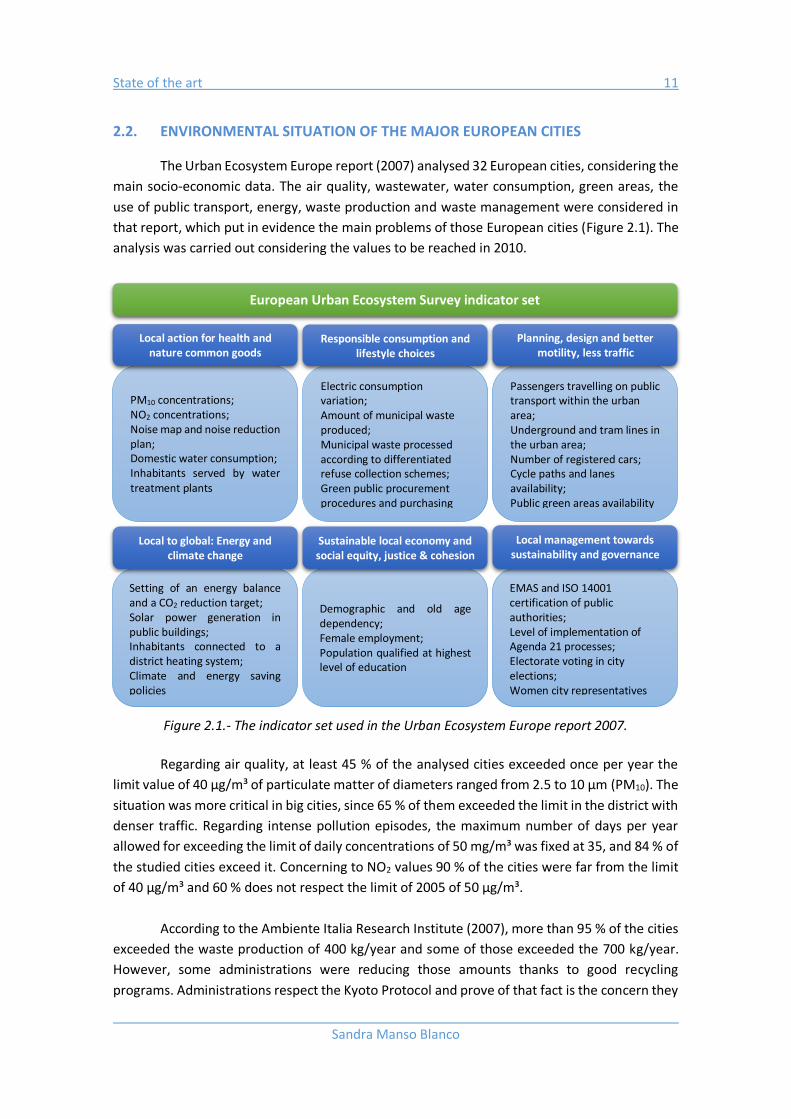
State of the art 11
tyrthfghgf Sandra Manso Blanco
2.2. ENVIRONMENTAL SITUATION OF THE MAJOR EUROPEAN CITIES
The Urban Ecosystem Europe report (2007) analysed 32 European cities, considering the
main socio-economic data. The air quality, wastewater, water consumption, green areas, the
use of public transport, energy, waste production and waste management were considered in
that report, which put in evidence the main problems of those European cities (Figure 2.1). The
analysis was carried out considering the values to be reached in 2010.
Figure 2.1.- The indicator set used in the Urban Ecosystem Europe report 2007.
Regarding air quality, at least 45 % of the analysed cities exceeded once per year the
limit value of 40 µg/m³ of particulate matter of diameters ranged from 2.5 to 10 µm (PM10). The
situation was more critical in big cities, since 65 % of them exceeded the limit in the district with
denser traffic. Regarding intense pollution episodes, the maximum number of days per year
allowed for exceeding the limit of daily concentrations of 50 mg/m³ was fixed at 35, and 84 % of
the studied cities exceed it. Concerning to NO2 values 90 % of the cities were far from the limit
of 40 µg/m³ and 60 % does not respect the limit of 2005 of 50 µg/m³.
According to the Ambiente Italia Research Institute (2007), more than 95 % of the cities
exceeded the waste production of 400 kg/year and some of those exceeded the 700 kg/year.
However, some administrations were reducing those amounts thanks to good recycling
programs. Administrations respect the Kyoto Protocol and prove of that fact is the concern they
European Urban Ecosystem Survey indicator set
PM10 concentrations; NO2 concentrations; Noise map and noise reduction plan; Domestic water consumption; Inhabitants served by water treatment plants
Local action for health and nature common goods
Electric consumption variation; Amount of municipal waste produced; Municipal waste processed according to differentiated refuse collection schemes; Green public procurement procedures and purchasing
Responsible consumption and lifestyle choices
Demographic and old age dependency; Female employment; Population qualified at highest level of education
Sustainable local economy and social equity, justice & cohesion
EMAS and ISO 14001 certification of public authorities; Level of implementation of Agenda 21 processes; Electorate voting in city elections; Women city representatives
Local management towards sustainability and governance
Setting of an energy balance and a CO2 reduction target; Solar power generation in public buildings; Inhabitants connected to a district heating system; Climate and energy saving policies
Local to global: Energy and climate change
Passengers travelling on public transport within the urban area; Underground and tram lines in the urban area; Number of registered cars; Cycle paths and lanes availability; Public green areas availability
Planning, design and better motility, less traffic

12 Chapter 2
tyrthfghgf Bioreceptivity optimisation of concrete substratum to stimulate biological colonisation
have for CO2 emissions. Furthermore, some cities such as Barcelona, Hannover, Munich, Oslo or
Rome defined highly innovative local regulation to improve energy efficiency and central and
southern cities also increased the use of solar panels.
Later, the Green City Index quantified and compared environmental performance of 120
cities around the world considering thirty indicators. On one hand, pollution is usually initially
associated with the economic development. Regarding infrastructures, high costs are commonly
associated with high-quality green infrastructures, which only can be afforded by wealthy
governments. Consequently, the economic resources are one of the most important factors to
consider. However, there are other aspects that should be considered such as historical
attitudes, culture or local available resources.
The thirty indicators are grouped in 8 main groups, covering the following topics: CO2,
energy, buildings, transport, waste and land use, water, air quality and environmental
governance. Figure 2.2 shows a detailed scheme of all the indexes considered, which are
composed of either 16 quantitative and 14 qualitative indexes.
Figure 2.2.- Indexes considered for the European Green City Index (Economist Intelligence Unit, 2012).
Focusing the analysis on European cities, 8 of the 30 cities analysed by the Economist
Intelligence Unit were selected as examples. Those cities are Amsterdam (AMS), Athens (ATH),
Berlin (BER), Brussels (BRU), London (LON), Madrid (MAD), Paris (PAR), and Rome (ROM). Then,
from all the indicators shown in Figure 2.2, only data concerning to CO2 emissions, energy
European Green Cities Index
Energy consumption; Energy intensity; Renewable energy consumption; Clean and efficient energy policies
Energy
CO2 intensity;
CO2 emissions;
CO2 reduction
strategy
CO2
Energy consumption of residential buildings; Energy-efficient buildings standards; Energy-efficient buildings initiatives
Buildings
Use of non-car transport; Size of non-car transport network; Green transport promotion; Congestion reduction policies
Transport
Municipal waste production; Waste recycling; Waste reduction policies; Green land use policies
Waste & land use
Water consumption; System leakages: Wastewater system treatment; Water efficiency and treatment policies
Water
Nitrogen dioxide; Sulphur dioxide; Ozone; Particulate matter; Clean air policies
Air quality
Green action plan; Green management; Public participation in green policy
Environmental Governance
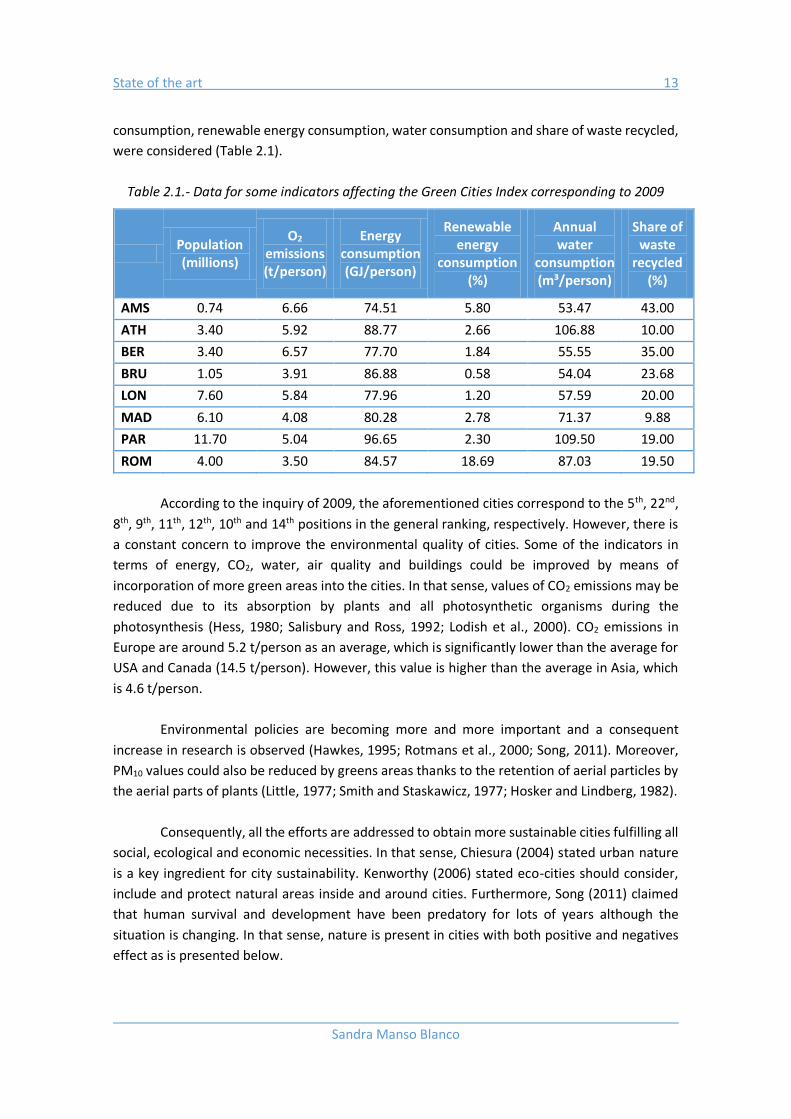
State of the art 13
tyrthfghgf Sandra Manso Blanco
consumption, renewable energy consumption, water consumption and share of waste recycled,
were considered (Table 2.1).
Table 2.1.- Data for some indicators affecting the Green Cities Index corresponding to 2009
Population (millions)
O2 emissions (t/person)
Energy consumption (GJ/person)
Renewable energy
consumption (%)
Annual water
consumption (m³/person)
Share of waste
recycled (%)
AMS 0.74 6.66 74.51 5.80 53.47 43.00
ATH 3.40 5.92 88.77 2.66 106.88 10.00
BER 3.40 6.57 77.70 1.84 55.55 35.00
BRU 1.05 3.91 86.88 0.58 54.04 23.68
LON 7.60 5.84 77.96 1.20 57.59 20.00
MAD 6.10 4.08 80.28 2.78 71.37 9.88
PAR 11.70 5.04 96.65 2.30 109.50 19.00
ROM 4.00 3.50 84.57 18.69 87.03 19.50
According to the inquiry of 2009, the aforementioned cities correspond to the 5th, 22nd,
8th, 9th, 11th, 12th, 10th and 14th positions in the general ranking, respectively. However, there is
a constant concern to improve the environmental quality of cities. Some of the indicators in
terms of energy, CO2, water, air quality and buildings could be improved by means of
incorporation of more green areas into the cities. In that sense, values of CO2 emissions may be
reduced due to its absorption by plants and all photosynthetic organisms during the
photosynthesis (Hess, 1980; Salisbury and Ross, 1992; Lodish et al., 2000). CO2 emissions in
Europe are around 5.2 t/person as an average, which is significantly lower than the average for
USA and Canada (14.5 t/person). However, this value is higher than the average in Asia, which
is 4.6 t/person.
Environmental policies are becoming more and more important and a consequent
increase in research is observed (Hawkes, 1995; Rotmans et al., 2000; Song, 2011). Moreover,
PM10 values could also be reduced by greens areas thanks to the retention of aerial particles by
the aerial parts of plants (Little, 1977; Smith and Staskawicz, 1977; Hosker and Lindberg, 1982).
Consequently, all the efforts are addressed to obtain more sustainable cities fulfilling all
social, ecological and economic necessities. In that sense, Chiesura (2004) stated urban nature
is a key ingredient for city sustainability. Kenworthy (2006) stated eco-cities should consider,
include and protect natural areas inside and around cities. Furthermore, Song (2011) claimed
that human survival and development have been predatory for lots of years although the
situation is changing. In that sense, nature is present in cities with both positive and negatives
effect as is presented below.
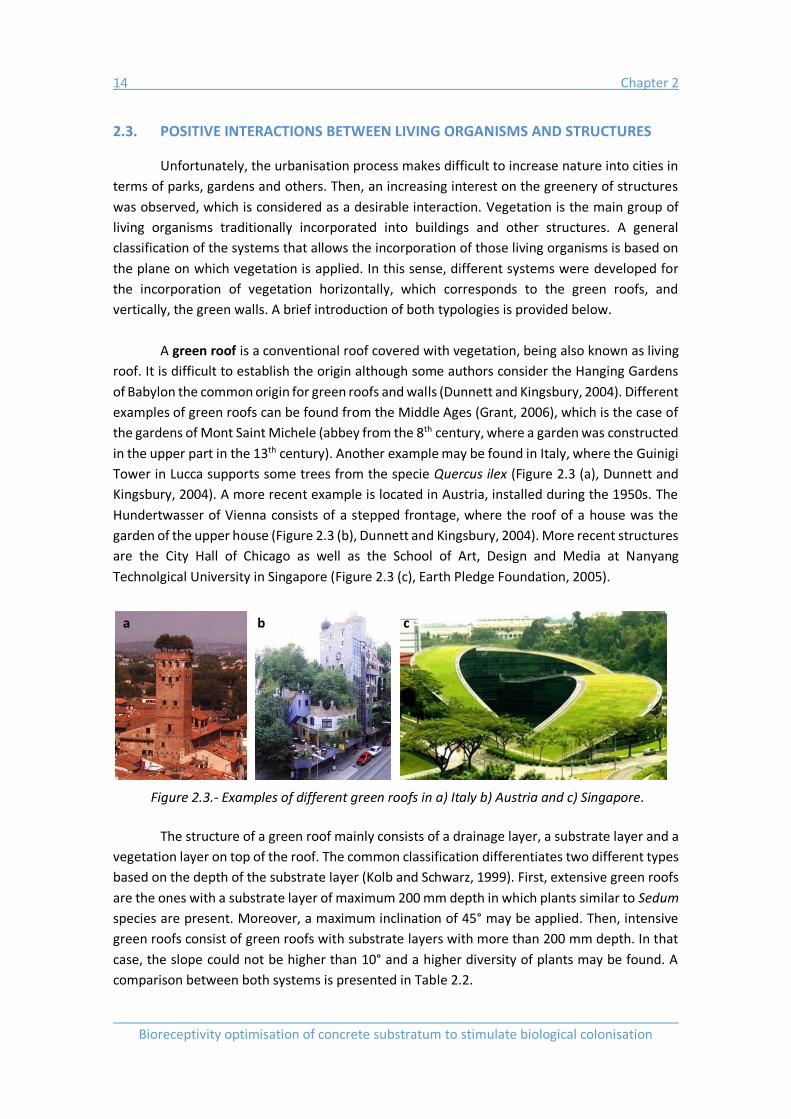
14 Chapter 2
tyrthfghgf Bioreceptivity optimisation of concrete substratum to stimulate biological colonisation
2.3. POSITIVE INTERACTIONS BETWEEN LIVING ORGANISMS AND STRUCTURES
Unfortunately, the urbanisation process makes difficult to increase nature into cities in
terms of parks, gardens and others. Then, an increasing interest on the greenery of structures
was observed, which is considered as a desirable interaction. Vegetation is the main group of
living organisms traditionally incorporated into buildings and other structures. A general
classification of the systems that allows the incorporation of those living organisms is based on
the plane on which vegetation is applied. In this sense, different systems were developed for
the incorporation of vegetation horizontally, which corresponds to the green roofs, and
vertically, the green walls. A brief introduction of both typologies is provided below.
A green roof is a conventional roof covered with vegetation, being also known as living
roof. It is difficult to establish the origin although some authors consider the Hanging Gardens
of Babylon the common origin for green roofs and walls (Dunnett and Kingsbury, 2004). Different
examples of green roofs can be found from the Middle Ages (Grant, 2006), which is the case of
the gardens of Mont Saint Michele (abbey from the 8th century, where a garden was constructed
in the upper part in the 13th century). Another example may be found in Italy, where the Guinigi
Tower in Lucca supports some trees from the specie Quercus ilex (Figure 2.3 (a), Dunnett and
Kingsbury, 2004). A more recent example is located in Austria, installed during the 1950s. The
Hundertwasser of Vienna consists of a stepped frontage, where the roof of a house was the
garden of the upper house (Figure 2.3 (b), Dunnett and Kingsbury, 2004). More recent structures
are the City Hall of Chicago as well as the School of Art, Design and Media at Nanyang
Technolgical University in Singapore (Figure 2.3 (c), Earth Pledge Foundation, 2005).
Figure 2.3.- Examples of different green roofs in a) Italy b) Austria and c) Singapore.
The structure of a green roof mainly consists of a drainage layer, a substrate layer and a
vegetation layer on top of the roof. The common classification differentiates two different types
based on the depth of the substrate layer (Kolb and Schwarz, 1999). First, extensive green roofs
are the ones with a substrate layer of maximum 200 mm depth in which plants similar to Sedum
species are present. Moreover, a maximum inclination of 45° may be applied. Then, intensive
green roofs consist of green roofs with substrate layers with more than 200 mm depth. In that
case, the slope could not be higher than 10° and a higher diversity of plants may be found. A
comparison between both systems is presented in Table 2.2.
a b c
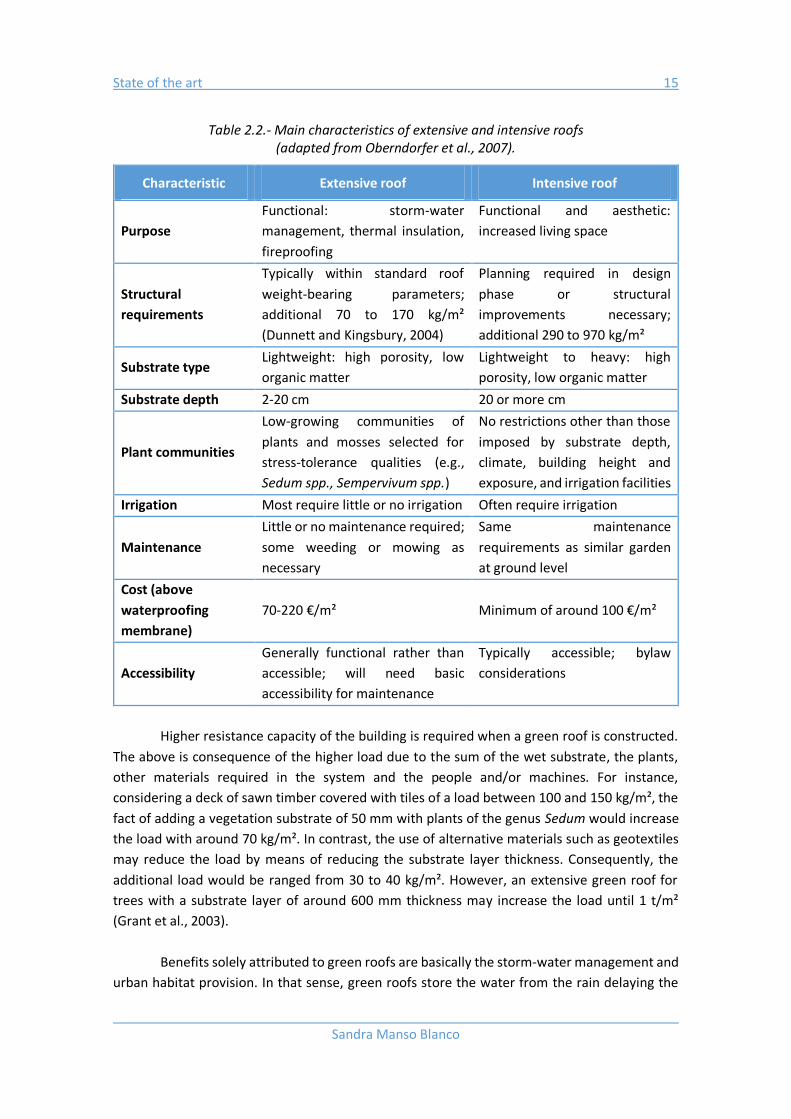
State of the art 15
tyrthfghgf Sandra Manso Blanco
Table 2.2.- Main characteristics of extensive and intensive roofs (adapted from Oberndorfer et al., 2007).
Characteristic Extensive roof Intensive roof
Purpose
Functional: storm-water
management, thermal insulation,
fireproofing
Functional and aesthetic:
increased living space
Structural
requirements
Typically within standard roof
weight-bearing parameters;
additional 70 to 170 kg/m²
(Dunnett and Kingsbury, 2004)
Planning required in design
phase or structural
improvements necessary;
additional 290 to 970 kg/m²
Substrate type Lightweight: high porosity, low
organic matter
Lightweight to heavy: high
porosity, low organic matter
Substrate depth 2-20 cm 20 or more cm
Plant communities
Low-growing communities of
plants and mosses selected for
stress-tolerance qualities (e.g.,
Sedum spp., Sempervivum spp.)
No restrictions other than those
imposed by substrate depth,
climate, building height and
exposure, and irrigation facilities
Irrigation Most require little or no irrigation Often require irrigation
Maintenance
Little or no maintenance required;
some weeding or mowing as
necessary
Same maintenance
requirements as similar garden
at ground level
Cost (above
waterproofing
membrane)
70-220 €/m² Minimum of around 100 €/m²
Accessibility
Generally functional rather than
accessible; will need basic
accessibility for maintenance
Typically accessible; bylaw
considerations
Higher resistance capacity of the building is required when a green roof is constructed.
The above is consequence of the higher load due to the sum of the wet substrate, the plants,
other materials required in the system and the people and/or machines. For instance,
considering a deck of sawn timber covered with tiles of a load between 100 and 150 kg/m², the
fact of adding a vegetation substrate of 50 mm with plants of the genus Sedum would increase
the load with around 70 kg/m². In contrast, the use of alternative materials such as geotextiles
may reduce the load by means of reducing the substrate layer thickness. Consequently, the
additional load would be ranged from 30 to 40 kg/m². However, an extensive green roof for
trees with a substrate layer of around 600 mm thickness may increase the load until 1 t/m²
(Grant et al., 2003).
Benefits solely attributed to green roofs are basically the storm-water management and
urban habitat provision. In that sense, green roofs store the water from the rain delaying the
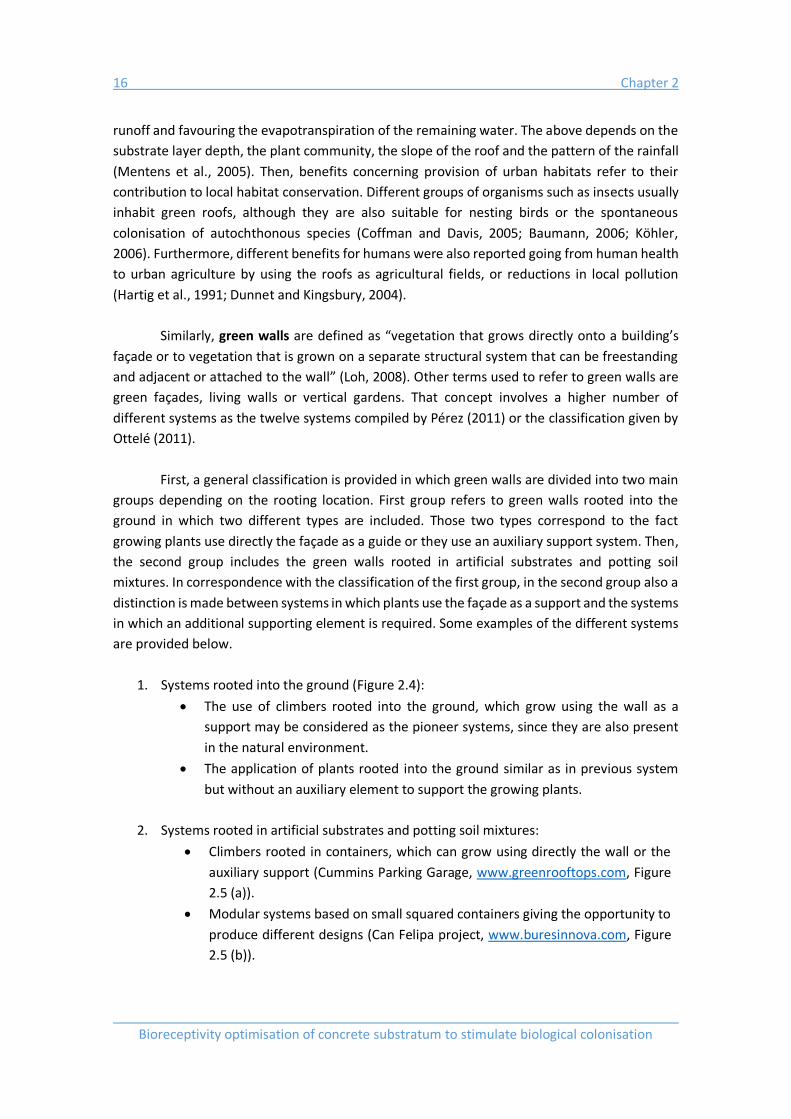
16 Chapter 2
tyrthfghgf Bioreceptivity optimisation of concrete substratum to stimulate biological colonisation
runoff and favouring the evapotranspiration of the remaining water. The above depends on the
substrate layer depth, the plant community, the slope of the roof and the pattern of the rainfall
(Mentens et al., 2005). Then, benefits concerning provision of urban habitats refer to their
contribution to local habitat conservation. Different groups of organisms such as insects usually
inhabit green roofs, although they are also suitable for nesting birds or the spontaneous
colonisation of autochthonous species (Coffman and Davis, 2005; Baumann, 2006; Köhler,
2006). Furthermore, different benefits for humans were also reported going from human health
to urban agriculture by using the roofs as agricultural fields, or reductions in local pollution
(Hartig et al., 1991; Dunnet and Kingsbury, 2004).
Similarly, green walls are defined as “vegetation that grows directly onto a building’s
façade or to vegetation that is grown on a separate structural system that can be freestanding
and adjacent or attached to the wall” (Loh, 2008). Other terms used to refer to green walls are
green façades, living walls or vertical gardens. That concept involves a higher number of
different systems as the twelve systems compiled by Pérez (2011) or the classification given by
Ottelé (2011).
First, a general classification is provided in which green walls are divided into two main
groups depending on the rooting location. First group refers to green walls rooted into the
ground in which two different types are included. Those two types correspond to the fact
growing plants use directly the façade as a guide or they use an auxiliary support system. Then,
the second group includes the green walls rooted in artificial substrates and potting soil
mixtures. In correspondence with the classification of the first group, in the second group also a
distinction is made between systems in which plants use the façade as a support and the systems
in which an additional supporting element is required. Some examples of the different systems
are provided below.
1. Systems rooted into the ground (Figure 2.4):
The use of climbers rooted into the ground, which grow using the wall as a
support may be considered as the pioneer systems, since they are also present
in the natural environment.
The application of plants rooted into the ground similar as in previous system
but without an auxiliary element to support the growing plants.
2. Systems rooted in artificial substrates and potting soil mixtures:
Climbers rooted in containers, which can grow using directly the wall or the
auxiliary support (Cummins Parking Garage, www.greenrooftops.com, Figure
2.5 (a)).
Modular systems based on small squared containers giving the opportunity to
produce different designs (Can Felipa project, www.buresinnova.com, Figure
2.5 (b)).
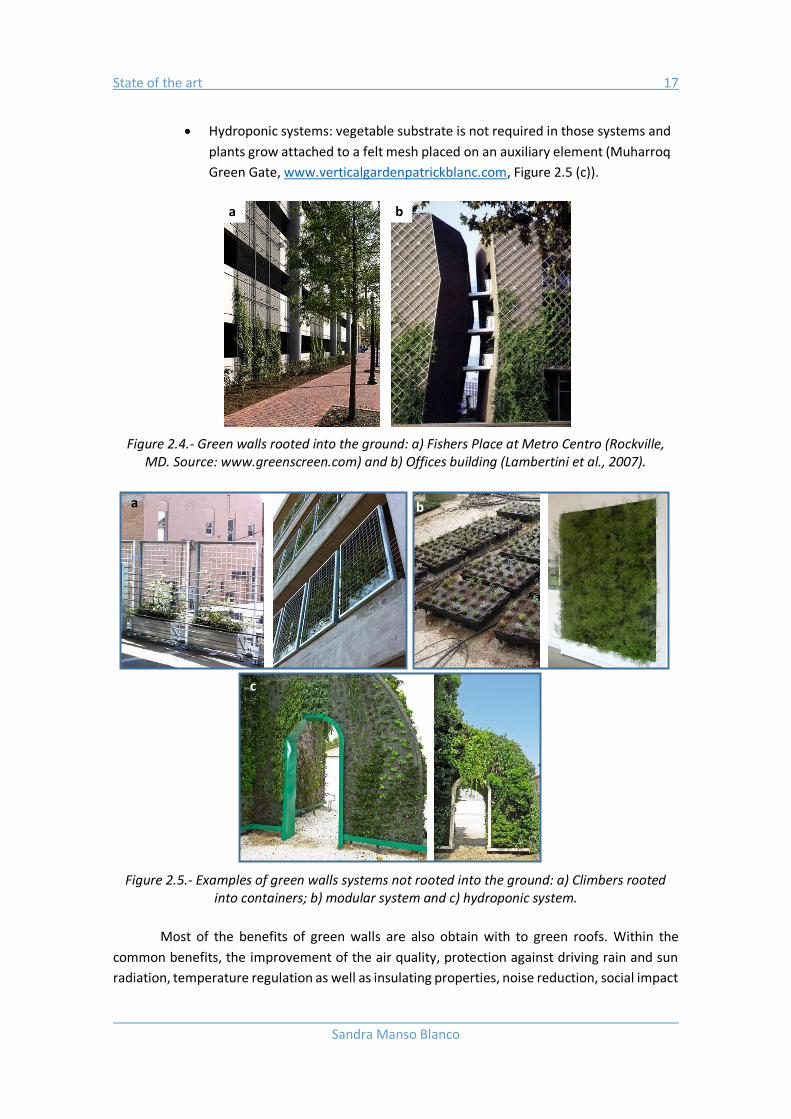
State of the art 17
tyrthfghgf Sandra Manso Blanco
Hydroponic systems: vegetable substrate is not required in those systems and
plants grow attached to a felt mesh placed on an auxiliary element (Muharroq
Green Gate, www.verticalgardenpatrickblanc.com, Figure 2.5 (c)).
Figure 2.4.- Green walls rooted into the ground: a) Fishers Place at Metro Centro (Rockville, MD. Source: www.greenscreen.com) and b) Offices building (Lambertini et al., 2007).
Figure 2.5.- Examples of green walls systems not rooted into the ground: a) Climbers rooted into containers; b) modular system and c) hydroponic system.
Most of the benefits of green walls are also obtain with to green roofs. Within the
common benefits, the improvement of the air quality, protection against driving rain and sun
radiation, temperature regulation as well as insulating properties, noise reduction, social impact
a b
a b
c

18 Chapter 2
tyrthfghgf Bioreceptivity optimisation of concrete substratum to stimulate biological colonisation
and economic savings may be the most interesting to the society (Ottelé, 2011, Pérez, 2011). In
general, green plants absorb gaseous pollutants through leaf stomata, which react with water
to form other compounds inside the plant.
Furthermore, suspended particles dispersed by the wind may also be intercepted by
plants (Bidwell and Fraser 1972; Baldocchi et al., 1987). Consequently, several authors do
research on estimating the air pollution mitigation effect by green walls and roofs (Currie and
Bass, 2008; Pugh et al., 2012). According to Dunnet and Kingsbury (2004), vegetation may reduce
the maximum temperatures of a building thanks to its leaves, which provide shadow to the
surface. Therefore, buildings with plant-covered walls are usually cooler than when other
solutions are applied such as light coloured surfaces (Hoyano, 1988). Furthermore, plants act as
solar filters since they absorb the solar radiation to use it for developing their biological functions
(Perini et al., 2011).
The noise attenuation due to vegetation is also well known. Vegetation affects the sound
in urban areas by means of sound absorption, sound diffusion and sound level reduction due to
the transmission of the sound waves through those organisms (Wong et al., 2010; Van
Renterghem and Botteldooren, 2011). Regarding economic saving, it is mainly associated to
energy saving since green walls act as passive systems reducing the energy consumption.
Moreover, that benefit is closely related to the thermal regulation capacity thanks to the shadow
produced by the plants, to the thermal insulation provided not only by the plants but also by the
substrate and the evaporative cooling, which is consequence of the evapotranspiration process
(Pérez et al., 2011). However, the economic benefits are also linked to the reduction of the air
pollution since pollution fees would decrease.
Additionally to all the aforementioned benefits, there is a general positive perception of
the incorporation of green elements as already referenced. In that sense, some works reveal the
positive psychological effect of nature on people (Anderson et al., 1984; Dinsdale et al., 2006)
although quantitative measurements of the wellness effect are difficult to achieve (Pérez, 2011).
Unfortunately, the aforementioned systems for both green walls and green roofs
present several disadvantages in terms of integration, costs and/or harmful effects. A general
low integration between vegetal elements and the structures is observed for most of the
systems. Regarding green roofs, the use of vegetal substrate is a prerequisite to allow the plants,
which force the use of different layers. According to Pérez (2011), seven layers between the roof
structure and the vegetation compose a standard model. The roof needs to be protected by a
waterproofing layer, an insulation layer and a root barrier layer. Furthermore, the protection,
drainage and filter layers should be installed before application of the substrate. Consequently,
a low level of integration is observed between the natural element and the structure due to all
the intermediate layers. Finally, the consequent additional load may reduce the installation of
green roofs on new constructions.
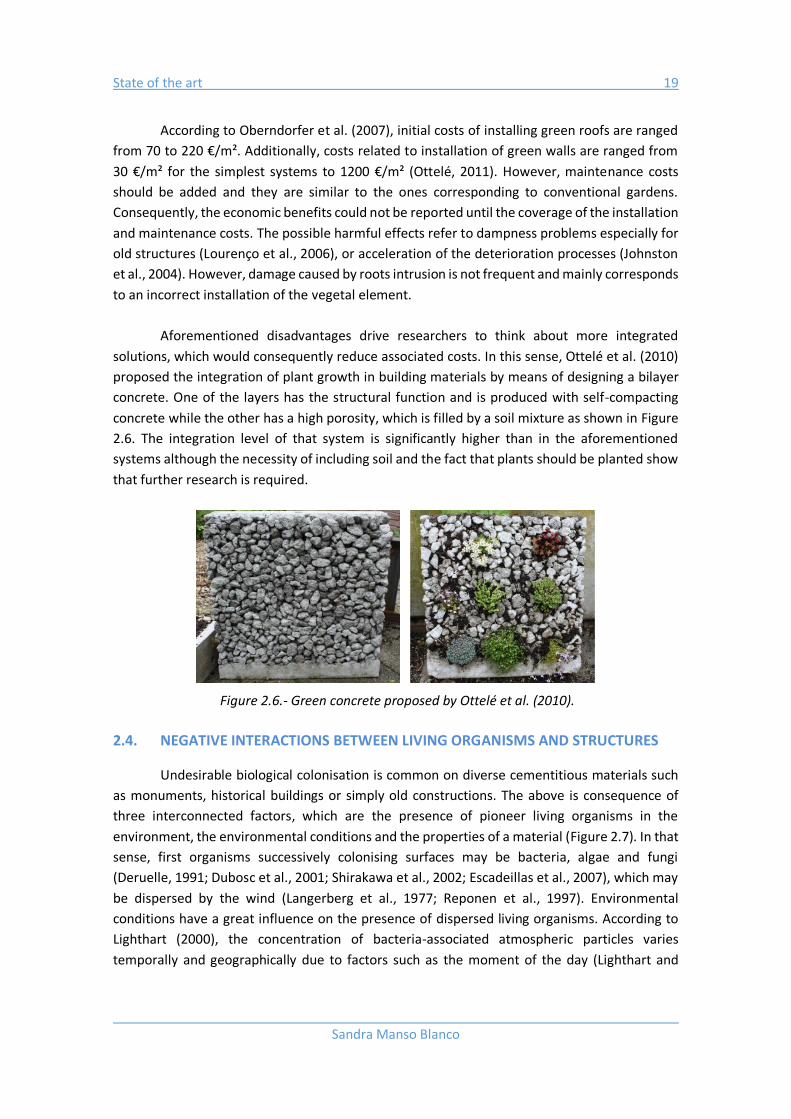
State of the art 19
tyrthfghgf Sandra Manso Blanco
According to Oberndorfer et al. (2007), initial costs of installing green roofs are ranged
from 70 to 220 €/m². Additionally, costs related to installation of green walls are ranged from
30 €/m² for the simplest systems to 1200 €/m² (Ottelé, 2011). However, maintenance costs
should be added and they are similar to the ones corresponding to conventional gardens.
Consequently, the economic benefits could not be reported until the coverage of the installation
and maintenance costs. The possible harmful effects refer to dampness problems especially for
old structures (Lourenço et al., 2006), or acceleration of the deterioration processes (Johnston
et al., 2004). However, damage caused by roots intrusion is not frequent and mainly corresponds
to an incorrect installation of the vegetal element.
Aforementioned disadvantages drive researchers to think about more integrated
solutions, which would consequently reduce associated costs. In this sense, Ottelé et al. (2010)
proposed the integration of plant growth in building materials by means of designing a bilayer
concrete. One of the layers has the structural function and is produced with self-compacting
concrete while the other has a high porosity, which is filled by a soil mixture as shown in Figure
2.6. The integration level of that system is significantly higher than in the aforementioned
systems although the necessity of including soil and the fact that plants should be planted show
that further research is required.
Figure 2.6.- Green concrete proposed by Ottelé et al. (2010).
2.4. NEGATIVE INTERACTIONS BETWEEN LIVING ORGANISMS AND STRUCTURES
Undesirable biological colonisation is common on diverse cementitious materials such
as monuments, historical buildings or simply old constructions. The above is consequence of
three interconnected factors, which are the presence of pioneer living organisms in the
environment, the environmental conditions and the properties of a material (Figure 2.7). In that
sense, first organisms successively colonising surfaces may be bacteria, algae and fungi
(Deruelle, 1991; Dubosc et al., 2001; Shirakawa et al., 2002; Escadeillas et al., 2007), which may
be dispersed by the wind (Langerberg et al., 1977; Reponen et al., 1997). Environmental
conditions have a great influence on the presence of dispersed living organisms. According to
Lighthart (2000), the concentration of bacteria-associated atmospheric particles varies
temporally and geographically due to factors such as the moment of the day (Lighthart and
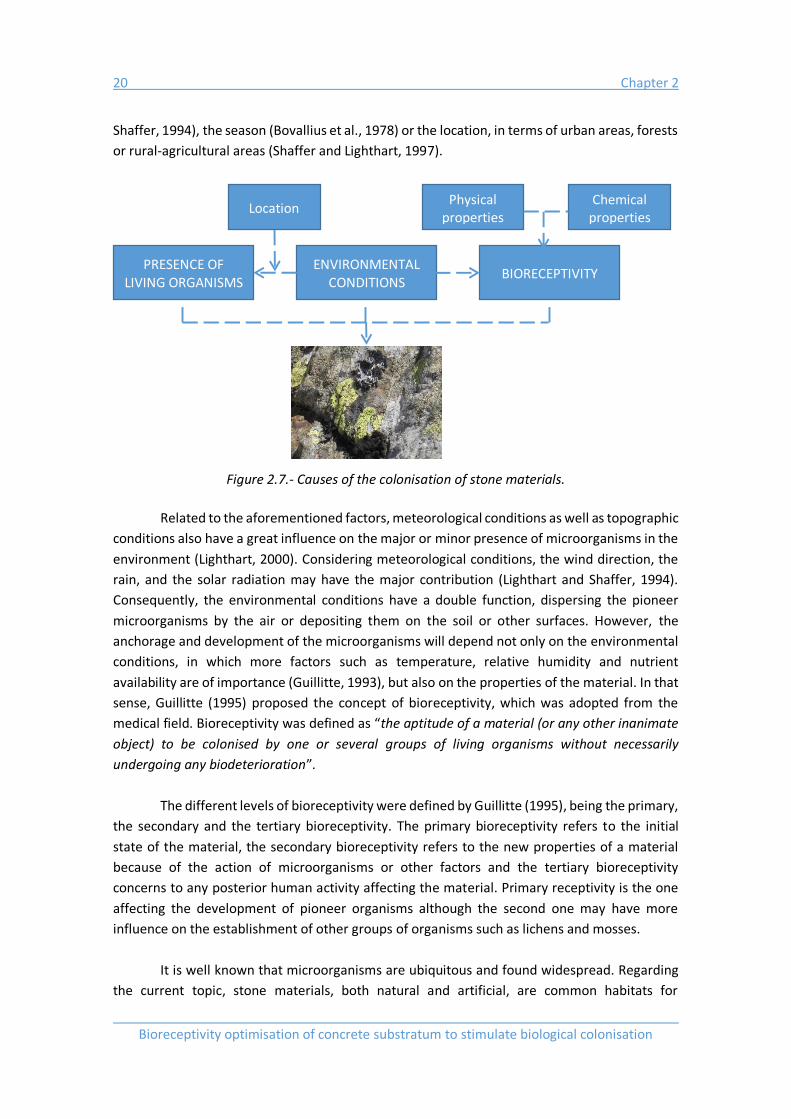
20 Chapter 2
tyrthfghgf Bioreceptivity optimisation of concrete substratum to stimulate biological colonisation
Shaffer, 1994), the season (Bovallius et al., 1978) or the location, in terms of urban areas, forests
or rural-agricultural areas (Shaffer and Lighthart, 1997).
Figure 2.7.- Causes of the colonisation of stone materials.
Related to the aforementioned factors, meteorological conditions as well as topographic
conditions also have a great influence on the major or minor presence of microorganisms in the
environment (Lighthart, 2000). Considering meteorological conditions, the wind direction, the
rain, and the solar radiation may have the major contribution (Lighthart and Shaffer, 1994).
Consequently, the environmental conditions have a double function, dispersing the pioneer
microorganisms by the air or depositing them on the soil or other surfaces. However, the
anchorage and development of the microorganisms will depend not only on the environmental
conditions, in which more factors such as temperature, relative humidity and nutrient
availability are of importance (Guillitte, 1993), but also on the properties of the material. In that
sense, Guillitte (1995) proposed the concept of bioreceptivity, which was adopted from the
medical field. Bioreceptivity was defined as “the aptitude of a material (or any other inanimate
object) to be colonised by one or several groups of living organisms without necessarily
undergoing any biodeterioration”.
The different levels of bioreceptivity were defined by Guillitte (1995), being the primary,
the secondary and the tertiary bioreceptivity. The primary bioreceptivity refers to the initial
state of the material, the secondary bioreceptivity refers to the new properties of a material
because of the action of microorganisms or other factors and the tertiary bioreceptivity
concerns to any posterior human activity affecting the material. Primary receptivity is the one
affecting the development of pioneer organisms although the second one may have more
influence on the establishment of other groups of organisms such as lichens and mosses.
It is well known that microorganisms are ubiquitous and found widespread. Regarding
the current topic, stone materials, both natural and artificial, are common habitats for
PRESENCE OF LIVING ORGANISMS
ENVIRONMENTAL CONDITIONS
BIORECEPTIVITY
Location Chemical
properties Physical
properties
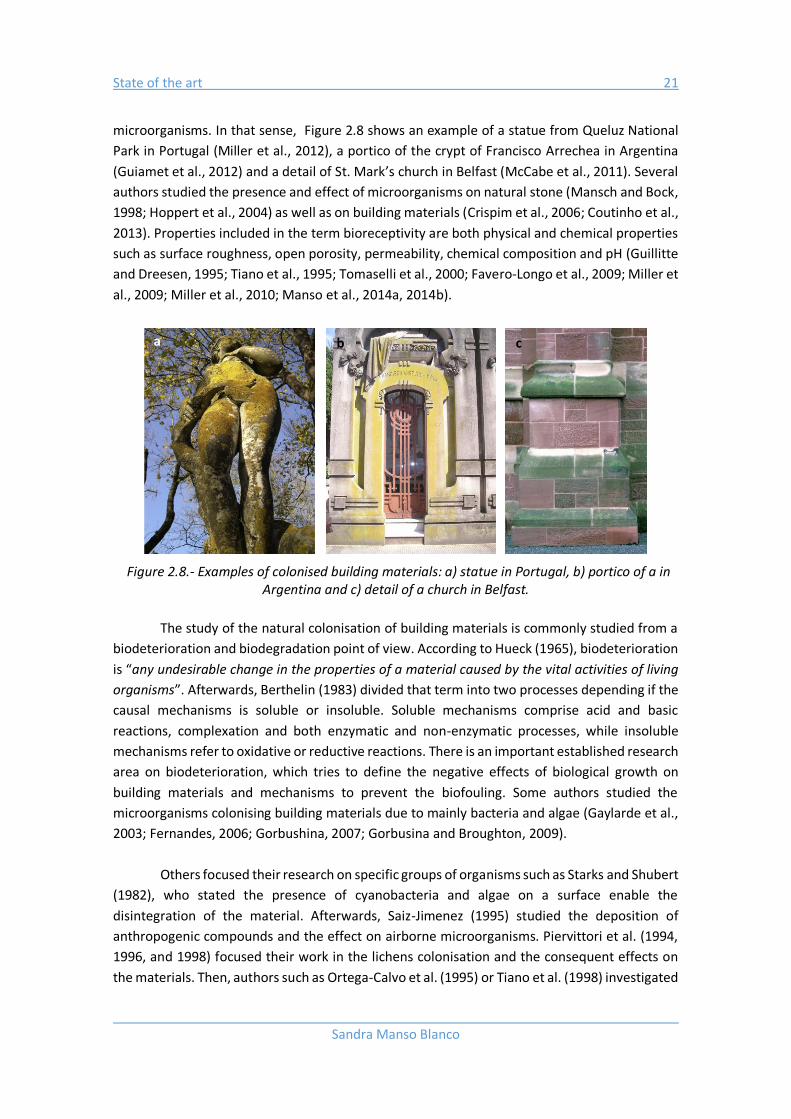
State of the art 21
tyrthfghgf Sandra Manso Blanco
microorganisms. In that sense, Figure 2.8 shows an example of a statue from Queluz National
Park in Portugal (Miller et al., 2012), a portico of the crypt of Francisco Arrechea in Argentina
(Guiamet et al., 2012) and a detail of St. Mark’s church in Belfast (McCabe et al., 2011). Several
authors studied the presence and effect of microorganisms on natural stone (Mansch and Bock,
1998; Hoppert et al., 2004) as well as on building materials (Crispim et al., 2006; Coutinho et al.,
2013). Properties included in the term bioreceptivity are both physical and chemical properties
such as surface roughness, open porosity, permeability, chemical composition and pH (Guillitte
and Dreesen, 1995; Tiano et al., 1995; Tomaselli et al., 2000; Favero-Longo et al., 2009; Miller et
al., 2009; Miller et al., 2010; Manso et al., 2014a, 2014b).
Figure 2.8.- Examples of colonised building materials: a) statue in Portugal, b) portico of a in Argentina and c) detail of a church in Belfast.
The study of the natural colonisation of building materials is commonly studied from a
biodeterioration and biodegradation point of view. According to Hueck (1965), biodeterioration
is “any undesirable change in the properties of a material caused by the vital activities of living
organisms”. Afterwards, Berthelin (1983) divided that term into two processes depending if the
causal mechanisms is soluble or insoluble. Soluble mechanisms comprise acid and basic
reactions, complexation and both enzymatic and non-enzymatic processes, while insoluble
mechanisms refer to oxidative or reductive reactions. There is an important established research
area on biodeterioration, which tries to define the negative effects of biological growth on
building materials and mechanisms to prevent the biofouling. Some authors studied the
microorganisms colonising building materials due to mainly bacteria and algae (Gaylarde et al.,
2003; Fernandes, 2006; Gorbushina, 2007; Gorbusina and Broughton, 2009).
Others focused their research on specific groups of organisms such as Starks and Shubert
(1982), who stated the presence of cyanobacteria and algae on a surface enable the
disintegration of the material. Afterwards, Saiz-Jimenez (1995) studied the deposition of
anthropogenic compounds and the effect on airborne microorganisms. Piervittori et al. (1994,
1996, and 1998) focused their work in the lichens colonisation and the consequent effects on
the materials. Then, authors such as Ortega-Calvo et al. (1995) or Tiano et al. (1998) investigated
a b c

22 Chapter 2
tyrthfghgf Bioreceptivity optimisation of concrete substratum to stimulate biological colonisation
on the detrimental effects of photosynthetic organisms. Favero-Longo et al. (2004) focused their
research on lichens while Macedo et al. (2009) did the same for cyanobacteria and green algae.
Others like De Muynck et al. (2009) evaluated different mechanisms for algal biofouling
prevention. Finally, Cutler and Viles (2010) studied the effects of eukaryotic microorganisms on
stone materials biodeteriortion. The aforementioned authors are some examples although a
longer list could be obtained from the literature.
In summary, many authors do research on colonisation of stone materials and
biodeterioration to identify the involved organisms and their effects on the materials.
Nonetheless, only few of them studied the properties of the materials implicated in that process.
Table 2.3 resumes the main properties of the stone materials studied by most of the authors.
However, some other authors are less critical and suggest biofouling should not be considered
always as a material pathology. For instance, Dukes (1972) and Tiano (1986) stated the only
important damage caused by those organisms is aesthetical. Guillitte (1993) also asserted that
knowledge in terms of bioreceptivity could be also used to stimulate biofouling in specific cases.
Ariño et al. (1995) stated that the biodeterioration and bioprotection are in unstable
equilibrium, which can be unbalanced due to environmental conditions, the substratum and the
colonising organisms.
Table 2.3.- Materials properties studied by several authors
Properties [1] [2] [3] [4] [5] [6] [7] [8] [9] [10] [11] [12]
Chemical
composition • • • • • • • • • •
pH • • • •
Texture • • • • • •
Roughness • • • • • • •
Porosity • • • • • • • • • •
Capillary
coefficient • • • •
Water content • •
Bulk density • •
Dry density •
Grain density •
Permeability •
[1] Guillitte and Dreesen (1995) [5] Barberousse et al. (2006) [9] Giannantonio et al. (2009)
[2] Tiano et al. (1995) [6] Escadeillas et al. (2007) [10] Miller et al. (2006, 2009, 2010)
[3] Papida et al. (2000) [7] De los Ríos et al. (2009) [11] Portillo et al. (2011)
[4] Prieto and Silva (2005) [8] Favero-Longo et al. (2009) [12] Tran et al. (2012)
State of the art 23
tyrthfghgf Sandra Manso Blanco
2.5. CONCLUDING REMARKS
The general positive perception of nature, together with the environmental problems of
big cities, means an increased interest in integration of green areas. However, the rise in
population makes it difficult to increase the surface of parks and gardens in cities. Consequently,
the alternative of covering buildings and other structures with vegetal elements gained more
significance. A big number of systems integrating vegetal elements as building envelopes were
found, showing the importance of incorporation of nature into cities. Even though in most of
the green walls and green roofs the level of integration, the installation and maintenance costs,
and the limitations due to extra load, could be improved. Therefore, to make the optimized and
efficient design of green elements possible, several advances to the state of the art are still
needed.
In order to improve the aforementioned inconvenience, a better understanding of the
properties involved in bioreceptivity, which of them could have a greater role, and the ways to
produce those materials, is needed. As already mentioned, the negative impact of organisms on
building materials should be considered depending mainly on the application.
On the other hand, there are few studies and laboratory results comparing different
materials designed for the purpose, and there is a lack of environmental experimental programs.
Accelerated laboratory tests give a fast approach for comparisons between the effects of
colonisation on different materials by one or few organisms. Nonetheless, the real natural
conditions significantly differ from the controlled laboratory conditions and in reality many
parameters in combination give different results. Verification of that fact as well as a better
understanding of the interactions is also required.

24 Chapter 2
tyrthfghgf Bioreceptivity optimisation of concrete substratum to stimulate biological colonisation
Development of a low-pH cementitious material 25
Sandra Manso Blanco
3. DEVELOPMENT OF A LOW-PH
CEMENTITIOUS MATERIAL
3.1. INTRODUCTION
Despite of the numerous parameters involved in the design of a cementitious material
as a biological substrate, pH was taken as a priority. Two different hydraulic binders were
considered in order to develop a low-pH cementitious material: Ordinary Portland Cement (OPC)
and an acid-base cement. Regarding OPC, the selection was basically based on the wide use of
this material in construction. Then, Magnesium Phosphate Cement (MPC) was chosen from the
group of acid-base cements. The decision was based on the slightly acidic pH as well as
references in the literature about its use in construction (Li et al., 2004; Qiao et al., 2009a;
Formosa et al., 2011).
Naturally, carbonation of OPC is taking place during its service life when this material is
exposed to the environment. Consequently, pH decreases progressively reaching pH values
around 8. For this reason, one of the ways proposed to diminish the pH of the material was
accelerated carbonation. However, this process changes different properties of the material as
it was detailed in the literature. In parallel, a trial to decrease the pH from the beginning was
carried out by means of acid additions. With this aim, an evaluation of acid additions in pH as
well as mechanical properties was conducted.
The experimental program has been carried out in different laboratories: at the
Structure Technology Laboratory Luís Agulló (Polytechnical University of Catalonia), Center for
Research in NanoEngineering (Polytechnical University of Catalonia), Scientific and

26 Chapter 3
Bioreceptivity optimisation of concrete substratum to stimulate biological colonisation
Technological Centers (University of Barcelona) and premises of the company Cementos
Portland Valderrivas.
The main goal pursued in this chapter is to develop a low-pH cementitious material in
order to improve bioreceptivity of building materials. For that, the following specific objectives
are defined:
Evaluate the effect of acidic compounds added to Ordinary Portland Cement (OPC) on
its pH as well as physical-chemical and mechanical properties;
Characterize different Magnesium Phosphate Cement (MPC) formulations to evaluate
their suitability as a building material;
Define a suitable MPC formulation depending on physical-chemical and mechanical
properties.
An experimental program is defined to study and characterize properties of
cementitious materials in section 3.2. In particular, both ways to decrease pH of the final
material are defined as well as tests to prove their suitability. Subsequently, results for OPC and
MPC experimental programs are analysed in sections 3.3 and 3.4 respectively.
3.2. MATERIALS AND METHODS
In the framework of the mentioned objective, the following methodology was
developed. On one hand, evaluation of the effect of acidic additions to OPC properties was
carried out. On the other hand, a complete characterization of different MPC formulations was
developed. Since MPC pH is suitable for the use, an evaluation of the formulations’ suitability as
a cementitious material was necessary Figure 3.1.
Figure 3.1.- Scheme of the experimental program.
METHODOLOGY OF THE EXPERIMENTAL PROGRAM
Effect of acidic additions on pH
and properties of OPC
Weight evolution;
Flexural strengths
(UNE-EN 196-1);
FTIR;
Ultrasonic pulse velocity;
pH hardened specimens.
(Modification UNE 83227)
Characterization of different MPC formulations
Real density (UNE 80105);
Normal consistency, setting times and volume
stability
(UNE-EN 196-3);
Consistency (UNE 80230)
Heat of hydration (Modification UNE-EN 196-9)
Drying shrinkage (ASTM C596)
Chemical analysis (UNE-EN 196-2, UNE-EN 1015-3)
SEM
Common tests: pH (Modification UNE 83227), compressive strength (UNE-EN 196-1) and XRD
Development of a low-pH cementitious material 27
Sandra Manso Blanco
3.2.1. Materials and hydration reactions
Ordinary Portland Cement
Additives used in the fabrication of OPC to decrease its pH were boric acid (H3BO3) and
oxalic acid ((COOH)2 · 2H2O) as a weak and a strong acid respectively. Additionally, oxalic acid is
a diacid considered as a strong acid in its first hydrolysis reaction. These acids were selected on
the basis of previous studies from literature (Demirbaş and Karslioglu, 1995; van Eijk and
Brouwers, 2001; Boncukcuoğlu et al., 2002; Elbeyli et al., 2003; Singh et al., 2003).
Equation 3.1 shows the reaction corresponding to dissolution of boric acid in distilled
water. Additionally, equation 3.2 shows the reaction in presence of calcium, where calcium
diborate is formed.
9.24
3 3 2 3 3( )apk
H BO H O B OH H O [3.1]
24 2 4 2 22[ ( ) ] [ ( ) ] ·2B OH Ca H O Ca B OH H O [3.2]
Van Eijk and Brouwers (2001) modelled and reconfirmed the coating theory and models
proposed by Yousuf et al. (1995) and Cocke et al. (1995). According to van Eijk, the initial
presence of borates in the mixing water produces an increment of borates. As a result, the
equilibrium of the reaction 3.2 is displaced to the right and the hydration product, calcium
diborate, precipitates. The above hydration product has a low solubility (5.4·10-7 mole/l) and this
fact avoids the dissolution of anhydrous cement since the precipitation is on the cements
particles. Accordingly, no dissolution of cement particles involves no releasing of hydroxyl ions,
responsible of the first increase of pH of the mixture. The main consequence is the delay of the
hydration process.
Furthermore, Lieber and Richartz (1972) defined previously that depending on the
amount of acid added, a higher or lower degree of coverage of the cement particles is achieved.
Therefore, the delay is increasing until the inhibition of the hydration process. In this regard, van
Eijk and Brouwers (2001) obtained from their model that this inhibition takes place when
additions higher than 1 % over cement weight (ocw) are used, due to the total coverage of the
cement particles. However, when amount of boric acid added is not enough to stop the
hydration process, portlandite is progressively forming. This fact causes an increment in pH
inducing redissolution of calcium diborate and the restoration of the hydration process.
Regarding additions of oxalic acid, a different mechanism of action is described. In
particular, oxalic acid acts as a set accelerating additive and dissolution reactions without
(equation 3.3 and 3.4) and with presence of calcium (equation 3.5) as follows:
1.27
2 2 4 2 2 4 3
apkH C O H O HC O H O [3.3]
28 Chapter 3
Bioreceptivity optimisation of concrete substratum to stimulate biological colonisation
4,27 22 4 2 2 4 3
apkHC O H O C O H O [3.4]
2 2
2 4 2 2 4 2C O Ca H O CaC O H O [3.5]
Taylor (1990) described that this acid affects C3S, at the beginning of the hydration
process. Oxalate tends to combine quickly with free calcium ions forming calcium oxalate. This
reaction product precipitates maintaining low calcium levels until total reaction of oxalates.
Furthermore, this acid is also known for its effect as a consumer of water and consequently,
increases in amount of acid additions cause reductions in workability.
Additionally, Ramachandran (1976) suggested that additions higher than 0.1 % cause
acceleration of aluminates hydration. Then, silicates hydration is subsequently delayed
producing a postponement of the induction period appearance. However, different mechanisms
are supposed to contribute, mainly the permeability of the precipitation product and
consequently its solubility (9.5·10-5 mole/l) and consumption of available calcium.
Magnesium Phosphate Cement
Regarding MPC, three compounds were used to produce the specimens. These
cementitious materials are mainly produced by mixture of magnesium oxide and a phosphate
source. For this research, Magnesium Oxide with low reactivity (MgO), Ammonium Dihydrogen
Phosphate (NH4H2PO4, ADP) and borax (Na2B4O7·10H2O), as a retarder, were used.
According to Yang and Wu (1999), hydration of MPC with addition of borax starts with a
fast dissolution of borax and the ADP in the mixing water. Moreover, this fact causes a drop in
the pH of the mixture (equations 3.6 and 3.7).
2
2 4 7 2 4 7 210 2 10Na B O H O Na B O H O [3.6]
4 2 4 4 2 4
2 4 4
22 4 4
NH H PO NH H PO
H PO HPO H
H PO PO 2H
[3.7]
B4O72- ions are absorbed on the periclase surface and, subsequently, borate compounds
cover them. This fact hinders the contact between NH4+ and H2PO4
- with the periclase, delaying
the hydration process. However, since borax does not act as an inhibitor, NH4+ and H2PO4
- diffuse
through the borates covering the magnesium and formation of an amorphous gel occurs. Then,
the gel starts to crystallize destroying the borates of magnesium by volumetric expansion. From
this moment on NH4+, H2PO4
- and Mg2+ react and different phosphate hydrates cover all the
particles. The main hydration product is struvite (NH4MgPO4·6H2O) as shown in equation 3.8.
4 2 4 2 4 4 24 6MgO NH H PO H O NH MgPO H O [3.8]
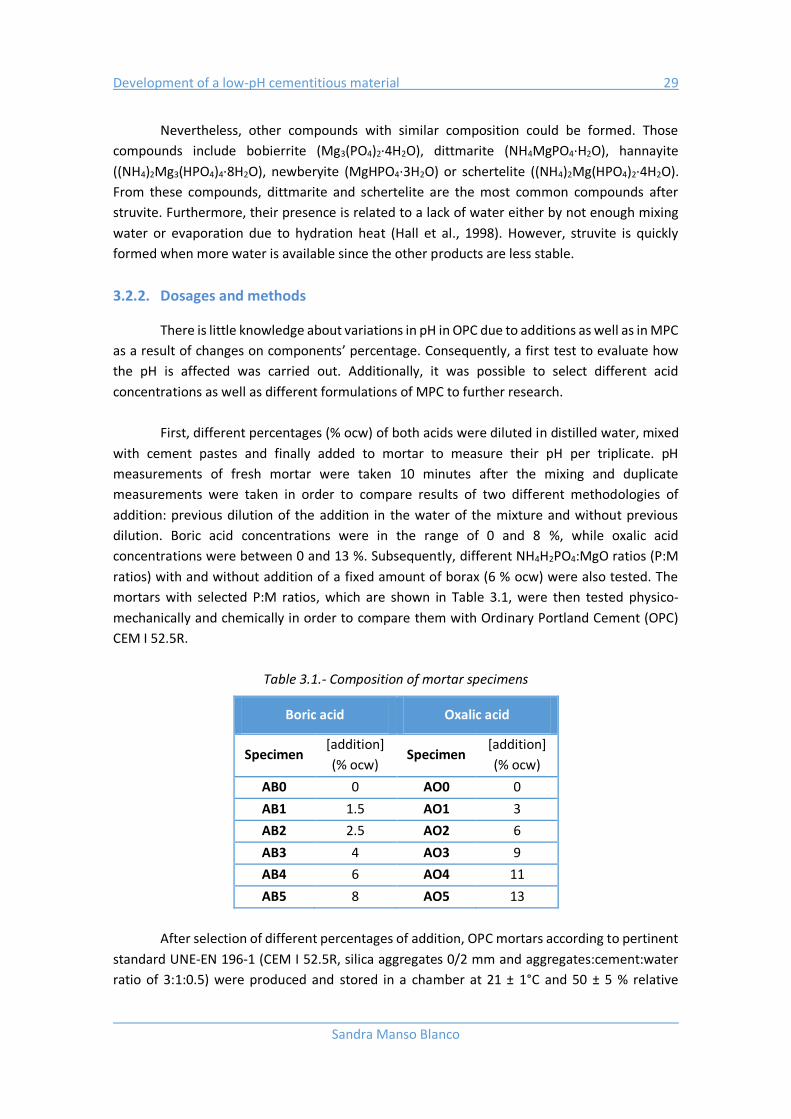
Development of a low-pH cementitious material 29
Sandra Manso Blanco
Nevertheless, other compounds with similar composition could be formed. Those
compounds include bobierrite (Mg3(PO4)2·4H2O), dittmarite (NH4MgPO4·H2O), hannayite
((NH4)2Mg3(HPO4)4·8H2O), newberyite (MgHPO4·3H2O) or schertelite ((NH4)2Mg(HPO4)2·4H2O).
From these compounds, dittmarite and schertelite are the most common compounds after
struvite. Furthermore, their presence is related to a lack of water either by not enough mixing
water or evaporation due to hydration heat (Hall et al., 1998). However, struvite is quickly
formed when more water is available since the other products are less stable.
3.2.2. Dosages and methods
There is little knowledge about variations in pH in OPC due to additions as well as in MPC
as a result of changes on components’ percentage. Consequently, a first test to evaluate how
the pH is affected was carried out. Additionally, it was possible to select different acid
concentrations as well as different formulations of MPC to further research.
First, different percentages (% ocw) of both acids were diluted in distilled water, mixed
with cement pastes and finally added to mortar to measure their pH per triplicate. pH
measurements of fresh mortar were taken 10 minutes after the mixing and duplicate
measurements were taken in order to compare results of two different methodologies of
addition: previous dilution of the addition in the water of the mixture and without previous
dilution. Boric acid concentrations were in the range of 0 and 8 %, while oxalic acid
concentrations were between 0 and 13 %. Subsequently, different NH4H2PO4:MgO ratios (P:M
ratios) with and without addition of a fixed amount of borax (6 % ocw) were also tested. The
mortars with selected P:M ratios, which are shown in Table 3.1, were then tested physico-
mechanically and chemically in order to compare them with Ordinary Portland Cement (OPC)
CEM I 52.5R.
Table 3.1.- Composition of mortar specimens
Boric acid Oxalic acid
Specimen [addition]
(% ocw) Specimen
[addition]
(% ocw)
AB0 0 AO0 0
AB1 1.5 AO1 3
AB2 2.5 AO2 6
AB3 4 AO3 9
AB4 6 AO4 11
AB5 8 AO5 13
After selection of different percentages of addition, OPC mortars according to pertinent
standard UNE-EN 196-1 (CEM I 52.5R, silica aggregates 0/2 mm and aggregates:cement:water
ratio of 3:1:0.5) were produced and stored in a chamber at 21 ± 1°C and 50 ± 5 % relative
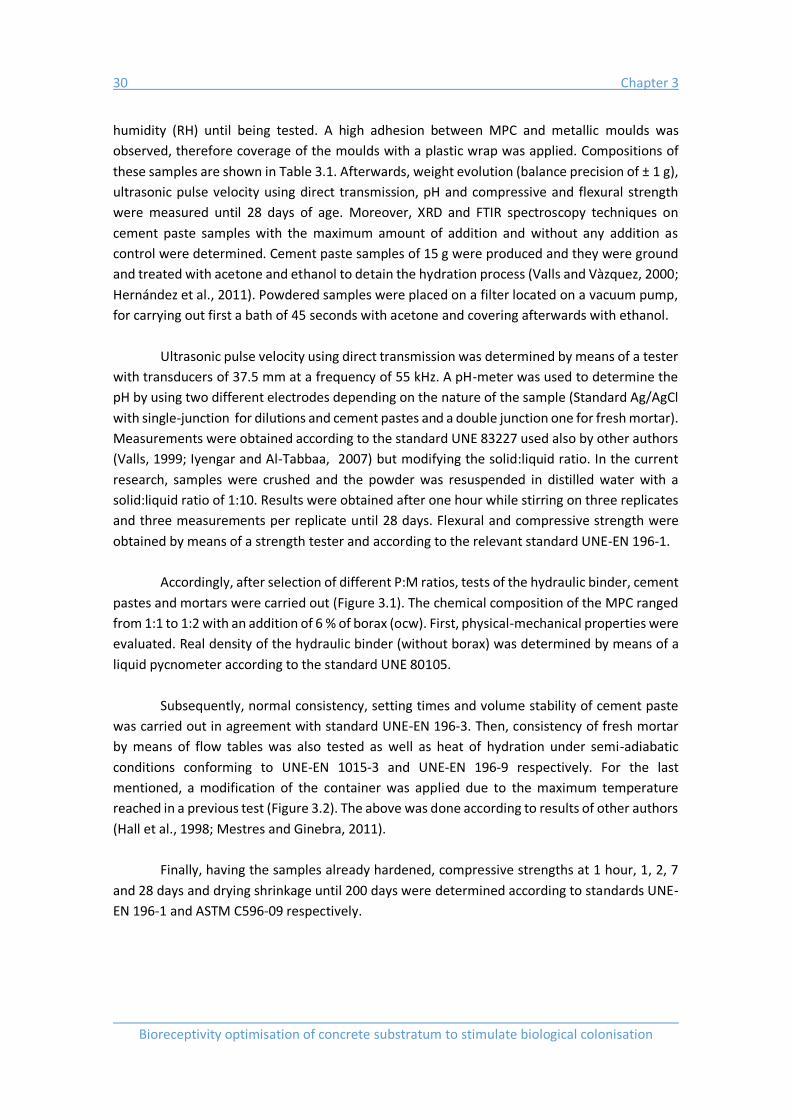
30 Chapter 3
Bioreceptivity optimisation of concrete substratum to stimulate biological colonisation
humidity (RH) until being tested. A high adhesion between MPC and metallic moulds was
observed, therefore coverage of the moulds with a plastic wrap was applied. Compositions of
these samples are shown in Table 3.1. Afterwards, weight evolution (balance precision of ± 1 g),
ultrasonic pulse velocity using direct transmission, pH and compressive and flexural strength
were measured until 28 days of age. Moreover, XRD and FTIR spectroscopy techniques on
cement paste samples with the maximum amount of addition and without any addition as
control were determined. Cement paste samples of 15 g were produced and they were ground
and treated with acetone and ethanol to detain the hydration process (Valls and Vàzquez, 2000;
Hernández et al., 2011). Powdered samples were placed on a filter located on a vacuum pump,
for carrying out first a bath of 45 seconds with acetone and covering afterwards with ethanol.
Ultrasonic pulse velocity using direct transmission was determined by means of a tester
with transducers of 37.5 mm at a frequency of 55 kHz. A pH-meter was used to determine the
pH by using two different electrodes depending on the nature of the sample (Standard Ag/AgCl
with single-junction for dilutions and cement pastes and a double junction one for fresh mortar).
Measurements were obtained according to the standard UNE 83227 used also by other authors
(Valls, 1999; Iyengar and Al-Tabbaa, 2007) but modifying the solid:liquid ratio. In the current
research, samples were crushed and the powder was resuspended in distilled water with a
solid:liquid ratio of 1:10. Results were obtained after one hour while stirring on three replicates
and three measurements per replicate until 28 days. Flexural and compressive strength were
obtained by means of a strength tester and according to the relevant standard UNE-EN 196-1.
Accordingly, after selection of different P:M ratios, tests of the hydraulic binder, cement
pastes and mortars were carried out (Figure 3.1). The chemical composition of the MPC ranged
from 1:1 to 1:2 with an addition of 6 % of borax (ocw). First, physical-mechanical properties were
evaluated. Real density of the hydraulic binder (without borax) was determined by means of a
liquid pycnometer according to the standard UNE 80105.
Subsequently, normal consistency, setting times and volume stability of cement paste
was carried out in agreement with standard UNE-EN 196-3. Then, consistency of fresh mortar
by means of flow tables was also tested as well as heat of hydration under semi-adiabatic
conditions conforming to UNE-EN 1015-3 and UNE-EN 196-9 respectively. For the last
mentioned, a modification of the container was applied due to the maximum temperature
reached in a previous test (Figure 3.2). The above was done according to results of other authors
(Hall et al., 1998; Mestres and Ginebra, 2011).
Finally, having the samples already hardened, compressive strengths at 1 hour, 1, 2, 7
and 28 days and drying shrinkage until 200 days were determined according to standards UNE-
EN 196-1 and ASTM C596-09 respectively.

Development of a low-pH cementitious material 31
Sandra Manso Blanco
Figure 3.2.- General (a) and detailed (b) view of the heat of hydration test.
Figure 3.3.- Diagram of the chemical tests carried out.
3.3. RESULTS AND ANALYSIS RELATED TO ACID ADDITIONS IN OPC
This particular section includes all the results obtained in the OPC experimental
program. As mentioned before, the purpose was to clarify the effect of boric and oxalic acid
additions on OPC properties as was shown in Figure 3.1.
a b
CHEMICAL TESTS
WET CHEMICAL METHODS INSTRUMENTAL METHODS
SiO2
R2O3
CaO
MgO
SO3 Cl-
L.I.
XRD C-H-N-Hg Analyser
X-Ray spectrometry
C
N
H
Hg Cr VI
UNE-EN 196-2:2006 UNE 80230:2010
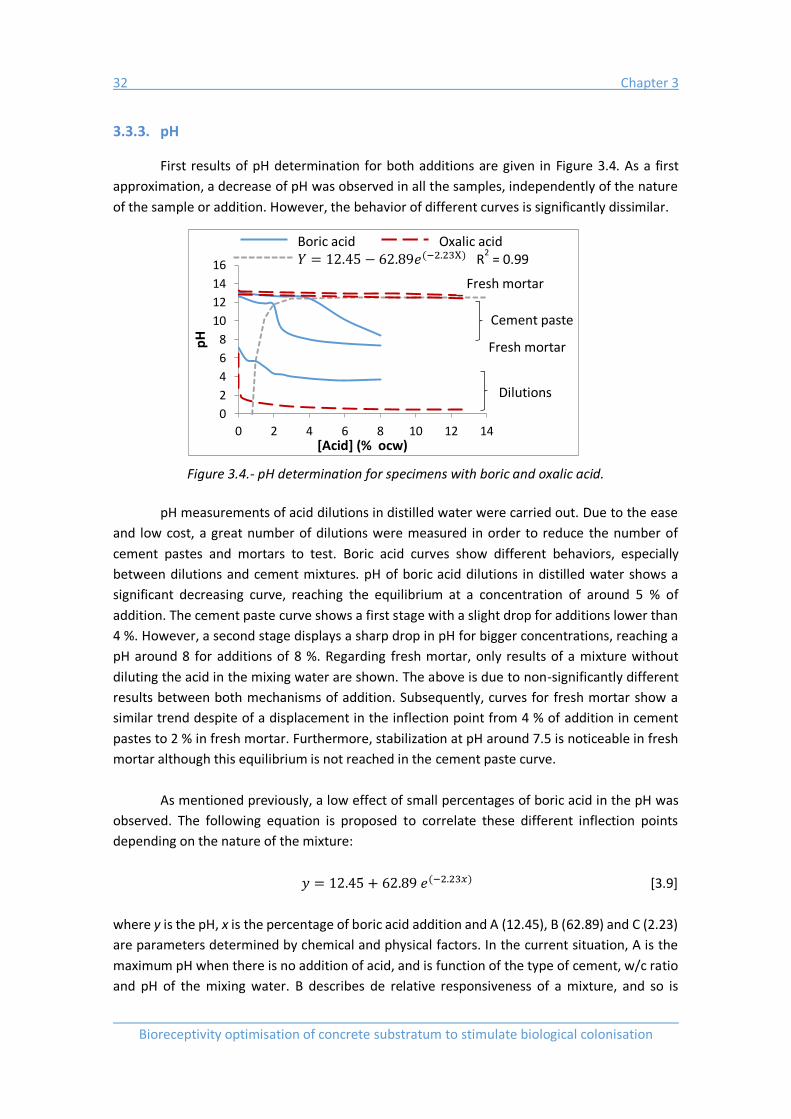
32 Chapter 3
Bioreceptivity optimisation of concrete substratum to stimulate biological colonisation
3.3.3. pH
First results of pH determination for both additions are given in Figure 3.4. As a first
approximation, a decrease of pH was observed in all the samples, independently of the nature
of the sample or addition. However, the behavior of different curves is significantly dissimilar.
Figure 3.4.- pH determination for specimens with boric and oxalic acid.
pH measurements of acid dilutions in distilled water were carried out. Due to the ease
and low cost, a great number of dilutions were measured in order to reduce the number of
cement pastes and mortars to test. Boric acid curves show different behaviors, especially
between dilutions and cement mixtures. pH of boric acid dilutions in distilled water shows a
significant decreasing curve, reaching the equilibrium at a concentration of around 5 % of
addition. The cement paste curve shows a first stage with a slight drop for additions lower than
4 %. However, a second stage displays a sharp drop in pH for bigger concentrations, reaching a
pH around 8 for additions of 8 %. Regarding fresh mortar, only results of a mixture without
diluting the acid in the mixing water are shown. The above is due to non-significantly different
results between both mechanisms of addition. Subsequently, curves for fresh mortar show a
similar trend despite of a displacement in the inflection point from 4 % of addition in cement
pastes to 2 % in fresh mortar. Furthermore, stabilization at pH around 7.5 is noticeable in fresh
mortar although this equilibrium is not reached in the cement paste curve.
As mentioned previously, a low effect of small percentages of boric acid in the pH was
observed. The following equation is proposed to correlate these different inflection points
depending on the nature of the mixture:
𝑦 = 12.45 + 62.89 𝑒(−2.23𝑥) [3.9]
where y is the pH, x is the percentage of boric acid addition and A (12.45), B (62.89) and C (2.23)
are parameters determined by chemical and physical factors. In the current situation, A is the
maximum pH when there is no addition of acid, and is function of the type of cement, w/c ratio
and pH of the mixing water. B describes de relative responsiveness of a mixture, and so is
0
2
4
6
8
10
12
14
16
0 2 4 6 8 10 12 14
pH
[Acid] (% ocw)
Dilutions
Fresh mortar
Fresh mortar
Cement paste
𝑌 = 12.45 − 62.89𝑒(−2.23X) R2 = 0.99
Boric acid Oxalic acid
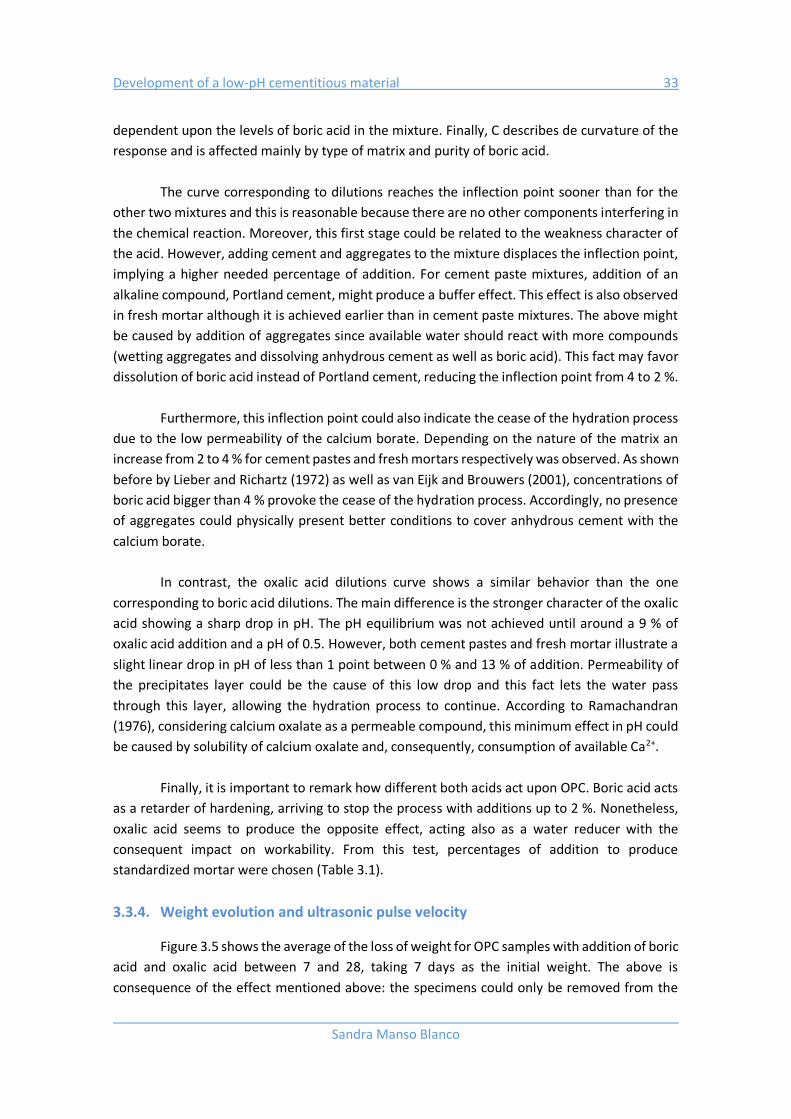
Development of a low-pH cementitious material 33
Sandra Manso Blanco
dependent upon the levels of boric acid in the mixture. Finally, C describes de curvature of the
response and is affected mainly by type of matrix and purity of boric acid.
The curve corresponding to dilutions reaches the inflection point sooner than for the
other two mixtures and this is reasonable because there are no other components interfering in
the chemical reaction. Moreover, this first stage could be related to the weakness character of
the acid. However, adding cement and aggregates to the mixture displaces the inflection point,
implying a higher needed percentage of addition. For cement paste mixtures, addition of an
alkaline compound, Portland cement, might produce a buffer effect. This effect is also observed
in fresh mortar although it is achieved earlier than in cement paste mixtures. The above might
be caused by addition of aggregates since available water should react with more compounds
(wetting aggregates and dissolving anhydrous cement as well as boric acid). This fact may favor
dissolution of boric acid instead of Portland cement, reducing the inflection point from 4 to 2 %.
Furthermore, this inflection point could also indicate the cease of the hydration process
due to the low permeability of the calcium borate. Depending on the nature of the matrix an
increase from 2 to 4 % for cement pastes and fresh mortars respectively was observed. As shown
before by Lieber and Richartz (1972) as well as van Eijk and Brouwers (2001), concentrations of
boric acid bigger than 4 % provoke the cease of the hydration process. Accordingly, no presence
of aggregates could physically present better conditions to cover anhydrous cement with the
calcium borate.
In contrast, the oxalic acid dilutions curve shows a similar behavior than the one
corresponding to boric acid dilutions. The main difference is the stronger character of the oxalic
acid showing a sharp drop in pH. The pH equilibrium was not achieved until around a 9 % of
oxalic acid addition and a pH of 0.5. However, both cement pastes and fresh mortar illustrate a
slight linear drop in pH of less than 1 point between 0 % and 13 % of addition. Permeability of
the precipitates layer could be the cause of this low drop and this fact lets the water pass
through this layer, allowing the hydration process to continue. According to Ramachandran
(1976), considering calcium oxalate as a permeable compound, this minimum effect in pH could
be caused by solubility of calcium oxalate and, consequently, consumption of available Ca2+.
Finally, it is important to remark how different both acids act upon OPC. Boric acid acts
as a retarder of hardening, arriving to stop the process with additions up to 2 %. Nonetheless,
oxalic acid seems to produce the opposite effect, acting also as a water reducer with the
consequent impact on workability. From this test, percentages of addition to produce
standardized mortar were chosen (Table 3.1).
3.3.4. Weight evolution and ultrasonic pulse velocity
Figure 3.5 shows the average of the loss of weight for OPC samples with addition of boric
acid and oxalic acid between 7 and 28, taking 7 days as the initial weight. The above is
consequence of the effect mentioned above: the specimens could only be removed from the
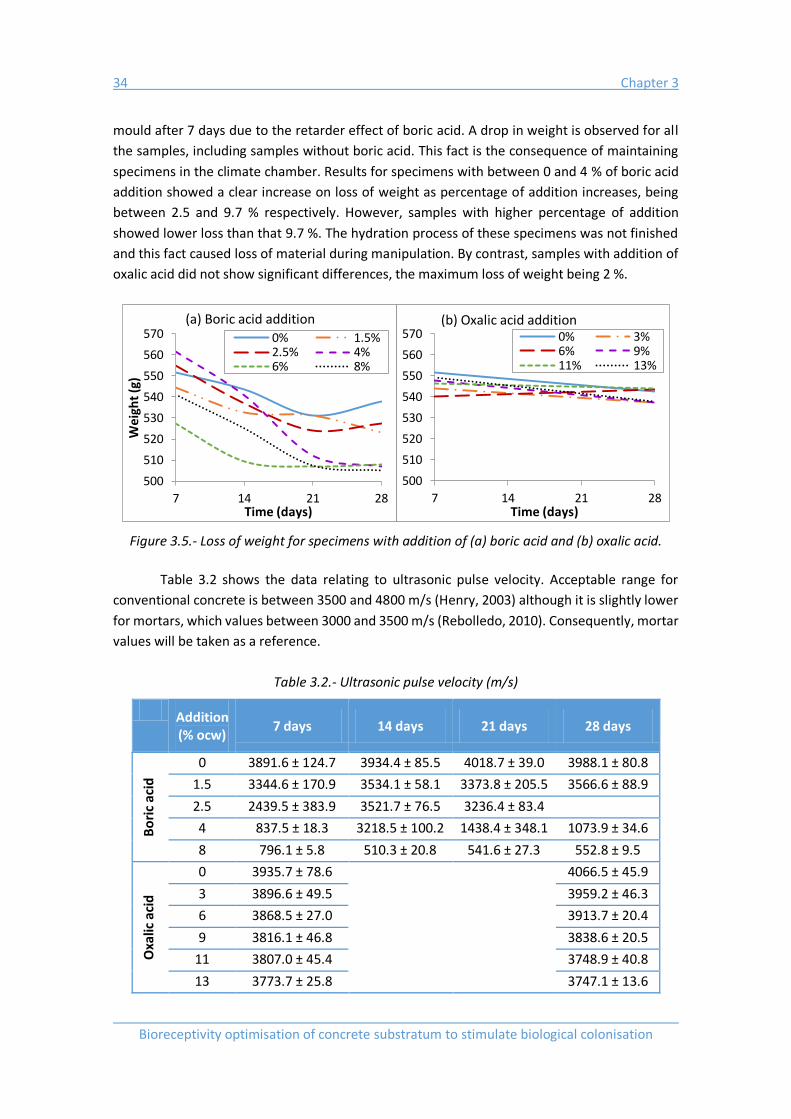
34 Chapter 3
Bioreceptivity optimisation of concrete substratum to stimulate biological colonisation
mould after 7 days due to the retarder effect of boric acid. A drop in weight is observed for all
the samples, including samples without boric acid. This fact is the consequence of maintaining
specimens in the climate chamber. Results for specimens with between 0 and 4 % of boric acid
addition showed a clear increase on loss of weight as percentage of addition increases, being
between 2.5 and 9.7 % respectively. However, samples with higher percentage of addition
showed lower loss than that 9.7 %. The hydration process of these specimens was not finished
and this fact caused loss of material during manipulation. By contrast, samples with addition of
oxalic acid did not show significant differences, the maximum loss of weight being 2 %.
Figure 3.5.- Loss of weight for specimens with addition of (a) boric acid and (b) oxalic acid.
Table 3.2 shows the data relating to ultrasonic pulse velocity. Acceptable range for
conventional concrete is between 3500 and 4800 m/s (Henry, 2003) although it is slightly lower
for mortars, which values between 3000 and 3500 m/s (Rebolledo, 2010). Consequently, mortar
values will be taken as a reference.
Table 3.2.- Ultrasonic pulse velocity (m/s)
Addition (% ocw)
7 days 14 days 21 days 28 days
Bo
ric
acid
0 3891.6 ± 124.7 3934.4 ± 85.5 4018.7 ± 39.0 3988.1 ± 80.8
1.5 3344.6 ± 170.9 3534.1 ± 58.1 3373.8 ± 205.5 3566.6 ± 88.9
2.5 2439.5 ± 383.9 3521.7 ± 76.5 3236.4 ± 83.4
4 837.5 ± 18.3 3218.5 ± 100.2 1438.4 ± 348.1 1073.9 ± 34.6
8 796.1 ± 5.8 510.3 ± 20.8 541.6 ± 27.3 552.8 ± 9.5
Oxa
lic a
cid
0 3935.7 ± 78.6 4066.5 ± 45.9
3 3896.6 ± 49.5 3959.2 ± 46.3
6 3868.5 ± 27.0 3913.7 ± 20.4
9 3816.1 ± 46.8 3838.6 ± 20.5
11 3807.0 ± 45.4 3748.9 ± 40.8
13 3773.7 ± 25.8 3747.1 ± 13.6
500
510
520
530
540
550
560
570
7 14 21 28Time (days)
0% 3%6% 9%11% 13%
500
510
520
530
540
550
560
570
7 14 21 28
We
igh
t (g
)
Time (days)
0% 1.5%2.5% 4%6% 8%
(b) Oxalic acid addition (a) Boric acid addition
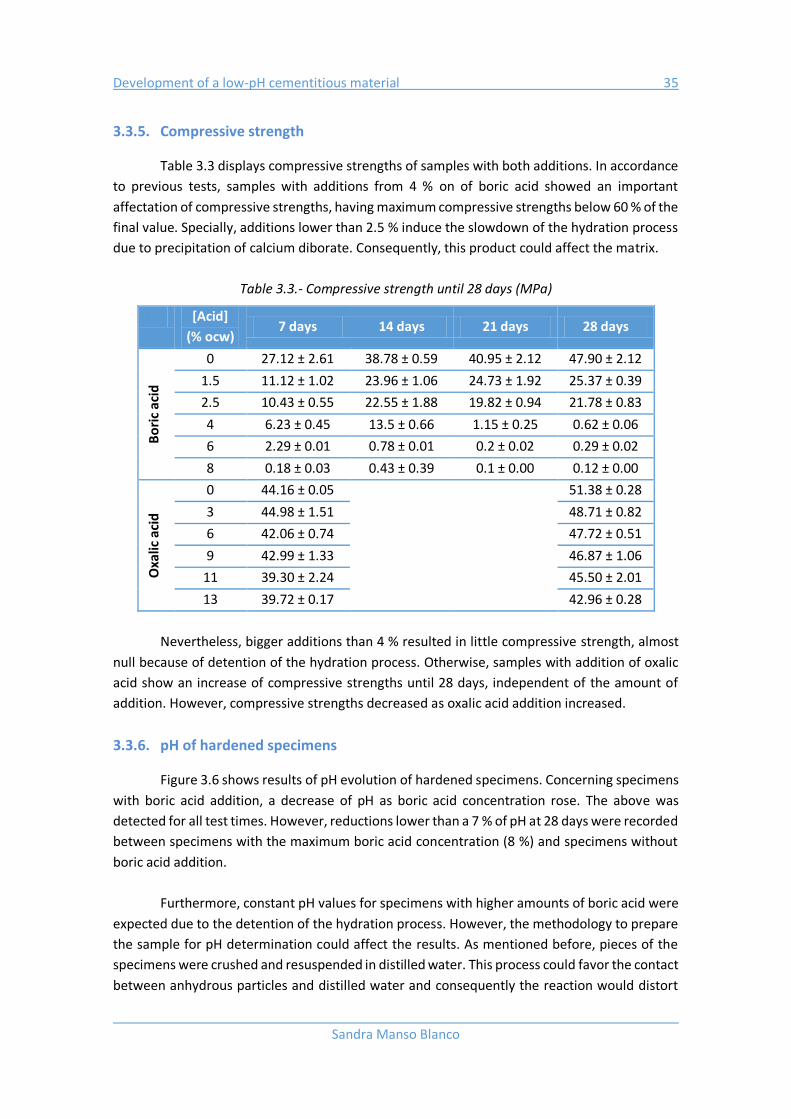
Development of a low-pH cementitious material 35
Sandra Manso Blanco
3.3.5. Compressive strength
Table 3.3 displays compressive strengths of samples with both additions. In accordance
to previous tests, samples with additions from 4 % on of boric acid showed an important
affectation of compressive strengths, having maximum compressive strengths below 60 % of the
final value. Specially, additions lower than 2.5 % induce the slowdown of the hydration process
due to precipitation of calcium diborate. Consequently, this product could affect the matrix.
Table 3.3.- Compressive strength until 28 days (MPa)
[Acid]
(% ocw) 7 days 14 days 21 days 28 days
Bo
ric
acid
0 27.12 ± 2.61 38.78 ± 0.59 40.95 ± 2.12 47.90 ± 2.12
1.5 11.12 ± 1.02 23.96 ± 1.06 24.73 ± 1.92 25.37 ± 0.39
2.5 10.43 ± 0.55 22.55 ± 1.88 19.82 ± 0.94 21.78 ± 0.83
4 6.23 ± 0.45 13.5 ± 0.66 1.15 ± 0.25 0.62 ± 0.06
6 2.29 ± 0.01 0.78 ± 0.01 0.2 ± 0.02 0.29 ± 0.02
8 0.18 ± 0.03 0.43 ± 0.39 0.1 ± 0.00 0.12 ± 0.00
Oxa
lic a
cid
0 44.16 ± 0.05 51.38 ± 0.28
3 44.98 ± 1.51 48.71 ± 0.82
6 42.06 ± 0.74 47.72 ± 0.51
9 42.99 ± 1.33 46.87 ± 1.06
11 39.30 ± 2.24 45.50 ± 2.01
13 39.72 ± 0.17 42.96 ± 0.28
Nevertheless, bigger additions than 4 % resulted in little compressive strength, almost
null because of detention of the hydration process. Otherwise, samples with addition of oxalic
acid show an increase of compressive strengths until 28 days, independent of the amount of
addition. However, compressive strengths decreased as oxalic acid addition increased.
3.3.6. pH of hardened specimens
Figure 3.6 shows results of pH evolution of hardened specimens. Concerning specimens
with boric acid addition, a decrease of pH as boric acid concentration rose. The above was
detected for all test times. However, reductions lower than a 7 % of pH at 28 days were recorded
between specimens with the maximum boric acid concentration (8 %) and specimens without
boric acid addition.
Furthermore, constant pH values for specimens with higher amounts of boric acid were
expected due to the detention of the hydration process. However, the methodology to prepare
the sample for pH determination could affect the results. As mentioned before, pieces of the
specimens were crushed and resuspended in distilled water. This process could favor the contact
between anhydrous particles and distilled water and consequently the reaction would distort
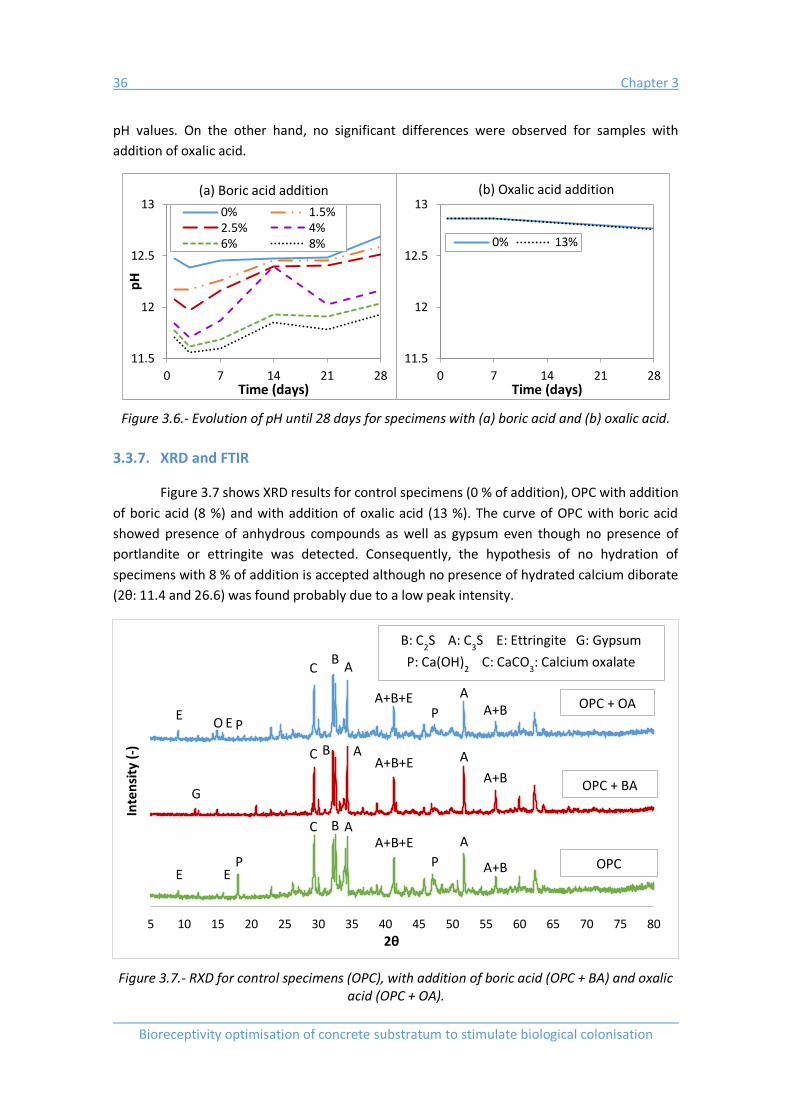
36 Chapter 3
Bioreceptivity optimisation of concrete substratum to stimulate biological colonisation
pH values. On the other hand, no significant differences were observed for samples with
addition of oxalic acid.
Figure 3.6.- Evolution of pH until 28 days for specimens with (a) boric acid and (b) oxalic acid.
3.3.7. XRD and FTIR
Figure 3.7 shows XRD results for control specimens (0 % of addition), OPC with addition
of boric acid (8 %) and with addition of oxalic acid (13 %). The curve of OPC with boric acid
showed presence of anhydrous compounds as well as gypsum even though no presence of
portlandite or ettringite was detected. Consequently, the hypothesis of no hydration of
specimens with 8 % of addition is accepted although no presence of hydrated calcium diborate
(2θ: 11.4 and 26.6) was found probably due to a low peak intensity.
Figure 3.7.- RXD for control specimens (OPC), with addition of boric acid (OPC + BA) and oxalic acid (OPC + OA).
11.5
12
12.5
13
0 7 14 21 28
pH
Time (days)
0% 1.5%2.5% 4%6% 8%
11.5
12
12.5
13
0 7 14 21 28Time (days)
0% 13%
(b) Oxalic acid addition (a) Boric acid addition
5 10 15 20 25 30 35 40 45 50 55 60 65 70 75 80
Inte
nsi
ty (
-)
2θ
OPC
OPC + BA
OPC + OA
E
B: C2S A: C
3S E: Ettringite G: Gypsum
P: Ca(OH)2 C: CaCO
3: Calcium oxalate
E O E P
E P
G
C
C
C
B
B
B
A
A
A
A+B+E
A+B+E
A+B+E
P
P
A
A
A
A+B
A+B
A+B
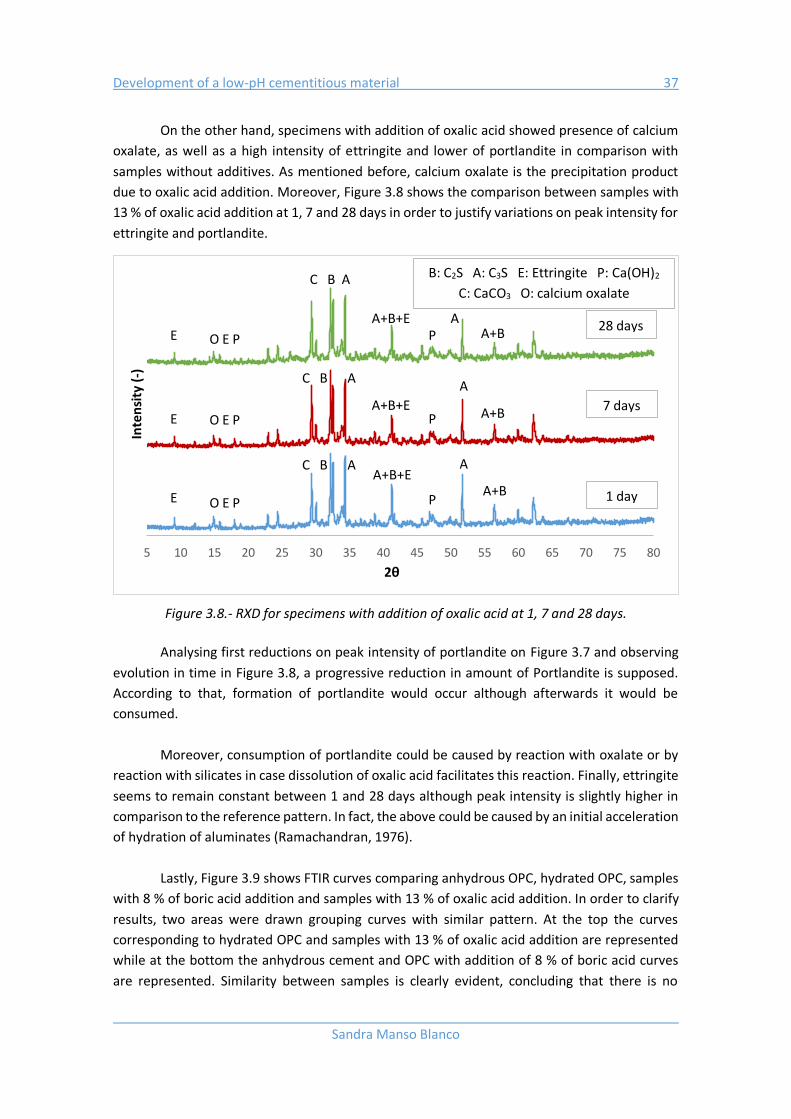
Development of a low-pH cementitious material 37
Sandra Manso Blanco
On the other hand, specimens with addition of oxalic acid showed presence of calcium
oxalate, as well as a high intensity of ettringite and lower of portlandite in comparison with
samples without additives. As mentioned before, calcium oxalate is the precipitation product
due to oxalic acid addition. Moreover, Figure 3.8 shows the comparison between samples with
13 % of oxalic acid addition at 1, 7 and 28 days in order to justify variations on peak intensity for
ettringite and portlandite.
Figure 3.8.- RXD for specimens with addition of oxalic acid at 1, 7 and 28 days.
Analysing first reductions on peak intensity of portlandite on Figure 3.7 and observing
evolution in time in Figure 3.8, a progressive reduction in amount of Portlandite is supposed.
According to that, formation of portlandite would occur although afterwards it would be
consumed.
Moreover, consumption of portlandite could be caused by reaction with oxalate or by
reaction with silicates in case dissolution of oxalic acid facilitates this reaction. Finally, ettringite
seems to remain constant between 1 and 28 days although peak intensity is slightly higher in
comparison to the reference pattern. In fact, the above could be caused by an initial acceleration
of hydration of aluminates (Ramachandran, 1976).
Lastly, Figure 3.9 shows FTIR curves comparing anhydrous OPC, hydrated OPC, samples
with 8 % of boric acid addition and samples with 13 % of oxalic acid addition. In order to clarify
results, two areas were drawn grouping curves with similar pattern. At the top the curves
corresponding to hydrated OPC and samples with 13 % of oxalic acid addition are represented
while at the bottom the anhydrous cement and OPC with addition of 8 % of boric acid curves
are represented. Similarity between samples is clearly evident, concluding that there is no
5 10 15 20 25 30 35 40 45 50 55 60 65 70 75 80
Inte
nsi
ty (
-)
2θ
1 day
7 days
28 days
E
E O E P
E O E P
O E P
C B A
C B A
C B A
A+B+E
A+B+E
A+B+E
P
P
P
A
A
A
A+B
A+B
A+B
B: C2S A: C3S E: Ettringite P: Ca(OH)2
C: CaCO3 O: calcium oxalate
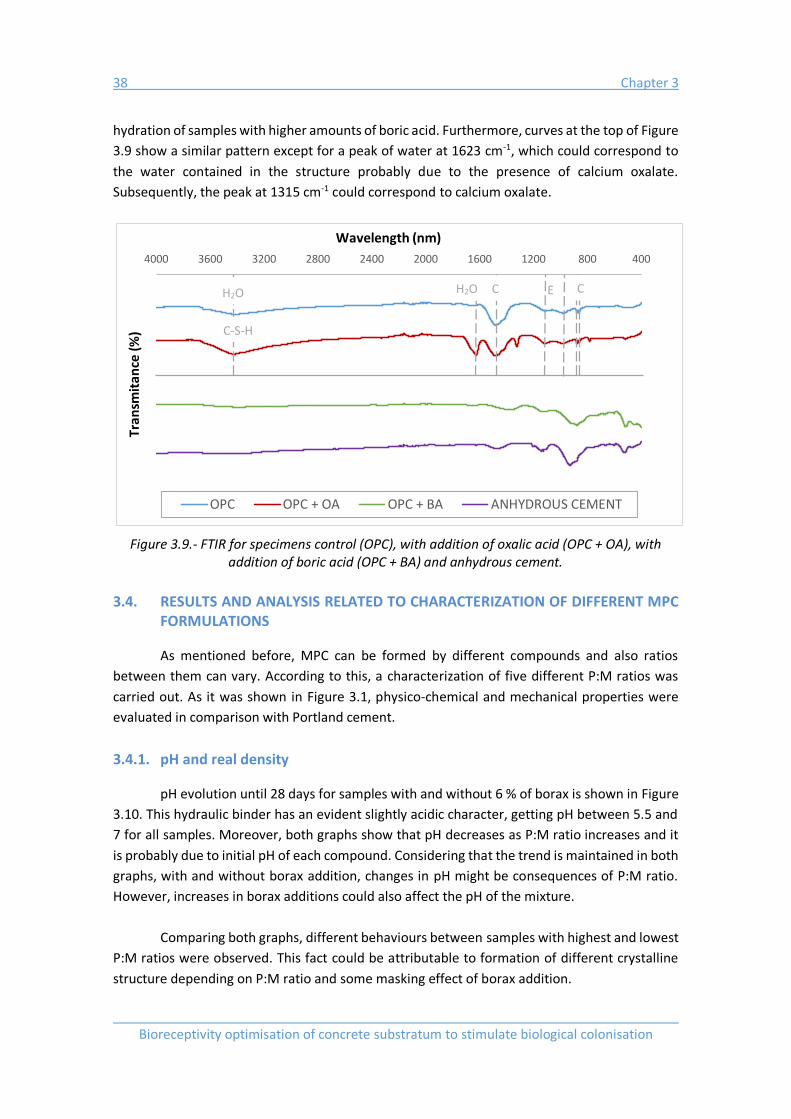
38 Chapter 3
Bioreceptivity optimisation of concrete substratum to stimulate biological colonisation
hydration of samples with higher amounts of boric acid. Furthermore, curves at the top of Figure
3.9 show a similar pattern except for a peak of water at 1623 cm-1, which could correspond to
the water contained in the structure probably due to the presence of calcium oxalate.
Subsequently, the peak at 1315 cm-1 could correspond to calcium oxalate.
Figure 3.9.- FTIR for specimens control (OPC), with addition of oxalic acid (OPC + OA), with addition of boric acid (OPC + BA) and anhydrous cement.
3.4. RESULTS AND ANALYSIS RELATED TO CHARACTERIZATION OF DIFFERENT MPC FORMULATIONS
As mentioned before, MPC can be formed by different compounds and also ratios
between them can vary. According to this, a characterization of five different P:M ratios was
carried out. As it was shown in Figure 3.1, physico-chemical and mechanical properties were
evaluated in comparison with Portland cement.
3.4.1. pH and real density
pH evolution until 28 days for samples with and without 6 % of borax is shown in Figure
3.10. This hydraulic binder has an evident slightly acidic character, getting pH between 5.5 and
7 for all samples. Moreover, both graphs show that pH decreases as P:M ratio increases and it
is probably due to initial pH of each compound. Considering that the trend is maintained in both
graphs, with and without borax addition, changes in pH might be consequences of P:M ratio.
However, increases in borax additions could also affect the pH of the mixture.
Comparing both graphs, different behaviours between samples with highest and lowest
P:M ratios were observed. This fact could be attributable to formation of different crystalline
structure depending on P:M ratio and some masking effect of borax addition.
40080012001600200024002800320036004000
Tran
smit
ance
(%
)
Wavelength (nm)
OPC OPC + OA OPC + BA ANHYDROUS CEMENT
H2O H2O
C-S-H
C C E

Development of a low-pH cementitious material 39
Sandra Manso Blanco
Based on the results, five different P:M ratios were selected (1:1, 1:1.25, 1:1.5, 1:1.75
and 1:2). Addition of 6 % of borax was chosen in order to improve production conditions, mainly
regarding setting times. Moreover, selection of the mentioned P:M ratios was based on
production, where it was evident that not all NH4H2PO4 was diluted for mixtures with higher P:M
ratio. The above was observed after mixing, at the moment of filling the moulds. Due to the
different densities of different compounds forming the mixture, non-diluted crystals of
NH4H2PO4 tend to float, forming clearly two different layers per specimen.
Figure 3.10.- Evolution on time of pH for specimens (a) without borax and (b) with addition of 6 % in borax.
Concerning to MPC real densities, different results were obtained depending on P:M
ratios. Higher real density was obtained for the lower P:M ratio (2.69 g/cm³) although this value
is still lower than the OPC one.
3.4.2. Normal consistency, setting times and volume stability
Table 3.4 shows results for normal consistency, setting times and volume stability of
cement pastes. Normal consistency presents a difference between samples no higher than
1.7 ± 0.5 %. Moreover, values observed for MPC mortars were visibly lower than the reference
value for CEM I 52.5R. Differences observed could be consequence of the fluxing effect of borax
as well as a lower stoichiometric amount of water required for the hydration process (Sarkar,
1990; Hall et al., 1998; Yang et al., 2000; Hall et al., 2001). Furthermore, it was observed that
small increases in water content caused the loss of normal consistency.
Subsequently, setting times were determined. MPC samples presented markedly
shorter setting times than OPC, final setting times being shorter than 30 minutes. Moreover,
differences observed between initial and final setting times were always less than 5 minutes.
Factors influencing setting time are mainly reactivity of magnesia, fineness of MgO, w/c
ratio, amount of retarder and P:M ratio (Popovics and Rajendran, 1987; Hall et al., 1998; Yang
and Wu, 1999; Qiao et al., 2009b). Finally, results obtained for volume stability showed no
5
5.5
6
6.5
7
7.5
0 4 8 12 16 20 24 28
pH
Time (days)
(a) 0 % borax addition
1:0,5 1:0,75 1:1,131:1,25 1:1,5 1:2
0 4 8 12 16 20 24 28Time (days)
(b) 6 % borax addition
1:0,5 1:0,75 1:1,131:1,25 1:1,5 1:2
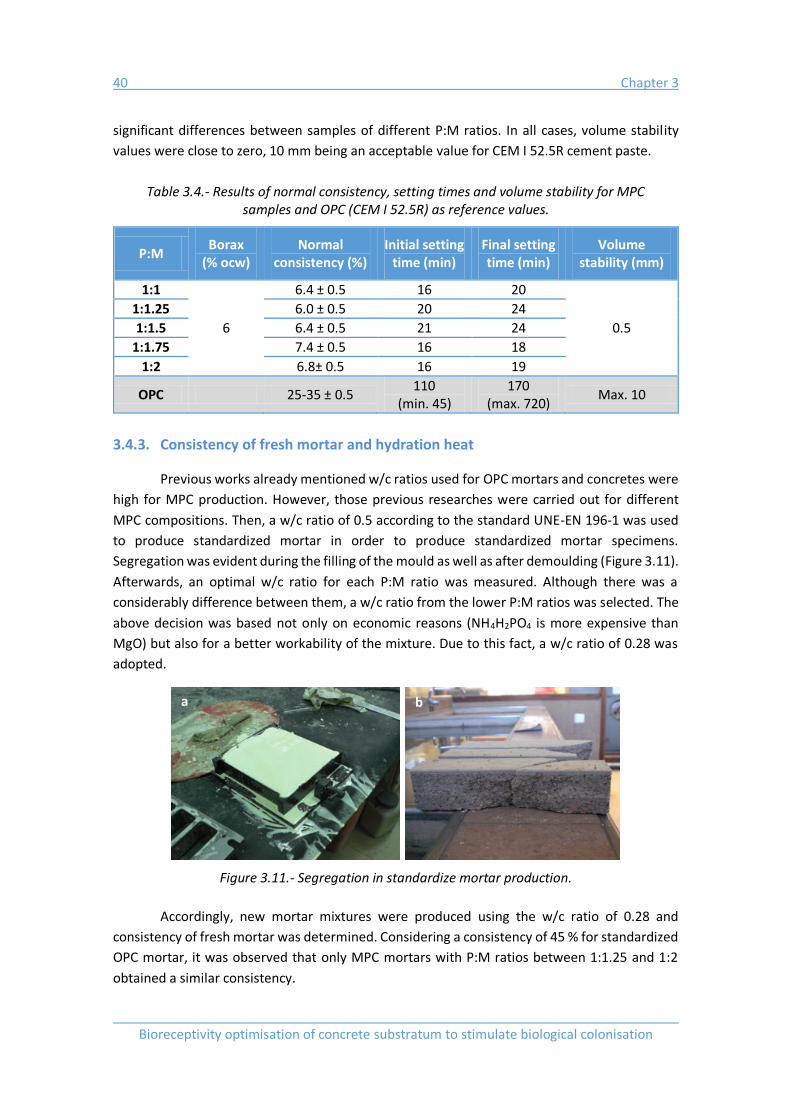
40 Chapter 3
Bioreceptivity optimisation of concrete substratum to stimulate biological colonisation
significant differences between samples of different P:M ratios. In all cases, volume stability
values were close to zero, 10 mm being an acceptable value for CEM I 52.5R cement paste.
Table 3.4.- Results of normal consistency, setting times and volume stability for MPC samples and OPC (CEM I 52.5R) as reference values.
P:M Borax
(% ocw) Normal
consistency (%) Initial setting
time (min) Final setting time (min)
Volume stability (mm)
1:1
6
6.4 ± 0.5 16 20
0.5
1:1.25 6.0 ± 0.5 20 24
1:1.5 6.4 ± 0.5 21 24
1:1.75 7.4 ± 0.5 16 18
1:2 6.8± 0.5 16 19
OPC 25-35 ± 0.5 110
(min. 45) 170
(max. 720) Max. 10
3.4.3. Consistency of fresh mortar and hydration heat
Previous works already mentioned w/c ratios used for OPC mortars and concretes were
high for MPC production. However, those previous researches were carried out for different
MPC compositions. Then, a w/c ratio of 0.5 according to the standard UNE-EN 196-1 was used
to produce standardized mortar in order to produce standardized mortar specimens.
Segregation was evident during the filling of the mould as well as after demoulding (Figure 3.11).
Afterwards, an optimal w/c ratio for each P:M ratio was measured. Although there was a
considerably difference between them, a w/c ratio from the lower P:M ratios was selected. The
above decision was based not only on economic reasons (NH4H2PO4 is more expensive than
MgO) but also for a better workability of the mixture. Due to this fact, a w/c ratio of 0.28 was
adopted.
Figure 3.11.- Segregation in standardize mortar production.
Accordingly, new mortar mixtures were produced using the w/c ratio of 0.28 and
consistency of fresh mortar was determined. Considering a consistency of 45 % for standardized
OPC mortar, it was observed that only MPC mortars with P:M ratios between 1:1.25 and 1:2
obtained a similar consistency.
a b
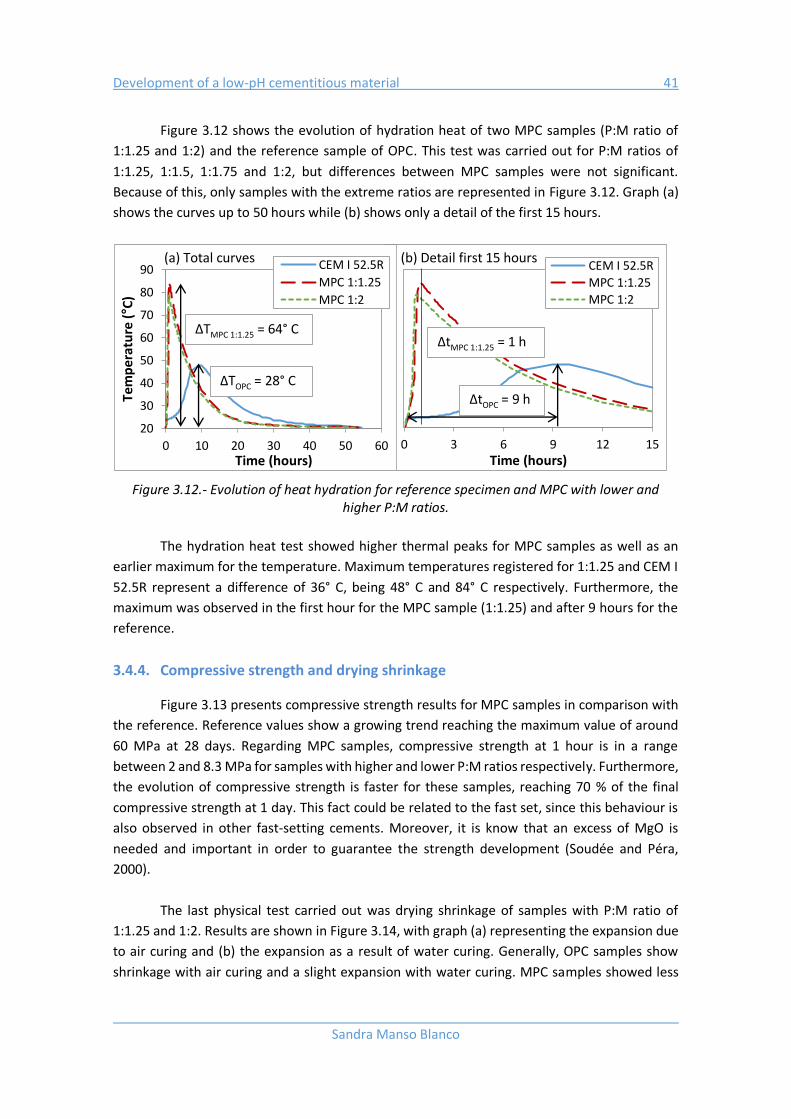
Development of a low-pH cementitious material 41
Sandra Manso Blanco
Figure 3.12 shows the evolution of hydration heat of two MPC samples (P:M ratio of
1:1.25 and 1:2) and the reference sample of OPC. This test was carried out for P:M ratios of
1:1.25, 1:1.5, 1:1.75 and 1:2, but differences between MPC samples were not significant.
Because of this, only samples with the extreme ratios are represented in Figure 3.12. Graph (a)
shows the curves up to 50 hours while (b) shows only a detail of the first 15 hours.
Figure 3.12.- Evolution of heat hydration for reference specimen and MPC with lower and higher P:M ratios.
The hydration heat test showed higher thermal peaks for MPC samples as well as an
earlier maximum for the temperature. Maximum temperatures registered for 1:1.25 and CEM I
52.5R represent a difference of 36° C, being 48° C and 84° C respectively. Furthermore, the
maximum was observed in the first hour for the MPC sample (1:1.25) and after 9 hours for the
reference.
3.4.4. Compressive strength and drying shrinkage
Figure 3.13 presents compressive strength results for MPC samples in comparison with
the reference. Reference values show a growing trend reaching the maximum value of around
60 MPa at 28 days. Regarding MPC samples, compressive strength at 1 hour is in a range
between 2 and 8.3 MPa for samples with higher and lower P:M ratios respectively. Furthermore,
the evolution of compressive strength is faster for these samples, reaching 70 % of the final
compressive strength at 1 day. This fact could be related to the fast set, since this behaviour is
also observed in other fast-setting cements. Moreover, it is know that an excess of MgO is
needed and important in order to guarantee the strength development (Soudée and Péra,
2000).
The last physical test carried out was drying shrinkage of samples with P:M ratio of
1:1.25 and 1:2. Results are shown in Figure 3.14, with graph (a) representing the expansion due
to air curing and (b) the expansion as a result of water curing. Generally, OPC samples show
shrinkage with air curing and a slight expansion with water curing. MPC samples showed less
0 3 6 9 12 15Time (hours)
CEM I 52.5R
MPC 1:1.25
MPC 1:2
20
30
40
50
60
70
80
90
0 10 20 30 40 50 60
Tem
per
atu
re (°C
)
Time (hours)
CEM I 52.5R
MPC 1:1.25
MPC 1:2
ΔTMPC 1:1.25 = 64° C
ΔTOPC = 28° C
ΔtMPC 1:1.25 = 1 h
ΔtOPC = 9 h
(a) Total curves (b) Detail first 15 hours
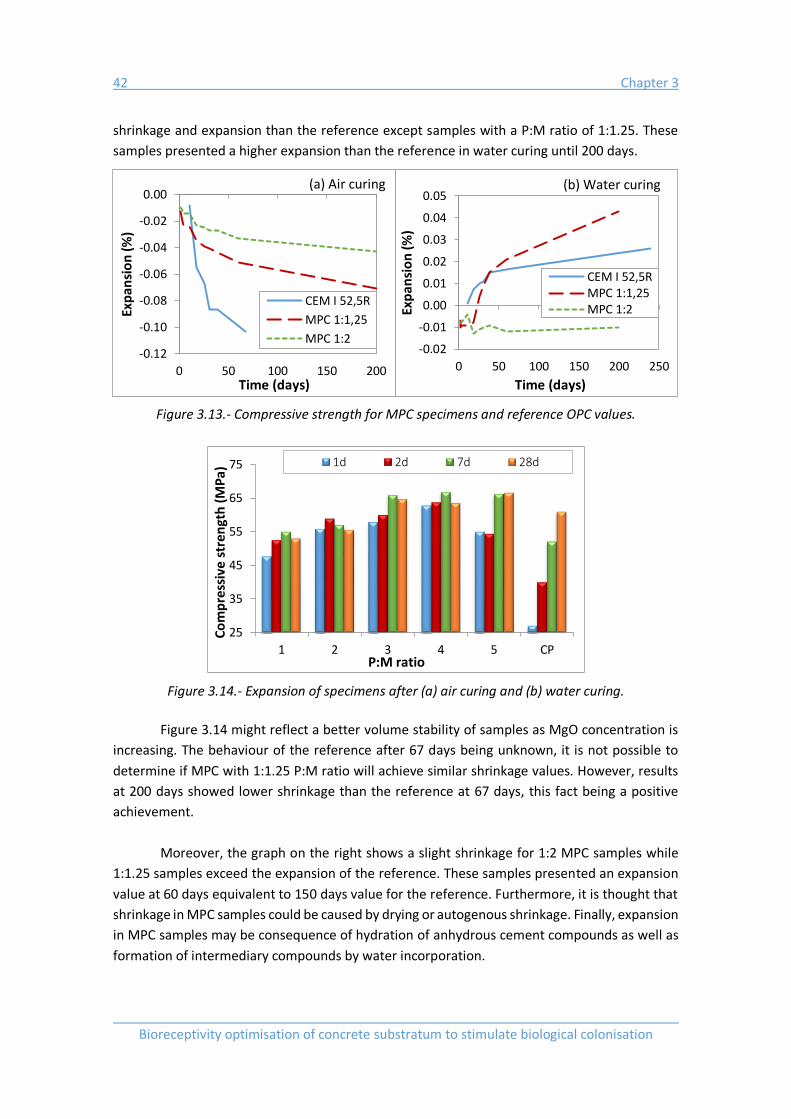
42 Chapter 3
Bioreceptivity optimisation of concrete substratum to stimulate biological colonisation
shrinkage and expansion than the reference except samples with a P:M ratio of 1:1.25. These
samples presented a higher expansion than the reference in water curing until 200 days.
Figure 3.13.- Compressive strength for MPC specimens and reference OPC values.
Figure 3.14.- Expansion of specimens after (a) air curing and (b) water curing.
Figure 3.14 might reflect a better volume stability of samples as MgO concentration is
increasing. The behaviour of the reference after 67 days being unknown, it is not possible to
determine if MPC with 1:1.25 P:M ratio will achieve similar shrinkage values. However, results
at 200 days showed lower shrinkage than the reference at 67 days, this fact being a positive
achievement.
Moreover, the graph on the right shows a slight shrinkage for 1:2 MPC samples while
1:1.25 samples exceed the expansion of the reference. These samples presented an expansion
value at 60 days equivalent to 150 days value for the reference. Furthermore, it is thought that
shrinkage in MPC samples could be caused by drying or autogenous shrinkage. Finally, expansion
in MPC samples may be consequence of hydration of anhydrous cement compounds as well as
formation of intermediary compounds by water incorporation.
-0.12
-0.10
-0.08
-0.06
-0.04
-0.02
0.00
0 50 100 150 200
Exp
ansi
on
(%
)
Time (days)
CEM I 52,5R
MPC 1:1,25
MPC 1:2-0.02
-0.01
0.00
0.01
0.02
0.03
0.04
0.05
0 50 100 150 200 250
Exp
ansi
on
(%
)
Time (days)
CEM I 52,5RMPC 1:1,25MPC 1:2
(a) Air curing (b) Water curing
25
35
45
55
65
75
1 2 3 4 5 CP
Co
mp
ress
ive
str
en
gth
(M
Pa)
P:M ratio
1d 2d 7d 28d
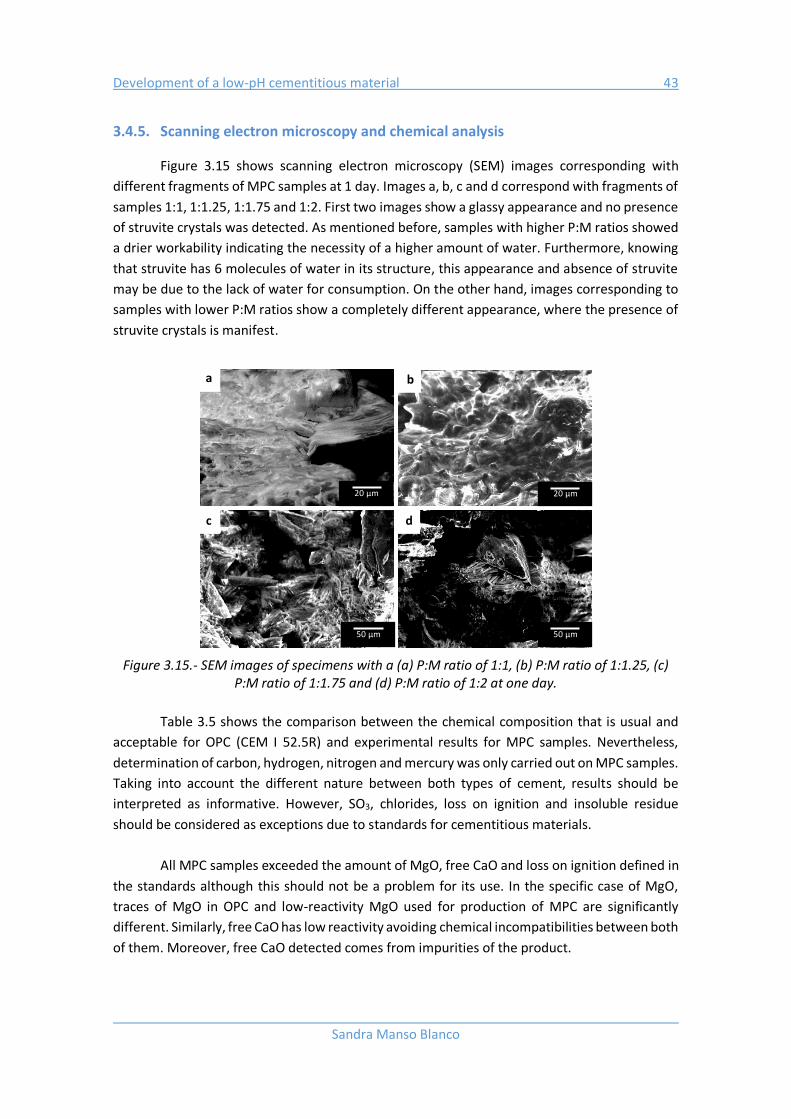
Development of a low-pH cementitious material 43
Sandra Manso Blanco
3.4.5. Scanning electron microscopy and chemical analysis
Figure 3.15 shows scanning electron microscopy (SEM) images corresponding with
different fragments of MPC samples at 1 day. Images a, b, c and d correspond with fragments of
samples 1:1, 1:1.25, 1:1.75 and 1:2. First two images show a glassy appearance and no presence
of struvite crystals was detected. As mentioned before, samples with higher P:M ratios showed
a drier workability indicating the necessity of a higher amount of water. Furthermore, knowing
that struvite has 6 molecules of water in its structure, this appearance and absence of struvite
may be due to the lack of water for consumption. On the other hand, images corresponding to
samples with lower P:M ratios show a completely different appearance, where the presence of
struvite crystals is manifest.
Figure 3.15.- SEM images of specimens with a (a) P:M ratio of 1:1, (b) P:M ratio of 1:1.25, (c) P:M ratio of 1:1.75 and (d) P:M ratio of 1:2 at one day.
Table 3.5 shows the comparison between the chemical composition that is usual and
acceptable for OPC (CEM I 52.5R) and experimental results for MPC samples. Nevertheless,
determination of carbon, hydrogen, nitrogen and mercury was only carried out on MPC samples.
Taking into account the different nature between both types of cement, results should be
interpreted as informative. However, SO3, chlorides, loss on ignition and insoluble residue
should be considered as exceptions due to standards for cementitious materials.
All MPC samples exceeded the amount of MgO, free CaO and loss on ignition defined in
the standards although this should not be a problem for its use. In the specific case of MgO,
traces of MgO in OPC and low-reactivity MgO used for production of MPC are significantly
different. Similarly, free CaO has low reactivity avoiding chemical incompatibilities between both
of them. Moreover, free CaO detected comes from impurities of the product.
20 µm
20 µm
50 µm
50 µm
a b
c d

44 Chapter 3
Bioreceptivity optimisation of concrete substratum to stimulate biological colonisation
Finally, loss on ignition for OPC is regulated due to its cause. Fundamentally, it is caused
by presence of water, organic matter and other non-contributory impurities. However, the
cause of loss of ignition for MPC is mainly the degradation of ADP releasing ammonium and
water.
Table 3.5.- Chemical composition of MPC samples and OPC (CEM I 52.5R) as the reference value (LI: Loss on ignition; IR: Insoluble residue; R2O3: Al2O3 + Fe2O3)
Compound 1:1 1:1.25 1:1.5 1:1.75 1:2 OPC
Free CaO (%) 0.2 0.1 0.5 0.1 0.3 < 0.1
SiO2 (%) 0.1 0.1 0.1 0.1 0.1 18-26
R2O3 (%) 0.4 0.4 0.4 0.3 0.3 4-14
MgO (%) 48.3 53.8 59.8 62.5 77.0 0-5
SO3 (g) 0.01 0.01 0.02 0.02 0.02 < 4
Cl- (%) 0 0 0 0 0 < 0.1
LI (%) 18.8 16.7 19.5 16.1 18.4 < 5
IR (%) 0.1 0.1 0.1 0.1 0.1 < 5
C 0.4 0.4 0.4 0.4 0.4 -
H 2.88 2.47 2.43 2.26 1.41 -
N 6.56 5.50 5.34 4.92 2.90 -
Hg 0.03 0.03 0.02 0.02 0.02 -
3.4.6. XRD
Figure 3.16 shows the comparison between different MPC formulations. Three
compounds were undoubtedly detected: struvite, dittmarite and periclase. However, other
compounds could be also present and not detected due to coincidence on peaks position.
Presence of periclase reveals an excess of this product and the other two compounds are the
most common hydration products.
Comparing different formulations, a significant decrease of peak intensity for dittmarite
seems to be related to a decrease of P:M ratio. In order to justify these results, stoichiometric
water necessary for the hydration process was estimated. The main reaction is as follows:
4 2 4 2 4 4 25 6MgO NH H PO H O NH MgPO H O [3.10]
From equation 3.10, it is clear that the stoichiometric molar ratio between MgO, ADP
and water is 1:1:5. However, in order to estimate if a w/c ratio of 0.28 introduced an excess or
deficit of water, only the limiting factor, ADP, was considered. Furthermore, water coming from
borax was also estimated, which represented extremely small amounts due to the percentage
of addition.
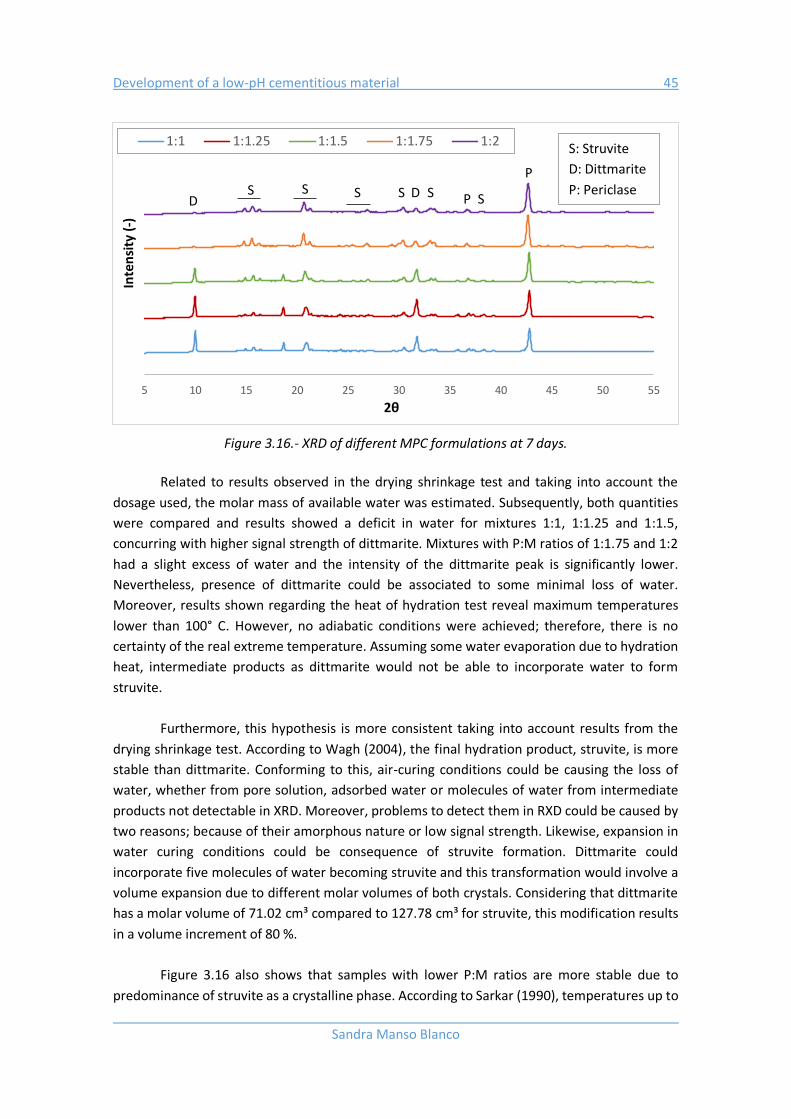
Development of a low-pH cementitious material 45
Sandra Manso Blanco
Figure 3.16.- XRD of different MPC formulations at 7 days.
Related to results observed in the drying shrinkage test and taking into account the
dosage used, the molar mass of available water was estimated. Subsequently, both quantities
were compared and results showed a deficit in water for mixtures 1:1, 1:1.25 and 1:1.5,
concurring with higher signal strength of dittmarite. Mixtures with P:M ratios of 1:1.75 and 1:2
had a slight excess of water and the intensity of the dittmarite peak is significantly lower.
Nevertheless, presence of dittmarite could be associated to some minimal loss of water.
Moreover, results shown regarding the heat of hydration test reveal maximum temperatures
lower than 100° C. However, no adiabatic conditions were achieved; therefore, there is no
certainty of the real extreme temperature. Assuming some water evaporation due to hydration
heat, intermediate products as dittmarite would not be able to incorporate water to form
struvite.
Furthermore, this hypothesis is more consistent taking into account results from the
drying shrinkage test. According to Wagh (2004), the final hydration product, struvite, is more
stable than dittmarite. Conforming to this, air-curing conditions could be causing the loss of
water, whether from pore solution, adsorbed water or molecules of water from intermediate
products not detectable in XRD. Moreover, problems to detect them in RXD could be caused by
two reasons; because of their amorphous nature or low signal strength. Likewise, expansion in
water curing conditions could be consequence of struvite formation. Dittmarite could
incorporate five molecules of water becoming struvite and this transformation would involve a
volume expansion due to different molar volumes of both crystals. Considering that dittmarite
has a molar volume of 71.02 cm³ compared to 127.78 cm³ for struvite, this modification results
in a volume increment of 80 %.
Figure 3.16 also shows that samples with lower P:M ratios are more stable due to
predominance of struvite as a crystalline phase. According to Sarkar (1990), temperatures up to
5 10 15 20 25 30 35 40 45 50 55
Inte
nsi
ty (
-)
2θ
1:1 1:1.25 1:1.5 1:1.75 1:2
D S S S S D S S P
P
S: Struvite
D: Dittmarite
P: Periclase
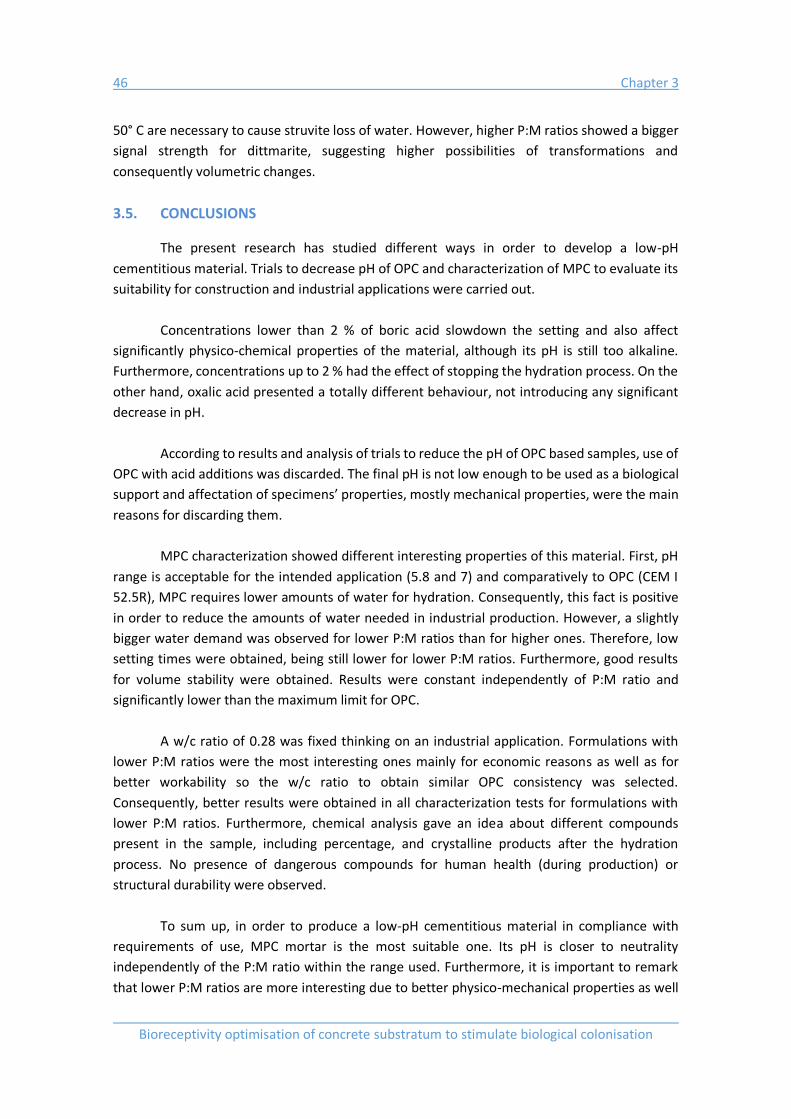
46 Chapter 3
Bioreceptivity optimisation of concrete substratum to stimulate biological colonisation
50° C are necessary to cause struvite loss of water. However, higher P:M ratios showed a bigger
signal strength for dittmarite, suggesting higher possibilities of transformations and
consequently volumetric changes.
3.5. CONCLUSIONS
The present research has studied different ways in order to develop a low-pH
cementitious material. Trials to decrease pH of OPC and characterization of MPC to evaluate its
suitability for construction and industrial applications were carried out.
Concentrations lower than 2 % of boric acid slowdown the setting and also affect
significantly physico-chemical properties of the material, although its pH is still too alkaline.
Furthermore, concentrations up to 2 % had the effect of stopping the hydration process. On the
other hand, oxalic acid presented a totally different behaviour, not introducing any significant
decrease in pH.
According to results and analysis of trials to reduce the pH of OPC based samples, use of
OPC with acid additions was discarded. The final pH is not low enough to be used as a biological
support and affectation of specimens’ properties, mostly mechanical properties, were the main
reasons for discarding them.
MPC characterization showed different interesting properties of this material. First, pH
range is acceptable for the intended application (5.8 and 7) and comparatively to OPC (CEM I
52.5R), MPC requires lower amounts of water for hydration. Consequently, this fact is positive
in order to reduce the amounts of water needed in industrial production. However, a slightly
bigger water demand was observed for lower P:M ratios than for higher ones. Therefore, low
setting times were obtained, being still lower for lower P:M ratios. Furthermore, good results
for volume stability were obtained. Results were constant independently of P:M ratio and
significantly lower than the maximum limit for OPC.
A w/c ratio of 0.28 was fixed thinking on an industrial application. Formulations with
lower P:M ratios were the most interesting ones mainly for economic reasons as well as for
better workability so the w/c ratio to obtain similar OPC consistency was selected.
Consequently, better results were obtained in all characterization tests for formulations with
lower P:M ratios. Furthermore, chemical analysis gave an idea about different compounds
present in the sample, including percentage, and crystalline products after the hydration
process. No presence of dangerous compounds for human health (during production) or
structural durability were observed.
To sum up, in order to produce a low-pH cementitious material in compliance with
requirements of use, MPC mortar is the most suitable one. Its pH is closer to neutrality
independently of the P:M ratio within the range used. Furthermore, it is important to remark
that lower P:M ratios are more interesting due to better physico-mechanical properties as well

Development of a low-pH cementitious material 47
Sandra Manso Blanco
as from an economic point of view. Accordingly, the P:M ratio 1:1.75 with a 6 % borax addition
was selected to continue the research. P:M ratio of 1:2 was discarded since results between
these two compositions were quite similar and a better workability was observed for P:M ratios
of 1:1.75.

48 Chapter 3
Bioreceptivity optimisation of concrete substratum to stimulate biological colonisation
Bioreceptivity modifications of cementitious materials 49
Sandra Manso Blanco
4. BIORECEPTIVITY MODIFICATIONS OF
CEMENTITIOUS MATERIALS
4.1. INTRODUCTION
The study of Chapter 3 showed the possibility of using MPC mortars as a low-pH
cementitious material. Results obtained in the previous chapter showed that higher P:M ratios
could be appropriate for the production of non-structural elements. More specifically, the
formulation based on a P:M ratio of 1:1.75 and the addition of 6 % of borax was chosen and it
was based on economics as well as properties and workability of the mortar. However, as it was
already mentioned in Chapter 2, not only chemical composition and pH define the bioreceptivity
of a material. In this sense, the combination of both chemical and physical properties is
important to define that term.
The bioreceptivity of cementitious materials has been usually studied to get a better
understanding of the microorganisms’ colonisation behaviour, as well as for the effect of
microorganisms on cementitious materials appearance and properties. Texture, mineralogy,
open porosity, roughness of the surface, permeability, and bulk density, between others, are
the most studied physical parameters of cementitious materials relating to bioreceptivity
(Guillitte and Dreesen, 1995; Tiano et al., 1995; Tomaselli et al., 2000; Miller et al., 2010).
However, most of the experts in bioreceptivity repeatedly studied only few of those properties.
In the light of the exposed, the objective of this chapter is to develop materials with
different degrees of bioreceptivity to stimulate natural colonisation of living organisms. The
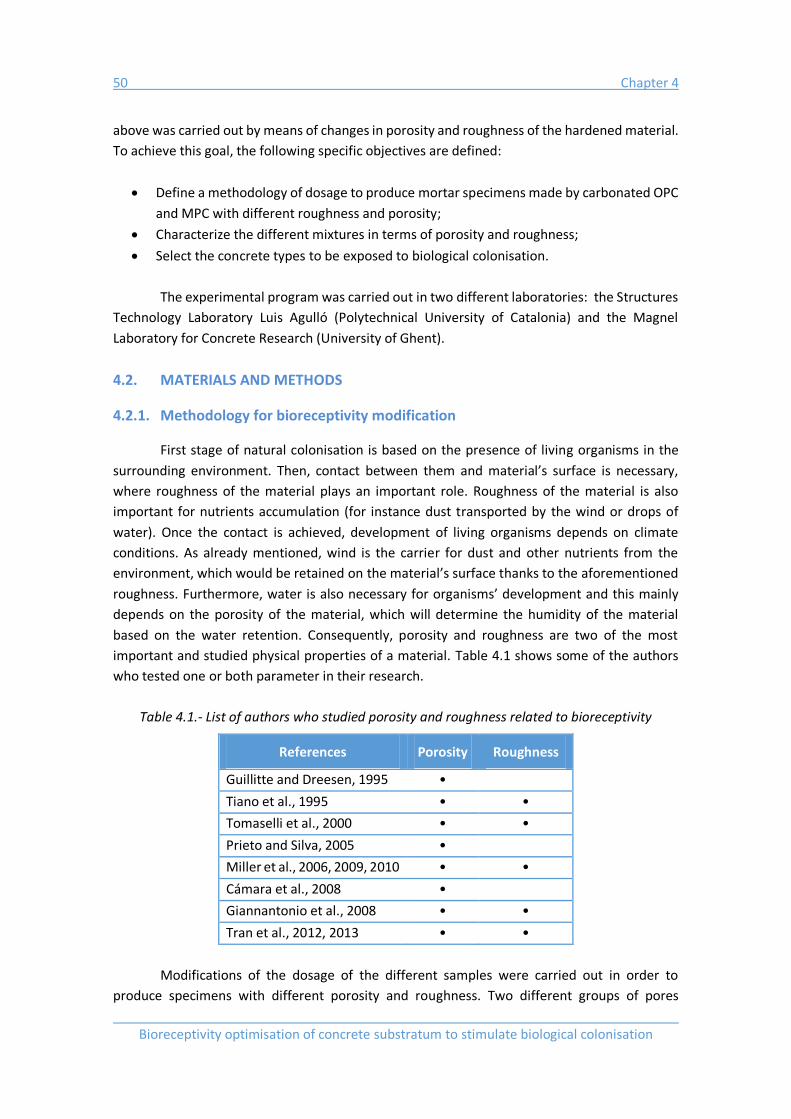
50 Chapter 4
Bioreceptivity optimisation of concrete substratum to stimulate biological colonisation
above was carried out by means of changes in porosity and roughness of the hardened material.
To achieve this goal, the following specific objectives are defined:
Define a methodology of dosage to produce mortar specimens made by carbonated OPC
and MPC with different roughness and porosity;
Characterize the different mixtures in terms of porosity and roughness;
Select the concrete types to be exposed to biological colonisation.
The experimental program was carried out in two different laboratories: the Structures
Technology Laboratory Luis Agulló (Polytechnical University of Catalonia) and the Magnel
Laboratory for Concrete Research (University of Ghent).
4.2. MATERIALS AND METHODS
4.2.1. Methodology for bioreceptivity modification
First stage of natural colonisation is based on the presence of living organisms in the
surrounding environment. Then, contact between them and material’s surface is necessary,
where roughness of the material plays an important role. Roughness of the material is also
important for nutrients accumulation (for instance dust transported by the wind or drops of
water). Once the contact is achieved, development of living organisms depends on climate
conditions. As already mentioned, wind is the carrier for dust and other nutrients from the
environment, which would be retained on the material’s surface thanks to the aforementioned
roughness. Furthermore, water is also necessary for organisms’ development and this mainly
depends on the porosity of the material, which will determine the humidity of the material
based on the water retention. Consequently, porosity and roughness are two of the most
important and studied physical properties of a material. Table 4.1 shows some of the authors
who tested one or both parameter in their research.
Table 4.1.- List of authors who studied porosity and roughness related to bioreceptivity
References Porosity Roughness
Guillitte and Dreesen, 1995 •
Tiano et al., 1995 • •
Tomaselli et al., 2000 • •
Prieto and Silva, 2005 •
Miller et al., 2006, 2009, 2010 • •
Cámara et al., 2008 •
Giannantonio et al., 2008 • •
Tran et al., 2012, 2013 • •
Modifications of the dosage of the different samples were carried out in order to
produce specimens with different porosity and roughness. Two different groups of pores

Bioreceptivity modifications of cementitious materials 51
Sandra Manso Blanco
depending on their size can be defined, being microporosity and macroporosity. The
microporosity could be modified by means of the use of different w/c ratios while macroporosity
can be changed by varying aggregates size and the cement paste content. Accordingly,
roughness can be modified mainly by the cement paste content and secondly by the aggregates
size.
The tool used to select cement paste contents was the model proposed in the PhD thesis
of Klein (2012). Klein studied the physical role of water when covering and wetting the surfaces
of different particles of the mixture. Moreover, the method can be extrapolated to the case of
cement pastes with the aim of obtaining the minimum amount of cement paste to join all the
aggregate particles to produce the mortar. Figure 4.1 shows a scheme of the procedure followed
to estimate the different amounts of cement paste.
Figure 4.1.- Flow chart of the dosage methodology.
Different parameters should be previously estimated to obtain the value. Klein
developed a model considering particles of the same size and consequently the average radius
of the aggregates is one of the parameters to estimate. This parameter could be obtained from
the granulometry of the aggregates, considering all the particles as spheres. Then, the area of
the aggregates surface (m²), SAAgg, is estimated based on the percentage of aggregate retained
in a mesh (%), Agg%, and considering the value of the mesh n (Mn), which corresponds to the
maximum particle size not retained in the mesh. Subsequently, the total area (m³), Ta, and the
average radius (mm), ra are calculated by the summation of all SAAgg obtained as follows:
𝑆𝐴𝐴𝑔𝑔 = 𝑀𝑛+1+ 𝑀𝑛
2 (𝐴𝑔𝑔% (𝑛+1) − 𝐴𝑔𝑔% (𝑛)) [4.1]
𝑇𝑎 = ∑ 𝑆𝐴𝐴𝑔𝑔 [4.2]
𝑟𝑎 = ∑ 𝑆𝐴𝐴𝑔𝑔
2 (𝐴𝑔𝑔100 % −𝐴𝑔𝑔max %) [4.3]
Aggregate characterization
Specific surface estimation
Equivalent thickness estimation
Vcement paste
/kgaggregate
estimation
Weightcement
paste/kg
aggregate
estimation
DOSAGE
Granulometry Compacity Density
Constant from compactness tables
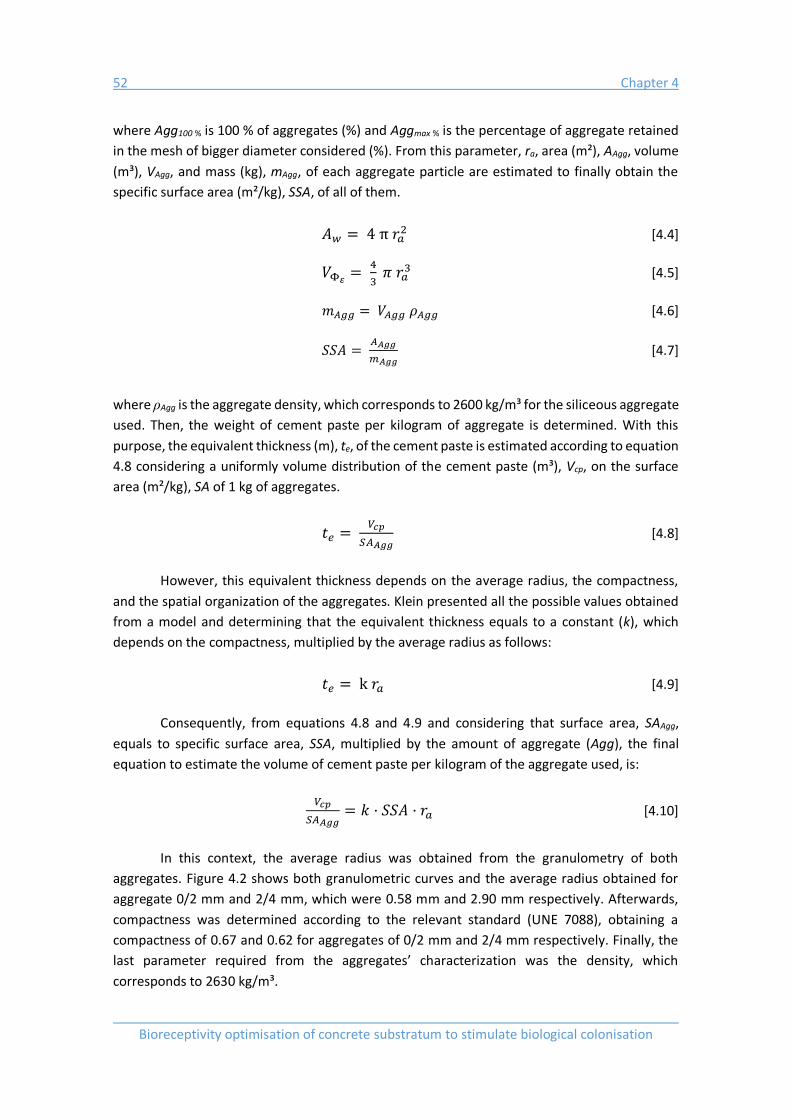
52 Chapter 4
Bioreceptivity optimisation of concrete substratum to stimulate biological colonisation
where Agg100 % is 100 % of aggregates (%) and Aggmax % is the percentage of aggregate retained
in the mesh of bigger diameter considered (%). From this parameter, ra, area (m²), AAgg, volume
(m³), VAgg, and mass (kg), mAgg, of each aggregate particle are estimated to finally obtain the
specific surface area (m²/kg), SSA, of all of them.
𝐴𝑤 = 4 π 𝑟𝑎2 [4.4]
𝑉Φ𝜀=
4
3 𝜋 𝑟𝑎
3 [4.5]
𝑚𝐴𝑔𝑔 = 𝑉𝐴𝑔𝑔 𝜌𝐴𝑔𝑔 [4.6]
𝑆𝑆𝐴 = 𝐴𝐴𝑔𝑔
𝑚𝐴𝑔𝑔 [4.7]
where ρAgg is the aggregate density, which corresponds to 2600 kg/m³ for the siliceous aggregate
used. Then, the weight of cement paste per kilogram of aggregate is determined. With this
purpose, the equivalent thickness (m), te, of the cement paste is estimated according to equation
4.8 considering a uniformly volume distribution of the cement paste (m³), Vcp, on the surface
area (m²/kg), SA of 1 kg of aggregates.
𝑡𝑒 = 𝑉𝑐𝑝
𝑆𝐴𝐴𝑔𝑔 [4.8]
However, this equivalent thickness depends on the average radius, the compactness,
and the spatial organization of the aggregates. Klein presented all the possible values obtained
from a model and determining that the equivalent thickness equals to a constant (k), which
depends on the compactness, multiplied by the average radius as follows:
𝑡𝑒 = k 𝑟𝑎 [4.9]
Consequently, from equations 4.8 and 4.9 and considering that surface area, SAAgg,
equals to specific surface area, SSA, multiplied by the amount of aggregate (Agg), the final
equation to estimate the volume of cement paste per kilogram of the aggregate used, is:
𝑉𝑐𝑝
𝑆𝐴𝐴𝑔𝑔= 𝑘 · 𝑆𝑆𝐴 · 𝑟𝑎 [4.10]
In this context, the average radius was obtained from the granulometry of both
aggregates. Figure 4.2 shows both granulometric curves and the average radius obtained for
aggregate 0/2 mm and 2/4 mm, which were 0.58 mm and 2.90 mm respectively. Afterwards,
compactness was determined according to the relevant standard (UNE 7088), obtaining a
compactness of 0.67 and 0.62 for aggregates of 0/2 mm and 2/4 mm respectively. Finally, the
last parameter required from the aggregates’ characterization was the density, which
corresponds to 2630 kg/m³.
Bioreceptivity modifications of cementitious materials 53
Sandra Manso Blanco
Figure 4.2.- Granulometry of the silica aggregates used (0/2 mm and 2/4 mm).
Subsequently, considering the compactness of each aggregate, k was obtained from
table 4.3 of Klein‘s thesis, with a value of 0.115. However, the value of k used was slightly higher,
0.169, to obtain a high porous material but having more cement paste to improve material’s
properties.
According to equation 4.10, the final volume of cement paste per kilogram of aggregate
to join all the aggregate particles was 1.93 x 10⁴ m³/kg corresponding to 0.299 kilograms of
cement paste per kilogram of aggregate. No differences were observed in this value for each
aggregate sample, since both samples had similar specific surfaces and compactness. The value
obtained from equation 4.10 was considered as a reference value.
Regarding the roughness of the specimens’ surface, previous hypothesis pointed out
that specimens with lowest cement paste content and highest aggregate size will obtain higher
values. Accordingly, higher porosity is expected for OPC and MPC specimens with lowest cement
paste content and 2/4 mm aggregates.
4.2.2. Materials and dosages
Related to materials, CEM I 52.5R was the hydraulic binder for OPC specimens’
production. MPC specimens were produced with Ammonium Dihydrogen Phosphate (ADP,
NH4H2PO4) and Magnesium oxide (MgO) maintaining an P:M ratio of 1:1.75 as concluded at the
end of the previous chapter. Moreover, a 6% of borax (Na2B4O7·10H2O) was added to the mix as
a retarder. Additionally to the hydraulic binders, two different particle sizes of siliceous
aggregates were used (0/2 mm and 2/4 mm), as well as distilled water.
Three different considerations to compose both kinds of mortar specimens (OPC and
MPC specimens) were taken into account. First, two different aggregate sizes were used in order
to modify macroporosity of the specimens. Then, three different w/c ratios for each kind of
cement were defined. Regarding OPC, three different values in the range between 0.3 and 0.6
were selected: 0.3, 0.4, and 0.6. In contrast, w/c ratios used for MPC production were
significantly lower. As mention in the previous chapter, a w/c ratio of 0.28 was fixed and small
0
20
40
60
80
100
0 0.3 0.6 0.9 1.2 1.5 1.8 2.1 2.4 2.7 3 3.3 3.6 3.9 4.2
Re
tain
ed
pe
rce
nta
ge (%
)
Mesh (mm)
0/2 mm
2/4 mm
ra = 0.58 mm
ra = 2.90 mm
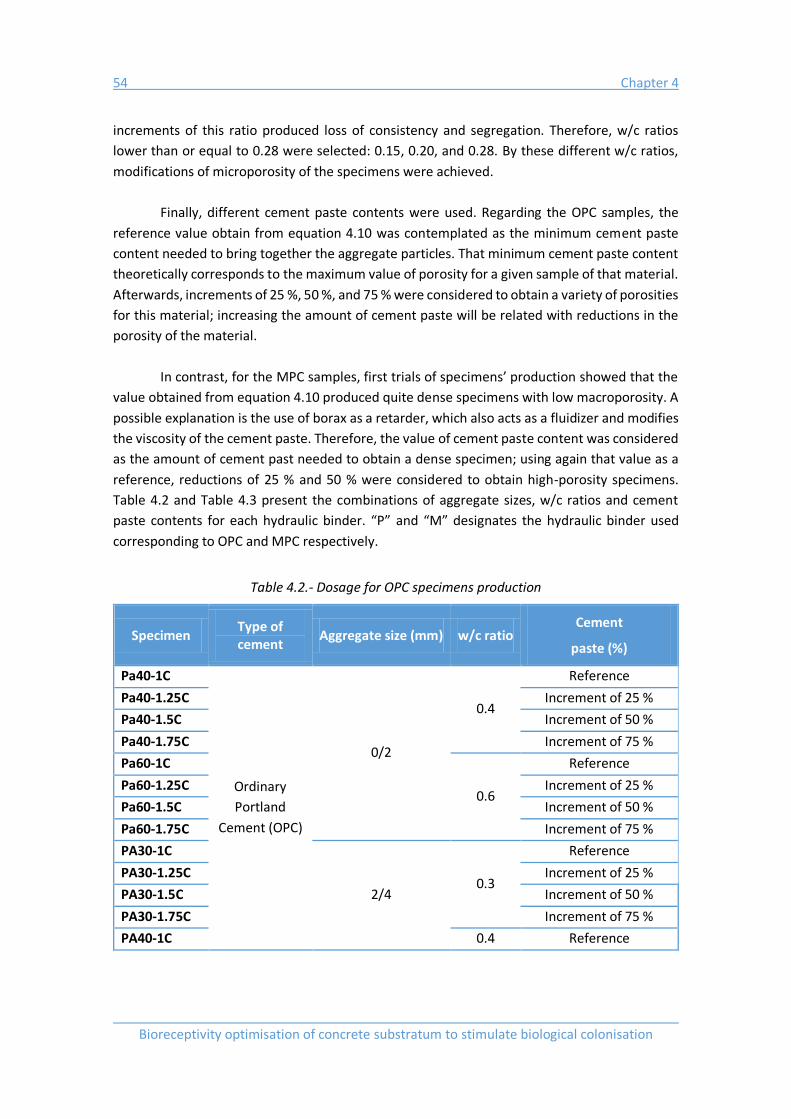
54 Chapter 4
Bioreceptivity optimisation of concrete substratum to stimulate biological colonisation
increments of this ratio produced loss of consistency and segregation. Therefore, w/c ratios
lower than or equal to 0.28 were selected: 0.15, 0.20, and 0.28. By these different w/c ratios,
modifications of microporosity of the specimens were achieved.
Finally, different cement paste contents were used. Regarding the OPC samples, the
reference value obtain from equation 4.10 was contemplated as the minimum cement paste
content needed to bring together the aggregate particles. That minimum cement paste content
theoretically corresponds to the maximum value of porosity for a given sample of that material.
Afterwards, increments of 25 %, 50 %, and 75 % were considered to obtain a variety of porosities
for this material; increasing the amount of cement paste will be related with reductions in the
porosity of the material.
In contrast, for the MPC samples, first trials of specimens’ production showed that the
value obtained from equation 4.10 produced quite dense specimens with low macroporosity. A
possible explanation is the use of borax as a retarder, which also acts as a fluidizer and modifies
the viscosity of the cement paste. Therefore, the value of cement paste content was considered
as the amount of cement past needed to obtain a dense specimen; using again that value as a
reference, reductions of 25 % and 50 % were considered to obtain high-porosity specimens.
Table 4.2 and Table 4.3 present the combinations of aggregate sizes, w/c ratios and cement
paste contents for each hydraulic binder. “P” and “M” designates the hydraulic binder used
corresponding to OPC and MPC respectively.
Table 4.2.- Dosage for OPC specimens production
Specimen Type of cement
Aggregate size (mm) w/c ratio Cement
paste (%)
Pa40-1C
Ordinary
Portland
Cement (OPC)
0/2
0.4
Reference
Pa40-1.25C Increment of 25 %
Pa40-1.5C Increment of 50 %
Pa40-1.75C Increment of 75 %
Pa60-1C
0.6
Reference
Pa60-1.25C Increment of 25 %
Pa60-1.5C Increment of 50 %
Pa60-1.75C Increment of 75 %
PA30-1C
2/4 0.3
Reference
PA30-1.25C Increment of 25 %
PA30-1.5C Increment of 50 %
PA30-1.75C Increment of 75 %
PA40-1C 0.4 Reference
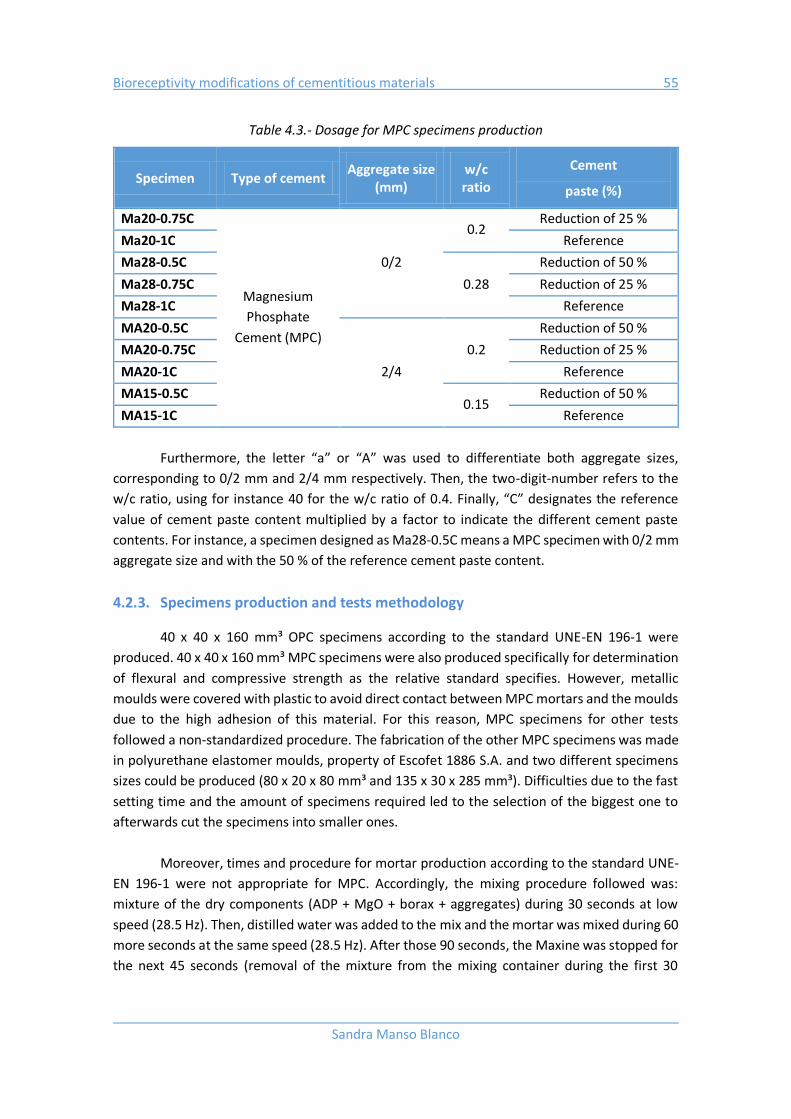
Bioreceptivity modifications of cementitious materials 55
Sandra Manso Blanco
Table 4.3.- Dosage for MPC specimens production
Specimen Type of cement Aggregate size
(mm) w/c ratio
Cement
paste (%)
Ma20-0.75C
Magnesium
Phosphate
Cement (MPC)
0/2
0.2 Reduction of 25 %
Ma20-1C Reference
Ma28-0.5C
0.28
Reduction of 50 %
Ma28-0.75C Reduction of 25 %
Ma28-1C Reference
MA20-0.5C
2/4
0.2
Reduction of 50 %
MA20-0.75C Reduction of 25 %
MA20-1C Reference
MA15-0.5C 0.15
Reduction of 50 %
MA15-1C Reference
Furthermore, the letter “a” or “A” was used to differentiate both aggregate sizes,
corresponding to 0/2 mm and 2/4 mm respectively. Then, the two-digit-number refers to the
w/c ratio, using for instance 40 for the w/c ratio of 0.4. Finally, “C” designates the reference
value of cement paste content multiplied by a factor to indicate the different cement paste
contents. For instance, a specimen designed as Ma28-0.5C means a MPC specimen with 0/2 mm
aggregate size and with the 50 % of the reference cement paste content.
4.2.3. Specimens production and tests methodology
40 x 40 x 160 mm³ OPC specimens according to the standard UNE-EN 196-1 were
produced. 40 x 40 x 160 mm³ MPC specimens were also produced specifically for determination
of flexural and compressive strength as the relative standard specifies. However, metallic
moulds were covered with plastic to avoid direct contact between MPC mortars and the moulds
due to the high adhesion of this material. For this reason, MPC specimens for other tests
followed a non-standardized procedure. The fabrication of the other MPC specimens was made
in polyurethane elastomer moulds, property of Escofet 1886 S.A. and two different specimens
sizes could be produced (80 x 20 x 80 mm³ and 135 x 30 x 285 mm³). Difficulties due to the fast
setting time and the amount of specimens required led to the selection of the biggest one to
afterwards cut the specimens into smaller ones.
Moreover, times and procedure for mortar production according to the standard UNE-
EN 196-1 were not appropriate for MPC. Accordingly, the mixing procedure followed was:
mixture of the dry components (ADP + MgO + borax + aggregates) during 30 seconds at low
speed (28.5 Hz). Then, distilled water was added to the mix and the mortar was mixed during 60
more seconds at the same speed (28.5 Hz). After those 90 seconds, the Maxine was stopped for
the next 45 seconds (removal of the mixture from the mixing container during the first 30
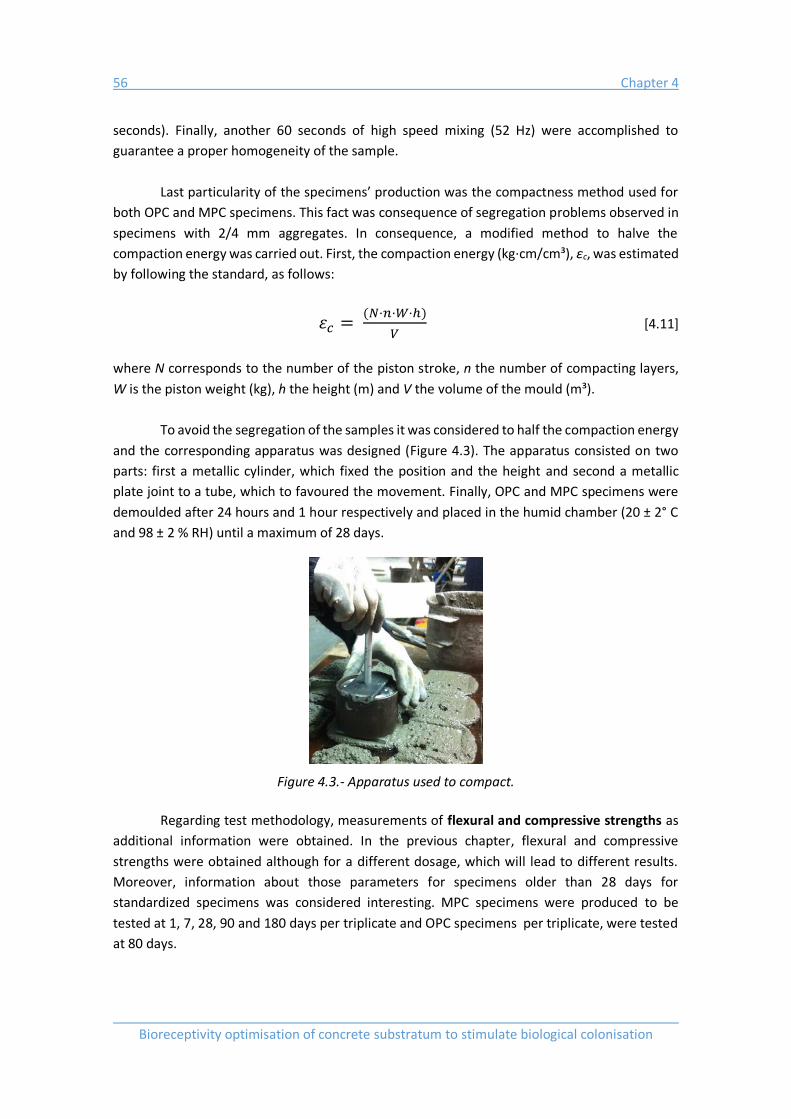
56 Chapter 4
Bioreceptivity optimisation of concrete substratum to stimulate biological colonisation
seconds). Finally, another 60 seconds of high speed mixing (52 Hz) were accomplished to
guarantee a proper homogeneity of the sample.
Last particularity of the specimens’ production was the compactness method used for
both OPC and MPC specimens. This fact was consequence of segregation problems observed in
specimens with 2/4 mm aggregates. In consequence, a modified method to halve the
compaction energy was carried out. First, the compaction energy (kg·cm/cm³), εc, was estimated
by following the standard, as follows:
𝜀𝑐 = (𝑁·𝑛·𝑊·ℎ)
𝑉 [4.11]
where N corresponds to the number of the piston stroke, n the number of compacting layers,
W is the piston weight (kg), h the height (m) and V the volume of the mould (m³).
To avoid the segregation of the samples it was considered to half the compaction energy
and the corresponding apparatus was designed (Figure 4.3). The apparatus consisted on two
parts: first a metallic cylinder, which fixed the position and the height and second a metallic
plate joint to a tube, which to favoured the movement. Finally, OPC and MPC specimens were
demoulded after 24 hours and 1 hour respectively and placed in the humid chamber (20 ± 2° C
and 98 ± 2 % RH) until a maximum of 28 days.
Figure 4.3.- Apparatus used to compact.
Regarding test methodology, measurements of flexural and compressive strengths as
additional information were obtained. In the previous chapter, flexural and compressive
strengths were obtained although for a different dosage, which will lead to different results.
Moreover, information about those parameters for specimens older than 28 days for
standardized specimens was considered interesting. MPC specimens were produced to be
tested at 1, 7, 28, 90 and 180 days per triplicate and OPC specimens per triplicate, were tested
at 80 days.

Bioreceptivity modifications of cementitious materials 57
Sandra Manso Blanco
During production of 135 x 30 x 285 mm³ specimens, heat of hydration of MPC
specimens was recorded. Previous chapter showed high temperature development during
hydration in semi-adiabatic conditions compared to standardized OPC samples. Therefore, the
maximum temperatures reached in real production conditions were quantified. The equipment
used to record time-temperature profiles was a Squirrel Data Logger with sensors introduced in
the centre of the specimen. Measurements were saved every 5 seconds until demoulding.
After demoulding, MPC specimens were cut as mentioned before to obtain smaller
specimens with a final size of 135 x 30 x 150 mm³. Then, porosity of all specimens was
determined by determining the percentage of voids according to the ASTM C642-13. The
saturated dry surface weight is one of the parameters required to estimate the percentage of
voids. However, specimens with higher porosity, generally the ones with 2/4 mm aggregates
and lower cement paste amount, presented problems in water retention. The above made it
impossible to obtain a reliable weight for the saturated specimen with dry surface.
Consequently, Archimedes’ principle was applied in order to avoid loss of water during the
weighting process. That principle states that a body immersed in a fluid is buoyed up with a force
F equal to the weight of the displaced fluid. Accordingly, this force can be estimated as follows:
𝐹 = 𝑉𝑠 · 𝜌𝑓 · 𝑔 [4.12]
𝐹 = 𝑊𝑑𝑠 − 𝑊ℎ [4.13]
where Vs is the volume of the specimen (m³), ρf the density of the fluid (kg/m³), g the gravity
(m/s²), Wds the weight of the dry specimen (kg) and Wh the hydrostatic weight (kg). Combining
these two equations (4.12 and 4.13) results in equation 4.14:
𝑉𝑠 = 𝑊𝑑𝑠− 𝑊ℎ
𝜌𝑓·𝐺 [4.14]
Additionally, the volume of voids can be estimated by subtracting the volume of the
specimen from the geometrical volume. The results of both methodologies (ASTM C642-13 and
Archimedes) are compared in order to show differences between those methods. Afterwards,
Mercury Intrusion Porosimetry (MIP) was carried out to obtain more information about the
specimens with the most different visual aspect in terms of open porosity and roughness. This
method allows characterization of microporosity and gives information about pore distribution,
giving information about porosity of the cement paste.
Due to the non-wetting property of mercury, as well as no capacity of spontaneous
penetration in pores by capillary action, it must be forced into the pores by the application of
external pressure and that pressure is inversely proportional to the size of the pores. The
subsequent analysis allows obtaining the pores volume and sizing distributions from the
pressure versus the intrusion data by means of the use of the Washburn equation. The
aforementioned equation defines the applied pressure (Pa), P, to introduce the mercury into
the pores as follows:
58 Chapter 4
Bioreceptivity optimisation of concrete substratum to stimulate biological colonisation
𝑃 = −4 𝛾 cos 𝜃
𝐷 [4.15]
where γ is the surface tension of mercury (N/m), θ is the contact angle between mercury and
the solid surface, and D the pore diameter (m). By measuring the volume of mercury intruded
into the material at each pressure step, the volume of pores in the corresponding size class can
be determined.
Different classifications for pores size in cementitious materials are present in the
scientific and technical literature. The one proposed by Mindess et al. (2002) classifies pores in
concrete in six groups by their pore diameter (Ø):
Interlayer micropores: Ø < 0.5 nm
Micropores: 0.5 < Ø < 2.5 nm
Small capillary pores (gel): 2.5 < Ø < 10 nm
Medium capillary pores: 10 < Ø < 50 nm
Big capillary pores: 50 nm < Ø < 10 µm
Trapped air: 0.1 < Ø < 1mm
The roughness of specimens’ surface was determined for the same dosages as MIP by
means of a high precision laser beam mounted on an automated laser measurement table
developed at Ghent University (De Belie et al., 2004), which is presented in Figure 4.4. From the
measurements of the surface profile, the centre-line roughness (mm), Ra, can be calculated
according to the standard BS 1134 (Figure 4.4). Additionally, the root mean square roughness
(mm), Rq, is also presented. For the determination of the roughness, 72 surface profiles were
obtained from three replicates for each of the six compositions (four profiles per specimen with
profile length 8 cm and 1.5 cm between each profile). For each profile, after correction for the
slope, three Ra-values were measured over separate parts of the profile (reference length: 40
mm). The Ra-values were calculated as the average of the 12 Ra-values obtained per specimen
type.
Finally, differential thermal analysis and thermogravimetry (DTA-TG) was carried out
to characterize the hydrated compounds of the matrix. In contrast, obtaining the same results
by means of XRD presents the problem of the high intensity peak corresponding to presence of
silica aggregates if samples are not previously sifted. DTA gives information about thermal
changes occurring in the sample during heating by comparison to a reference sample. TG
measures the change in mass of the sample as a function of time over a temperature range using
a predetermined heating rate. Samples were heated until 1100° C with a heating rate of 10°
C/min, under a N2 flux of 100 mL/min.
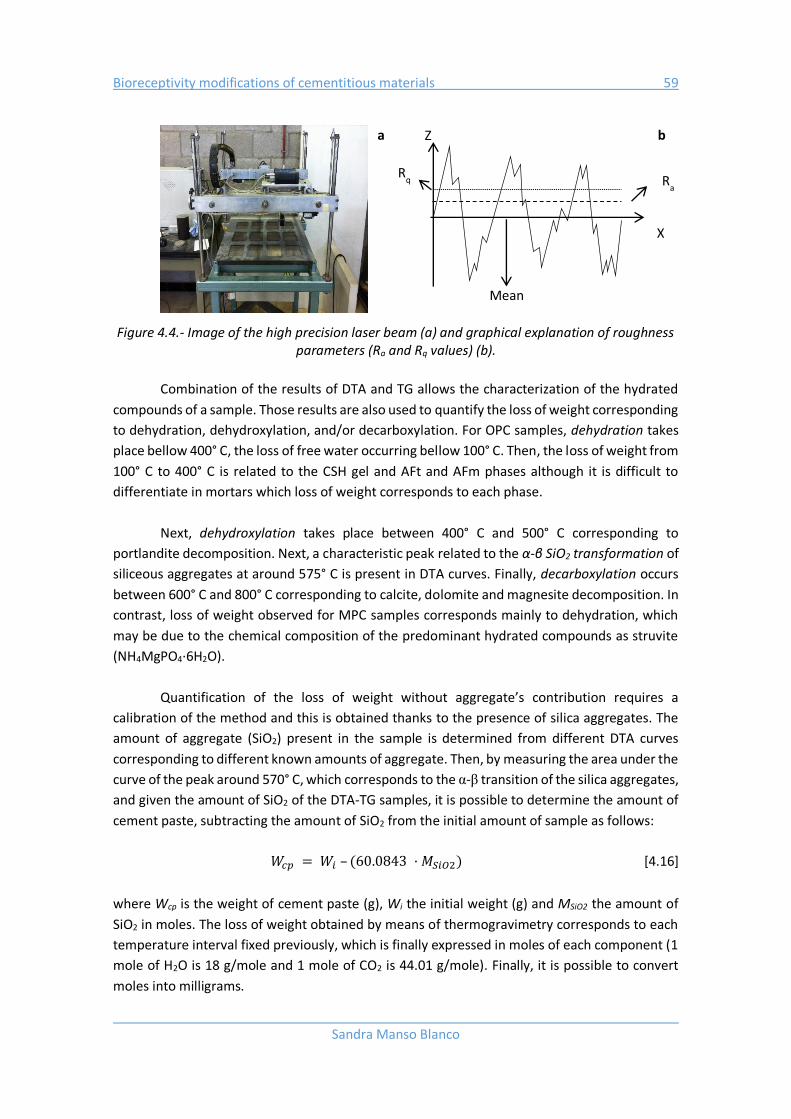
Bioreceptivity modifications of cementitious materials 59
Sandra Manso Blanco
Figure 4.4.- Image of the high precision laser beam (a) and graphical explanation of roughness parameters (Ra and Rq values) (b).
Combination of the results of DTA and TG allows the characterization of the hydrated
compounds of a sample. Those results are also used to quantify the loss of weight corresponding
to dehydration, dehydroxylation, and/or decarboxylation. For OPC samples, dehydration takes
place bellow 400° C, the loss of free water occurring bellow 100° C. Then, the loss of weight from
100° C to 400° C is related to the CSH gel and AFt and AFm phases although it is difficult to
differentiate in mortars which loss of weight corresponds to each phase.
Next, dehydroxylation takes place between 400° C and 500° C corresponding to
portlandite decomposition. Next, a characteristic peak related to the α-β SiO2 transformation of
siliceous aggregates at around 575° C is present in DTA curves. Finally, decarboxylation occurs
between 600° C and 800° C corresponding to calcite, dolomite and magnesite decomposition. In
contrast, loss of weight observed for MPC samples corresponds mainly to dehydration, which
may be due to the chemical composition of the predominant hydrated compounds as struvite
(NH4MgPO4·6H2O).
Quantification of the loss of weight without aggregate’s contribution requires a
calibration of the method and this is obtained thanks to the presence of silica aggregates. The
amount of aggregate (SiO2) present in the sample is determined from different DTA curves
corresponding to different known amounts of aggregate. Then, by measuring the area under the
curve of the peak around 570° C, which corresponds to the α-β transition of the silica aggregates,
and given the amount of SiO2 of the DTA-TG samples, it is possible to determine the amount of
cement paste, subtracting the amount of SiO2 from the initial amount of sample as follows:
𝑊𝑐𝑝 = 𝑊𝑖 – (60.0843 · 𝑀𝑆𝑖𝑂2) [4.16]
where Wcp is the weight of cement paste (g), Wi the initial weight (g) and MSiO2 the amount of
SiO2 in moles. The loss of weight obtained by means of thermogravimetry corresponds to each
temperature interval fixed previously, which is finally expressed in moles of each component (1
mole of H2O is 18 g/mole and 1 mole of CO2 is 44.01 g/mole). Finally, it is possible to convert
moles into milligrams.
Z
X
Rq
Ra
Mean line
a b
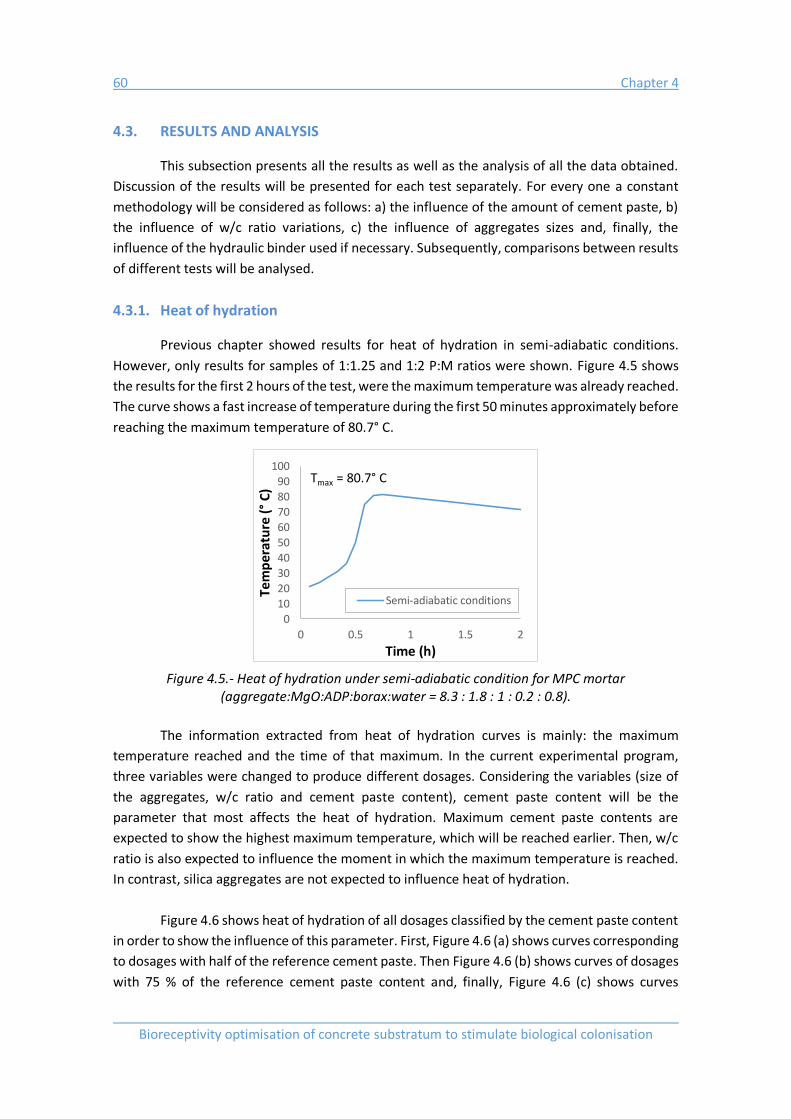
60 Chapter 4
Bioreceptivity optimisation of concrete substratum to stimulate biological colonisation
4.3. RESULTS AND ANALYSIS
This subsection presents all the results as well as the analysis of all the data obtained.
Discussion of the results will be presented for each test separately. For every one a constant
methodology will be considered as follows: a) the influence of the amount of cement paste, b)
the influence of w/c ratio variations, c) the influence of aggregates sizes and, finally, the
influence of the hydraulic binder used if necessary. Subsequently, comparisons between results
of different tests will be analysed.
4.3.1. Heat of hydration
Previous chapter showed results for heat of hydration in semi-adiabatic conditions.
However, only results for samples of 1:1.25 and 1:2 P:M ratios were shown. Figure 4.5 shows
the results for the first 2 hours of the test, were the maximum temperature was already reached.
The curve shows a fast increase of temperature during the first 50 minutes approximately before
reaching the maximum temperature of 80.7° C.
Figure 4.5.- Heat of hydration under semi-adiabatic condition for MPC mortar (aggregate:MgO:ADP:borax:water = 8.3 : 1.8 : 1 : 0.2 : 0.8).
The information extracted from heat of hydration curves is mainly: the maximum
temperature reached and the time of that maximum. In the current experimental program,
three variables were changed to produce different dosages. Considering the variables (size of
the aggregates, w/c ratio and cement paste content), cement paste content will be the
parameter that most affects the heat of hydration. Maximum cement paste contents are
expected to show the highest maximum temperature, which will be reached earlier. Then, w/c
ratio is also expected to influence the moment in which the maximum temperature is reached.
In contrast, silica aggregates are not expected to influence heat of hydration.
Figure 4.6 shows heat of hydration of all dosages classified by the cement paste content
in order to show the influence of this parameter. First, Figure 4.6 (a) shows curves corresponding
to dosages with half of the reference cement paste. Then Figure 4.6 (b) shows curves of dosages
with 75 % of the reference cement paste content and, finally, Figure 4.6 (c) shows curves
Tmax = 80.7° C
0
10
20
30
40
50
60
70
80
90
100
0 0.5 1 1.5 2
Tem
pe
ratu
re (
°C
)
Time (h)
Semi-adiabatic conditions
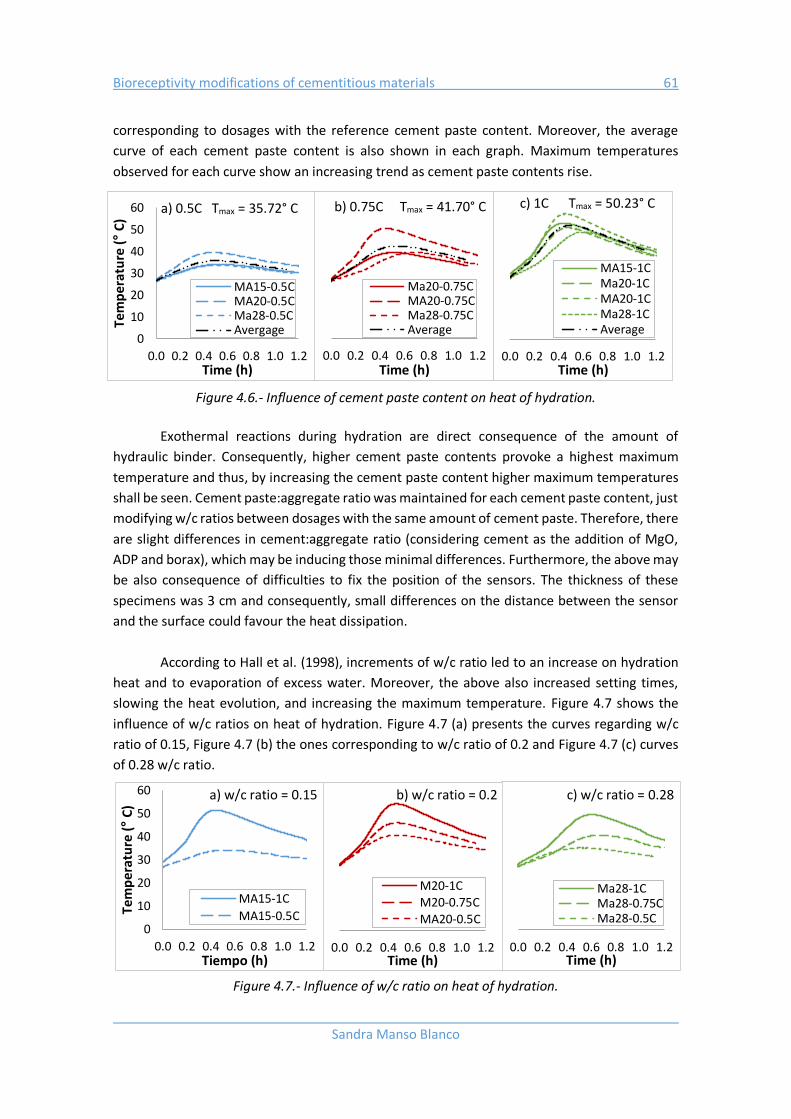
Bioreceptivity modifications of cementitious materials 61
Sandra Manso Blanco
corresponding to dosages with the reference cement paste content. Moreover, the average
curve of each cement paste content is also shown in each graph. Maximum temperatures
observed for each curve show an increasing trend as cement paste contents rise.
Figure 4.6.- Influence of cement paste content on heat of hydration.
Exothermal reactions during hydration are direct consequence of the amount of
hydraulic binder. Consequently, higher cement paste contents provoke a highest maximum
temperature and thus, by increasing the cement paste content higher maximum temperatures
shall be seen. Cement paste:aggregate ratio was maintained for each cement paste content, just
modifying w/c ratios between dosages with the same amount of cement paste. Therefore, there
are slight differences in cement:aggregate ratio (considering cement as the addition of MgO,
ADP and borax), which may be inducing those minimal differences. Furthermore, the above may
be also consequence of difficulties to fix the position of the sensors. The thickness of these
specimens was 3 cm and consequently, small differences on the distance between the sensor
and the surface could favour the heat dissipation.
According to Hall et al. (1998), increments of w/c ratio led to an increase on hydration
heat and to evaporation of excess water. Moreover, the above also increased setting times,
slowing the heat evolution, and increasing the maximum temperature. Figure 4.7 shows the
influence of w/c ratios on heat of hydration. Figure 4.7 (a) presents the curves regarding w/c
ratio of 0.15, Figure 4.7 (b) the ones corresponding to w/c ratio of 0.2 and Figure 4.7 (c) curves
of 0.28 w/c ratio.
Figure 4.7.- Influence of w/c ratio on heat of hydration.
0
10
20
30
40
50
60
0.0 0.2 0.4 0.6 0.8 1.0 1.2
Tem
per
atu
re (°
C)
Tiempo (h)
MA15-1C
MA15-0.5C
0.0 0.2 0.4 0.6 0.8 1.0 1.2Time (h)
Ma28-1CMa28-0.75CMa28-0.5C
0.0 0.2 0.4 0.6 0.8 1.0 1.2Time (h)
M20-1CM20-0.75CMA20-0.5C
a) w/c ratio = 0.15 c) w/c ratio = 0.28 b) w/c ratio = 0.2
0
10
20
30
40
50
60
0.0 0.2 0.4 0.6 0.8 1.0 1.2
Tem
per
atu
re (°
C)
Time (h)
MA15-0.5CMA20-0.5CMa28-0.5CAvergage
0.0 0.2 0.4 0.6 0.8 1.0 1.2Time (h)
Ma20-0.75CMA20-0.75CMa28-0.75CAverage
0.0 0.2 0.4 0.6 0.8 1.0 1.2Time (h)
MA15-1CMa20-1CMA20-1CMa28-1CAverage
c) 1C Tmax = 50.23° C b) 0.75C Tmax = 41.70° C a) 0.5C Tmax = 35.72° C
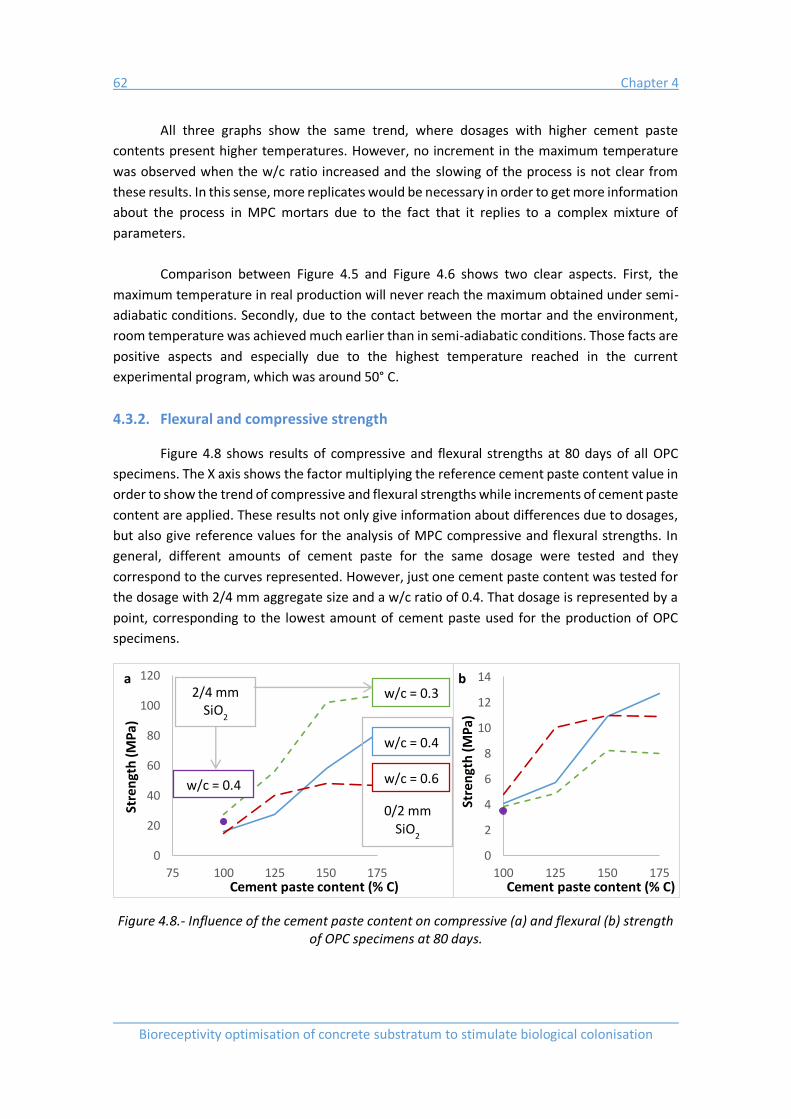
62 Chapter 4
Bioreceptivity optimisation of concrete substratum to stimulate biological colonisation
All three graphs show the same trend, where dosages with higher cement paste
contents present higher temperatures. However, no increment in the maximum temperature
was observed when the w/c ratio increased and the slowing of the process is not clear from
these results. In this sense, more replicates would be necessary in order to get more information
about the process in MPC mortars due to the fact that it replies to a complex mixture of
parameters.
Comparison between Figure 4.5 and Figure 4.6 shows two clear aspects. First, the
maximum temperature in real production will never reach the maximum obtained under semi-
adiabatic conditions. Secondly, due to the contact between the mortar and the environment,
room temperature was achieved much earlier than in semi-adiabatic conditions. Those facts are
positive aspects and especially due to the highest temperature reached in the current
experimental program, which was around 50° C.
4.3.2. Flexural and compressive strength
Figure 4.8 shows results of compressive and flexural strengths at 80 days of all OPC
specimens. The X axis shows the factor multiplying the reference cement paste content value in
order to show the trend of compressive and flexural strengths while increments of cement paste
content are applied. These results not only give information about differences due to dosages,
but also give reference values for the analysis of MPC compressive and flexural strengths. In
general, different amounts of cement paste for the same dosage were tested and they
correspond to the curves represented. However, just one cement paste content was tested for
the dosage with 2/4 mm aggregate size and a w/c ratio of 0.4. That dosage is represented by a
point, corresponding to the lowest amount of cement paste used for the production of OPC
specimens.
Figure 4.8.- Influence of the cement paste content on compressive (a) and flexural (b) strength of OPC specimens at 80 days.
0
2
4
6
8
10
12
14
100 125 150 175
Stre
ngt
h (M
Pa)
Cement paste content (% C)
0
20
40
60
80
100
120
75 100 125 150 175
Stre
ngt
h (M
Pa)
Cement paste content (% C)
0/2 mm SiO
2
w/c = 0.3
w/c = 0.4
w/c = 0.6 w/c = 0.4
2/4 mm SiO
2
a b

Bioreceptivity modifications of cementitious materials 63
Sandra Manso Blanco
Both graphs show the same trend, increments of cement paste content imply
increments in compressive as well as in flexural strengths until arriving to a saturation point.
That point means that higher cement paste contents will not provoke an increment of
compressive and/or flexural strengths. Considering the three curves, two of them seem to reach
that point while the strength of the dosage corresponding to the 0/2 mm aggregates size and
w/c ratio of 0.4 seems to continue growing.
Furthermore, w/c ratios seem to have more influence on compressive and flexural
strengths for higher cement paste contents. The above is visible by comparing differences in
results of different dosages with the lowest cement paste content, and comparing the
differences between the results of specimens with the highest amount of cement paste. For the
first case, difference between the lowest and the maximum compressive strength corresponds
to an increment of around 85 %, when for the highest cement paste content, the difference is
around 130 %. In accordance, the same behaviour is observed for flexural strength results, with
increments of around 37 % and 59 % for lower and higher cement paste contents respectively.
Regarding differences due to the aggregate size used, compressive strength results may
be higher for lower w/c ratios, corresponding to a less porous matrix of the material. However,
results corresponding to dosage Pa40-1.25C seem to be anomalous due to the low result
obtained. Moreover, the aforementioned trend is not accomplished for flexural strength results.
In that case, curves corresponding to dosages with the smaller aggregate size obtained the
highest values.
Regarding MPC specimens, the comparison between compressive strengths at 28 and
180 days did not show significant differences. Consequently, same analysis is presented in Figure
4.9 regarding the influence of the cement paste content on the final compressive and flexural
strengths studied at 180 days. Regarding the influence of cement paste content on compressive
and flexural strengths, Figure 4.9 shows the same trends as for OPC specimens. All dosages
recorded higher strengths when higher cement paste amount was used. However, the
saturation point was not reached with any of the dosages and no correlation was observed
between w/c ratio or aggregate size and compressive nor flexural strengths. Consequently, more
specimens should be tested in order to get more results and a better understanding of their
behaviour.
Finally, compressive and flexural strengths of the dosage with a P:M ratio of 1:1.75
presented in the previous chapter were 63.5 MPa and 8.05 MPa respectively. Those results
correspond to a dosage with 0/2 mm aggregate size, a w/c ratio of 0.28 and a cement paste
content of 135 % of the reference value. Results of the dosage with the smaller amount of
cement paste and the w/c ratio of 0.28 presented in Figure 4.9 concern to dosages with a
maximum cement paste content equal to the reference value. That maximum presented results
of 27.82 MPa for compressive strength and 5.05 MPa for flexural strength that considerably
differ from the previously mentioned.

64 Chapter 4
Bioreceptivity optimisation of concrete substratum to stimulate biological colonisation
Figure 4.9.- Influence of the cement paste content on compressive (a) and flexural (b) strength of MPC specimens at 180 days.
4.3.3. Porosity
Table 4.4 shows the values corresponding to the dry weight (g), Wds, the immersed
weight (g), Wis and the weight of the saturated specimen with dry surface (g), Wsds, obtained
accordingly to ASTM C642-13 standard.
Percentage of voids was then calculated from the values presented above. Figure 4.10
presents the variation of the percentage of voids with the cement paste content. Percentages
up to 100 % show results corresponding to MPC specimens and values above 100 % represent
OPC specimens. A general trend was observed for all dosages, in which increments of cement
paste content imply, as it was expected, a drop in the percentage of voids. Furthermore, it was
evident that the reference value of the amount of cement paste, 100 % of C, produces specimens
with lower percentage of voids for MPC mortars than for OPC mortars. In addition, MPC
specimens with the highest amount of cement paste showed lower percentage of voids than
most of the OPC specimens with a cement paste content of 175 % of the reference value.
Specimens with highest aggregate size showed a higher percentage of voids for the same
cement paste content, probably due to the biggest diameter of open porosity. Regarding the
influence of the w/c ratio on this parameter, a general trend may show that higher w/c ratios
produce specimens with higher percentage of voids. In accordance, results obtained for OPC
specimens with the highest amounts of cement paste followed that trend. However, specimens
with lower amounts of cement paste presented contradictory results for specimens Pa40-1C and
Pa60-1C. The above could be consequence of an overestimation of percentage of voids due to
the loss of aggregates. The amount of cement paste was too low in those specimens, especially
the dosage with the w/c ratio of 0.4, and consequently loss of non-joint aggregates during the
immersion period was observed. In contrast, results obtained for MPC specimens did not show
the aforementioned trend, being less evident for higher cement paste contents of MPC
specimens due to the high reduction of the percentage of voids.
0
5
10
15
20
25
30
35
40
50 60 70 80 90 100
Stre
ngt
h (M
Pa)
Cement paste content (% C)
0/2 mm SiO2
2/4 mm SiO2
w/c = 0.15 w/c = 0.2
w/c = 0.28
w/c = 0.2
0
1
2
3
4
5
6
50 60 70 80 90 100
Stre
ngt
h (
MP
a)
Cement paste content (% C)
b a

Bioreceptivity modifications of cementitious materials 65
Sandra Manso Blanco
Table 4.4.- Weight of specimens under different conditions
Specimen Wds (g) Wis (g) Wsds (g)
Pa40-1C 449.8 260.0 506.4
Pa40-1.25C 490.6 278.9 527.8
Pa40-1.5C 572.1 331.0 593.2
Pa40-1.75C 590.6 344.9 609.2
Pa60-1C 462.3 260.0 505.9
Pa60-1.25C 535.2 307.7 564.0
Pa60-1.5C 534.5 307.4 565.9
Pa60-1.75C 534.6 310.9 565.9
PA30-1C 513.9 302.1 539.0
PA30-1.25C 568.2 334.0 587.6
PA30-1.5C 619.6 368.7 633.0
PA30-1.75C 622.0 369.7 635.1
PA40-1C 494.6 287.5 522.4
Ma20-0.75C 1234.6 698.9 1353.8
Ma20-1C 1353.1 749.4 1373.1
Ma28-0.5C 1002.5 569.6 1141.5
Ma28-0.75C 1054.0 606.2 1198.5
Ma28-1C 1345.4 732.4 1360.9
MA20-0.5C 1072.5 624.7 1142.6
MA20-0.75C 1375.4 780.8 1410.1
MA20-1C 1385.0 796.1 1403.1
MA15-0.5C 1366.2 782.5 1383.1
MA15-1C 1098.2 642.5 1167.2
Figure 4.10.- Influence of cement paste content in percentage of voids for MPC and OPC specimens estimated according to the standard ASTM C642-13.
0
5
10
15
20
25
30
50 75 100 125 150 175
Per
cen
tage
of
void
s (%
)
Cement paste content (% C)
w/c = 0.4
w/c = 0.2
w/c = 0.28
w/c = 0.6
w/c = 0.3
MPC OPC 0/2 mm SiO2
2/4 mm SiO2

66 Chapter 4
Bioreceptivity optimisation of concrete substratum to stimulate biological colonisation
Regarding specimens with higher open porosity, results should be considered with
caution. Loss of water was detected in the manipulation process, resulting in an underestimation
of the percentage of voids. Consequently, estimation of porosity by means of application of
Archimedes’ principle was considered. For this purpose, Figure 4.11 shows the percentage of
voids obtained according to the Archimedes’ principle.
Figure 4.11.- Influence of cement paste content in percentage of voids for MPC and OPC specimens estimated according to Archimedes’ principle.
Same general trends were observed for results obtained according to Archimedes’
principle. However, some remarkable differences between Figure 4.10 and Figure 4.11 are
evident by comparing them. First, higher percentage of voids in MPC specimens was observed
independent of the amount of cement paste. Moreover, the objective of determining
percentage of voids by means of application of Archimedes’ principle was accomplished due to
the big increment of percentage of voids observed for specimens with 2/4 mm aggregates size.
As mentioned previously, the loss of water during manipulation of specimens and their high
open porosity was avoided by mean of this method. Regarding OPC specimens, slight differences
were observed by comparing both methodologies.
Regarding the MIP test, Figure 4.12 shows the results of the percentage of porosity as
well as the pore size distribution of each sample. Capillary pores are the most interesting due to
the purpose of stimulating colonisation of living organisms. Water contained in those pores will
be available for the living organisms on the materials’ surface. Then, Figure 4.12a shows the
porosity estimated by means of MIP and Figure 4.12b shows the percentage of pores classified
in each group, the big capillary pores (green) being the most interesting.
In Figure 4.12a, OPC specimens made with 0/2 mm aggregates (Pa40-1C and Pa60-
1.75C) showed a percentage of porosity around 15 %, although all the other specimens did not
reach the 10 % value. Between the specimens with the lower porosity, Ma28-C showed the
highest value of porosity. Differences in the percentage of porosity between OPC specimens
mainly correspond to the cement paste content. Due to the higher specific surface of the 0/2 mm
0
5
10
15
20
25
30
35
50 75 100 125 150 175
Per
cen
tage
of
void
s (%
)
Cement paste content (% C)
w/c = 0.4
w/c = 0.2
w/c = 0.2
MPC OPC 0/2 mm SiO2
2/4 mm SiO2
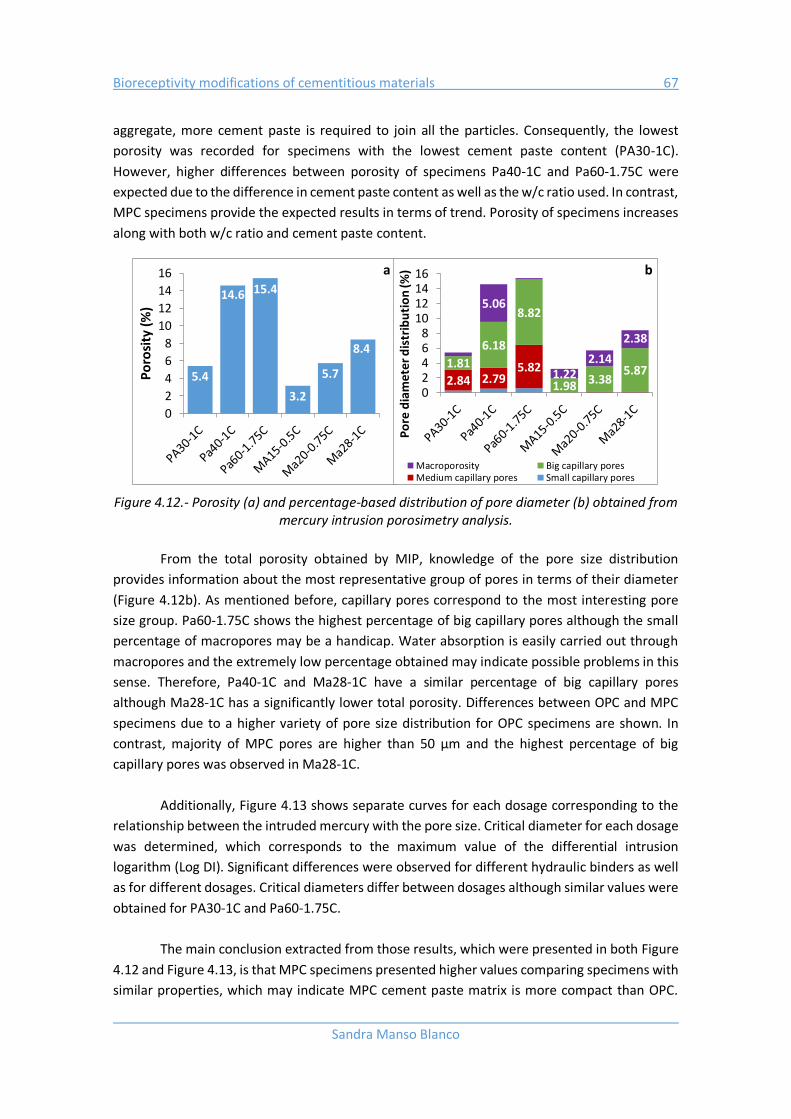
Bioreceptivity modifications of cementitious materials 67
Sandra Manso Blanco
aggregate, more cement paste is required to join all the particles. Consequently, the lowest
porosity was recorded for specimens with the lowest cement paste content (PA30-1C).
However, higher differences between porosity of specimens Pa40-1C and Pa60-1.75C were
expected due to the difference in cement paste content as well as the w/c ratio used. In contrast,
MPC specimens provide the expected results in terms of trend. Porosity of specimens increases
along with both w/c ratio and cement paste content.
Figure 4.12.- Porosity (a) and percentage-based distribution of pore diameter (b) obtained from mercury intrusion porosimetry analysis.
From the total porosity obtained by MIP, knowledge of the pore size distribution
provides information about the most representative group of pores in terms of their diameter
(Figure 4.12b). As mentioned before, capillary pores correspond to the most interesting pore
size group. Pa60-1.75C shows the highest percentage of big capillary pores although the small
percentage of macropores may be a handicap. Water absorption is easily carried out through
macropores and the extremely low percentage obtained may indicate possible problems in this
sense. Therefore, Pa40-1C and Ma28-1C have a similar percentage of big capillary pores
although Ma28-1C has a significantly lower total porosity. Differences between OPC and MPC
specimens due to a higher variety of pore size distribution for OPC specimens are shown. In
contrast, majority of MPC pores are higher than 50 µm and the highest percentage of big
capillary pores was observed in Ma28-1C.
Additionally, Figure 4.13 shows separate curves for each dosage corresponding to the
relationship between the intruded mercury with the pore size. Critical diameter for each dosage
was determined, which corresponds to the maximum value of the differential intrusion
logarithm (Log DI). Significant differences were observed for different hydraulic binders as well
as for different dosages. Critical diameters differ between dosages although similar values were
obtained for PA30-1C and Pa60-1.75C.
The main conclusion extracted from those results, which were presented in both Figure
4.12 and Figure 4.13, is that MPC specimens presented higher values comparing specimens with
similar properties, which may indicate MPC cement paste matrix is more compact than OPC.
5.4
14.6 15.4
3.2
5.7
8.4
0
2
4
6
8
10
12
14
16
Po
rosi
ty (
%)
a
2.84 2.795.821.81
6.18
8.82
1.98 3.385.87
5.06
1.222.14
2.38
02468
10121416
Po
re d
iam
ete
r d
istr
ibu
tio
n (%
)
Macroporosity Big capillary poresMedium capillary pores Small capillary pores
b

68 Chapter 4
Bioreceptivity optimisation of concrete substratum to stimulate biological colonisation
Regarding peaks distribution, it is interesting to remark particularities of the curves. Samples did
not follow any particular or similar trend. Some specimens presented a predominant peak
followed by minor ones (PA30-1C, Pa60-1.75C), others two regions clearly different (Pa40-1C
and Ma20-0.75C) and finally, others with more irregular pattern (MA15-0.5C and Ma28-1C).
Figure 4.13.- Influence of dosage on critical diameter.
The aforementioned results give an idea about the most interesting dosage to produce
mortar with high bioreceptivity. Extreme porosities understood as materials with pores of small
diameters as the predominant group, as well as materials mainly composed by macropores,
would present problems in terms of water absorption and water retention. The most interesting
network of interconnected pores would be formed by a composition of different pore sizes. It is
thought that the most interesting relationship should be established between macropores and
capillary pores. First group would favour water absorption and the second one would better
retain the water inside the material. Accordingly, MPC dosages may be better than OPC in terms
of water retention. Figure 4.12 showed less diversity of pores although a better equilibrium
between macroporosity and big capillary pores was observed. Figure 4.13 supports this
hypothesis due to the most irregular pattern observed in MPC samples.
Additionally, Figure 4.14 shows images of the appearance of those specimens. In that
figure higher porous diameters were observed for PA30-1C and MA15-0.5C specimens. Pa60-
1.75C specimens showed low amount of internal pores as well as the lowest diameter.
0.03
0.00
0.02
0.04
0.06
0.08
0.10
0.12
0.14
0.16
0.0010.1101000
Log
DI (
mL/
g)
Pore diameter (µm)
PA30-1C a
20.14
0.0010.1101000Pore diameter (µm)
Pa40-1C b
0.05
0.0010.1101000Pore diameter (µm)
Pa60-1.75C c
1.62
0.000
0.005
0.010
0.015
0.020
0.025
0.030
0.035
0.0010.1101000
Log
DI (
mL/
g)
Pore diameter (µm)
MA15-0.5C d
90.84
0.0010.1101000Pore diameter (µm)
Ma20-0.75C e 2.53
0.0010.1101000Pore diameter (µm)
Ma28-1C f
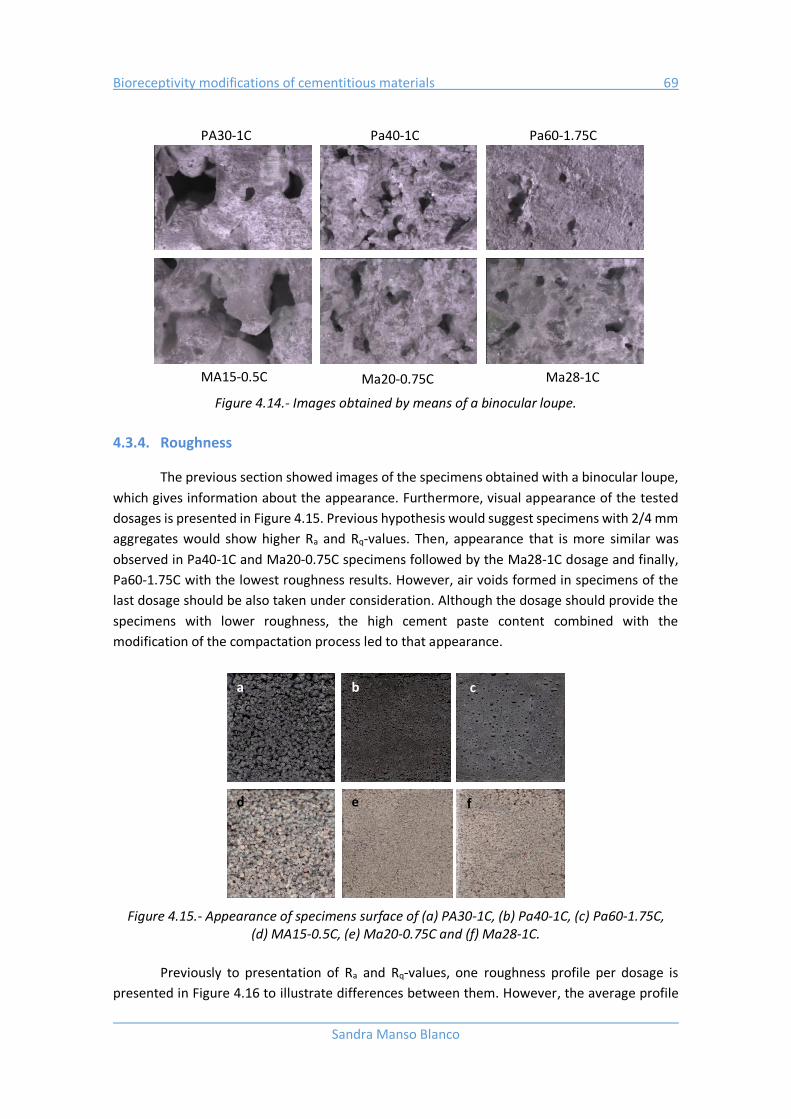
Bioreceptivity modifications of cementitious materials 69
Sandra Manso Blanco
Figure 4.14.- Images obtained by means of a binocular loupe.
4.3.4. Roughness
The previous section showed images of the specimens obtained with a binocular loupe,
which gives information about the appearance. Furthermore, visual appearance of the tested
dosages is presented in Figure 4.15. Previous hypothesis would suggest specimens with 2/4 mm
aggregates would show higher Ra and Rq-values. Then, appearance that is more similar was
observed in Pa40-1C and Ma20-0.75C specimens followed by the Ma28-1C dosage and finally,
Pa60-1.75C with the lowest roughness results. However, air voids formed in specimens of the
last dosage should be also taken under consideration. Although the dosage should provide the
specimens with lower roughness, the high cement paste content combined with the
modification of the compactation process led to that appearance.
Figure 4.15.- Appearance of specimens surface of (a) PA30-1C, (b) Pa40-1C, (c) Pa60-1.75C, (d) MA15-0.5C, (e) Ma20-0.75C and (f) Ma28-1C.
Previously to presentation of Ra and Rq-values, one roughness profile per dosage is
presented in Figure 4.16 to illustrate differences between them. However, the average profile
Pa40-1C Pa60-1.75C PA30-1C
Ma20-0.75C Ma28-1C MA15-0.5C
d f e
c b a
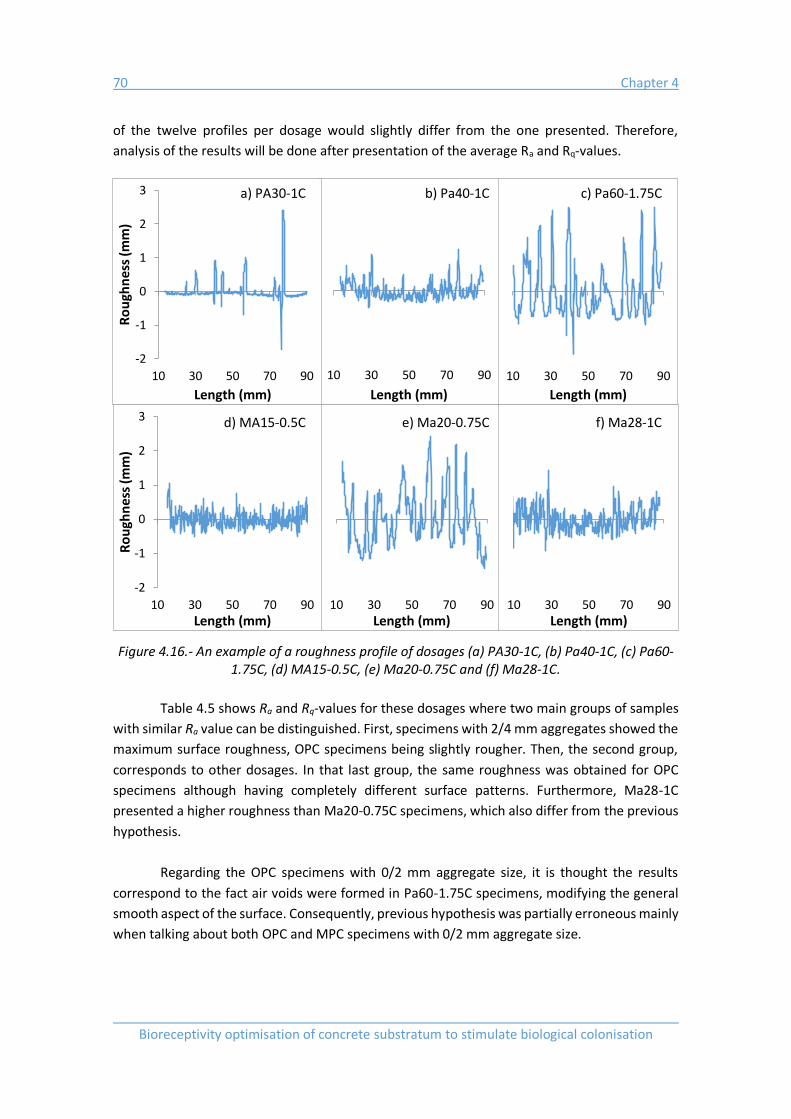
70 Chapter 4
Bioreceptivity optimisation of concrete substratum to stimulate biological colonisation
of the twelve profiles per dosage would slightly differ from the one presented. Therefore,
analysis of the results will be done after presentation of the average Ra and Rq-values.
Figure 4.16.- An example of a roughness profile of dosages (a) PA30-1C, (b) Pa40-1C, (c) Pa60-1.75C, (d) MA15-0.5C, (e) Ma20-0.75C and (f) Ma28-1C.
Table 4.5 shows Ra and Rq-values for these dosages where two main groups of samples
with similar Ra value can be distinguished. First, specimens with 2/4 mm aggregates showed the
maximum surface roughness, OPC specimens being slightly rougher. Then, the second group,
corresponds to other dosages. In that last group, the same roughness was obtained for OPC
specimens although having completely different surface patterns. Furthermore, Ma28-1C
presented a higher roughness than Ma20-0.75C specimens, which also differ from the previous
hypothesis.
Regarding the OPC specimens with 0/2 mm aggregate size, it is thought the results
correspond to the fact air voids were formed in Pa60-1.75C specimens, modifying the general
smooth aspect of the surface. Consequently, previous hypothesis was partially erroneous mainly
when talking about both OPC and MPC specimens with 0/2 mm aggregate size.
10 30 50 70 90
Length (mm)
10 30 50 70 90
Length (mm)
-2
-1
0
1
2
3
10 30 50 70 90
Ro
ugh
nes
s (m
m)
Length (mm)
-2
-1
0
1
2
3
10 30 50 70 90
Ro
ugh
ne
ss (m
m)
Length (mm)10 30 50 70 90
Length (mm)10 30 50 70 90
Length (mm)
a) PA30-1C b) Pa40-1C c) Pa60-1.75C
d) MA15-0.5C e) Ma20-0.75C f) Ma28-1C
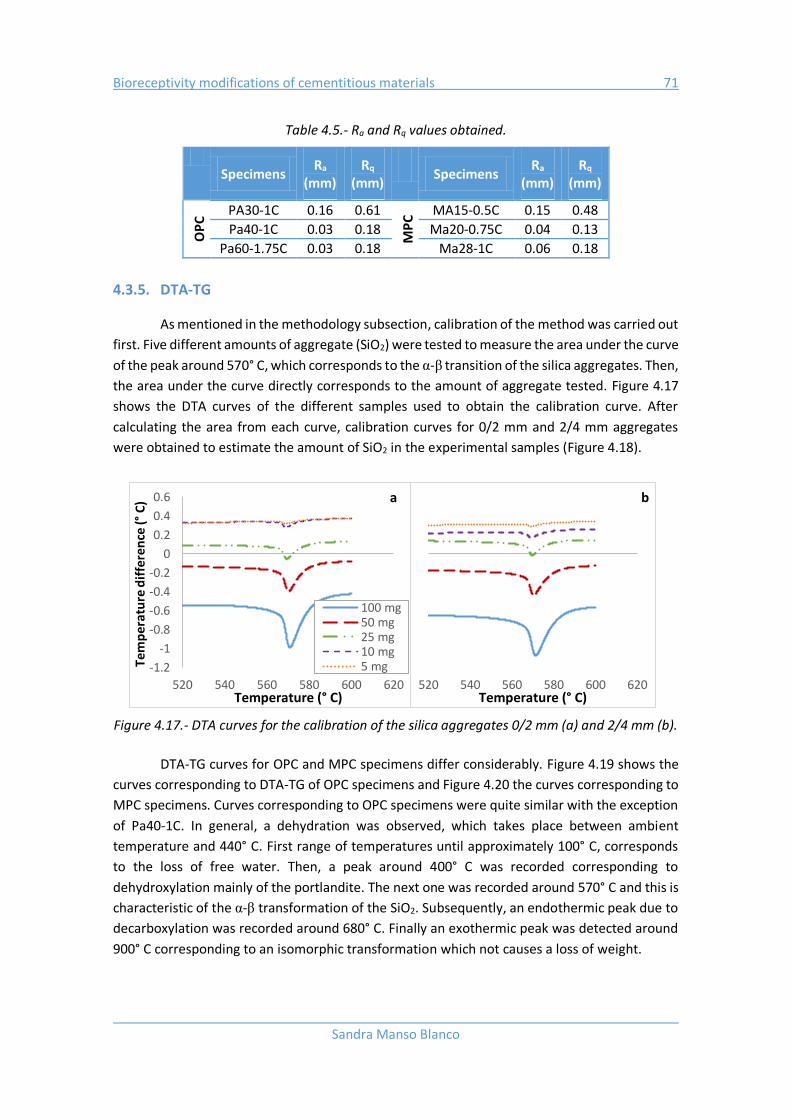
Bioreceptivity modifications of cementitious materials 71
Sandra Manso Blanco
Table 4.5.- Ra and Rq values obtained.
Specimens
Ra (mm)
Rq (mm)
Specimens
Ra (mm)
Rq (mm)
OP
C PA30-1C 0.16 0.61
MP
C MA15-0.5C 0.15 0.48
Pa40-1C 0.03 0.18 Ma20-0.75C 0.04 0.13
Pa60-1.75C 0.03 0.18 Ma28-1C 0.06 0.18
4.3.5. DTA-TG
As mentioned in the methodology subsection, calibration of the method was carried out
first. Five different amounts of aggregate (SiO2) were tested to measure the area under the curve
of the peak around 570° C, which corresponds to the α-β transition of the silica aggregates. Then,
the area under the curve directly corresponds to the amount of aggregate tested. Figure 4.17
shows the DTA curves of the different samples used to obtain the calibration curve. After
calculating the area from each curve, calibration curves for 0/2 mm and 2/4 mm aggregates
were obtained to estimate the amount of SiO2 in the experimental samples (Figure 4.18).
Figure 4.17.- DTA curves for the calibration of the silica aggregates 0/2 mm (a) and 2/4 mm (b).
DTA-TG curves for OPC and MPC specimens differ considerably. Figure 4.19 shows the
curves corresponding to DTA-TG of OPC specimens and Figure 4.20 the curves corresponding to
MPC specimens. Curves corresponding to OPC specimens were quite similar with the exception
of Pa40-1C. In general, a dehydration was observed, which takes place between ambient
temperature and 440° C. First range of temperatures until approximately 100° C, corresponds
to the loss of free water. Then, a peak around 400° C was recorded corresponding to
dehydroxylation mainly of the portlandite. The next one was recorded around 570° C and this is
characteristic of the α-β transformation of the SiO2. Subsequently, an endothermic peak due to
decarboxylation was recorded around 680° C. Finally an exothermic peak was detected around
900° C corresponding to an isomorphic transformation which not causes a loss of weight.
-1.2
-1
-0.8
-0.6
-0.4
-0.2
0
0.2
0.4
0.6
520 540 560 580 600 620
Te
mp
era
ture
dif
fere
nce
(°C
)
Temperature (° C)
100 mg50 mg25 mg10 mg5 mg
520 540 560 580 600 620Temperature (° C)
a b
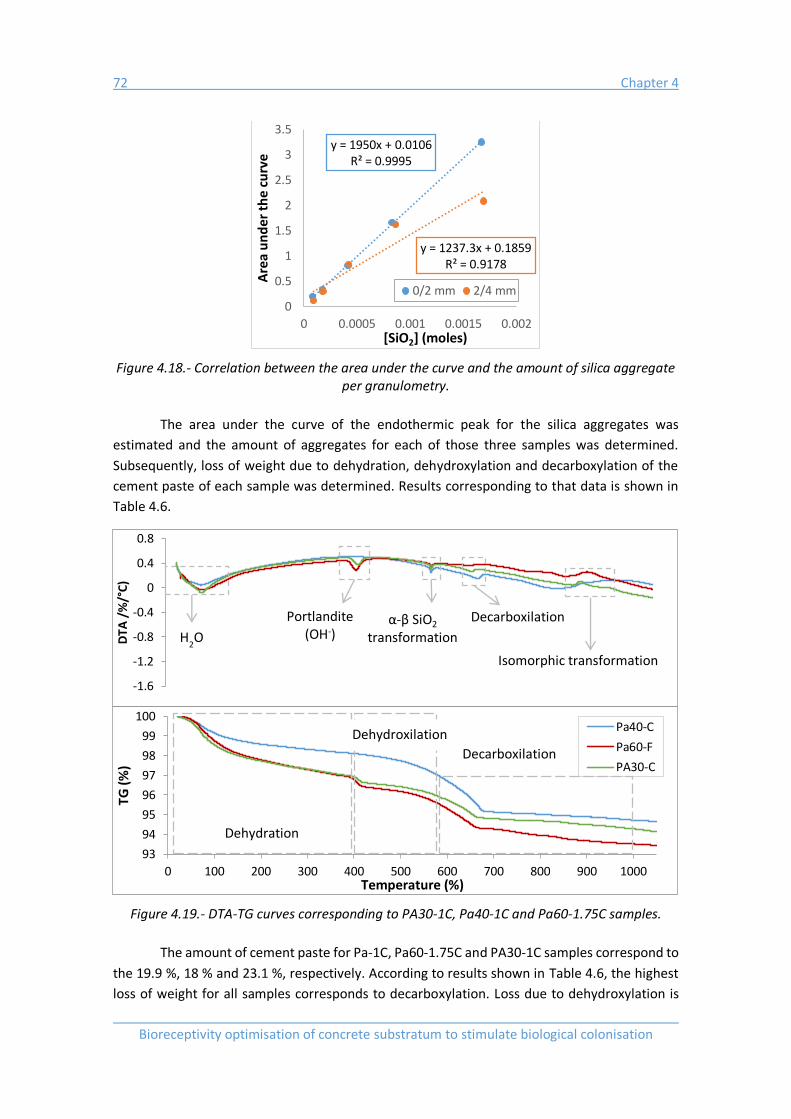
72 Chapter 4
Bioreceptivity optimisation of concrete substratum to stimulate biological colonisation
Figure 4.18.- Correlation between the area under the curve and the amount of silica aggregate per granulometry.
The area under the curve of the endothermic peak for the silica aggregates was
estimated and the amount of aggregates for each of those three samples was determined.
Subsequently, loss of weight due to dehydration, dehydroxylation and decarboxylation of the
cement paste of each sample was determined. Results corresponding to that data is shown in
Table 4.6.
Figure 4.19.- DTA-TG curves corresponding to PA30-1C, Pa40-1C and Pa60-1.75C samples.
The amount of cement paste for Pa-1C, Pa60-1.75C and PA30-1C samples correspond to
the 19.9 %, 18 % and 23.1 %, respectively. According to results shown in Table 4.6, the highest
loss of weight for all samples corresponds to decarboxylation. Loss due to dehydroxylation is
y = 1950x + 0.0106R² = 0.9995
y = 1237.3x + 0.1859R² = 0.9178
0
0.5
1
1.5
2
2.5
3
3.5
0 0.0005 0.001 0.0015 0.002
Are
a u
nd
er t
he
curv
e
[SiO2] (moles)
0/2 mm 2/4 mm
93
94
95
96
97
98
99
100
0 100 200 300 400 500 600 700 800 900 1000
TG (
%)
Temperature (%)
Pa40-C
Pa60-F
PA30-C
-1.6
-1.2
-0.8
-0.4
0
0.4
0.8
DTA
/%
/°C
)
α-β SiO2
transformation
Decarboxilation
Isomorphic transformation
Portlandite(OH-)H
2O
Decarboxilation
Dehydroxilation
Dehydration
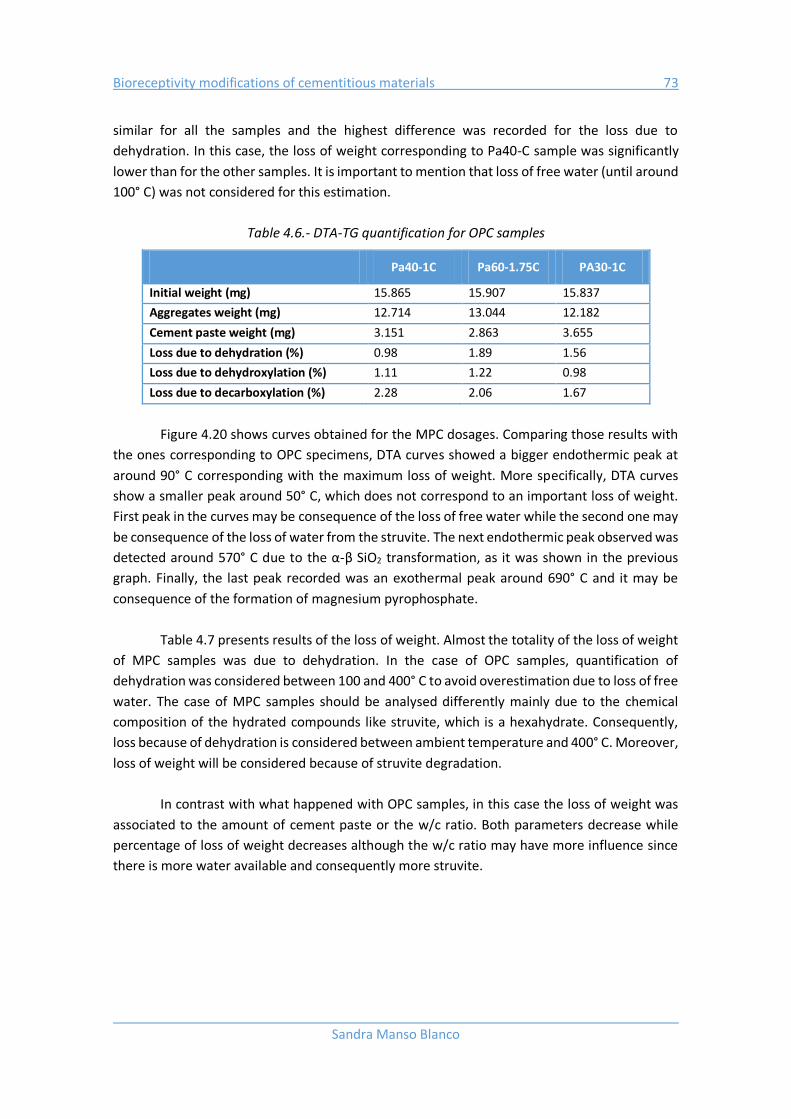
Bioreceptivity modifications of cementitious materials 73
Sandra Manso Blanco
similar for all the samples and the highest difference was recorded for the loss due to
dehydration. In this case, the loss of weight corresponding to Pa40-C sample was significantly
lower than for the other samples. It is important to mention that loss of free water (until around
100° C) was not considered for this estimation.
Table 4.6.- DTA-TG quantification for OPC samples
Pa40-1C Pa60-1.75C PA30-1C
Initial weight (mg) 15.865 15.907 15.837
Aggregates weight (mg) 12.714 13.044 12.182
Cement paste weight (mg) 3.151 2.863 3.655
Loss due to dehydration (%) 0.98 1.89 1.56
Loss due to dehydroxylation (%) 1.11 1.22 0.98
Loss due to decarboxylation (%) 2.28 2.06 1.67
Figure 4.20 shows curves obtained for the MPC dosages. Comparing those results with
the ones corresponding to OPC specimens, DTA curves showed a bigger endothermic peak at
around 90° C corresponding with the maximum loss of weight. More specifically, DTA curves
show a smaller peak around 50° C, which does not correspond to an important loss of weight.
First peak in the curves may be consequence of the loss of free water while the second one may
be consequence of the loss of water from the struvite. The next endothermic peak observed was
detected around 570° C due to the α-β SiO2 transformation, as it was shown in the previous
graph. Finally, the last peak recorded was an exothermal peak around 690° C and it may be
consequence of the formation of magnesium pyrophosphate.
Table 4.7 presents results of the loss of weight. Almost the totality of the loss of weight
of MPC samples was due to dehydration. In the case of OPC samples, quantification of
dehydration was considered between 100 and 400° C to avoid overestimation due to loss of free
water. The case of MPC samples should be analysed differently mainly due to the chemical
composition of the hydrated compounds like struvite, which is a hexahydrate. Consequently,
loss because of dehydration is considered between ambient temperature and 400° C. Moreover,
loss of weight will be considered because of struvite degradation.
In contrast with what happened with OPC samples, in this case the loss of weight was
associated to the amount of cement paste or the w/c ratio. Both parameters decrease while
percentage of loss of weight decreases although the w/c ratio may have more influence since
there is more water available and consequently more struvite.
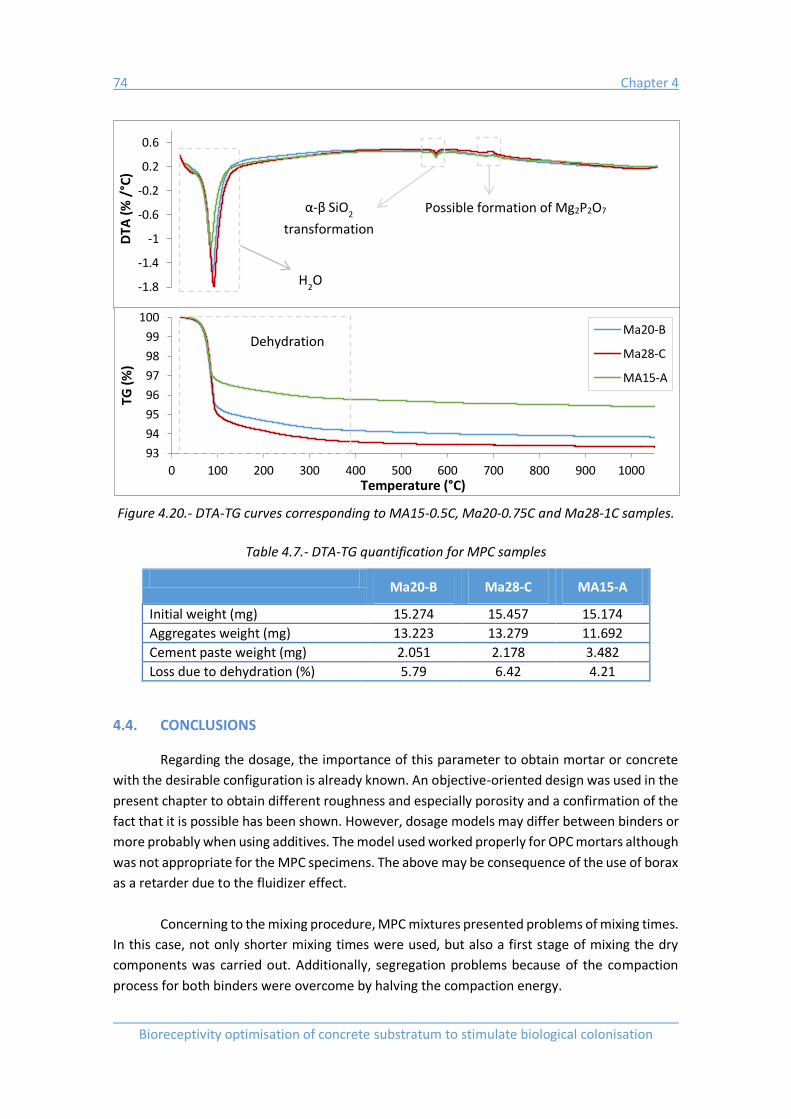
74 Chapter 4
Bioreceptivity optimisation of concrete substratum to stimulate biological colonisation
Figure 4.20.- DTA-TG curves corresponding to MA15-0.5C, Ma20-0.75C and Ma28-1C samples.
Table 4.7.- DTA-TG quantification for MPC samples
Ma20-B Ma28-C MA15-A
Initial weight (mg) 15.274 15.457 15.174
Aggregates weight (mg) 13.223 13.279 11.692
Cement paste weight (mg) 2.051 2.178 3.482
Loss due to dehydration (%) 5.79 6.42 4.21
4.4. CONCLUSIONS
Regarding the dosage, the importance of this parameter to obtain mortar or concrete
with the desirable configuration is already known. An objective-oriented design was used in the
present chapter to obtain different roughness and especially porosity and a confirmation of the
fact that it is possible has been shown. However, dosage models may differ between binders or
more probably when using additives. The model used worked properly for OPC mortars although
was not appropriate for the MPC specimens. The above may be consequence of the use of borax
as a retarder due to the fluidizer effect.
Concerning to the mixing procedure, MPC mixtures presented problems of mixing times.
In this case, not only shorter mixing times were used, but also a first stage of mixing the dry
components was carried out. Additionally, segregation problems because of the compaction
process for both binders were overcome by halving the compaction energy.
-1.8
-1.4
-1
-0.6
-0.2
0.2
0.6
DTA
(%
/°C
)
93
94
95
96
97
98
99
100
0 100 200 300 400 500 600 700 800 900 1000
TG (
%)
Temperature (°C)
Ma20-B
Ma28-C
MA15-A
α-β SiO2
transformation
Possible formation of Mg2P2O7
Dehydration
H2O
Bioreceptivity modifications of cementitious materials 75
Sandra Manso Blanco
After solving production particularities, characterization tests were executed. Porosity
estimation for cementitious materials is usually determined according to the ASTM C-642-13
standard. However, porous materials presented the problem of the estimation of the saturated
weight with dry surface due to the high open porosity. Consequently, Archimedes’ principle as
an alternative method was implemented.
Subsequently, the main conclusions obtained in this chapter were an improvement of
thermal peaks during the hydration process of MPC specimens. Furthermore, it was observed
that control of parameters such as porosity was easier for OPC specimens. The above may be
connected to the problem of dosage method suitability.
Interesting differences were also obtained in MIP test related to different porosity
distribution between OPC and MPC specimens. OPC specimens showed a more continuous
porosity covering all different ranges while MPC specimens presented almost negligible
percentages for pore diameters lower than 50 nm. The above indicates different water
absorption as well as water retention patterns for the different dosages and especially between
both binders. Consequently, those different behaviours may promote different colonisation
pattern. Regarding compressive strengths, high early strengths may indicate a drop of long-term
strength but no significant effects were obtained on the compressive strength evolution after
28 days. More specimens are necessary to be tested in order to determine the trend.
Accordingly, dosages selected for further research and evaluation of their suitability to
be colonised by living organisms were Pa40-1C, Pa60-1.75C, PA30-1C, Ma20-0.5C, Ma28-1C and
MA15-0.5C. The criterion used to select them was to choose extreme dosages in order to have
a wide range of material properties.

76 Chapter 4
Bioreceptivity optimisation of concrete substratum to stimulate biological colonisation
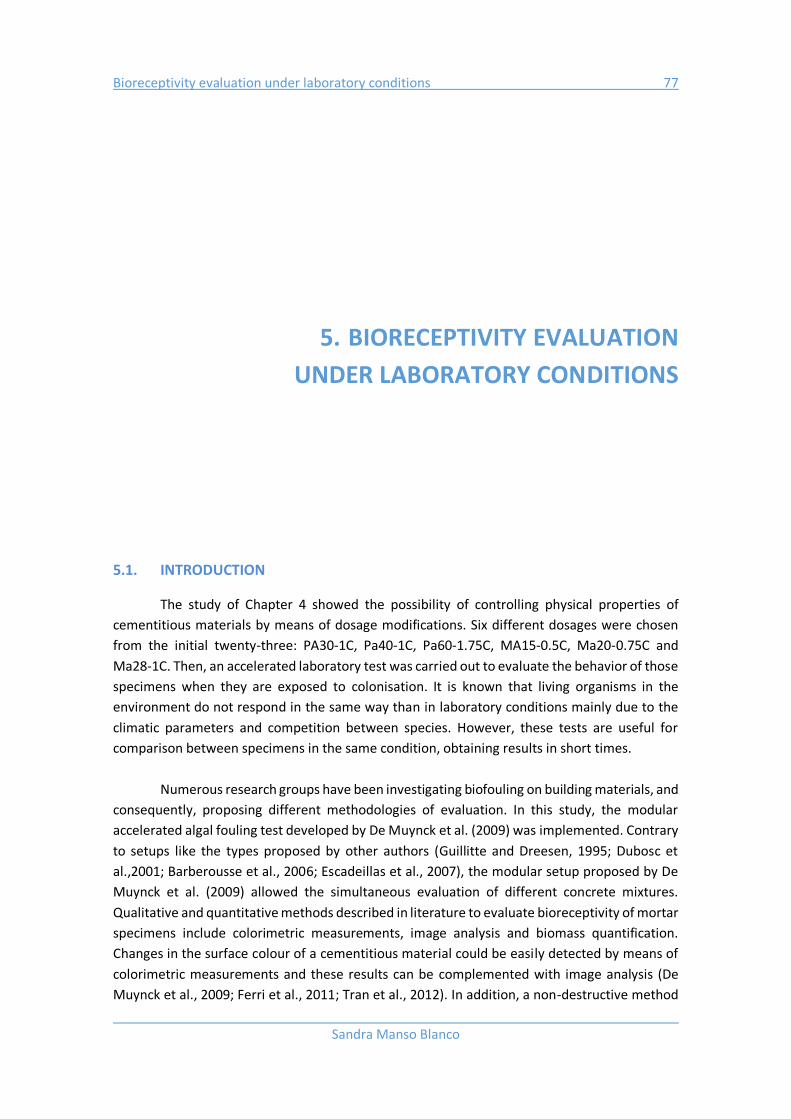
Bioreceptivity evaluation under laboratory conditions 77
Sandra Manso Blanco
5. BIORECEPTIVITY EVALUATION
UNDER LABORATORY CONDITIONS
5.1. INTRODUCTION
The study of Chapter 4 showed the possibility of controlling physical properties of
cementitious materials by means of dosage modifications. Six different dosages were chosen
from the initial twenty-three: PA30-1C, Pa40-1C, Pa60-1.75C, MA15-0.5C, Ma20-0.75C and
Ma28-1C. Then, an accelerated laboratory test was carried out to evaluate the behavior of those
specimens when they are exposed to colonisation. It is known that living organisms in the
environment do not respond in the same way than in laboratory conditions mainly due to the
climatic parameters and competition between species. However, these tests are useful for
comparison between specimens in the same condition, obtaining results in short times.
Numerous research groups have been investigating biofouling on building materials, and
consequently, proposing different methodologies of evaluation. In this study, the modular
accelerated algal fouling test developed by De Muynck et al. (2009) was implemented. Contrary
to setups like the types proposed by other authors (Guillitte and Dreesen, 1995; Dubosc et
al.,2001; Barberousse et al., 2006; Escadeillas et al., 2007), the modular setup proposed by De
Muynck et al. (2009) allowed the simultaneous evaluation of different concrete mixtures.
Qualitative and quantitative methods described in literature to evaluate bioreceptivity of mortar
specimens include colorimetric measurements, image analysis and biomass quantification.
Changes in the surface colour of a cementitious material could be easily detected by means of
colorimetric measurements and these results can be complemented with image analysis (De
Muynck et al., 2009; Ferri et al., 2011; Tran et al., 2012). In addition, a non-destructive method
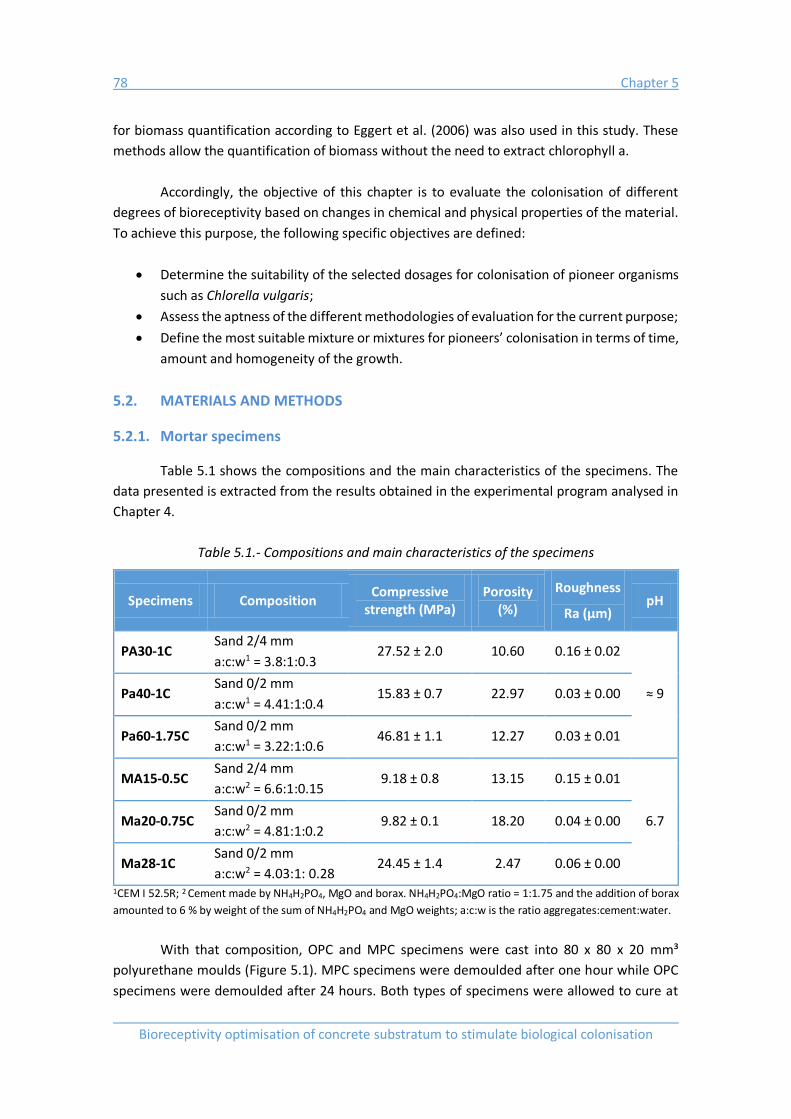
78 Chapter 5
Bioreceptivity optimisation of concrete substratum to stimulate biological colonisation
for biomass quantification according to Eggert et al. (2006) was also used in this study. These
methods allow the quantification of biomass without the need to extract chlorophyll a.
Accordingly, the objective of this chapter is to evaluate the colonisation of different
degrees of bioreceptivity based on changes in chemical and physical properties of the material.
To achieve this purpose, the following specific objectives are defined:
Determine the suitability of the selected dosages for colonisation of pioneer organisms
such as Chlorella vulgaris;
Assess the aptness of the different methodologies of evaluation for the current purpose;
Define the most suitable mixture or mixtures for pioneers’ colonisation in terms of time,
amount and homogeneity of the growth.
5.2. MATERIALS AND METHODS
5.2.1. Mortar specimens
Table 5.1 shows the compositions and the main characteristics of the specimens. The
data presented is extracted from the results obtained in the experimental program analysed in
Chapter 4.
Table 5.1.- Compositions and main characteristics of the specimens
Specimens Composition Compressive
strength (MPa) Porosity
(%)
Roughness
Ra (µm) pH
PA30-1C Sand 2/4 mm
a:c:w1 = 3.8:1:0.3 27.52 ± 2.0 10.60 0.16 ± 0.02
≈ 9 Pa40-1C Sand 0/2 mm
a:c:w1 = 4.41:1:0.4 15.83 ± 0.7 22.97 0.03 ± 0.00
Pa60-1.75C Sand 0/2 mm
a:c:w1 = 3.22:1:0.6 46.81 ± 1.1 12.27 0.03 ± 0.01
MA15-0.5C Sand 2/4 mm
a:c:w2 = 6.6:1:0.15 9.18 ± 0.8 13.15 0.15 ± 0.01
6.7 Ma20-0.75C Sand 0/2 mm
a:c:w2 = 4.81:1:0.2 9.82 ± 0.1 18.20 0.04 ± 0.00
Ma28-1C Sand 0/2 mm
a:c:w2 = 4.03:1: 0.28 24.45 ± 1.4 2.47 0.06 ± 0.00
1CEM I 52.5R; 2 Cement made by NH4H2PO4, MgO and borax. NH4H2PO4:MgO ratio = 1:1.75 and the addition of borax
amounted to 6 % by weight of the sum of NH4H2PO4 and MgO weights; a:c:w is the ratio aggregates:cement:water.
With that composition, OPC and MPC specimens were cast into 80 x 80 x 20 mm³
polyurethane moulds (Figure 5.1). MPC specimens were demoulded after one hour while OPC
specimens were demoulded after 24 hours. Both types of specimens were allowed to cure at
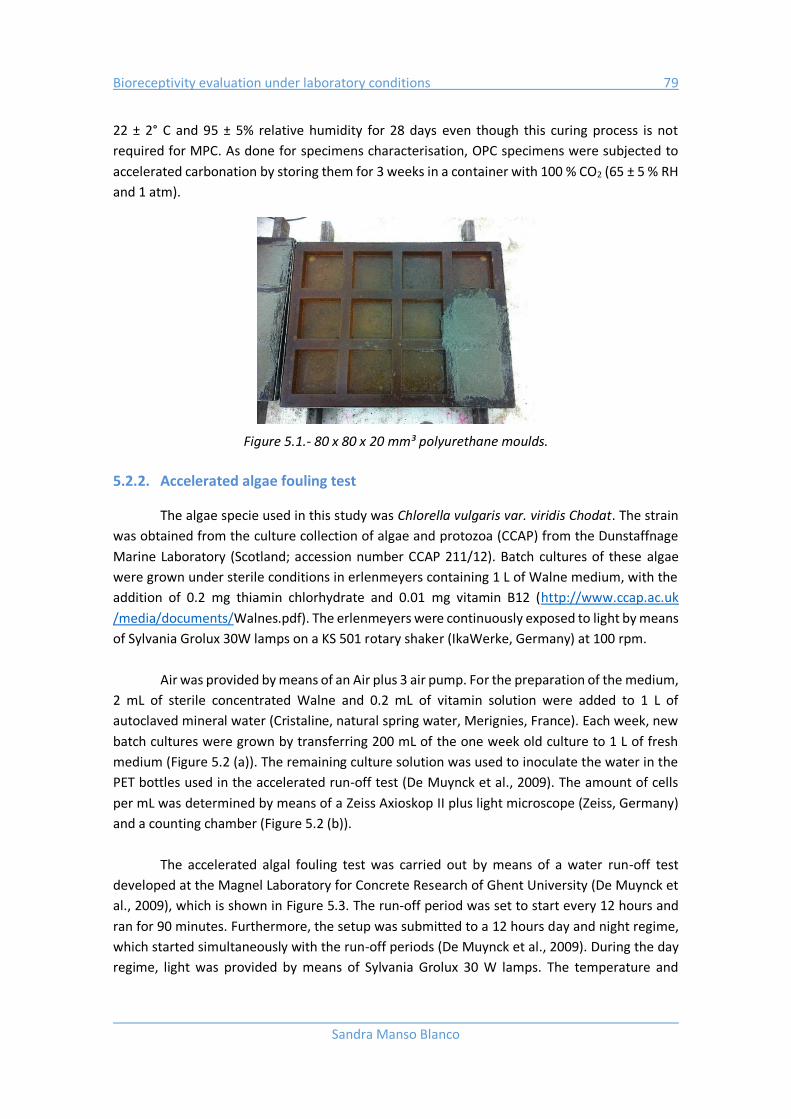
Bioreceptivity evaluation under laboratory conditions 79
Sandra Manso Blanco
22 ± 2° C and 95 ± 5% relative humidity for 28 days even though this curing process is not
required for MPC. As done for specimens characterisation, OPC specimens were subjected to
accelerated carbonation by storing them for 3 weeks in a container with 100 % CO2 (65 ± 5 % RH
and 1 atm).
Figure 5.1.- 80 x 80 x 20 mm³ polyurethane moulds.
5.2.2. Accelerated algae fouling test
The algae specie used in this study was Chlorella vulgaris var. viridis Chodat. The strain
was obtained from the culture collection of algae and protozoa (CCAP) from the Dunstaffnage
Marine Laboratory (Scotland; accession number CCAP 211/12). Batch cultures of these algae
were grown under sterile conditions in erlenmeyers containing 1 L of Walne medium, with the
addition of 0.2 mg thiamin chlorhydrate and 0.01 mg vitamin B12 (http://www.ccap.ac.uk
/media/documents/Walnes.pdf). The erlenmeyers were continuously exposed to light by means
of Sylvania Grolux 30W lamps on a KS 501 rotary shaker (IkaWerke, Germany) at 100 rpm.
Air was provided by means of an Air plus 3 air pump. For the preparation of the medium,
2 mL of sterile concentrated Walne and 0.2 mL of vitamin solution were added to 1 L of
autoclaved mineral water (Cristaline, natural spring water, Merignies, France). Each week, new
batch cultures were grown by transferring 200 mL of the one week old culture to 1 L of fresh
medium (Figure 5.2 (a)). The remaining culture solution was used to inoculate the water in the
PET bottles used in the accelerated run-off test (De Muynck et al., 2009). The amount of cells
per mL was determined by means of a Zeiss Axioskop II plus light microscope (Zeiss, Germany)
and a counting chamber (Figure 5.2 (b)).
The accelerated algal fouling test was carried out by means of a water run-off test
developed at the Magnel Laboratory for Concrete Research of Ghent University (De Muynck et
al., 2009), which is shown in Figure 5.3. The run-off period was set to start every 12 hours and
ran for 90 minutes. Furthermore, the setup was submitted to a 12 hours day and night regime,
which started simultaneously with the run-off periods (De Muynck et al., 2009). During the day
regime, light was provided by means of Sylvania Grolux 30 W lamps. The temperature and
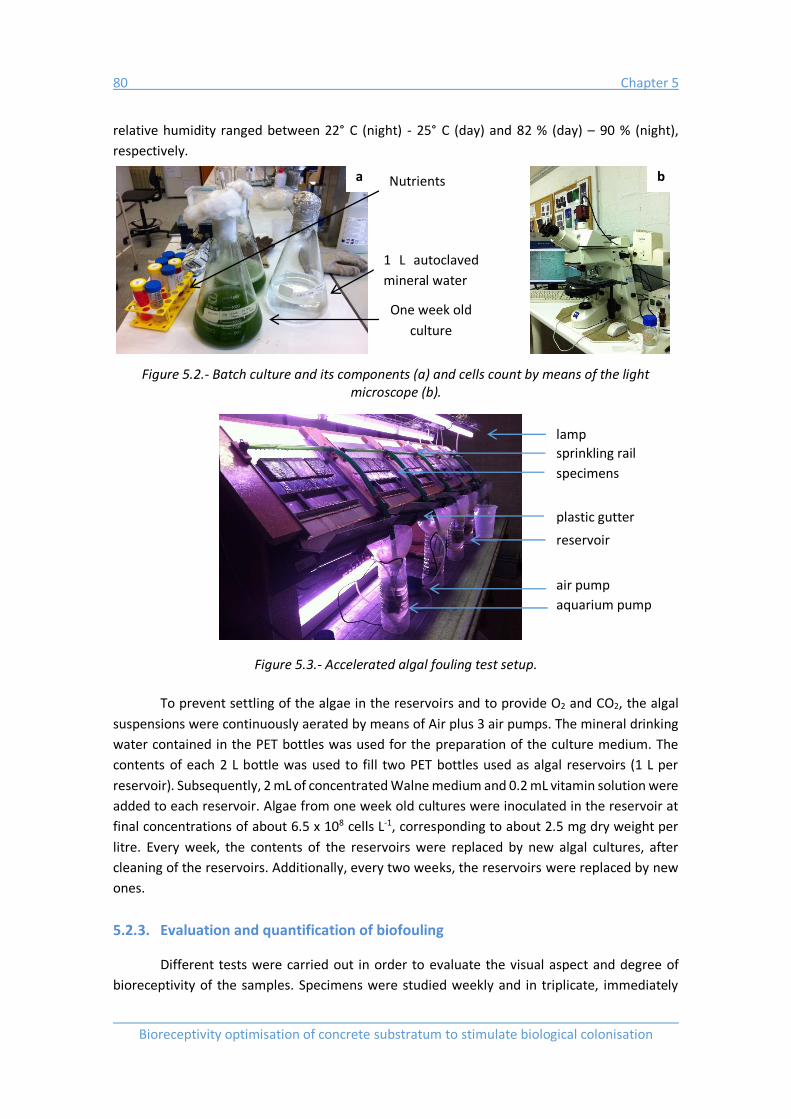
80 Chapter 5
Bioreceptivity optimisation of concrete substratum to stimulate biological colonisation
relative humidity ranged between 22° C (night) - 25° C (day) and 82 % (day) – 90 % (night),
respectively.
Figure 5.2.- Batch culture and its components (a) and cells count by means of the light microscope (b).
Figure 5.3.- Accelerated algal fouling test setup.
To prevent settling of the algae in the reservoirs and to provide O2 and CO2, the algal
suspensions were continuously aerated by means of Air plus 3 air pumps. The mineral drinking
water contained in the PET bottles was used for the preparation of the culture medium. The
contents of each 2 L bottle was used to fill two PET bottles used as algal reservoirs (1 L per
reservoir). Subsequently, 2 mL of concentrated Walne medium and 0.2 mL vitamin solution were
added to each reservoir. Algae from one week old cultures were inoculated in the reservoir at
final concentrations of about 6.5 x 10⁸ cells L-1, corresponding to about 2.5 mg dry weight per
litre. Every week, the contents of the reservoirs were replaced by new algal cultures, after
cleaning of the reservoirs. Additionally, every two weeks, the reservoirs were replaced by new
ones.
5.2.3. Evaluation and quantification of biofouling
Different tests were carried out in order to evaluate the visual aspect and degree of
bioreceptivity of the samples. Specimens were studied weekly and in triplicate, immediately
One week old
culture
1 L autoclaved
mineral water
Nutrients b a
lamp
aquarium pump
air pump
reservoir
plastic gutter
specimens
sprinkling rail
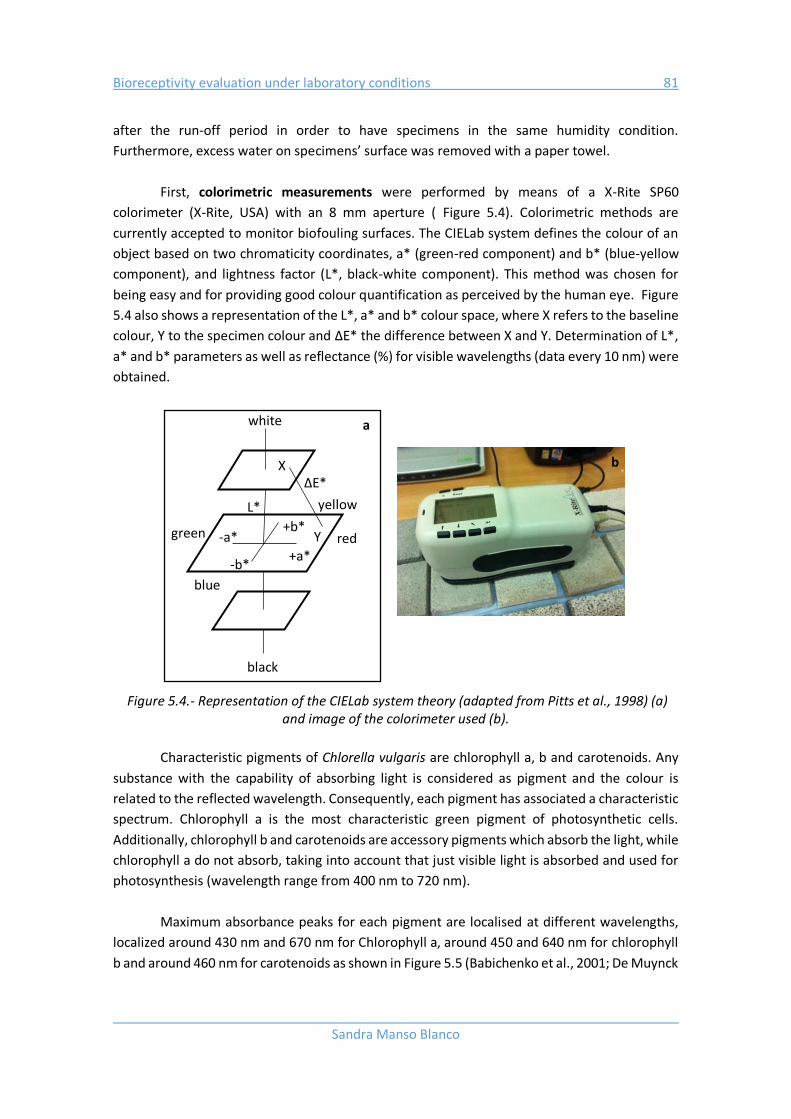
Bioreceptivity evaluation under laboratory conditions 81
Sandra Manso Blanco
after the run-off period in order to have specimens in the same humidity condition.
Furthermore, excess water on specimens’ surface was removed with a paper towel.
First, colorimetric measurements were performed by means of a X-Rite SP60
colorimeter (X-Rite, USA) with an 8 mm aperture ( Figure 5.4). Colorimetric methods are
currently accepted to monitor biofouling surfaces. The CIELab system defines the colour of an
object based on two chromaticity coordinates, a* (green-red component) and b* (blue-yellow
component), and lightness factor (L*, black-white component). This method was chosen for
being easy and for providing good colour quantification as perceived by the human eye. Figure
5.4 also shows a representation of the L*, a* and b* colour space, where X refers to the baseline
colour, Y to the specimen colour and ∆E* the difference between X and Y. Determination of L*,
a* and b* parameters as well as reflectance (%) for visible wavelengths (data every 10 nm) were
obtained.
Figure 5.4.- Representation of the CIELab system theory (adapted from Pitts et al., 1998) (a) and image of the colorimeter used (b).
Characteristic pigments of Chlorella vulgaris are chlorophyll a, b and carotenoids. Any
substance with the capability of absorbing light is considered as pigment and the colour is
related to the reflected wavelength. Consequently, each pigment has associated a characteristic
spectrum. Chlorophyll a is the most characteristic green pigment of photosynthetic cells.
Additionally, chlorophyll b and carotenoids are accessory pigments which absorb the light, while
chlorophyll a do not absorb, taking into account that just visible light is absorbed and used for
photosynthesis (wavelength range from 400 nm to 720 nm).
Maximum absorbance peaks for each pigment are localised at different wavelengths,
localized around 430 nm and 670 nm for Chlorophyll a, around 450 and 640 nm for chlorophyll
b and around 460 nm for carotenoids as shown in Figure 5.5 (Babichenko et al., 2001; De Muynck
L*
black
white
yellow
red green
blue
+a*
-a*
-b*
+b*
∆E* X
Y
a
b
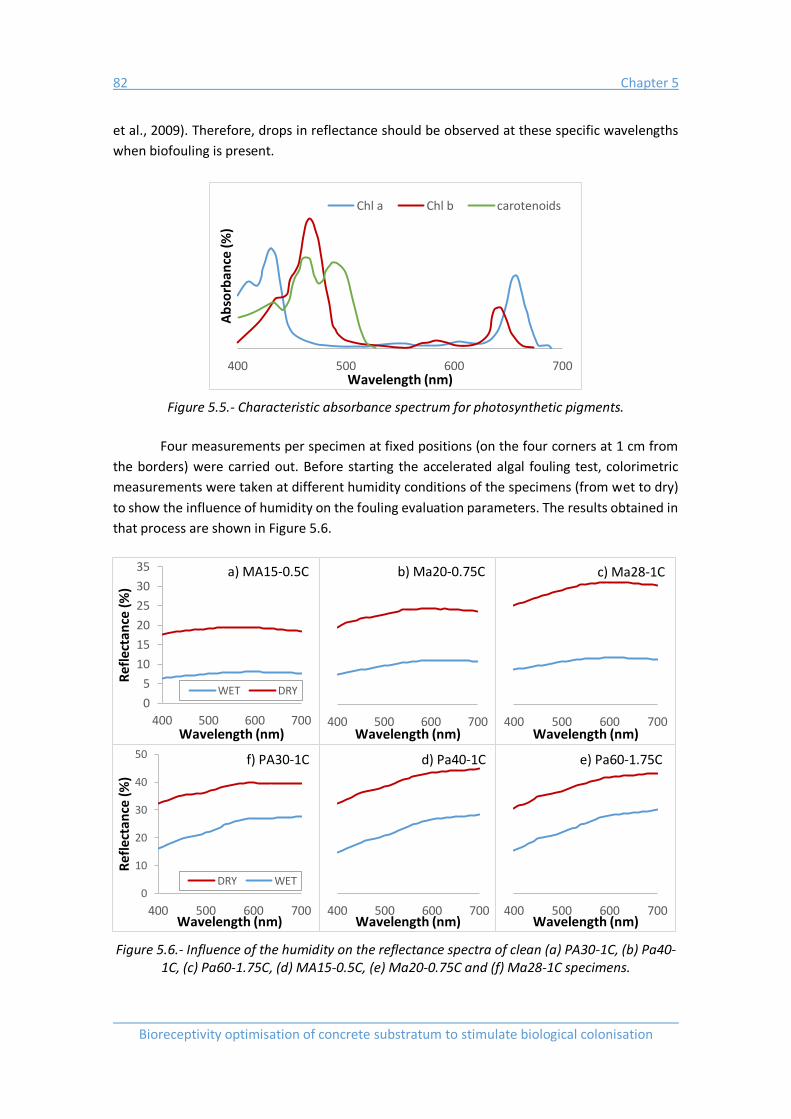
82 Chapter 5
Bioreceptivity optimisation of concrete substratum to stimulate biological colonisation
et al., 2009). Therefore, drops in reflectance should be observed at these specific wavelengths
when biofouling is present.
Figure 5.5.- Characteristic absorbance spectrum for photosynthetic pigments.
Four measurements per specimen at fixed positions (on the four corners at 1 cm from
the borders) were carried out. Before starting the accelerated algal fouling test, colorimetric
measurements were taken at different humidity conditions of the specimens (from wet to dry)
to show the influence of humidity on the fouling evaluation parameters. The results obtained in
that process are shown in Figure 5.6.
Figure 5.6.- Influence of the humidity on the reflectance spectra of clean (a) PA30-1C, (b) Pa40-1C, (c) Pa60-1.75C, (d) MA15-0.5C, (e) Ma20-0.75C and (f) Ma28-1C specimens.
400 500 600 700Wavelength (nm)
c) Ma28-1C
0
5
10
15
20
25
30
35
400 500 600 700
Ref
lect
ance
(%
)
Wavelength (nm)
WET DRY
a) MA15-0.5C
400 500 600 700Wavelength (nm)
b) Ma20-0.75C
0
10
20
30
40
50
400 500 600 700
Ref
lect
ance
(%
)
Wavelength (nm)
DRY WET
f) PA30-1C
400 500 600 700Wavelength (nm)
d) Pa40-1C
400 500 600 700Wavelength (nm)
e) Pa60-1.75C
400 500 600 700
Ab
sorb
ance
(%
)
Wavelength (nm)
Chl a Chl b carotenoids
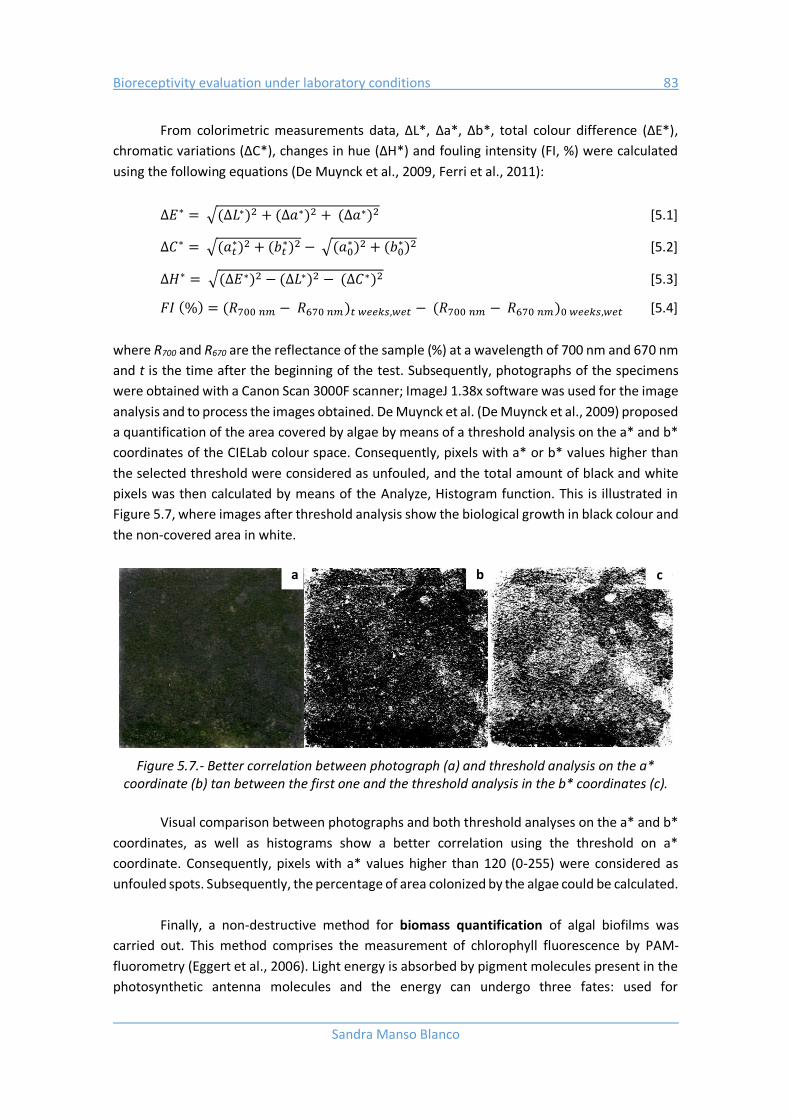
Bioreceptivity evaluation under laboratory conditions 83
Sandra Manso Blanco
From colorimetric measurements data, ΔL*, Δa*, Δb*, total colour difference (ΔE*),
chromatic variations (ΔC*), changes in hue (ΔH*) and fouling intensity (FI, %) were calculated
using the following equations (De Muynck et al., 2009, Ferri et al., 2011):
∆𝐸∗ = √(∆𝐿∗)2 + (∆𝑎∗)2 + (∆𝑎∗)2 [5.1]
∆𝐶∗ = √(𝑎𝑡∗)2 + (𝑏𝑡
∗)2 − √(𝑎0∗)2 + (𝑏0
∗)2 [5.2]
∆𝐻∗ = √(∆𝐸∗)2 − (∆𝐿∗)2 − (∆𝐶∗)2 [5.3]
𝐹𝐼 (%) = (𝑅700 𝑛𝑚 − 𝑅670 𝑛𝑚)𝑡 𝑤𝑒𝑒𝑘𝑠,𝑤𝑒𝑡 − (𝑅700 𝑛𝑚 − 𝑅670 𝑛𝑚)0 𝑤𝑒𝑒𝑘𝑠,𝑤𝑒𝑡 [5.4]
where R700 and R670 are the reflectance of the sample (%) at a wavelength of 700 nm and 670 nm
and t is the time after the beginning of the test. Subsequently, photographs of the specimens
were obtained with a Canon Scan 3000F scanner; ImageJ 1.38x software was used for the image
analysis and to process the images obtained. De Muynck et al. (De Muynck et al., 2009) proposed
a quantification of the area covered by algae by means of a threshold analysis on the a* and b*
coordinates of the CIELab colour space. Consequently, pixels with a* or b* values higher than
the selected threshold were considered as unfouled, and the total amount of black and white
pixels was then calculated by means of the Analyze, Histogram function. This is illustrated in
Figure 5.7, where images after threshold analysis show the biological growth in black colour and
the non-covered area in white.
Figure 5.7.- Better correlation between photograph (a) and threshold analysis on the a* coordinate (b) tan between the first one and the threshold analysis in the b* coordinates (c).
Visual comparison between photographs and both threshold analyses on the a* and b*
coordinates, as well as histograms show a better correlation using the threshold on a*
coordinate. Consequently, pixels with a* values higher than 120 (0-255) were considered as
unfouled spots. Subsequently, the percentage of area colonized by the algae could be calculated.
Finally, a non-destructive method for biomass quantification of algal biofilms was
carried out. This method comprises the measurement of chlorophyll fluorescence by PAM-
fluorometry (Eggert et al., 2006). Light energy is absorbed by pigment molecules present in the
photosynthetic antenna molecules and the energy can undergo three fates: used for
b c a
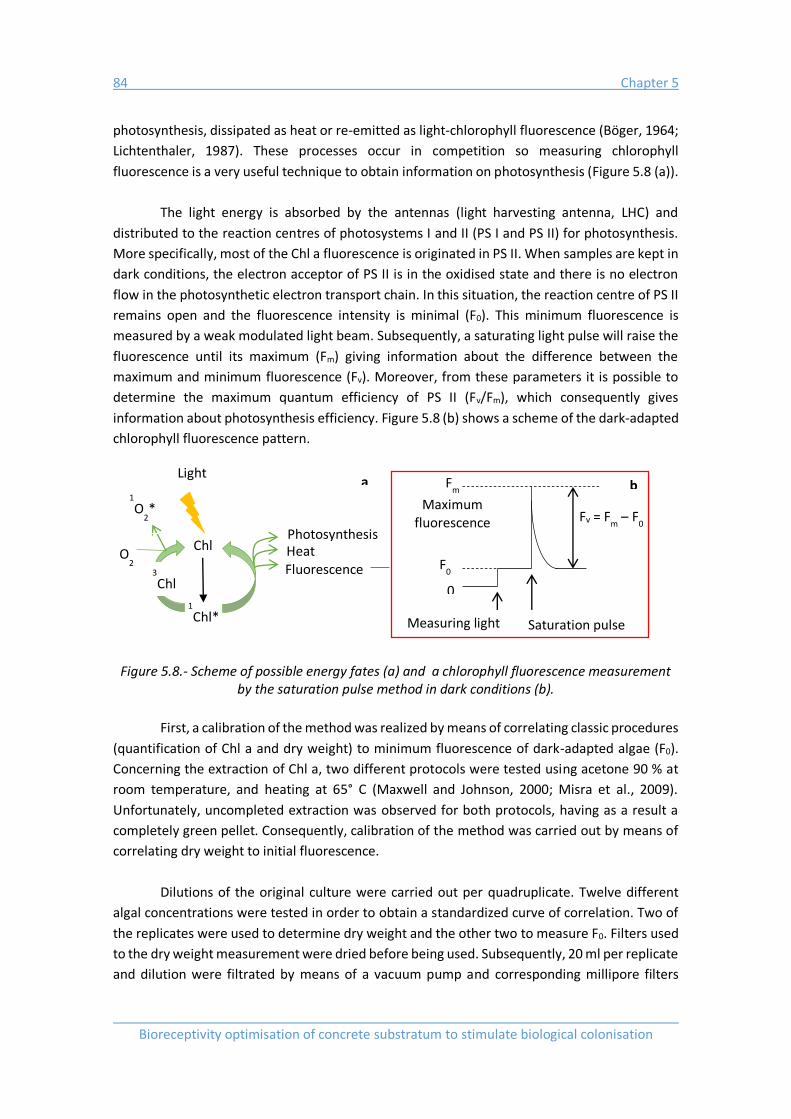
84 Chapter 5
Bioreceptivity optimisation of concrete substratum to stimulate biological colonisation
photosynthesis, dissipated as heat or re-emitted as light-chlorophyll fluorescence (Böger, 1964;
Lichtenthaler, 1987). These processes occur in competition so measuring chlorophyll
fluorescence is a very useful technique to obtain information on photosynthesis (Figure 5.8 (a)).
The light energy is absorbed by the antennas (light harvesting antenna, LHC) and
distributed to the reaction centres of photosystems I and II (PS I and PS II) for photosynthesis.
More specifically, most of the Chl a fluorescence is originated in PS II. When samples are kept in
dark conditions, the electron acceptor of PS II is in the oxidised state and there is no electron
flow in the photosynthetic electron transport chain. In this situation, the reaction centre of PS II
remains open and the fluorescence intensity is minimal (F0). This minimum fluorescence is
measured by a weak modulated light beam. Subsequently, a saturating light pulse will raise the
fluorescence until its maximum (Fm) giving information about the difference between the
maximum and minimum fluorescence (Fv). Moreover, from these parameters it is possible to
determine the maximum quantum efficiency of PS II (Fv/Fm), which consequently gives
information about photosynthesis efficiency. Figure 5.8 (b) shows a scheme of the dark-adapted
chlorophyll fluorescence pattern.
Figure 5.8.- Scheme of possible energy fates (a) and a chlorophyll fluorescence measurement by the saturation pulse method in dark conditions (b).
First, a calibration of the method was realized by means of correlating classic procedures
(quantification of Chl a and dry weight) to minimum fluorescence of dark-adapted algae (F0).
Concerning the extraction of Chl a, two different protocols were tested using acetone 90 % at
room temperature, and heating at 65° C (Maxwell and Johnson, 2000; Misra et al., 2009).
Unfortunately, uncompleted extraction was observed for both protocols, having as a result a
completely green pellet. Consequently, calibration of the method was carried out by means of
correlating dry weight to initial fluorescence.
Dilutions of the original culture were carried out per quadruplicate. Twelve different
algal concentrations were tested in order to obtain a standardized curve of correlation. Two of
the replicates were used to determine dry weight and the other two to measure F0. Filters used
to the dry weight measurement were dried before being used. Subsequently, 20 ml per replicate
and dilution were filtrated by means of a vacuum pump and corresponding millipore filters
Fv = Fm
– F0
Fm
Maximum fluorescence
F0
0
Measuring light on
Saturation pulse
Light
Chl
1
Chl*
3
Chl*
O2
1
O2*
Fluorescence
Heat Photosynthesis
b a
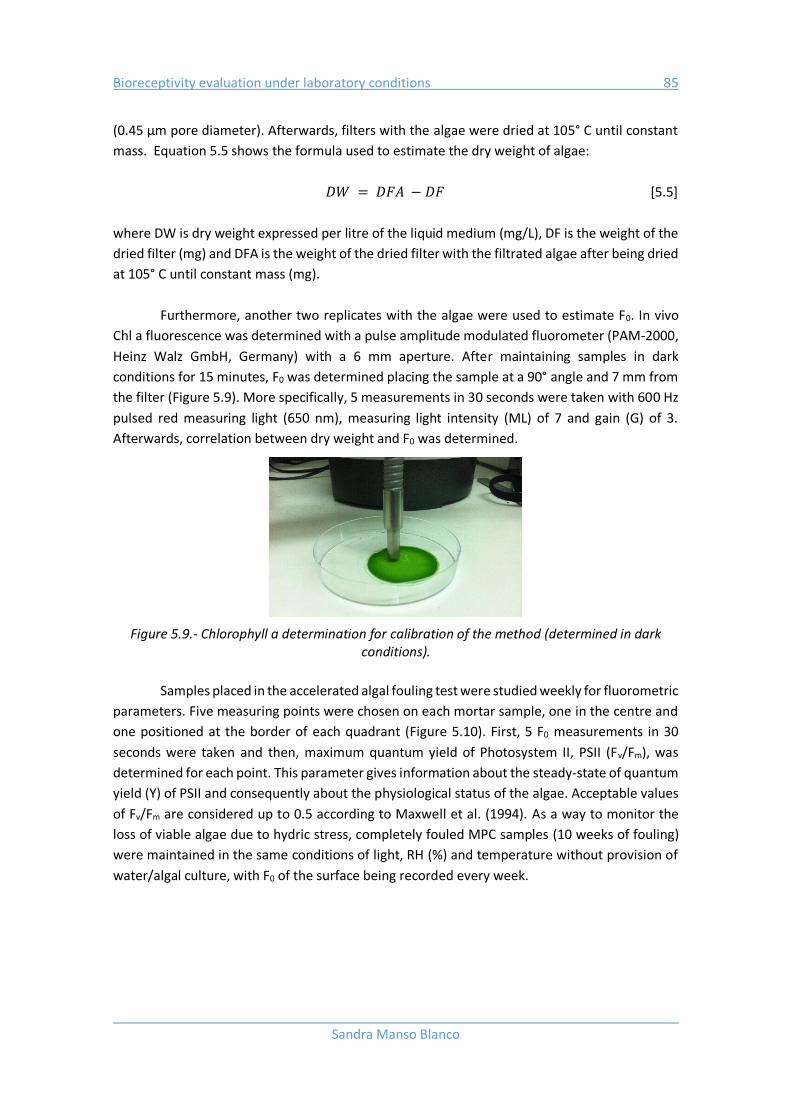
Bioreceptivity evaluation under laboratory conditions 85
Sandra Manso Blanco
(0.45 µm pore diameter). Afterwards, filters with the algae were dried at 105° C until constant
mass. Equation 5.5 shows the formula used to estimate the dry weight of algae:
𝐷𝑊 = 𝐷𝐹𝐴 − 𝐷𝐹 [5.5]
where DW is dry weight expressed per litre of the liquid medium (mg/L), DF is the weight of the
dried filter (mg) and DFA is the weight of the dried filter with the filtrated algae after being dried
at 105° C until constant mass (mg).
Furthermore, another two replicates with the algae were used to estimate F0. In vivo
Chl a fluorescence was determined with a pulse amplitude modulated fluorometer (PAM-2000,
Heinz Walz GmbH, Germany) with a 6 mm aperture. After maintaining samples in dark
conditions for 15 minutes, F0 was determined placing the sample at a 90° angle and 7 mm from
the filter (Figure 5.9). More specifically, 5 measurements in 30 seconds were taken with 600 Hz
pulsed red measuring light (650 nm), measuring light intensity (ML) of 7 and gain (G) of 3.
Afterwards, correlation between dry weight and F0 was determined.
Figure 5.9.- Chlorophyll a determination for calibration of the method (determined in dark conditions).
Samples placed in the accelerated algal fouling test were studied weekly for fluorometric
parameters. Five measuring points were chosen on each mortar sample, one in the centre and
one positioned at the border of each quadrant (Figure 5.10). First, 5 F0 measurements in 30
seconds were taken and then, maximum quantum yield of Photosystem II, PSII (Fv/Fm), was
determined for each point. This parameter gives information about the steady-state of quantum
yield (Y) of PSII and consequently about the physiological status of the algae. Acceptable values
of Fv/Fm are considered up to 0.5 according to Maxwell et al. (1994). As a way to monitor the
loss of viable algae due to hydric stress, completely fouled MPC samples (10 weeks of fouling)
were maintained in the same conditions of light, RH (%) and temperature without provision of
water/algal culture, with F0 of the surface being recorded every week.
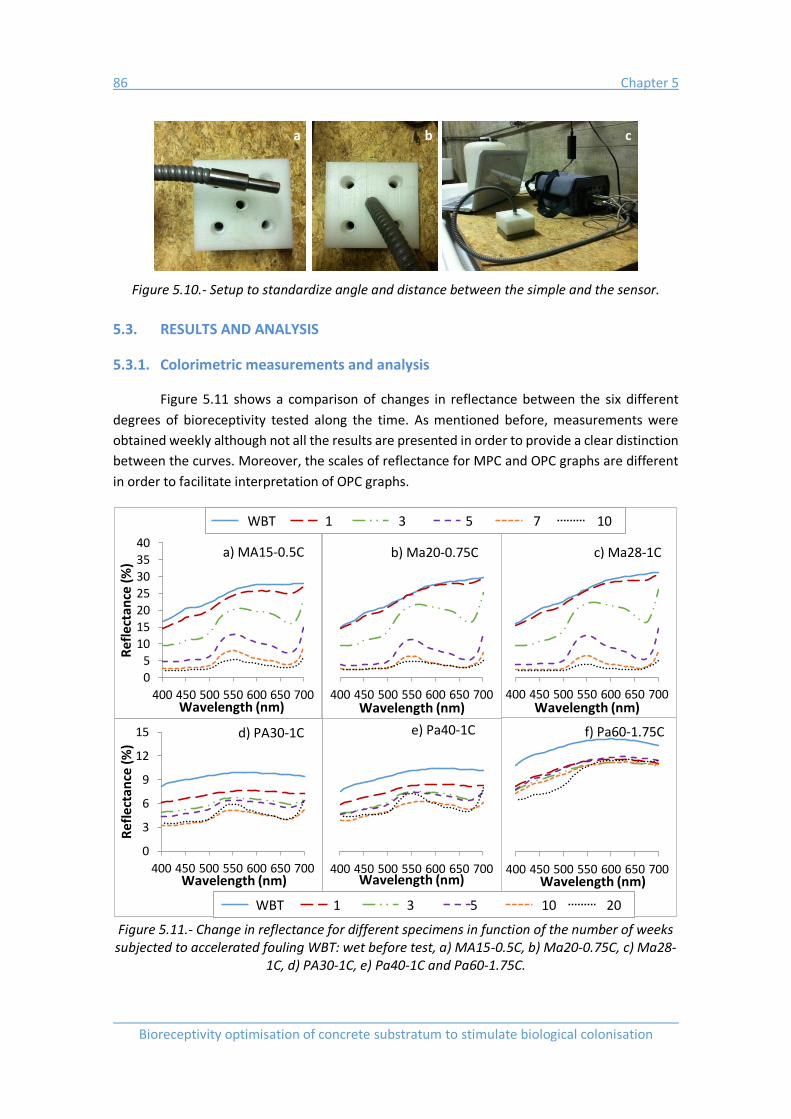
86 Chapter 5
Bioreceptivity optimisation of concrete substratum to stimulate biological colonisation
Figure 5.10.- Setup to standardize angle and distance between the simple and the sensor.
5.3. RESULTS AND ANALYSIS
5.3.1. Colorimetric measurements and analysis
Figure 5.11 shows a comparison of changes in reflectance between the six different
degrees of bioreceptivity tested along the time. As mentioned before, measurements were
obtained weekly although not all the results are presented in order to provide a clear distinction
between the curves. Moreover, the scales of reflectance for MPC and OPC graphs are different
in order to facilitate interpretation of OPC graphs.
Figure 5.11.- Change in reflectance for different specimens in function of the number of weeks subjected to accelerated fouling WBT: wet before test, a) MA15-0.5C, b) Ma20-0.75C, c) Ma28-
1C, d) PA30-1C, e) Pa40-1C and Pa60-1.75C.
400 450 500 550 600 650 700Wavelength (nm)
f) Pa60-1.75C
400 450 500 550 600 650 700Wavelength (nm)
e) Pa40-1C
0
3
6
9
12
15
400 450 500 550 600 650 700
Re
flec
tan
ce (
%)
Wavelength (nm)
d) PA30-1C
0
5
10
15
20
25
30
35
40
400 450 500 550 600 650 700
Re
fle
cta
nce
(%
)
Wavelength (nm)400 450 500 550 600 650 700
Wavelength (nm)
c) Ma28-1C
400 450 500 550 600 650 700Wavelength (nm)
b) Ma20-0.75C
WBT 1 3 5 7 10
WBT 1 3 5 10 20
a) MA15-0.5C
c b a
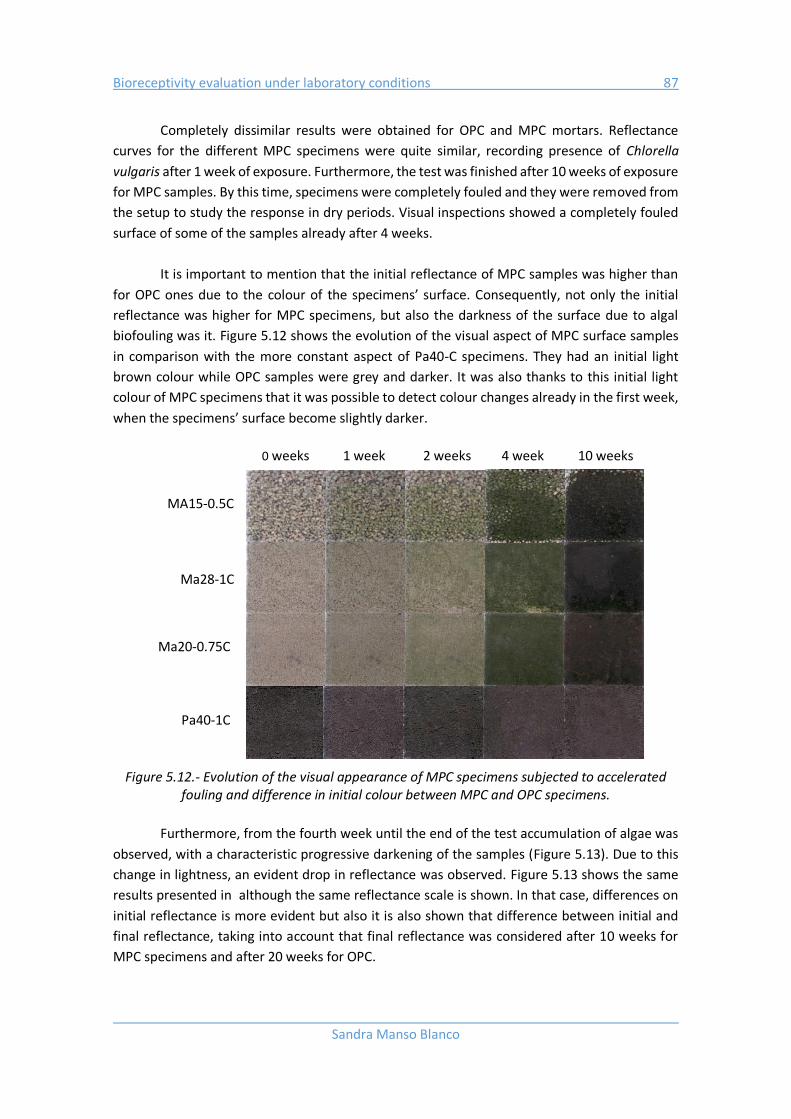
Bioreceptivity evaluation under laboratory conditions 87
Sandra Manso Blanco
Completely dissimilar results were obtained for OPC and MPC mortars. Reflectance
curves for the different MPC specimens were quite similar, recording presence of Chlorella
vulgaris after 1 week of exposure. Furthermore, the test was finished after 10 weeks of exposure
for MPC samples. By this time, specimens were completely fouled and they were removed from
the setup to study the response in dry periods. Visual inspections showed a completely fouled
surface of some of the samples already after 4 weeks.
It is important to mention that the initial reflectance of MPC samples was higher than
for OPC ones due to the colour of the specimens’ surface. Consequently, not only the initial
reflectance was higher for MPC specimens, but also the darkness of the surface due to algal
biofouling was it. Figure 5.12 shows the evolution of the visual aspect of MPC surface samples
in comparison with the more constant aspect of Pa40-C specimens. They had an initial light
brown colour while OPC samples were grey and darker. It was also thanks to this initial light
colour of MPC specimens that it was possible to detect colour changes already in the first week,
when the specimens’ surface become slightly darker.
Figure 5.12.- Evolution of the visual appearance of MPC specimens subjected to accelerated fouling and difference in initial colour between MPC and OPC specimens.
Furthermore, from the fourth week until the end of the test accumulation of algae was
observed, with a characteristic progressive darkening of the samples (Figure 5.13). Due to this
change in lightness, an evident drop in reflectance was observed. Figure 5.13 shows the same
results presented in although the same reflectance scale is shown. In that case, differences on
initial reflectance is more evident but also it is also shown that difference between initial and
final reflectance, taking into account that final reflectance was considered after 10 weeks for
MPC specimens and after 20 weeks for OPC.
Ma20-0.75C
Ma28-1C
MA15-0.5C
0 weeks 1 week 2 weeks 4 week 10 weeks
Pa40-1C
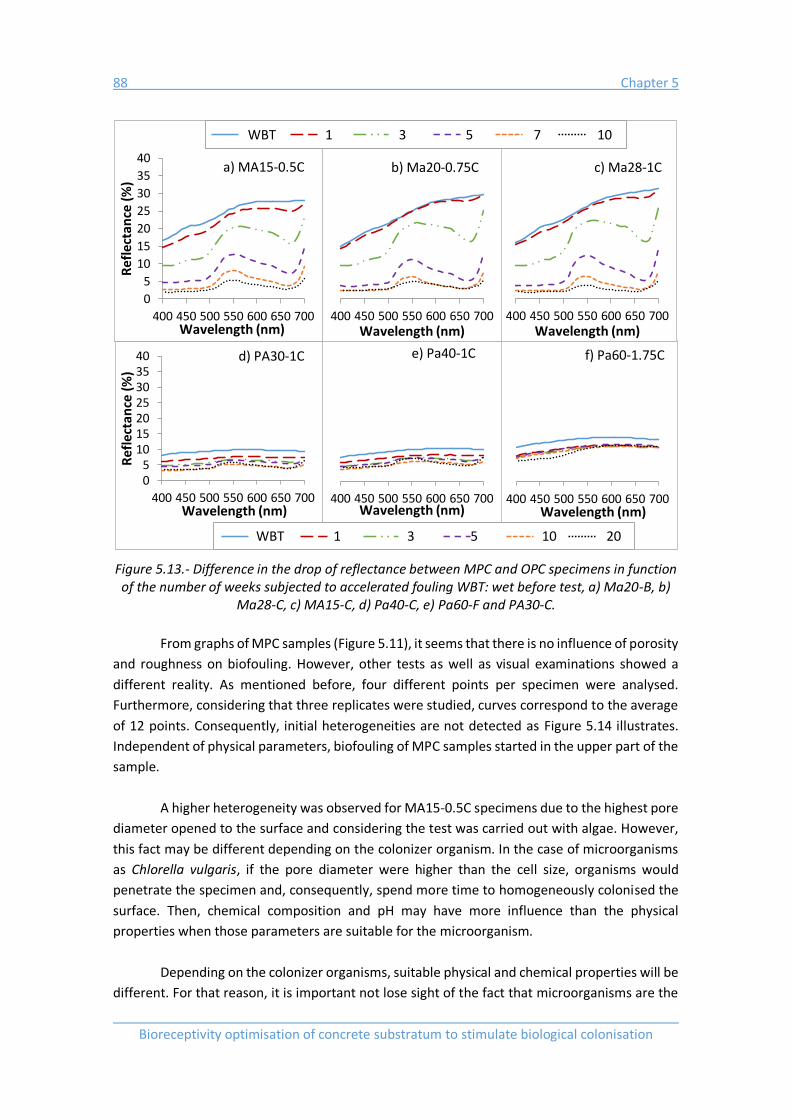
88 Chapter 5
Bioreceptivity optimisation of concrete substratum to stimulate biological colonisation
Figure 5.13.- Difference in the drop of reflectance between MPC and OPC specimens in function of the number of weeks subjected to accelerated fouling WBT: wet before test, a) Ma20-B, b)
Ma28-C, c) MA15-C, d) Pa40-C, e) Pa60-F and PA30-C.
From graphs of MPC samples (Figure 5.11), it seems that there is no influence of porosity
and roughness on biofouling. However, other tests as well as visual examinations showed a
different reality. As mentioned before, four different points per specimen were analysed.
Furthermore, considering that three replicates were studied, curves correspond to the average
of 12 points. Consequently, initial heterogeneities are not detected as Figure 5.14 illustrates.
Independent of physical parameters, biofouling of MPC samples started in the upper part of the
sample.
A higher heterogeneity was observed for MA15-0.5C specimens due to the highest pore
diameter opened to the surface and considering the test was carried out with algae. However,
this fact may be different depending on the colonizer organism. In the case of microorganisms
as Chlorella vulgaris, if the pore diameter were higher than the cell size, organisms would
penetrate the specimen and, consequently, spend more time to homogeneously colonised the
surface. Then, chemical composition and pH may have more influence than the physical
properties when those parameters are suitable for the microorganism.
Depending on the colonizer organisms, suitable physical and chemical properties will be
different. For that reason, it is important not lose sight of the fact that microorganisms are the
400 450 500 550 600 650 700Wavelength (nm)
f) Pa60-1.75C
400 450 500 550 600 650 700Wavelength (nm)
e) Pa40-1C
05
10152025303540
400 450 500 550 600 650 700
Re
flec
tan
ce (
%)
Wavelength (nm)
d) PA30-1C
0
5
10
15
20
25
30
35
40
400 450 500 550 600 650 700
Re
flec
tan
ce (
%)
Wavelength (nm)400 450 500 550 600 650 700
Wavelength (nm)
c) Ma28-1C
400 450 500 550 600 650 700Wavelength (nm)
b) Ma20-0.75C
WBT 1 3 5 7 10
WBT 1 3 5 10 20
a) MA15-0.5C

Bioreceptivity evaluation under laboratory conditions 89
Sandra Manso Blanco
pioneer colonizers and, consequently, algae like Chlorella vulgaris are good pioneer
representatives. Furthermore, living organisms modify surface properties during the natural
process of colonisation to provide the suitable subtract.
Figure 5.14.- Heterogeneity of reflectance curves for different points (indicated as 1, 2, 3 and 4) and replicates after 2 weeks of accelerated algal fouling.
Results obtained for OPC samples were completely different. The test was prolonged
until 20 weeks because no completely fouled surface was detected after 10 weeks. Reflectance
curves from specimens prior to the test slightly differ between samples mainly due to the
different amount of cement paste and w/c ratio. Biofouling was detected from the second week
for Pa40-C and PA30-C, being the samples with the highest porosity and the highest roughness,
respectively, although it was undetectable in a visual inspection. Furthermore, fewer reductions
in reflectance were detected in comparison to MPC samples.
This fact could be a consequence of the heterogeneity of the fouling of OPC samples as
well as for the initial lower reflectance due to natural colour of the samples. Pa60-F samples
showed no colonisation on their surface although presence of algae was detected by means of
colorimetric measurements due to accumulation of the sprinkling water in some small cavities
(as a consequence of air voids). Concerning PA30-C samples, it was detected that algae
progressively colonised spaces between aggregates due to the high surface roughness.
Furthermore, it is important to notice that biofouling of OPC samples started at the bottom of
samples’ surfaces. The above may be mainly a consequence of different humidity conditions
between the upper and the lower part of OPC specimens.
Other parameters obtained and estimated from colorimetric measurements are shown
in Table 5.2. Interesting parameters related to the current objective are parameters L* and a*,
2
3
1
4
2
3
1
4
2
3
1
4
0
5
10
15
20
25
30
35
400 450 500 550 600 650 700
Re
flec
tan
ce (
%)
Wavelength (nm)
1 2
3 4
400 450 500 550 600 650 700Wavelength (nm)
400 450 500 550 600 650 700Wavelength (nm)
c) Replicate 3 b) Replicate 2 a) Replicate 1

90 Chapter 5
Bioreceptivity optimisation of concrete substratum to stimulate biological colonisation
and total difference in colour. Significant changes in lightness were observed for OPC samples,
although bigger differences were obtained for MPC samples. Similarly, parameter a* showed a
progressive drop, indicating more or less intense biofouling except for Pa60-1.75C. This fact
corresponds with previously analysed results, showing no biofouling on these samples.
Furthermore, higher total differences in colour where detected for MPC samples, Ma28-1C
being the one showing the highest values. This fact might indicate that Ma28-1C specimens are
the most bioreceptive ones of all studied samples.
Table 5.2.- Colorimetric measurements.
Cycle L* a* b* ΔE ΔC ΔH
PA30-1C 0 37,26 ± 2,31 -0,49 ± 0,07 2,34 ± 0,37
20 26,79 ± 2,51 -3,18 ± 0,54 7,63 ± 1,23 12,04 5,88 0,84
Pa40-1C 0 37,45 ± 1,10 -0,02 ± 0,12 4,21 ± 0,40
20 29,59 ± 1,56 -3,22 ± 0,59 7,49 ± 1,04 9,1 3,94 2,34
Pa60-1.75C 0 43,91 ± 1,57 -0,43 ± 0,10 3,71 ± 0,48
20 38,34 ± 1,57 1,34 ± 0,67 10,13 ± 1,78 8,69 6,49 1,51
MA15-0.5C 0 57,29 ± 2,22 1,42 ± 0,53 9,24 ± 1,00
10 23,55 ± 5,46 -4,30 ± 0,85 12,59 ± 3,45 34,38 3,95 5,32
Ma20-0.75C 0 55,88 ± 0,95 2,29 ± 0,18 10,93 ± 0,49
10 23,02 ± 1,63 -3,12 ± 0,71 9,83 ± 1,50 33,32 -0,85 5,46
Ma28-1C 0 57,08 ± 1,30 2,48 ± 0,24 10,81 ± 0,43
10 19,29 ± 1,06 -4,50 ± 0,36 7,55 ± 1,05 38,57 -2,30 7,35
Subsequently, fouling intensity was estimated as mentioned before. Figure 5.15 does
not show results corresponding to weeks 6, 7 and 8 due to a problem during the tests, which led
to meaningless results. Nevertheless, the graph clearly shows the trend of biofouling. First, MPC
samples exhibited higher values and a faster increase of the fouling intensity parameter
compared to OPC samples (Figure 5.15). Initially, a fast rise of fouling intensity was observed for
all MPC samples. Highest values were obtained for Ma28-1C, arriving to around 10 % and
concurring with the reflectance spectra mentioned before. However, a notable drop was
observed after week 4.
These results indicates that FI (%) is a useful parameter during the covering process, but
can lead to misinterpretation when surfaces are already completely fouled. In the particular case
of MPC samples, they were completely fouled after 4 weeks of testing. After these cycles,
accumulation of algae on specimens’ surface was observed, with the result that surface colour
was becoming darker and reflectance was decreasing. In the FI formula, differences between
reflectance at 670 nm and 700 nm are considered. Therefore, decreasing the overall reflectance
of the sample implies a reduction of this difference (as can be seen in Figure 5.11) and FI ceases
to represent the real evolution of biofouling (Figure 5.16).
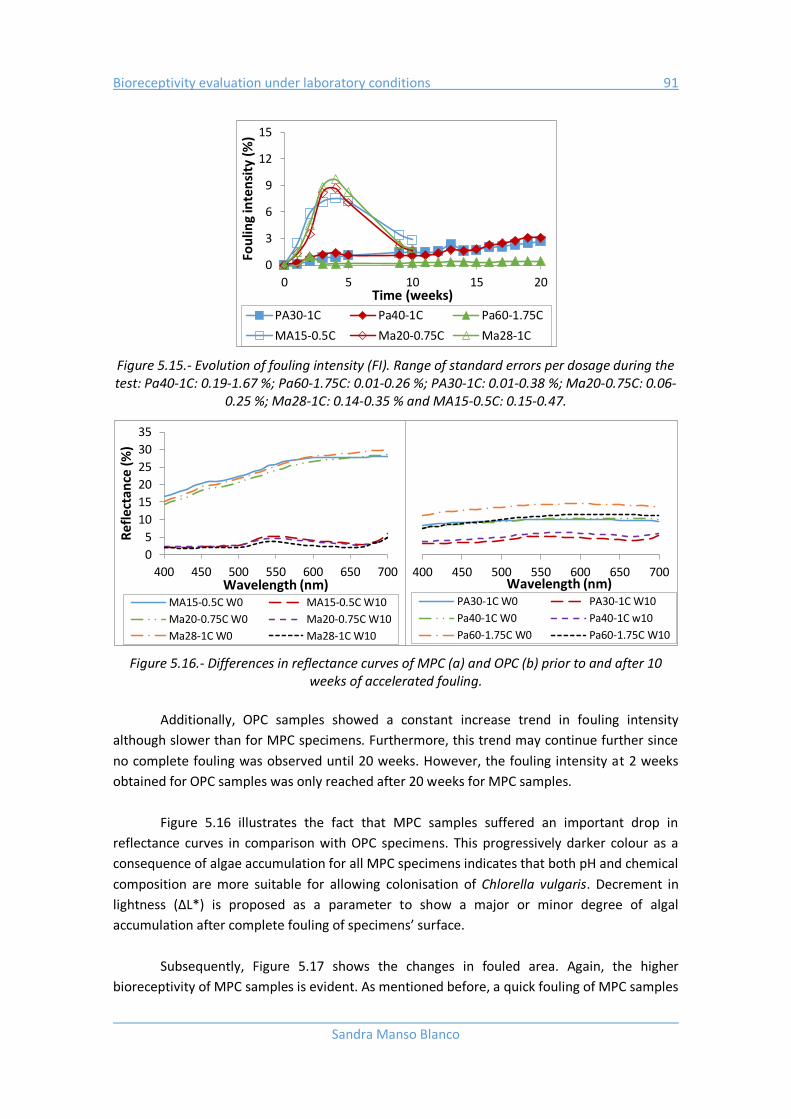
Bioreceptivity evaluation under laboratory conditions 91
Sandra Manso Blanco
Figure 5.15.- Evolution of fouling intensity (FI). Range of standard errors per dosage during the test: Pa40-1C: 0.19-1.67 %; Pa60-1.75C: 0.01-0.26 %; PA30-1C: 0.01-0.38 %; Ma20-0.75C: 0.06-
0.25 %; Ma28-1C: 0.14-0.35 % and MA15-0.5C: 0.15-0.47.
Figure 5.16.- Differences in reflectance curves of MPC (a) and OPC (b) prior to and after 10 weeks of accelerated fouling.
Additionally, OPC samples showed a constant increase trend in fouling intensity
although slower than for MPC specimens. Furthermore, this trend may continue further since
no complete fouling was observed until 20 weeks. However, the fouling intensity at 2 weeks
obtained for OPC samples was only reached after 20 weeks for MPC samples.
Figure 5.16 illustrates the fact that MPC samples suffered an important drop in
reflectance curves in comparison with OPC specimens. This progressively darker colour as a
consequence of algae accumulation for all MPC specimens indicates that both pH and chemical
composition are more suitable for allowing colonisation of Chlorella vulgaris. Decrement in
lightness (ΔL*) is proposed as a parameter to show a major or minor degree of algal
accumulation after complete fouling of specimens’ surface.
Subsequently, Figure 5.17 shows the changes in fouled area. Again, the higher
bioreceptivity of MPC samples is evident. As mentioned before, a quick fouling of MPC samples
400 450 500 550 600 650 700Wavelength (nm)
PA30-1C W0 PA30-1C W10
Pa40-1C W0 Pa40-1C w10
Pa60-1.75C W0 Pa60-1.75C W10
0
5
10
15
20
25
30
35
400 450 500 550 600 650 700
Re
fle
cta
nce
(%
)
Wavelength (nm)MA15-0.5C W0 MA15-0.5C W10
Ma20-0.75C W0 Ma20-0.75C W10
Ma28-1C W0 Ma28-1C W10
0
3
6
9
12
15
0 5 10 15 20
Fou
ling
inte
nsi
ty (
%)
Time (weeks)
PA30-1C Pa40-1C Pa60-1.75C
MA15-0.5C Ma20-0.75C Ma28-1C
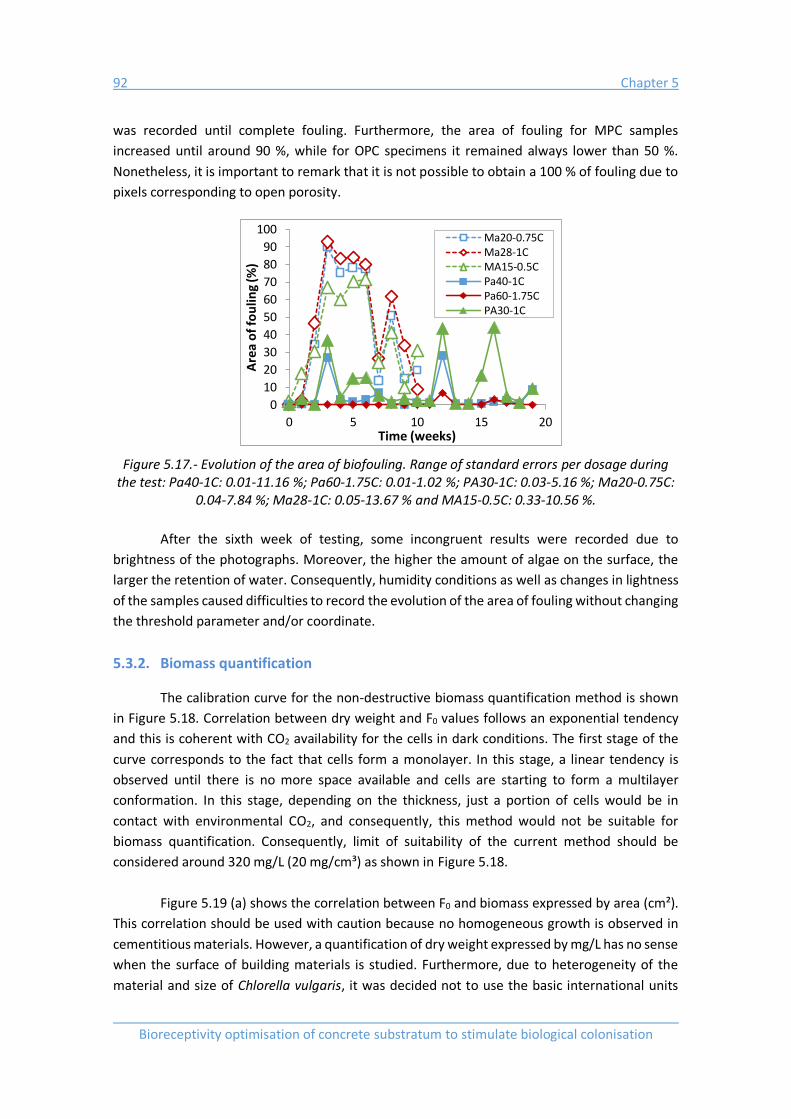
92 Chapter 5
Bioreceptivity optimisation of concrete substratum to stimulate biological colonisation
was recorded until complete fouling. Furthermore, the area of fouling for MPC samples
increased until around 90 %, while for OPC specimens it remained always lower than 50 %.
Nonetheless, it is important to remark that it is not possible to obtain a 100 % of fouling due to
pixels corresponding to open porosity.
Figure 5.17.- Evolution of the area of biofouling. Range of standard errors per dosage during the test: Pa40-1C: 0.01-11.16 %; Pa60-1.75C: 0.01-1.02 %; PA30-1C: 0.03-5.16 %; Ma20-0.75C:
0.04-7.84 %; Ma28-1C: 0.05-13.67 % and MA15-0.5C: 0.33-10.56 %.
After the sixth week of testing, some incongruent results were recorded due to
brightness of the photographs. Moreover, the higher the amount of algae on the surface, the
larger the retention of water. Consequently, humidity conditions as well as changes in lightness
of the samples caused difficulties to record the evolution of the area of fouling without changing
the threshold parameter and/or coordinate.
5.3.2. Biomass quantification
The calibration curve for the non-destructive biomass quantification method is shown
in Figure 5.18. Correlation between dry weight and F0 values follows an exponential tendency
and this is coherent with CO2 availability for the cells in dark conditions. The first stage of the
curve corresponds to the fact that cells form a monolayer. In this stage, a linear tendency is
observed until there is no more space available and cells are starting to form a multilayer
conformation. In this stage, depending on the thickness, just a portion of cells would be in
contact with environmental CO2, and consequently, this method would not be suitable for
biomass quantification. Consequently, limit of suitability of the current method should be
considered around 320 mg/L (20 mg/cm³) as shown in Figure 5.18.
Figure 5.19 (a) shows the correlation between F0 and biomass expressed by area (cm²).
This correlation should be used with caution because no homogeneous growth is observed in
cementitious materials. However, a quantification of dry weight expressed by mg/L has no sense
when the surface of building materials is studied. Furthermore, due to heterogeneity of the
material and size of Chlorella vulgaris, it was decided not to use the basic international units
0
10
20
30
40
50
60
70
80
90
100
0 5 10 15 20
Are
a o
f fo
ulin
g (%
)
Time (weeks)
Ma20-0.75CMa28-1CMA15-0.5CPa40-1CPa60-1.75CPA30-1C
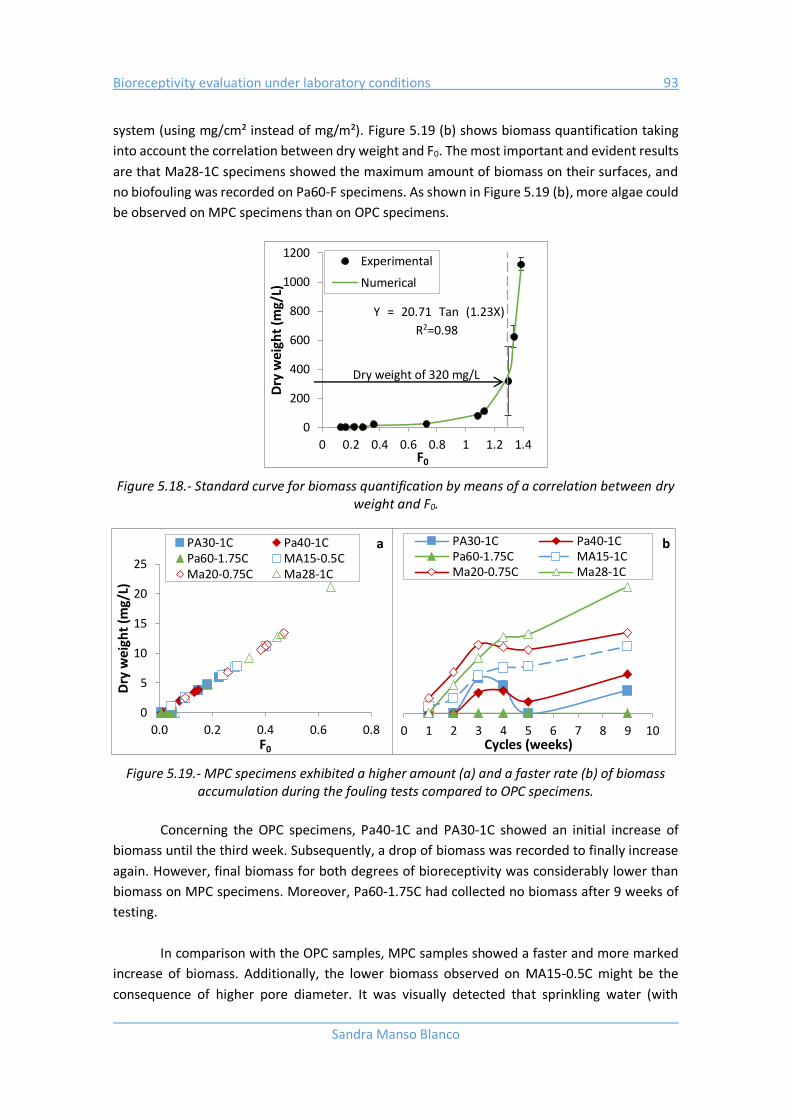
Bioreceptivity evaluation under laboratory conditions 93
Sandra Manso Blanco
system (using mg/cm² instead of mg/m²). Figure 5.19 (b) shows biomass quantification taking
into account the correlation between dry weight and F0. The most important and evident results
are that Ma28-1C specimens showed the maximum amount of biomass on their surfaces, and
no biofouling was recorded on Pa60-F specimens. As shown in Figure 5.19 (b), more algae could
be observed on MPC specimens than on OPC specimens.
Figure 5.18.- Standard curve for biomass quantification by means of a correlation between dry weight and F0.
Figure 5.19.- MPC specimens exhibited a higher amount (a) and a faster rate (b) of biomass accumulation during the fouling tests compared to OPC specimens.
Concerning the OPC specimens, Pa40-1C and PA30-1C showed an initial increase of
biomass until the third week. Subsequently, a drop of biomass was recorded to finally increase
again. However, final biomass for both degrees of bioreceptivity was considerably lower than
biomass on MPC specimens. Moreover, Pa60-1.75C had collected no biomass after 9 weeks of
testing.
In comparison with the OPC samples, MPC samples showed a faster and more marked
increase of biomass. Additionally, the lower biomass observed on MA15-0.5C might be the
consequence of higher pore diameter. It was visually detected that sprinkling water (with
0
5
10
15
20
25
0.0 0.2 0.4 0.6 0.8
Dry
we
igh
t (m
g/L)
F0
PA30-1C Pa40-1CPa60-1.75C MA15-0.5CMa20-0.75C Ma28-1C
0 1 2 3 4 5 6 7 8 9 10Cycles (weeks)
PA30-1C Pa40-1CPa60-1.75C MA15-1CMa20-0.75C Ma28-1C
a b
0
200
400
600
800
1000
1200
0 0.2 0.4 0.6 0.8 1 1.2 1.4
Dry
wei
ght
(mg/
L)
F0
Experimental
Numerical
Y = 20.71 Tan (1.23X)
R2=0.98
Dry weight of 320 mg/L
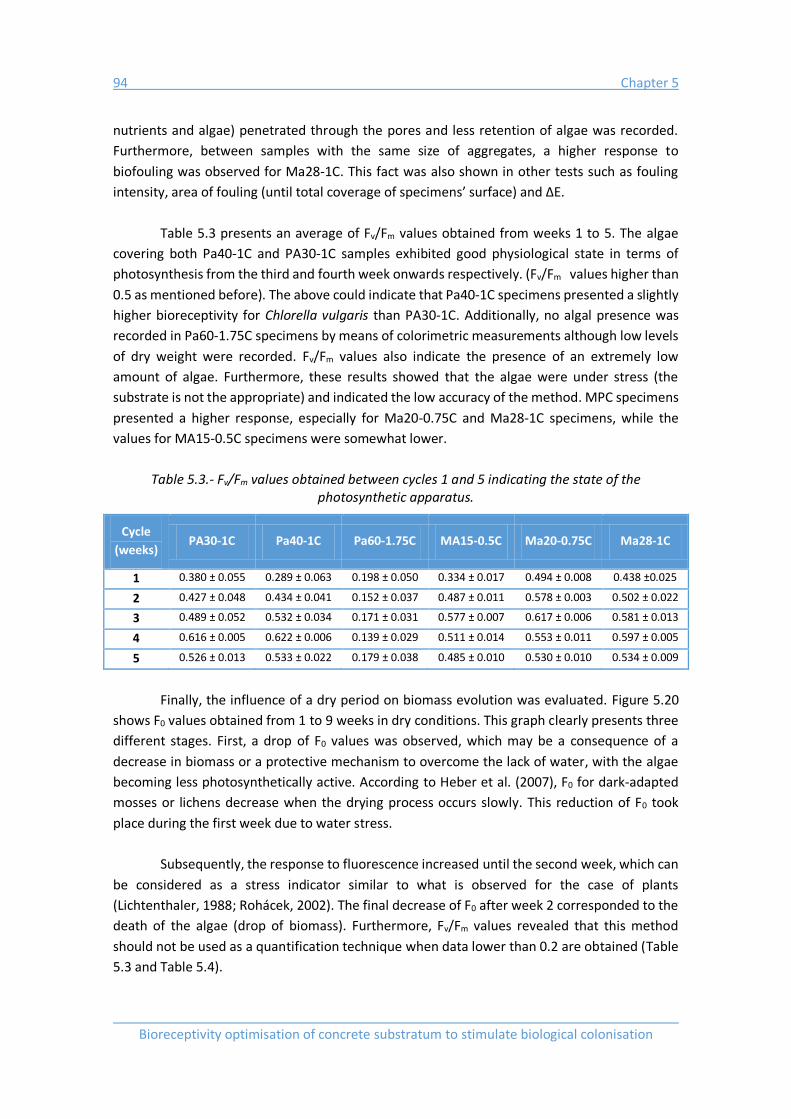
94 Chapter 5
Bioreceptivity optimisation of concrete substratum to stimulate biological colonisation
nutrients and algae) penetrated through the pores and less retention of algae was recorded.
Furthermore, between samples with the same size of aggregates, a higher response to
biofouling was observed for Ma28-1C. This fact was also shown in other tests such as fouling
intensity, area of fouling (until total coverage of specimens’ surface) and ∆E.
Table 5.3 presents an average of Fv/Fm values obtained from weeks 1 to 5. The algae
covering both Pa40-1C and PA30-1C samples exhibited good physiological state in terms of
photosynthesis from the third and fourth week onwards respectively. (Fv/Fm values higher than
0.5 as mentioned before). The above could indicate that Pa40-1C specimens presented a slightly
higher bioreceptivity for Chlorella vulgaris than PA30-1C. Additionally, no algal presence was
recorded in Pa60-1.75C specimens by means of colorimetric measurements although low levels
of dry weight were recorded. Fv/Fm values also indicate the presence of an extremely low
amount of algae. Furthermore, these results showed that the algae were under stress (the
substrate is not the appropriate) and indicated the low accuracy of the method. MPC specimens
presented a higher response, especially for Ma20-0.75C and Ma28-1C specimens, while the
values for MA15-0.5C specimens were somewhat lower.
Table 5.3.- Fv/Fm values obtained between cycles 1 and 5 indicating the state of the photosynthetic apparatus.
Cycle
(weeks) PA30-1C Pa40-1C Pa60-1.75C MA15-0.5C Ma20-0.75C Ma28-1C
1 0.380 ± 0.055 0.289 ± 0.063 0.198 ± 0.050 0.334 ± 0.017 0.494 ± 0.008 0.438 ±0.025
2 0.427 ± 0.048 0.434 ± 0.041 0.152 ± 0.037 0.487 ± 0.011 0.578 ± 0.003 0.502 ± 0.022
3 0.489 ± 0.052 0.532 ± 0.034 0.171 ± 0.031 0.577 ± 0.007 0.617 ± 0.006 0.581 ± 0.013
4 0.616 ± 0.005 0.622 ± 0.006 0.139 ± 0.029 0.511 ± 0.014 0.553 ± 0.011 0.597 ± 0.005
5 0.526 ± 0.013 0.533 ± 0.022 0.179 ± 0.038 0.485 ± 0.010 0.530 ± 0.010 0.534 ± 0.009
Finally, the influence of a dry period on biomass evolution was evaluated. Figure 5.20
shows F0 values obtained from 1 to 9 weeks in dry conditions. This graph clearly presents three
different stages. First, a drop of F0 values was observed, which may be a consequence of a
decrease in biomass or a protective mechanism to overcome the lack of water, with the algae
becoming less photosynthetically active. According to Heber et al. (2007), F0 for dark-adapted
mosses or lichens decrease when the drying process occurs slowly. This reduction of F0 took
place during the first week due to water stress.
Subsequently, the response to fluorescence increased until the second week, which can
be considered as a stress indicator similar to what is observed for the case of plants
(Lichtenthaler, 1988; Rohácek, 2002). The final decrease of F0 after week 2 corresponded to the
death of the algae (drop of biomass). Furthermore, Fv/Fm values revealed that this method
should not be used as a quantification technique when data lower than 0.2 are obtained (Table
5.3 and Table 5.4).
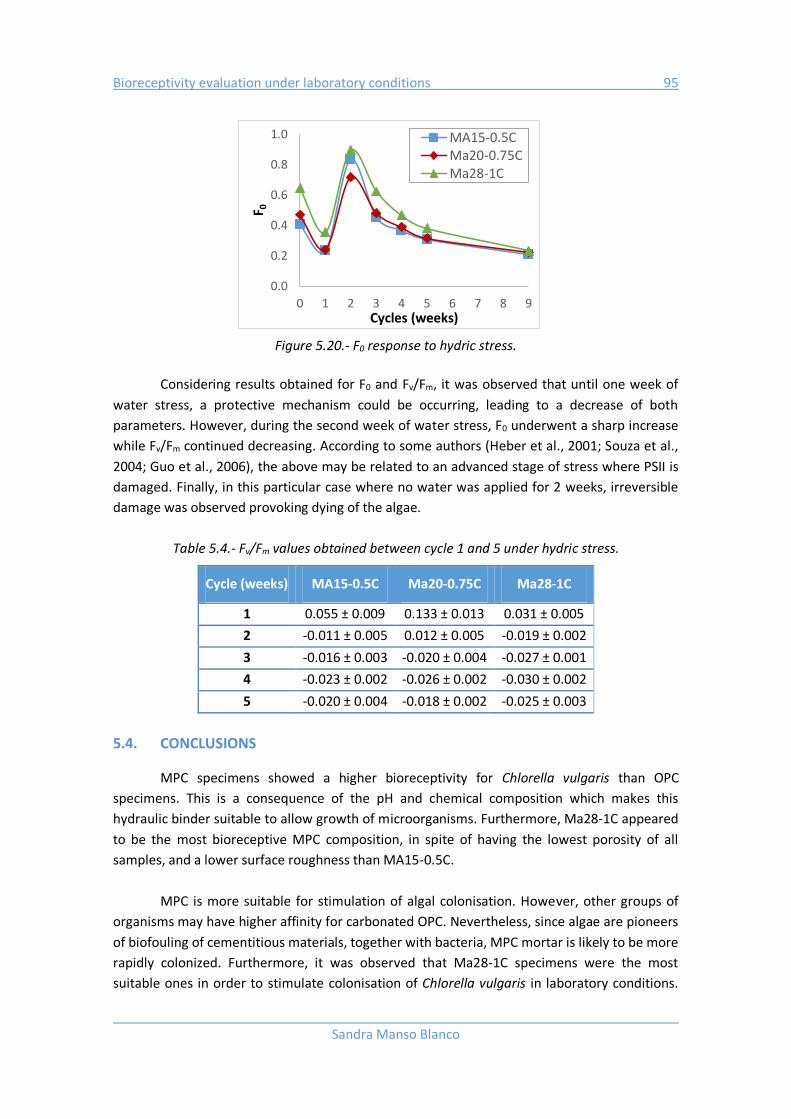
Bioreceptivity evaluation under laboratory conditions 95
Sandra Manso Blanco
Figure 5.20.- F0 response to hydric stress.
Considering results obtained for F0 and Fv/Fm, it was observed that until one week of
water stress, a protective mechanism could be occurring, leading to a decrease of both
parameters. However, during the second week of water stress, F0 underwent a sharp increase
while Fv/Fm continued decreasing. According to some authors (Heber et al., 2001; Souza et al.,
2004; Guo et al., 2006), the above may be related to an advanced stage of stress where PSII is
damaged. Finally, in this particular case where no water was applied for 2 weeks, irreversible
damage was observed provoking dying of the algae.
Table 5.4.- Fv/Fm values obtained between cycle 1 and 5 under hydric stress.
Cycle (weeks) MA15-0.5C Ma20-0.75C Ma28-1C
1 0.055 ± 0.009 0.133 ± 0.013 0.031 ± 0.005
2 -0.011 ± 0.005 0.012 ± 0.005 -0.019 ± 0.002
3 -0.016 ± 0.003 -0.020 ± 0.004 -0.027 ± 0.001
4 -0.023 ± 0.002 -0.026 ± 0.002 -0.030 ± 0.002
5 -0.020 ± 0.004 -0.018 ± 0.002 -0.025 ± 0.003
5.4. CONCLUSIONS
MPC specimens showed a higher bioreceptivity for Chlorella vulgaris than OPC
specimens. This is a consequence of the pH and chemical composition which makes this
hydraulic binder suitable to allow growth of microorganisms. Furthermore, Ma28-1C appeared
to be the most bioreceptive MPC composition, in spite of having the lowest porosity of all
samples, and a lower surface roughness than MA15-0.5C.
MPC is more suitable for stimulation of algal colonisation. However, other groups of
organisms may have higher affinity for carbonated OPC. Nevertheless, since algae are pioneers
of biofouling of cementitious materials, together with bacteria, MPC mortar is likely to be more
rapidly colonized. Furthermore, it was observed that Ma28-1C specimens were the most
suitable ones in order to stimulate colonisation of Chlorella vulgaris in laboratory conditions.
0.0
0.2
0.4
0.6
0.8
1.0
0 1 2 3 4 5 6 7 8 9
F 0
Cycles (weeks)
MA15-0.5CMa20-0.75CMa28-1C

96 Chapter 5
Bioreceptivity optimisation of concrete substratum to stimulate biological colonisation
Chemical properties of these specimens seem to have more influence on colonisation than
physical properties did. This fact can be seen when comparing OPC and MPC samples.
Furthermore, the clearest difference between different MPC specimens for Chlorella
vulgaris colonisation is the heterogeneity of initial growth. Due to the higher pore diameter,
water containing the algae entered into the specimens, showing a more heterogeneous fouling
pattern. Ma20-0.75C and Ma28-1C specimens showed similar results although visual inspections
showed a more homogenous and resistant growth and better aesthetic appearance during
water stress for Ma28-1C specimens.
Visual inspections revealed a difference in the first stage of colonisation between OPC
and MPC specimens. For OPC samples, biofouling started at the bottom side of the specimens,
which may be related to the high amount of moisture located in this area. In contrast, MPC
specimens showed a better water retention as well as more homogeneous moisture
distribution. Consequently, the MPC mortar samples behave like a filter where water penetrated
and algae remained on the surface, initially localizing algal fouling in the upper part.
Related to the initiation of biofouling, the presence of algae was detected from the first
week on MPC specimens’ surface and from the second week on OPC ones. Moreover, MPC
samples were completely fouled after 4 weeks, while no complete fouling was observed until 20
weeks for OPC samples.
Concerning the techniques and evaluation criteria used, some considerations should be
taken into account. First, results obtained from the fouling intensity analysis revealed that this
parameter is not suitable when MPC samples are completely fouled. Once the specimen’s
surface was covered, the amount of algae was increasing forming different layers and showing
as a result a decrease in lightness (L*). The highest decrement in lightness was observed for MPC
specimens, resulting in a drop of “fouling intensity” in the range between 62 % and 82 %.
Additionally, a more pronounced decrease of the a* parameter was also observed for MPC
samples.
A threshold on the a* parameter was used for image analysis and pixels with a* values
higher than 120 were considered as fouled. However, problems to obtain realistic values were
observed after the sixth week of testing. Once MPC specimens were completely fouled and the
thickness of the algae layer was increasing, lightness was decreasing and humidity of the
samples increasing. Consequently, humidity caused some brightness in the photographs that
made them more difficult to analyse. The current method for algal quantification is suitable until
biofouling reached a coverage of about 20 mg/cm2. Higher amounts of dry weight induce low
and insignificant differences on F0. The mg/cm2 units are proposed in order to express biomass
for surfaces, since expressing biomass relative to volume units is not appropriate for this
purpose.

Bioreceptivity evaluation under laboratory conditions 97
Sandra Manso Blanco
Limitation of the use of this method was also observed when algae were submitted to
dry periods. Increases of F0 values were observed where exposed in dry periods probably
showing PSII damage concurring with a drop in Fv/Fm.

98 Chapter 5
Bioreceptivity optimisation of concrete substratum to stimulate biological colonisation

Analysis of natural colonisation 99
Sandra Manso Blanco
6. ANALYSIS OF NATURAL
COLONISATION
6.1. INTRODUCTION
Bioreceptivity of a material, climate conditions and the organisms present in an
environment are the three big groups of parameters involved in colonisation of materials by
living organisms. The first one has been already studied by controlling the remaining parameters
in the previous chapter.
The experimental program presented in Chapter 5 was useful as a fast method to
compare materials with different bioreceptivity. Parameters such as temperature, relative
humidity, day and night regime, the run-off period and the culture solution were controlled.
Consequently, having controlled all these parameters, the only variable was specimens’
bioreceptivity. However, that situation significantly differs from what happens in real
environmental conditions. In that case, not only the specimens differ from one to the other, but
also environmental conditions as well as aspects related to living organisms do.
The current chapter provides two new aspects based on the combination of variable
climatic conditions, as well as presence and diversity of microorganisms. Concerning to climate
conditions, parameters such as temperature, precipitation, sunshine duration (time that direct
radiation is higher than 120 W/m²) or direction of the wind will influence colonisation.
Moreover, the aforementioned parameters will vary, depending on the location as well as
depending on the season. Finally, microorganisms present in the environment differ depending
on the geographical situation and different relationships can be found between them. The

100 Chapter 6
Bioreceptivity optimisation of concrete substratum to stimulate biological colonisation
effects of competition on the distribution and abundance of two species have been studied in
ecology for a long time (Keddy, 1989). Widden (1997) states that a stable coexistence between
two species could only occur when competition between them is weak. Consequently, only the
main division between competition and coexistence will be considered in this study.
Literature reveals the majority of the studies about bioreceptivity of cementitious
materials were carried out exclusively under laboratory conditions although there are recent
studies such the one by Tran et al. (2013). However, it is important to simultaneously study
natural colonisation. Accordingly, the aim of the current chapter is to evaluate the colonisation
of specimens with the same mix design as tested in the previous chapter under environmental
conditions. To reach this objective, the following specific objectives are defined:
Determine mix designs suitability for pioneer colonisers such as environmental bacteria
and fungi;
Assess differences in results due to specimens inclination as well as location;
Determine the necessity of surficial treatments to accelerate the colonisation process.
6.2. MATERIALS AND METHODS
6.2.1. Locations
Regarding the environmental conditions, both climate conditions as well as quality of
the air will influence the colonisation. Therefore, specimens were placed in three different
locations: Barcelona city, the Natural Park of Montseny (60 km from Barcelona) and Ghent city.
First location corresponds to a contaminated area with Mediterranean climate, the second one
to the same climate conditions (although there are some differences due to altitude and
proximity of the sea) but in a non-contaminated area and the third in the surroundings of the
city of Ghent with oceanic climate (Figure 6.1).
Figure 6.1.- Location of the specimens under environmental exposure.
Mediterranean climate is characterised by general moderate temperatures with hot, dry
summers and wet winters with an average of around 10° C. Moreover, countries included in the
Mediterranean region lie between 30° and 45° north and south of the Equator. In contrast, the
Ghent
Montseny
Barcelona

Analysis of natural colonisation 101
Sandra Manso Blanco
temperate maritime climate influenced by the North Sea and the Atlantic Ocean, has cool
summers (average temperature less than 22° C) and moderate winters (average temperatures
warmer than -3° C). Furthermore, the rainfall is usually distributed throughout the year.
6.2.2. Specimens and setup
According to chapter 5, same specimens’ dosages were used for environmental
exposure (PA30-1C, Pa40-1C, Pa60-1.75C, MA15-0.5C, Ma20-0.75C and Ma28-1C). Sixty-six
replicates per dosage were produced in order to compare results of different locations as well
as positions. Both OPC and MPC specimens were cast into 80 x 80 x 20 mm³ polyurethane moulds
and demoulded as previously defined. Furthermore, the curing process for both as well as the
accelerated carbonation process for OPC specimens was carried out.
Expanded polystyrene plates of 3 cm thickness were cut in order to randomly embed
the specimens (Figure 6.2). For that reason, three different layers of expanded polystyrene were
used: the first one with the support function and the next two with holes of the specimens’ size
to fix them inside just leaving one side exposed to the environment. Previous hypothesis was
that colonisation in the Mediterranean climate locations would be slower in comparison to the
temperate maritime climate. Consequently, two different setup sizes were designed depending
on the final location. Furthermore, support plates were produced to place some of the samples
horizontally and others vertically.
Figure 6.2.- Specimens randomly embedded in the expanded polystyrene plates.
Two 1 x 1 x 0.03 m³ plates were produced to place specimens horizontally in Barcelona
and Montseny and one 1 x 1.4 x 0.03 m³ plate for the setup of Ghent. Afterwards, expanded
polystyrene to place specimens vertically were cut forming straps of one sample next to the
other to place all the specimens in the same position. Twelve 1 x 0.12 x 0.03 m³ straps were
produced to place 3 of them in Barcelona, 3 more in Montseny and 6 in Ghent. Subsequently, a
metallic support was built in order to fix the expanded polystyrene supports with the embedded
specimens. Finally, the complete structure was covered with a net in order to avoid the entrance
of animals, which could interfere in the experiment. Furthermore, setups were placed in the way
a b
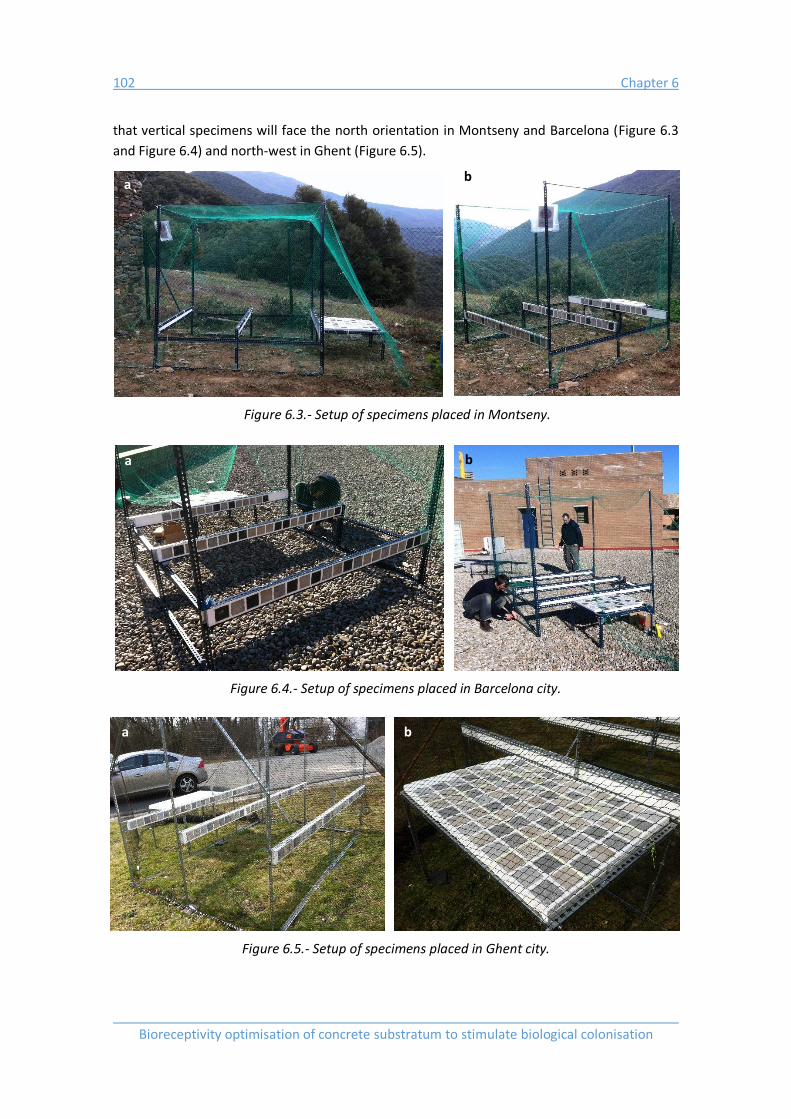
102 Chapter 6
Bioreceptivity optimisation of concrete substratum to stimulate biological colonisation
that vertical specimens will face the north orientation in Montseny and Barcelona (Figure 6.3
and Figure 6.4) and north-west in Ghent (Figure 6.5).
Figure 6.3.- Setup of specimens placed in Montseny.
Figure 6.4.- Setup of specimens placed in Barcelona city.
Figure 6.5.- Setup of specimens placed in Ghent city.
a b
b a
b a
Analysis of natural colonisation 103
Sandra Manso Blanco
Maintenance of the setup areas was carried out in order to avoid interference of
surrounding plants. That task was specially done in Montseny for being a mountainous area and
also in Ghent, where the setup was placed in a green area at the back side of the Magnel
Laboratory for Concrete Research of the Faculty of Engineering and Architecture. Specimens
were exposed for approximately 1 year in Barcelona and Montseny, and approximately 6
months in Ghent.
6.2.3. Samples collection and analysis
A wide variety of microorganisms can be found in petrous materials such as natural rocks
or cementitious materials. According to Escadeillas et al. (2007), pioneer colonisers are usually
bacteria. Those microorganisms have the capability of colonising every surface and allow the
colonisation by other organisms. Biofilms formed by bacteria are usually invisible due to the
absence of pigments. Then, algae, which are characterised for being autotrophic, form another
pioneer group of organisms. In that case, growth is visible and different colours can be observed.
Afterwards, fungi can also appear, a group that it is not considered as a pioneer since it is formed
by heterotrophic organisms.
The current experimental program aims to give comparative information between
different materials’ bioreceptivity in the first stage of natural colonisation. In this sense, both
visual and invisible colonisation were studied. For the above purpose, detection of
photosynthetic organisms by image analysis as well as detection and quantification of the
predominant microorganisms by means of SEM, plate counting and biochemical and microscopic
analysis were obtained.
First, detection of biological growth due to photosynthetic organisms was determined
by means of image analysis. Standardized images of all specimens were taken monthly. A
metallic support to standardize the angles as well as the distance between the camera objective
and the surface of the specimens was developed. Image analysis was then carried out in order
to determine possible changes in the colour of the samples due to colonisation of
photosynthetic organisms similarly as it was done in the previous Chapter.
Subsequently, destructive analyses of the specimens were carried out once, at the end
of the test (SEM, microorganisms’ identification and plate counting). The aforementioned
analysis aims to determine the predominant organisms presents on the specimens surface in
order to compare different bioreceptivities of the specimens as well as environmental
conditions due to location of specimens. Classification and identification of the different groups
of organisms, which could be present on specimens’ surface, will follow different procedures.
First, microorganisms should be grown in specific media depending of the group of organism.
For instance, general media for bacteria, fungi or yeasts are selected in order to separate those
big groups of organisms. However, there are microorganisms that cannot be grown under
laboratory conditions or need special media for their growth. Furthermore, an incubation period
104 Chapter 6
Bioreceptivity optimisation of concrete substratum to stimulate biological colonisation
under specific conditions is required after the first stage, in which organisms are sown in the
media. Afterwards, pure cultures should be obtained in order to identify the specie or genus.
Different methods can be used for organisms’ identification going from classical
methods, such as biochemical analysis or microscopic and macroscopic characteristics, to
molecular technics, such as the Polymerase Chain Reaction (PCR). In the current experimental
program classical methods were used for identification. Taxonomy is the branch of the science
concerned with classification of organisms. Accordingly, differential characters should be known
in order to determine the species or at least the genus of an organism.
There are plenty of tests for microorganisms’ identification although not all of them are
useful for the same groups. For instance, bacterial identification usually starts by determining
the Gram reaction. By this method, a first screening allows to classify the specie as Gram positive
or Gram negative. Then, it is also worthwhile to study the morphology and motility of the cells
by means of a microscope although morphology could be affected by the medium on which the
organisms are grown and temperature of incubation (Cowan, 1974). Afterwards, biochemical as
well as growth ability under different conditions are also useful to identify the species. Regarding
identification of fungi and yeasts, microscopic and macroscopic characteristics analysis as well
as a biochemical test are usually carried out.
For that purpose two replicates per specimen, position (horizontal or vertical) and
location were selected randomly. Then, microorganisms from the surface of the specimens were
removed with a cotton swab. Those samples were then seeded in different culture media to
detect bacteria, algae and fungi in the Laboratory of Microbiology of the Faculty of Veterinary
Medicine (Autonomous University of Barcelona). General culture media used for bacteria
detection was Tryptic Soy Agar (TSA). Sabouraud Agar with antibiotics was used for fungi
determination, Tryptone Sulfite Neomycin Agar (TSN Agar) and Sulfite Polymixin Sulfadiazine
Agar (SPS Agar) for anaerobic bacteria and MacConkey Agar for Enterobacteriacea
determination. Furthermore, punctual samples of environmental microorganisms present in all
three areas were obtained by exposing two Petri dishes, one containing Tryptic Soy Agar and
the other one containing Sabouraud Agar with antibiotics. Then, Petri dishes were maintained
open next to the setup during 10 minutes to obtain the sample. Composition of all culture media
is detailed below.
Once samples were seeded, Petri dishes were incubated under different conditions as
detailed in Table 6.1. Afterwards, different classical assays were carried out in order to provide
information about the microorganisms. Identification of bacteria was determined by means of
the Gram stain method, the spores staining for Gram positive bacillus, the catalase and oxidase
test and the microorganisms sown in API gallery according to the presumptive genera. Then,
identification of fungi was obtained by means of fresh samples observation in lactofen blue and
evaluation of macroscopic as well as microscopic characteristics. Finally, yeasts identification
was achieved by means of fresh samples observation in lactofen blue, methylene blue stain and
API 20C AUX gallery.
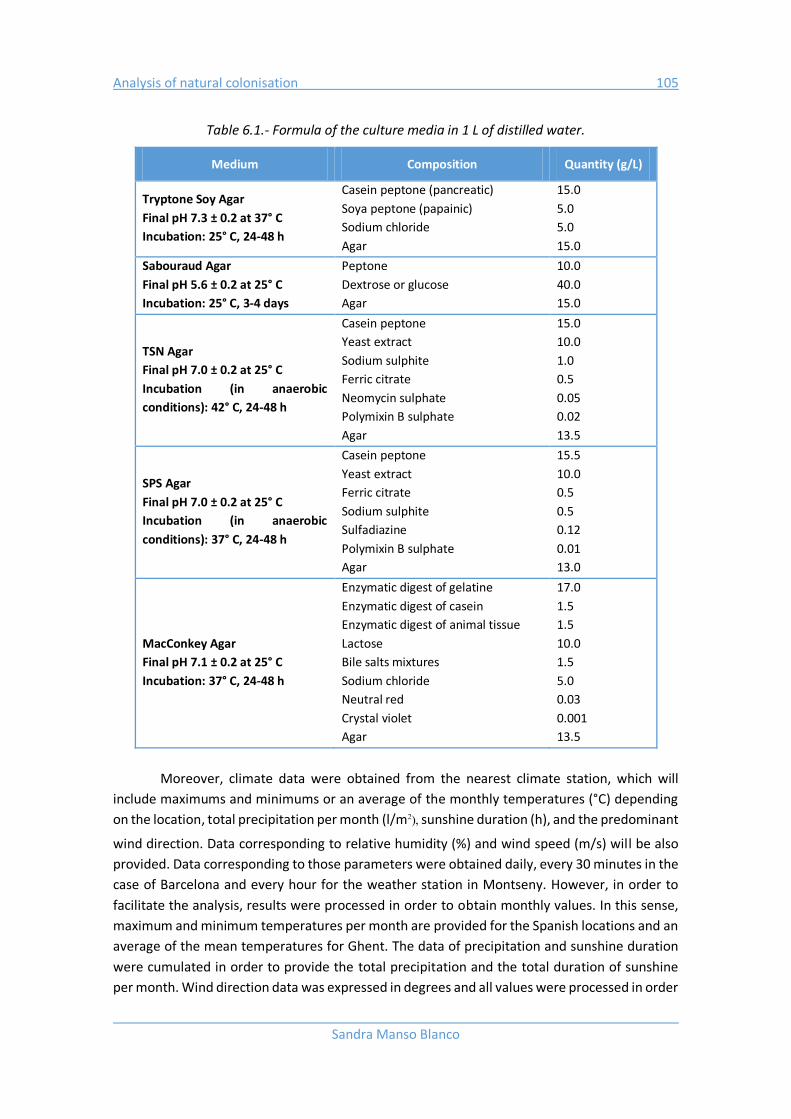
Analysis of natural colonisation 105
Sandra Manso Blanco
Table 6.1.- Formula of the culture media in 1 L of distilled water.
Medium Composition Quantity (g/L)
Tryptone Soy Agar
Final pH 7.3 ± 0.2 at 37° C
Incubation: 25° C, 24-48 h
Casein peptone (pancreatic)
Soya peptone (papainic)
Sodium chloride
Agar
15.0
5.0
5.0
15.0
Sabouraud Agar
Final pH 5.6 ± 0.2 at 25° C
Incubation: 25° C, 3-4 days
Peptone
Dextrose or glucose
Agar
10.0
40.0
15.0
TSN Agar
Final pH 7.0 ± 0.2 at 25° C
Incubation (in anaerobic
conditions): 42° C, 24-48 h
Casein peptone
Yeast extract
Sodium sulphite
Ferric citrate
Neomycin sulphate
Polymixin B sulphate
Agar
15.0
10.0
1.0
0.5
0.05
0.02
13.5
SPS Agar
Final pH 7.0 ± 0.2 at 25° C
Incubation (in anaerobic
conditions): 37° C, 24-48 h
Casein peptone
Yeast extract
Ferric citrate
Sodium sulphite
Sulfadiazine
Polymixin B sulphate
Agar
15.5
10.0
0.5
0.5
0.12
0.01
13.0
MacConkey Agar
Final pH 7.1 ± 0.2 at 25° C
Incubation: 37° C, 24-48 h
Enzymatic digest of gelatine
Enzymatic digest of casein
Enzymatic digest of animal tissue
Lactose
Bile salts mixtures
Sodium chloride
Neutral red
Crystal violet
Agar
17.0
1.5
1.5
10.0
1.5
5.0
0.03
0.001
13.5
Moreover, climate data were obtained from the nearest climate station, which will
include maximums and minimums or an average of the monthly temperatures (°C) depending
on the location, total precipitation per month (l/m2), sunshine duration (h), and the predominant
wind direction. Data corresponding to relative humidity (%) and wind speed (m/s) will be also
provided. Data corresponding to those parameters were obtained daily, every 30 minutes in the
case of Barcelona and every hour for the weather station in Montseny. However, in order to
facilitate the analysis, results were processed in order to obtain monthly values. In this sense,
maximum and minimum temperatures per month are provided for the Spanish locations and an
average of the mean temperatures for Ghent. The data of precipitation and sunshine duration
were cumulated in order to provide the total precipitation and the total duration of sunshine
per month. Wind direction data was expressed in degrees and all values were processed in order

106 Chapter 6
Bioreceptivity optimisation of concrete substratum to stimulate biological colonisation
to group them into eight directions (north, north-east, east, south-east, south, south-west, west
and north-west). Finally, an average of the relative humidity as well as the wind velocity per
month was estimated.
Afterwards, information related to air quality will be presented only for the Spanish
locations, since it was not possible to obtain the Belgian records. The data considered in the
current investigation were concentrations of sulphur dioxide (SO2, µg/m³), nitrogen oxides (NOx,
µg/m³), carbon monoxide (CO, mg/m³) and ozone (O3, µg/m³). Those parameters are included
in the BOE-A-2011, Real Decreto 102/2011 (Spanish Loyal Legislative Decree) and they can also
give extra information to the weather data. In that case, values were obtained daily and the
monthly average was calculated.
6.3. RESULTS AND ANALYSIS
In the present section different results will be shown. Three subsections will divide the
results by location. Those subsections will include the identification of the most representative
species present in all different specimens as well as general information about them will be
presented. Moreover, they include an analysis about the representativeness of the results as
well as the possible causes and finally, information regarding climate conditions and air quality,
comparing the available data for the different locations. Regarding the procedures mentioned
in the previous section, photographs of all the specimens were taken. However, no visible
growth, the different humidity conditions for specimens at different times or the intensity of the
natural light make their comparison difficult (Figure 6.6).
Figure 6.6.- Visual appearance of each dosage in Barcelona city at the beginning and the end of the test.
MA
15
-0.5
C
Ma2
0-0
.75C
M
a28
-1C
1 day 10 months
PA
30
-1C
P
a40
-1C
P
a60
-1.7
5C
1 day 10 months
Analysis of natural colonisation 107
Sandra Manso Blanco
6.3.1. Barcelona city
Predominant microorganisms
Four different genera of bacteria and ten genera of fungi were identified as the most
representative in the punctual environmental sampling. That punctual sampling cannot be
considered as a valid result for a period of time since microorganisms distribution varies
temporarily as well as geographically. Bacteria are usually less present in the atmosphere than
fungi and they are usually associated with other particles. Concentration as well as variability of
aerobacteria change between day and night and also between seasons. According to Tong and
Lighthart (1997), pigmented bacteria are more numerous during the day due to their solar
radiation protection. Furthermore, they also state that Gram positive bacteria with sporulation
capability decrease during the night and Gram negative increase while the opposite occurs
during the day (Lighthart and Shaffer, 1995). Concerning to spreading of fungi, sporulation and
spore dispersal depend on biological, climatic and physical processes (Hjelmroos, 1993).
According to McCartney and Lacey (1991), rain and wind are the most important carriers
geographically. Moreover, fungal populations differ between regions as well as between
seasons as happens with bacteria (Shelton et al., 2002).
The identified bacterial genera (species are presented in brackets) were Aerococcus
(Aerococcus sp.), Bacillus (Bacillus subtilis, others), Flavobacterium (Flavobacterium sp.)
and Kocuria (Kocuria kristinae, Kocuria lutea and Kocuria rhizophilum), whose main
characteristics are presented in Table 6.2. A total of 78 colony forming units (CFUs) per plate
were obtained by direct plate count. With regard to fungi, the genera observed were
Acremonium (Acremonium strictum), Alternaria (Aternaria alternate), Aspergillus
(Aspergillus flavus, others), Aureobasidium (Aureobasidium pullulans), Cladosporium
(Cladosporium herbarum), Fusarium (Fusarium moniliforme), Penicillium (Penicillium sp.),
Phoma (Phoma herbarum), Rhizopus (Rhizopus sp.) and Rhodotorula (Rhotorula glutinis).
The number of CFUs per plate obtained was 60 for both fungi and yeasts and the taxonomic
classification of all genera is presented in Figure 6.7.
Taxonomic classification is a useful tool for the analysis since it will provide information
about how similar could be the organisms. For instance, the genus Aspergillus and Penicillium
correspond to the same taxon (Family Trichocomacea) and those genera have more similar
characteristics than between the genus Aspergillus and Rhizopus, which correspond to two
different divisions. In this sense we could distinguish three main groups, which are Ascomycota,
Zygomycota and Basidiomycota. Inside those groups, six subgroups can be established for
Ascomycota and one for each one of the other two groups.
Regarding the organisms identified on the specimens surface located in the city of
Barcelona, one more genus of bacteria (Streptococcus) and three more genera of fungi
(Epicoccum, Gilmaniella and Mucor) were identified. According to the characteristics provided
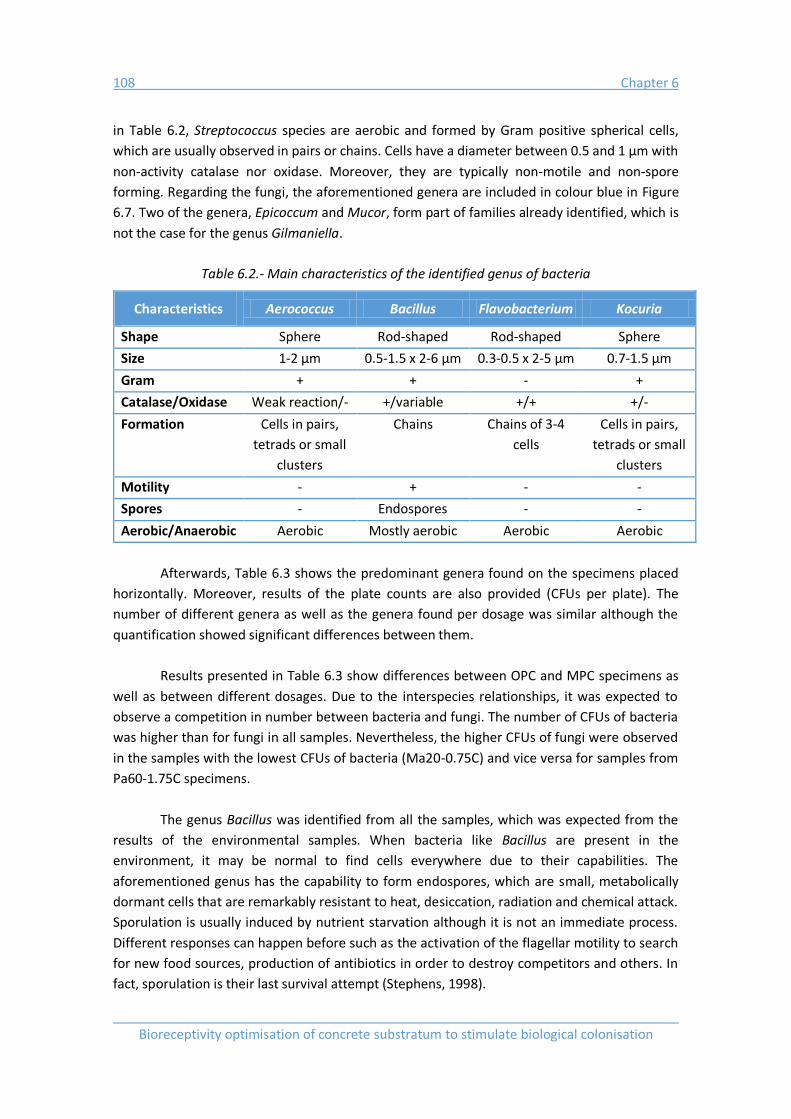
108 Chapter 6
Bioreceptivity optimisation of concrete substratum to stimulate biological colonisation
in Table 6.2, Streptococcus species are aerobic and formed by Gram positive spherical cells,
which are usually observed in pairs or chains. Cells have a diameter between 0.5 and 1 µm with
non-activity catalase nor oxidase. Moreover, they are typically non-motile and non-spore
forming. Regarding the fungi, the aforementioned genera are included in colour blue in Figure
6.7. Two of the genera, Epicoccum and Mucor, form part of families already identified, which is
not the case for the genus Gilmaniella.
Table 6.2.- Main characteristics of the identified genus of bacteria
Characteristics Aerococcus Bacillus Flavobacterium Kocuria
Shape Sphere Rod-shaped Rod-shaped Sphere
Size 1-2 µm 0.5-1.5 x 2-6 µm 0.3-0.5 x 2-5 µm 0.7-1.5 µm
Gram + + - +
Catalase/Oxidase Weak reaction/- +/variable +/+ +/-
Formation Cells in pairs,
tetrads or small
clusters
Chains Chains of 3-4
cells
Cells in pairs,
tetrads or small
clusters
Motility - + - -
Spores - Endospores - -
Aerobic/Anaerobic Aerobic Mostly aerobic Aerobic Aerobic
Afterwards, Table 6.3 shows the predominant genera found on the specimens placed
horizontally. Moreover, results of the plate counts are also provided (CFUs per plate). The
number of different genera as well as the genera found per dosage was similar although the
quantification showed significant differences between them.
Results presented in Table 6.3 show differences between OPC and MPC specimens as
well as between different dosages. Due to the interspecies relationships, it was expected to
observe a competition in number between bacteria and fungi. The number of CFUs of bacteria
was higher than for fungi in all samples. Nevertheless, the higher CFUs of fungi were observed
in the samples with the lowest CFUs of bacteria (Ma20-0.75C) and vice versa for samples from
Pa60-1.75C specimens.
The genus Bacillus was identified from all the samples, which was expected from the
results of the environmental samples. When bacteria like Bacillus are present in the
environment, it may be normal to find cells everywhere due to their capabilities. The
aforementioned genus has the capability to form endospores, which are small, metabolically
dormant cells that are remarkably resistant to heat, desiccation, radiation and chemical attack.
Sporulation is usually induced by nutrient starvation although it is not an immediate process.
Different responses can happen before such as the activation of the flagellar motility to search
for new food sources, production of antibiotics in order to destroy competitors and others. In
fact, sporulation is their last survival attempt (Stephens, 1998).
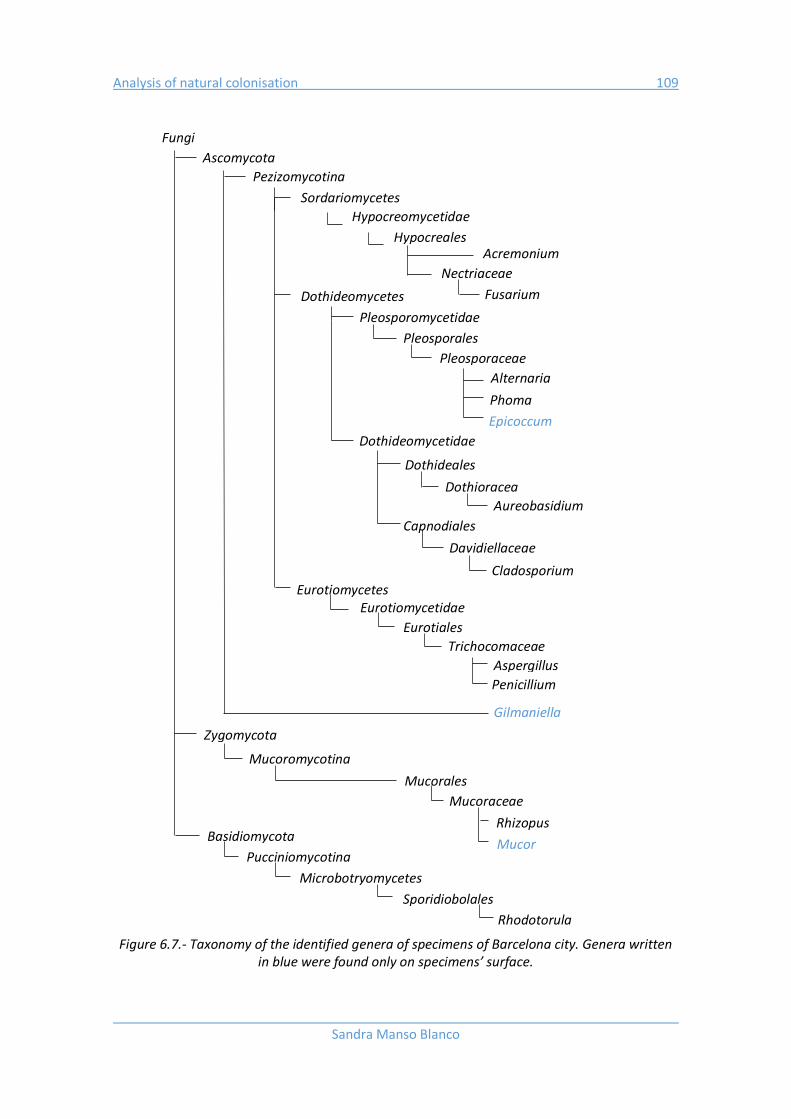
Analysis of natural colonisation 109
Sandra Manso Blanco
Figure 6.7.- Taxonomy of the identified genera of specimens of Barcelona city. Genera written in blue were found only on specimens’ surface.
Fungi
Ascomycota Pezizomycotina
Sordariomycetes Hypocreomycetidae
Acremonium Nectriaceae
Fusarium Dothideomycetes
Pleosporomycetidae
Pleosporales
Pleosporaceae
Hypocreales
Alternaria
Phoma
Epicoccum Dothideomycetidae
Dothideales
Capnodiales
Dothioracea Aureobasidium
Davidiellaceae
Cladosporium Eurotiomycetes
Eurotiomycetidae Eurotiales
Trichocomaceae Aspergillus
Penicillium
Gilmaniella
Zygomycota
Mucoromycotina
Mucorales
Mucoraceae
Rhizopus
Mucor Basidiomycota
Pucciniomycotina
Microbotryomycetes
Sporidiobolales
Rhodotorula
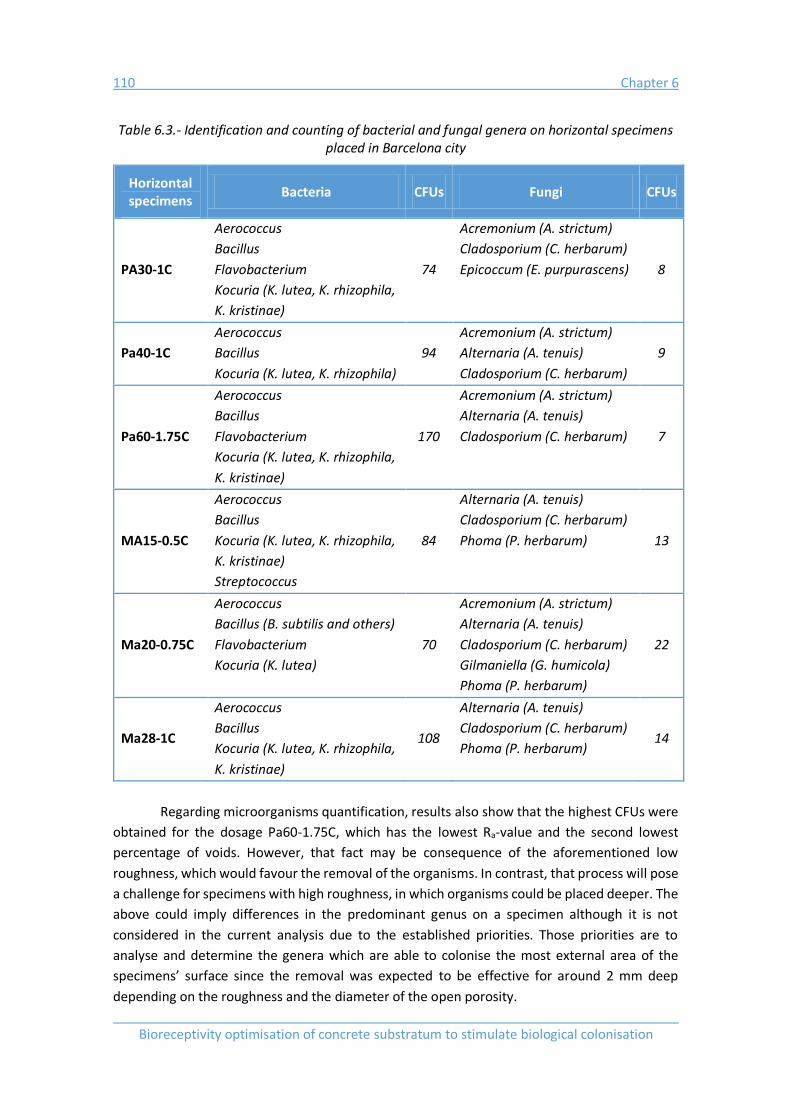
110 Chapter 6
Bioreceptivity optimisation of concrete substratum to stimulate biological colonisation
Table 6.3.- Identification and counting of bacterial and fungal genera on horizontal specimens placed in Barcelona city
Horizontal specimens
Bacteria CFUs Fungi CFUs
PA30-1C
Aerococcus
Bacillus
Flavobacterium
Kocuria (K. lutea, K. rhizophila,
K. kristinae)
74
Acremonium (A. strictum)
Cladosporium (C. herbarum)
Epicoccum (E. purpurascens) 8
Pa40-1C
Aerococcus
Bacillus
Kocuria (K. lutea, K. rhizophila)
94
Acremonium (A. strictum)
Alternaria (A. tenuis)
Cladosporium (C. herbarum)
9
Pa60-1.75C
Aerococcus
Bacillus
Flavobacterium
Kocuria (K. lutea, K. rhizophila,
K. kristinae)
170
Acremonium (A. strictum)
Alternaria (A. tenuis)
Cladosporium (C. herbarum)
7
MA15-0.5C
Aerococcus
Bacillus
Kocuria (K. lutea, K. rhizophila,
K. kristinae)
Streptococcus
84
Alternaria (A. tenuis)
Cladosporium (C. herbarum)
Phoma (P. herbarum) 13
Ma20-0.75C
Aerococcus
Bacillus (B. subtilis and others)
Flavobacterium
Kocuria (K. lutea)
70
Acremonium (A. strictum)
Alternaria (A. tenuis)
Cladosporium (C. herbarum)
Gilmaniella (G. humicola)
Phoma (P. herbarum)
22
Ma28-1C
Aerococcus
Bacillus
Kocuria (K. lutea, K. rhizophila,
K. kristinae)
108
Alternaria (A. tenuis)
Cladosporium (C. herbarum)
Phoma (P. herbarum) 14
Regarding microorganisms quantification, results also show that the highest CFUs were
obtained for the dosage Pa60-1.75C, which has the lowest Ra-value and the second lowest
percentage of voids. However, that fact may be consequence of the aforementioned low
roughness, which would favour the removal of the organisms. In contrast, that process will pose
a challenge for specimens with high roughness, in which organisms could be placed deeper. The
above could imply differences in the predominant genus on a specimen although it is not
considered in the current analysis due to the established priorities. Those priorities are to
analyse and determine the genera which are able to colonise the most external area of the
specimens’ surface since the removal was expected to be effective for around 2 mm deep
depending on the roughness and the diameter of the open porosity.
Analysis of natural colonisation 111
Sandra Manso Blanco
Concerning fungal quantification, significant differences are observed between OPC and
MPC specimens, where the second ones seems to be more suitable for their growth. In general,
most fungal genera grow in environments with pH between 5 and 7 (Azmi and Seppelt, 1997).
Consequently, a higher fungal growth in MPC specimens than in OPC ones was expected. In that
case in which specimens were placed horizontally and in Barcelona, the highest fungal CFUs per
plate were obtained for Ma20-0.75C specimens. Furthermore, they were the ones showing a
higher biodiversity. The above may be related not just to the pH but also to properties studied
in Chapter 4, where that dosage obtained a relatively low roughness as well as porosity.
Genera Acremonium, Alternaria and Cladosporium were identified from all the
specimens. According to Onions and Brandy (1987), Acremonium can grow in a wide range of
pH, pH 6 being the optimum and then growing better at a pH 9 than a pH 3. However, the
morphology of the mycelium is different going from branched mycelial clumps to unbranched
filaments at pH 6 and 9 respectively. Genus Alternaria has also an optimal growth pH between
6 and 7. Then, the genus Phoma was only identified on MPC specimens and that fact may be
due to the optimal growth pH of that genus, which is between 3 and 6, MPC specimens being
more suitable as a support than OPC specimens.
Table 6.4 presents the results obtained for vertical specimens, also showing the most
representative genera identified as well as the plate counting. In general, the horizontal position
should be the more suitable since gravity would favour deposition of bacteria, spores, organic
matter, others. Furthermore, climate conditions such as rain and incident wind will affect also
the maintenance of the organisms on the surface. Previous hypotheses consider that wind
would affect mostly the surficial organisms on vertical specimens while rain would do it mainly
to the ones on horizontal specimens, considering a higher impact of the raindrops on the
specimens’ surface.
Lower values of colony forming units were obtained, which is a clear consequence of the
inclination. Regarding bacterial results, the highest CFUs value was obtained for the dosage
Ma28-1C followed again by the Pa60-1.75C dosage. The aforementioned dosages obtained the
highest values for quantification of both horizontal and vertical specimens. Regarding fungi,
results do not show a clear trend and more replicates may be necessary in order to obtain more
representative results.
Finally, SEM images were obtained at the end of the test with the purpose of showing
the microscopic appearance of the organisms and the coverage of the specimens. A huge
heterogeneity was observed for OPC specimens, where different areas of the specimens showed
a completely different appearance. Moreover, bacteria on MPC specimens could not be seen
since it was not possible to zoom in with good resolution. The above may be due to some
interference between the sample and the sample preparation process.

112 Chapter 6
Bioreceptivity optimisation of concrete substratum to stimulate biological colonisation
Table 6.4.- Identification and counting of bacterial and fungal genera on vertical specimens placed in Barcelona city
Vertical specimens
Bacteria CFUs Fungi CFUs
PA30-1C
Aerococcus
Kocuria (K. lutea, K.
rhizophila, K. kristinae)
10
Cladosporium (C. herbarum)
Mucor (M. mucedo)
Phoma (P. herbarum)
10
Pa40-1C Bacillus (B. subtilis and
others) 2
Alternaria (A. tenuis)
Cladosporium (C. herbarum) 2
Pa60-1.75C
Aerococcus
Kocuria (K. lutea, K.
rhizophila, K. kristinae) 25
Acremonium (A. strictum)
Alternaria (A. tenuis)
Cladosporium (C. herbarum)
Phoma (P. herbarum)
6
MA15-0.5C Bacillus
Kocuria (K. rhizophila) 9
- -
Ma20-0.75C
Aerococcus
Bacillus
Kocuria (K. lutea, K.
rhizophila, K. kristinae)
11
Acremonium (A. strictum)
Cladosporium (C. herbarum) 5
Ma28-1C
Aerococcus
Bacillus
Kocuria (K. lutea, K.
rhizophila, K. kristinae)
42
Acremonium (A. strictum)
Alternaria (A. tenuis)
Cladosporium (C. herbarum)
Phoma (P. herbarum)
Rhodotorula (R. glutinis)
5
Figure 6.8 shows a photograph of the colonised surface of a Pa40-1C specimen. Bacteria
found are rod-shaped and with a size of around 1.6 x 2 µm, which corresponds with the genus
Bacillus, the one identified on that specimens. Concerning the two smaller bodies in both sizes
of the Bacillus, they could be Aerococcus due to their size although they were not isolated from
those specimens. Moreover, hyphae of fungi were also observed on some specimens as can be
seen in Figure 6.9.
Figure 6.8.- Detail of Pa40-1C specimen with bacteria (b), which may belong to genus Aerococcus (a) and Bacillus (c).
Bacillus (0.6 x 2 µm) a c b
Diplococcus (0.6 µm Ø)
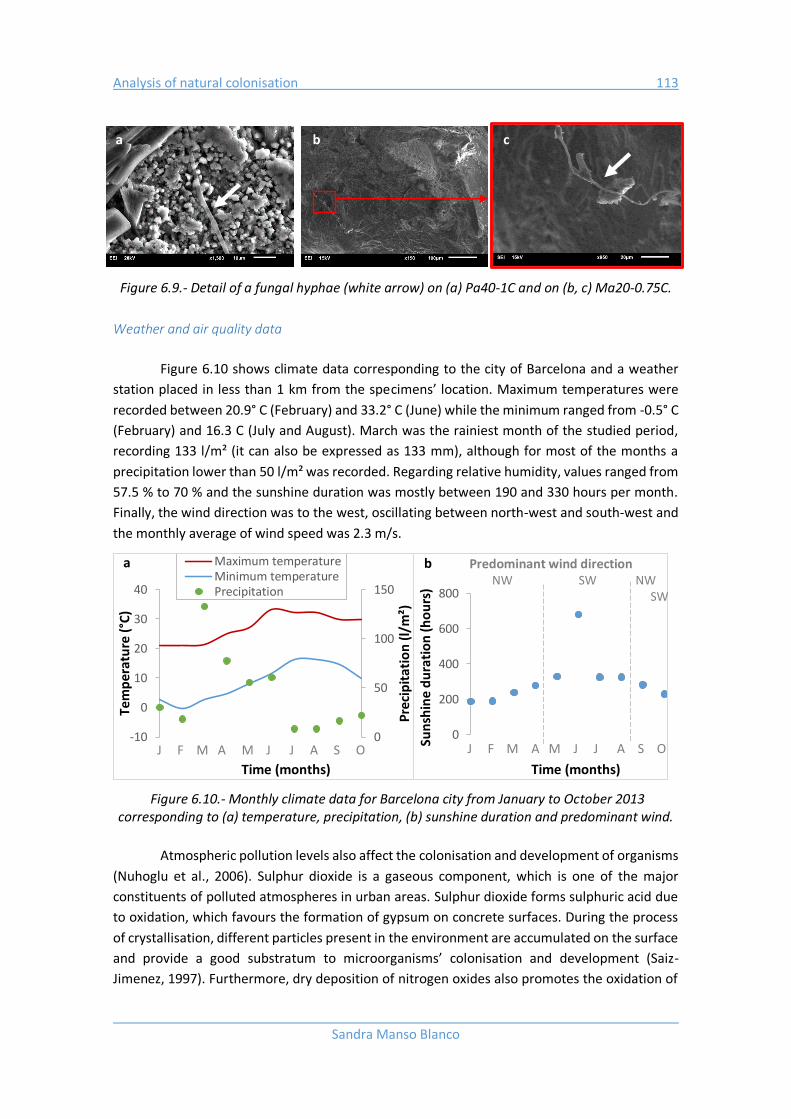
Analysis of natural colonisation 113
Sandra Manso Blanco
Figure 6.9.- Detail of a fungal hyphae (white arrow) on (a) Pa40-1C and on (b, c) Ma20-0.75C.
Weather and air quality data
Figure 6.10 shows climate data corresponding to the city of Barcelona and a weather
station placed in less than 1 km from the specimens’ location. Maximum temperatures were
recorded between 20.9° C (February) and 33.2° C (June) while the minimum ranged from -0.5° C
(February) and 16.3 C (July and August). March was the rainiest month of the studied period,
recording 133 l/m² (it can also be expressed as 133 mm), although for most of the months a
precipitation lower than 50 l/m² was recorded. Regarding relative humidity, values ranged from
57.5 % to 70 % and the sunshine duration was mostly between 190 and 330 hours per month.
Finally, the wind direction was to the west, oscillating between north-west and south-west and
the monthly average of wind speed was 2.3 m/s.
Figure 6.10.- Monthly climate data for Barcelona city from January to October 2013 corresponding to (a) temperature, precipitation, (b) sunshine duration and predominant wind.
Atmospheric pollution levels also affect the colonisation and development of organisms
(Nuhoglu et al., 2006). Sulphur dioxide is a gaseous component, which is one of the major
constituents of polluted atmospheres in urban areas. Sulphur dioxide forms sulphuric acid due
to oxidation, which favours the formation of gypsum on concrete surfaces. During the process
of crystallisation, different particles present in the environment are accumulated on the surface
and provide a good substratum to microorganisms’ colonisation and development (Saiz-
Jimenez, 1997). Furthermore, dry deposition of nitrogen oxides also promotes the oxidation of
0
50
100
150
-10
0
10
20
30
40
Pre
cip
ita
tio
n (
l/m
²)
Tem
pe
ratu
re (
°C)
Time (months)
Maximum temperatureMinimum temperaturePrecipitation
J F M A M J J A S O 0
200
400
600
800
Sun
shin
e d
ura
tio
n (h
ou
rs)
Time (months)
J F M A M J J A S O
Predominant wind direction NW SW NW
SW
a b
a b c
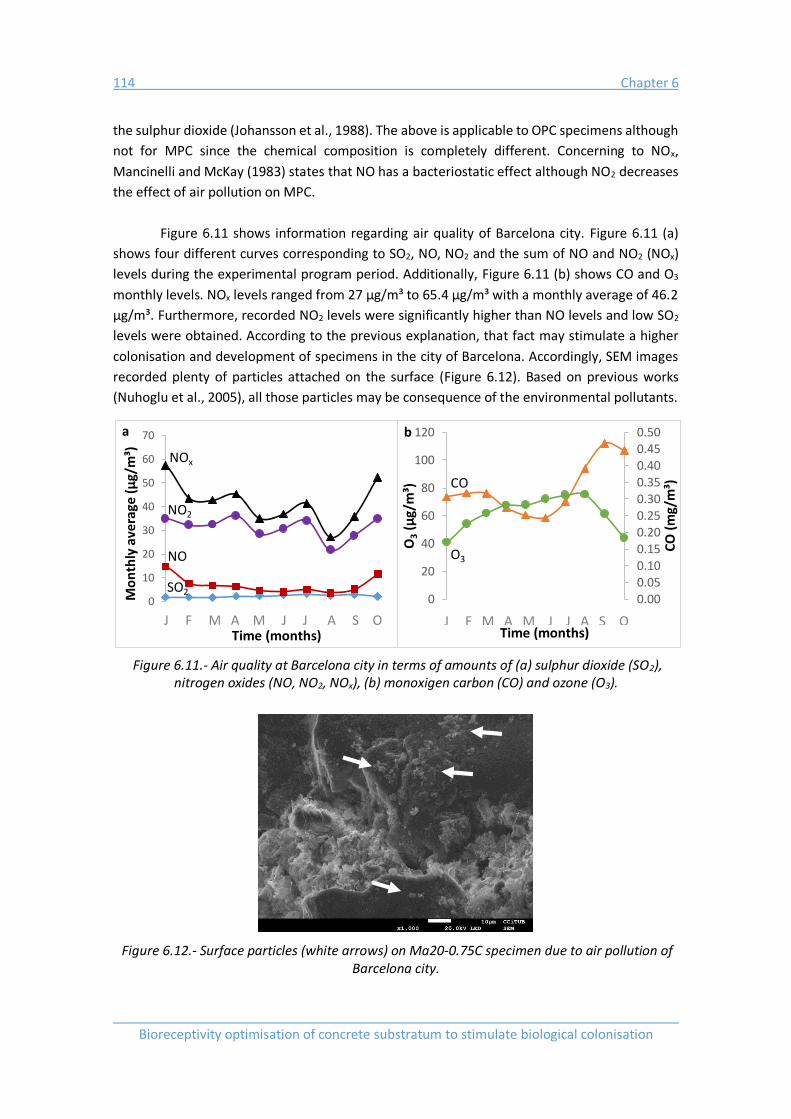
114 Chapter 6
Bioreceptivity optimisation of concrete substratum to stimulate biological colonisation
the sulphur dioxide (Johansson et al., 1988). The above is applicable to OPC specimens although
not for MPC since the chemical composition is completely different. Concerning to NOx,
Mancinelli and McKay (1983) states that NO has a bacteriostatic effect although NO2 decreases
the effect of air pollution on MPC.
Figure 6.11 shows information regarding air quality of Barcelona city. Figure 6.11 (a)
shows four different curves corresponding to SO2, NO, NO2 and the sum of NO and NO2 (NOx)
levels during the experimental program period. Additionally, Figure 6.11 (b) shows CO and O3
monthly levels. NOx levels ranged from 27 µg/m³ to 65.4 µg/m³ with a monthly average of 46.2
µg/m³. Furthermore, recorded NO2 levels were significantly higher than NO levels and low SO2
levels were obtained. According to the previous explanation, that fact may stimulate a higher
colonisation and development of specimens in the city of Barcelona. Accordingly, SEM images
recorded plenty of particles attached on the surface (Figure 6.12). Based on previous works
(Nuhoglu et al., 2005), all those particles may be consequence of the environmental pollutants.
Figure 6.11.- Air quality at Barcelona city in terms of amounts of (a) sulphur dioxide (SO2), nitrogen oxides (NO, NO2, NOx), (b) monoxigen carbon (CO) and ozone (O3).
Figure 6.12.- Surface particles (white arrows) on Ma20-0.75C specimen due to air pollution of Barcelona city.
0
10
20
30
40
50
60
70
Mo
nth
ly a
vera
ge (
µg/
m³)
Time (months)
SO2
NO
NO2
NOx
J F M A M J J A S O
0
20
40
60
80
100
120
0.000.050.100.150.200.250.300.350.400.450.50
O3
(µg/
m³)
Time (months)
CO
(m
g/m
³)CO
O3
J F M A M J J A S O
a b
Analysis of natural colonisation 115
Sandra Manso Blanco
CO levels are expressed in mg/m³ and the values obtained ranged from 0.2 to 0.5 mg/m³
obtaining the highest value in September. Regarding ozone levels, values ranged from 33.4 to
75.3 µg/m³, recording the highest level in August.
6.3.2. Natural Park of Montseny
Predominant microorganisms
Same species of bacteria were found as in the city of Barcelona with the exception of
Flavobacterium, a genus that was not found in Montseny. Regarding fungi, less environmental
biodiversity was observed for the punctual environmental sampling comparing the genera
identified from the environment of Barcelona city and the natural park in Montseny. Moreover,
the genus Epicoccum, which was only found on PA30-1C specimens, was identified from the
environmental sample of Montseny.
Table 6.5 shows the results obtained for the specimens placed horizontally in the natural
park of Montseny. For that location, less colonisation was expected since bacterial presence is
lower in rural areas than in cities. Concentration of aerobacteria in forests is estimated between
385 and 1200 CFUs/m³, while for urban areas the values are between 540 and 7200 CFUs/m³
(Jones and Cookson, 1983; Laine et al., 1999).
The only genus for both bacteria and fungi not found on Barcelona city specimens was
the yeast Saccharomyces (Fungi, Ascomycota, Saccharomycotina, Saccharomycetes,
Saccharomycetidae, Saccharomycetales, Saccharomycetaceae), which was only isolated from
specimens PA30-1C. First, less colony forming units were quantified from the specimens in
Montseny with the exception of the dosage Pa60-1.75C, which recorded also the highest CFUs
of fungi.
Regarding bacterial results, genus Bacillus and Kocuria appeared as the most ubiquitous
since they are present on almost all specimens. In the current case, genus Aerococcus is less
representative since it was just identified from two different dosages.
Concerning to fungi, lower CFUs were counted and similar results in terms of variability
and number of genera were obtained. Comparing those results with the ones obtained for
specimens placed in Barcelona city, three different genera were not found on horizontal
specimens nor on vertical ones. Those genera were Saccharomyces, which was only found on
PA30-1C specimens, and Penicillium and Fusarium, which were only found on MPC specimens.
Moreover, no organism of the genus Gilmaniella was identified. According to results obtained
for Barcelona specimens, the genus Epicoccum was only found on OPC specimens. The above
may be consequence of their higher affinity for alkaline substrates (Schol-Schwarz, 1959).
Results from specimens placed vertically in Montseny are presented in Table 6.6.
According to previous results, CFUs found for both bacteria and fungi were less on vertical
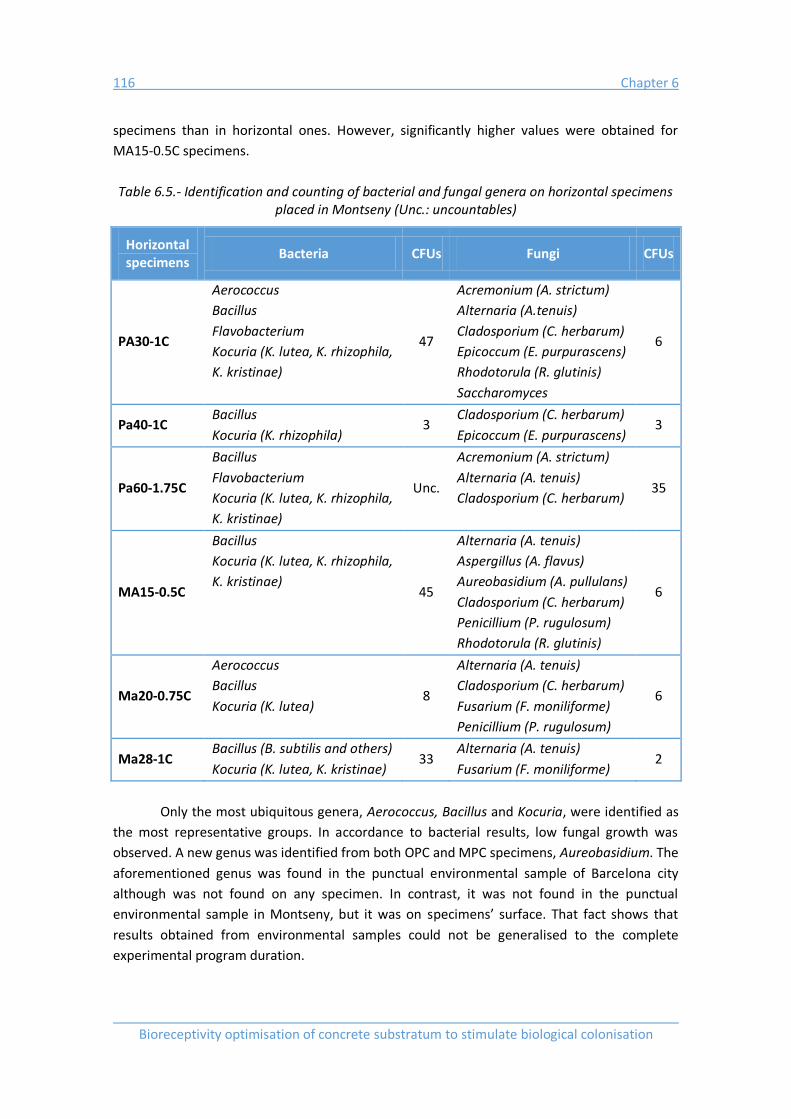
116 Chapter 6
Bioreceptivity optimisation of concrete substratum to stimulate biological colonisation
specimens than in horizontal ones. However, significantly higher values were obtained for
MA15-0.5C specimens.
Table 6.5.- Identification and counting of bacterial and fungal genera on horizontal specimens placed in Montseny (Unc.: uncountables)
Horizontal specimens
Bacteria CFUs Fungi CFUs
PA30-1C
Aerococcus
Bacillus
Flavobacterium
Kocuria (K. lutea, K. rhizophila,
K. kristinae)
47
Acremonium (A. strictum)
Alternaria (A.tenuis)
Cladosporium (C. herbarum)
Epicoccum (E. purpurascens)
Rhodotorula (R. glutinis)
Saccharomyces
6
Pa40-1C Bacillus
Kocuria (K. rhizophila) 3
Cladosporium (C. herbarum)
Epicoccum (E. purpurascens) 3
Pa60-1.75C
Bacillus
Flavobacterium
Kocuria (K. lutea, K. rhizophila,
K. kristinae)
Unc.
Acremonium (A. strictum)
Alternaria (A. tenuis)
Cladosporium (C. herbarum)
35
MA15-0.5C
Bacillus
Kocuria (K. lutea, K. rhizophila,
K. kristinae) 45
Alternaria (A. tenuis)
Aspergillus (A. flavus)
Aureobasidium (A. pullulans)
Cladosporium (C. herbarum)
Penicillium (P. rugulosum)
Rhodotorula (R. glutinis)
6
Ma20-0.75C
Aerococcus
Bacillus
Kocuria (K. lutea) 8
Alternaria (A. tenuis)
Cladosporium (C. herbarum)
Fusarium (F. moniliforme)
Penicillium (P. rugulosum)
6
Ma28-1C Bacillus (B. subtilis and others)
Kocuria (K. lutea, K. kristinae) 33
Alternaria (A. tenuis)
Fusarium (F. moniliforme) 2
Only the most ubiquitous genera, Aerococcus, Bacillus and Kocuria, were identified as
the most representative groups. In accordance to bacterial results, low fungal growth was
observed. A new genus was identified from both OPC and MPC specimens, Aureobasidium. The
aforementioned genus was found in the punctual environmental sample of Barcelona city
although was not found on any specimen. In contrast, it was not found in the punctual
environmental sample in Montseny, but it was on specimens’ surface. That fact shows that
results obtained from environmental samples could not be generalised to the complete
experimental program duration.

Analysis of natural colonisation 117
Sandra Manso Blanco
In general, just a CFU per genus and plate was found with exception of MA15-0.5C
specimens. Table 6.4 showed no fungal growth on MA15-0.5C specimens which significantly
differ from those results. A more intensive experimental work in terms of colonisation evolution
for both specimens’ surface and environment as well as more replicates would be necessary in
order to justify those results.
Table 6.6.- Identification and counting of bacterial and fungal genera on vertical specimens placed in Montseny
Vertical specimens
Bacteria CFUs Fungi CFUs
PA30-1C
Aerococcus
Bacillus (B. subtilis) 2
Acremonium (A. strictum)
Cladosporium (C. herbarum)
Rhodotorula (R. glutinis)
3
Pa40-1C Bacillus
Kocuria (K. rhizophila) 3
Aureobasidium (A. pullulans)
Fusarium (F. miniliforme) 2
Pa60-1.75C
Aerococcus
Bacillus (B. subtilis)
Kocuria (K. lutea, K.
rhizophila, K. kristinae)
5
Alternaria (A. tenuis)
Aureobasidium (A. pullulans)
Cladosporium (C. herbarum)
Phoma (P. herbarum)
4
MA15-0.5C
Aerococcus
Bacillus
Kocuria (K. rhizophila)
30
Aureobasidium (A. pullulans)
Cladosporium (C. herbarum)
Phoma (P. herbarum)
30
Ma20-0.75C Bacillus (B. subtilis)
1 Alternaria (A. tenuis)
Fusarium (F. moniliforme) 2
Ma28-1C Aerococcus
3 Aureobasidium (A. pullulans)
Cladosporium (C. herbarum) 2
Regarding SEM analysis, pollen grains of different species were found on specimens
placed in the Natural Park of Montseny. Pollen from three different species were identified as
can be seen in Figure 6.13. Grains of pollen shown in Figure 6.13 (a) were not easily identified
due to the high level of collapse. However, according to the flora present in the natural park of
Montseny and the morphology and size observed in the photograph, it may belong to a plant of
the genus Papaver. The grain on the left may correspond to a polar view while the one on the
right may match with an equatorial view, in which the exine is divided in three lobes. Pollen
grains are relatively small, with sizes ranging from 15 µm to 35 µm, tricolpate, isopolar and
radiosymmetrical (Trigo et al., 2008).
Grain 1 in the Figure 6.13 (b) might belong to the genus Cedrus, whose pollen grains are
big (ranging from 37 to 52 µm), heteropolar, bisymmetrical with a rough surface (Trigo et al.,
2008). Finally, grains labelled as 2 in Figure 6.13 (b) may belong to the genus Lactuceae due to
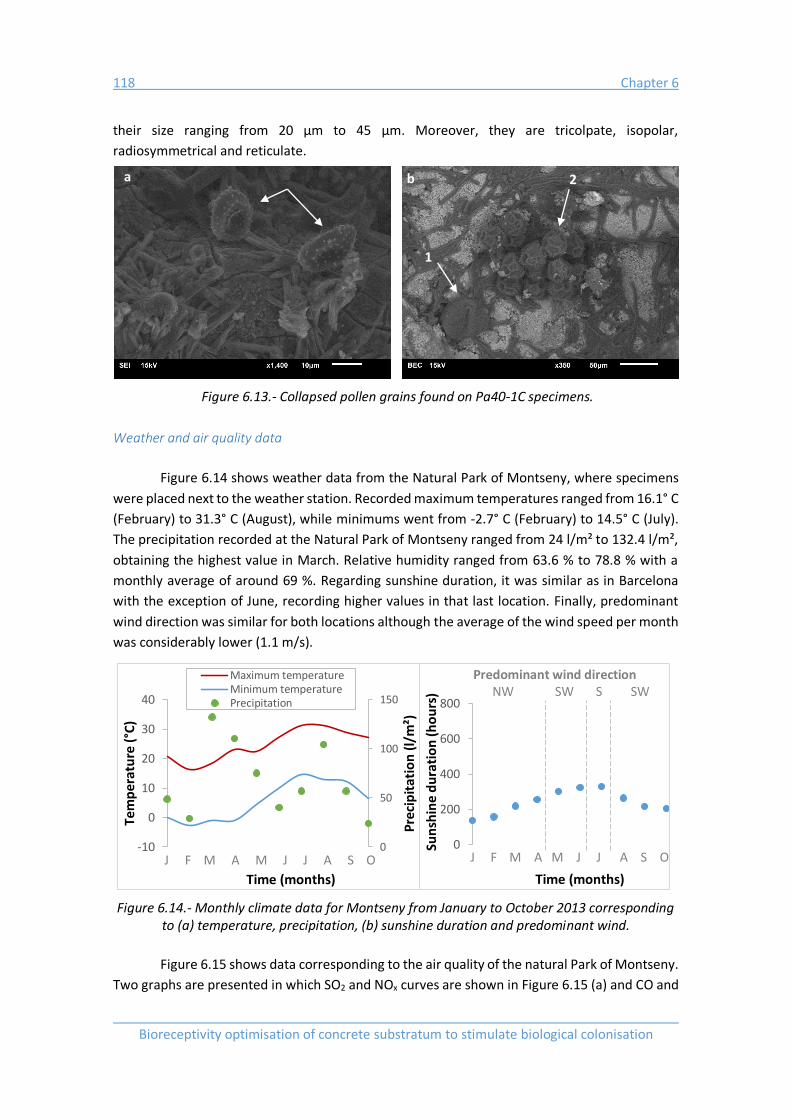
118 Chapter 6
Bioreceptivity optimisation of concrete substratum to stimulate biological colonisation
their size ranging from 20 µm to 45 µm. Moreover, they are tricolpate, isopolar,
radiosymmetrical and reticulate.
Figure 6.13.- Collapsed pollen grains found on Pa40-1C specimens.
Weather and air quality data
Figure 6.14 shows weather data from the Natural Park of Montseny, where specimens
were placed next to the weather station. Recorded maximum temperatures ranged from 16.1° C
(February) to 31.3° C (August), while minimums went from -2.7° C (February) to 14.5° C (July).
The precipitation recorded at the Natural Park of Montseny ranged from 24 l/m² to 132.4 l/m²,
obtaining the highest value in March. Relative humidity ranged from 63.6 % to 78.8 % with a
monthly average of around 69 %. Regarding sunshine duration, it was similar as in Barcelona
with the exception of June, recording higher values in that last location. Finally, predominant
wind direction was similar for both locations although the average of the wind speed per month
was considerably lower (1.1 m/s).
Figure 6.14.- Monthly climate data for Montseny from January to October 2013 corresponding to (a) temperature, precipitation, (b) sunshine duration and predominant wind.
Figure 6.15 shows data corresponding to the air quality of the natural Park of Montseny.
Two graphs are presented in which SO2 and NOx curves are shown in Figure 6.15 (a) and CO and
0
200
400
600
800
Sun
shin
e d
ura
tio
n (h
ou
rs)
Time (months)
J F M A M J J A S O
Predominant wind direction NW SW S SW
0
50
100
150
-10
0
10
20
30
40
Pre
cip
itat
ion
(l/
m²)
Tem
per
atu
re (
°C)
Time (months)
Maximum temperatureMinimum temperaturePrecipitation
J F M A M J J A S O
a b
1
2
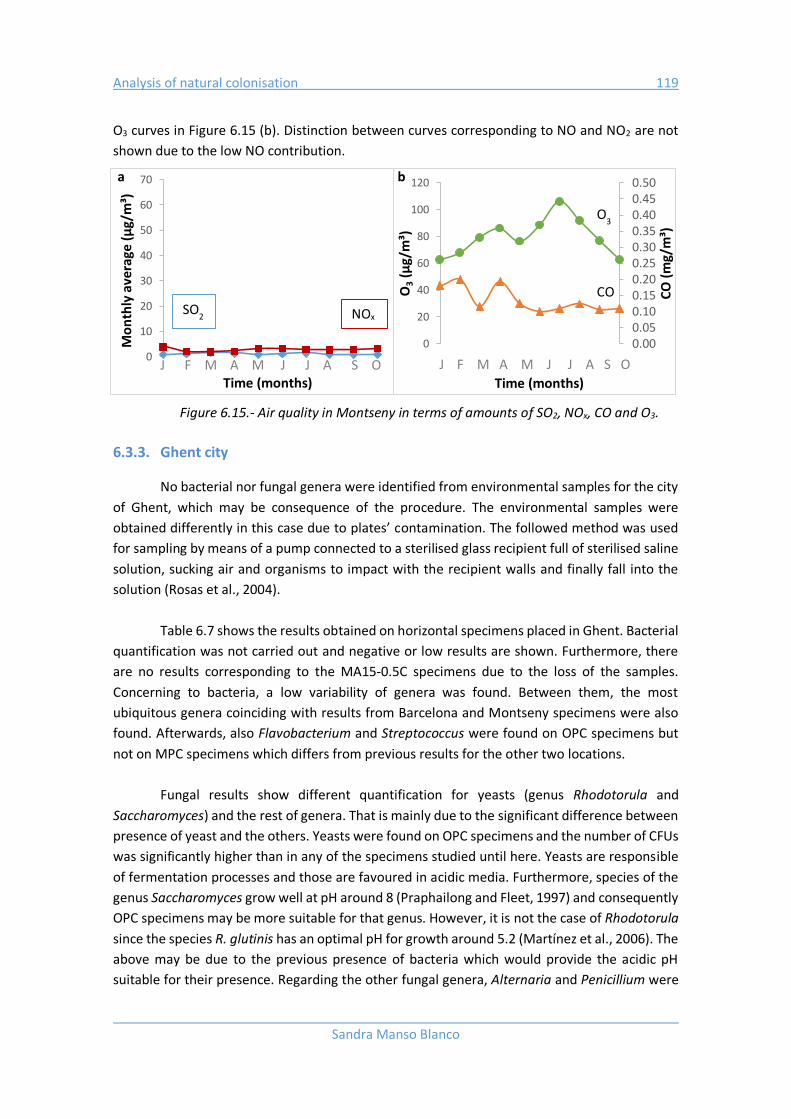
Analysis of natural colonisation 119
Sandra Manso Blanco
O3 curves in Figure 6.15 (b). Distinction between curves corresponding to NO and NO2 are not
shown due to the low NO contribution.
Figure 6.15.- Air quality in Montseny in terms of amounts of SO2, NOx, CO and O3.
6.3.3. Ghent city
No bacterial nor fungal genera were identified from environmental samples for the city
of Ghent, which may be consequence of the procedure. The environmental samples were
obtained differently in this case due to plates’ contamination. The followed method was used
for sampling by means of a pump connected to a sterilised glass recipient full of sterilised saline
solution, sucking air and organisms to impact with the recipient walls and finally fall into the
solution (Rosas et al., 2004).
Table 6.7 shows the results obtained on horizontal specimens placed in Ghent. Bacterial
quantification was not carried out and negative or low results are shown. Furthermore, there
are no results corresponding to the MA15-0.5C specimens due to the loss of the samples.
Concerning to bacteria, a low variability of genera was found. Between them, the most
ubiquitous genera coinciding with results from Barcelona and Montseny specimens were also
found. Afterwards, also Flavobacterium and Streptococcus were found on OPC specimens but
not on MPC specimens which differs from previous results for the other two locations.
Fungal results show different quantification for yeasts (genus Rhodotorula and
Saccharomyces) and the rest of genera. That is mainly due to the significant difference between
presence of yeast and the others. Yeasts were found on OPC specimens and the number of CFUs
was significantly higher than in any of the specimens studied until here. Yeasts are responsible
of fermentation processes and those are favoured in acidic media. Furthermore, species of the
genus Saccharomyces grow well at pH around 8 (Praphailong and Fleet, 1997) and consequently
OPC specimens may be more suitable for that genus. However, it is not the case of Rhodotorula
since the species R. glutinis has an optimal pH for growth around 5.2 (Martínez et al., 2006). The
above may be due to the previous presence of bacteria which would provide the acidic pH
suitable for their presence. Regarding the other fungal genera, Alternaria and Penicillium were
0
10
20
30
40
50
60
70
Mo
nth
ly a
vera
ge (
µg/
m³)
Time (months)
NOx SO2
J F M A M J J A S O
0.000.050.100.150.200.250.300.350.400.450.50
0
20
40
60
80
100
120
CO
(m
g/m
³)
O3
(µg/
m³)
Time (months)
J F M A M J J A S O
CO
O3
a b
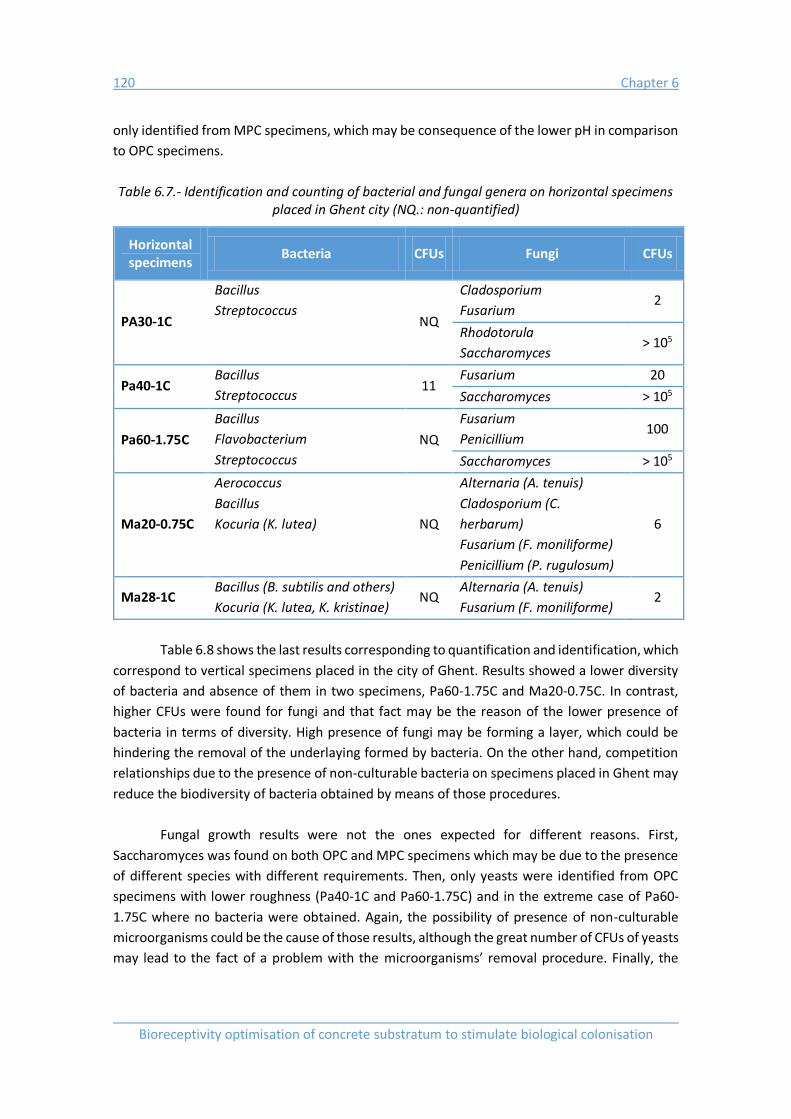
120 Chapter 6
Bioreceptivity optimisation of concrete substratum to stimulate biological colonisation
only identified from MPC specimens, which may be consequence of the lower pH in comparison
to OPC specimens.
Table 6.7.- Identification and counting of bacterial and fungal genera on horizontal specimens placed in Ghent city (NQ.: non-quantified)
Horizontal specimens
Bacteria CFUs Fungi CFUs
PA30-1C
Bacillus
Streptococcus NQ
Cladosporium
Fusarium 2
Rhodotorula
Saccharomyces > 105
Pa40-1C Bacillus
Streptococcus 11
Fusarium 20
Saccharomyces > 105
Pa60-1.75C
Bacillus
Flavobacterium
Streptococcus
NQ
Fusarium
Penicillium 100
Saccharomyces > 105
Ma20-0.75C
Aerococcus
Bacillus
Kocuria (K. lutea) NQ
Alternaria (A. tenuis)
Cladosporium (C.
herbarum)
Fusarium (F. moniliforme)
Penicillium (P. rugulosum)
6
Ma28-1C Bacillus (B. subtilis and others)
Kocuria (K. lutea, K. kristinae) NQ
Alternaria (A. tenuis)
Fusarium (F. moniliforme) 2
Table 6.8 shows the last results corresponding to quantification and identification, which
correspond to vertical specimens placed in the city of Ghent. Results showed a lower diversity
of bacteria and absence of them in two specimens, Pa60-1.75C and Ma20-0.75C. In contrast,
higher CFUs were found for fungi and that fact may be the reason of the lower presence of
bacteria in terms of diversity. High presence of fungi may be forming a layer, which could be
hindering the removal of the underlaying formed by bacteria. On the other hand, competition
relationships due to the presence of non-culturable bacteria on specimens placed in Ghent may
reduce the biodiversity of bacteria obtained by means of those procedures.
Fungal growth results were not the ones expected for different reasons. First,
Saccharomyces was found on both OPC and MPC specimens which may be due to the presence
of different species with different requirements. Then, only yeasts were identified from OPC
specimens with lower roughness (Pa40-1C and Pa60-1.75C) and in the extreme case of Pa60-
1.75C where no bacteria were obtained. Again, the possibility of presence of non-culturable
microorganisms could be the cause of those results, although the great number of CFUs of yeasts
may lead to the fact of a problem with the microorganisms’ removal procedure. Finally, the
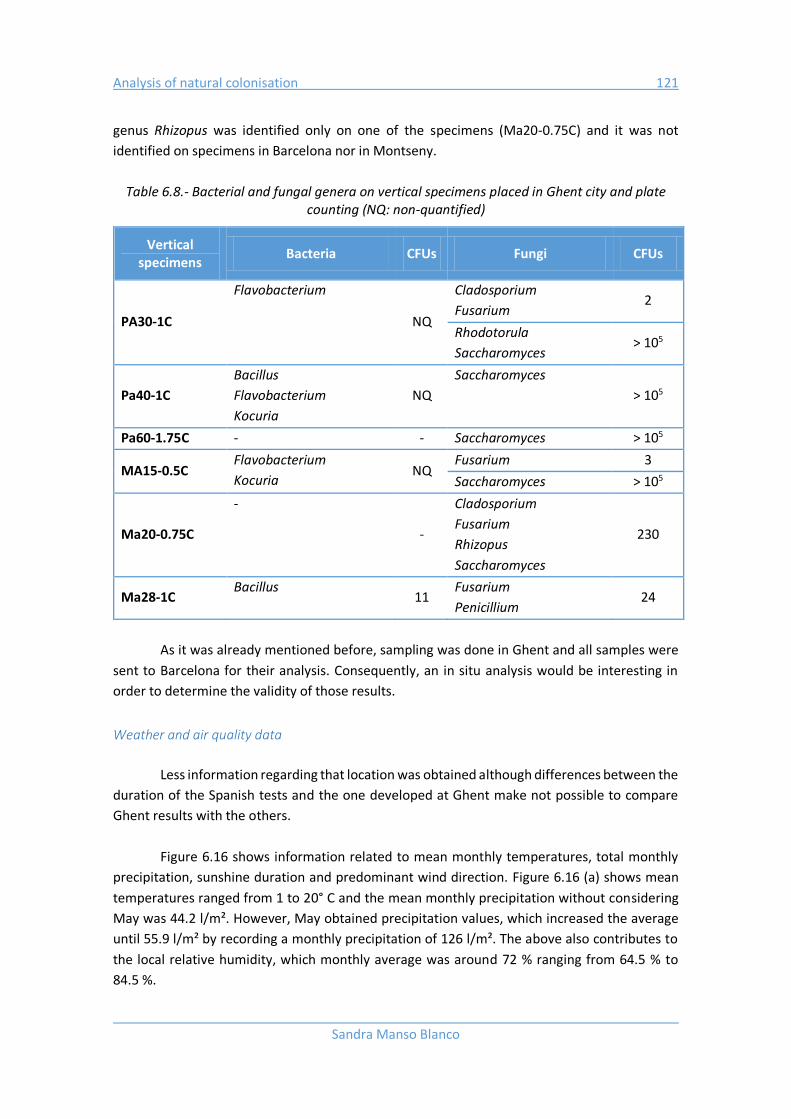
Analysis of natural colonisation 121
Sandra Manso Blanco
genus Rhizopus was identified only on one of the specimens (Ma20-0.75C) and it was not
identified on specimens in Barcelona nor in Montseny.
Table 6.8.- Bacterial and fungal genera on vertical specimens placed in Ghent city and plate counting (NQ: non-quantified)
Vertical specimens
Bacteria CFUs Fungi CFUs
PA30-1C
Flavobacterium
NQ
Cladosporium
Fusarium 2
Rhodotorula
Saccharomyces > 105
Pa40-1C
Bacillus
Flavobacterium
Kocuria
NQ
Saccharomyces
> 105
Pa60-1.75C - - Saccharomyces > 105
MA15-0.5C Flavobacterium
Kocuria NQ
Fusarium 3
Saccharomyces > 105
Ma20-0.75C
-
-
Cladosporium
Fusarium
Rhizopus
Saccharomyces
230
Ma28-1C Bacillus
11 Fusarium
Penicillium 24
As it was already mentioned before, sampling was done in Ghent and all samples were
sent to Barcelona for their analysis. Consequently, an in situ analysis would be interesting in
order to determine the validity of those results.
Weather and air quality data
Less information regarding that location was obtained although differences between the
duration of the Spanish tests and the one developed at Ghent make not possible to compare
Ghent results with the others.
Figure 6.16 shows information related to mean monthly temperatures, total monthly
precipitation, sunshine duration and predominant wind direction. Figure 6.16 (a) shows mean
temperatures ranged from 1 to 20° C and the mean monthly precipitation without considering
May was 44.2 l/m². However, May obtained precipitation values, which increased the average
until 55.9 l/m² by recording a monthly precipitation of 126 l/m². The above also contributes to
the local relative humidity, which monthly average was around 72 % ranging from 64.5 % to
84.5 %.
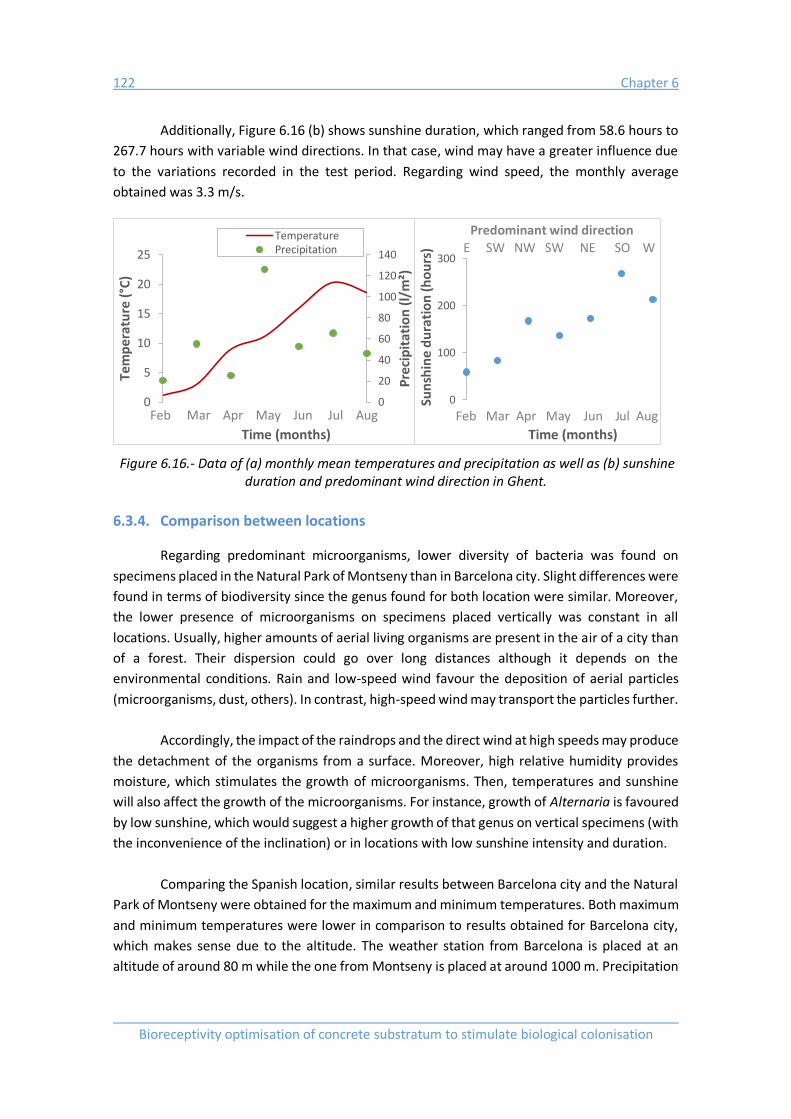
122 Chapter 6
Bioreceptivity optimisation of concrete substratum to stimulate biological colonisation
Additionally, Figure 6.16 (b) shows sunshine duration, which ranged from 58.6 hours to
267.7 hours with variable wind directions. In that case, wind may have a greater influence due
to the variations recorded in the test period. Regarding wind speed, the monthly average
obtained was 3.3 m/s.
Figure 6.16.- Data of (a) monthly mean temperatures and precipitation as well as (b) sunshine duration and predominant wind direction in Ghent.
6.3.4. Comparison between locations
Regarding predominant microorganisms, lower diversity of bacteria was found on
specimens placed in the Natural Park of Montseny than in Barcelona city. Slight differences were
found in terms of biodiversity since the genus found for both location were similar. Moreover,
the lower presence of microorganisms on specimens placed vertically was constant in all
locations. Usually, higher amounts of aerial living organisms are present in the air of a city than
of a forest. Their dispersion could go over long distances although it depends on the
environmental conditions. Rain and low-speed wind favour the deposition of aerial particles
(microorganisms, dust, others). In contrast, high-speed wind may transport the particles further.
Accordingly, the impact of the raindrops and the direct wind at high speeds may produce
the detachment of the organisms from a surface. Moreover, high relative humidity provides
moisture, which stimulates the growth of microorganisms. Then, temperatures and sunshine
will also affect the growth of the microorganisms. For instance, growth of Alternaria is favoured
by low sunshine, which would suggest a higher growth of that genus on vertical specimens (with
the inconvenience of the inclination) or in locations with low sunshine intensity and duration.
Comparing the Spanish location, similar results between Barcelona city and the Natural
Park of Montseny were obtained for the maximum and minimum temperatures. Both maximum
and minimum temperatures were lower in comparison to results obtained for Barcelona city,
which makes sense due to the altitude. The weather station from Barcelona is placed at an
altitude of around 80 m while the one from Montseny is placed at around 1000 m. Precipitation
0
20
40
60
80
100
120
140
0
5
10
15
20
25
Pre
cip
itat
ion
(l/
m²)
Tem
per
atu
re (
°C)
Time (months)
TemperaturePrecipitation
Feb Mar Apr May Jun Jul Aug 0
100
200
300
Sun
shin
e d
ura
tio
n (
ho
urs
)Time (months)
Feb Mar Apr May Jun Jul Aug
Predominant wind direction E SW NW SW NE SO W

Analysis of natural colonisation 123
Sandra Manso Blanco
was generally higher at the Natural Park of Montseny, recording a monthly average of around
68 l/m² while in Barcelona it was around 43 l/m².
In summary, the mean temperature, sunshine duration and wind speed were higher in
Barcelona city for the presented period. In contrast, relative humidity as well as precipitation
was lower. Consequently, environmental conditions from 2013 made it difficult to state which
of both locations was more suitable in terms of colonisation. On one hand, rain favours the
deposition of the aerial microorganisms but it also leads to their detachment from the surfaces
due to the raindrops impact. Therefore, more data regarding rain, such as speed or the impact
force, would be necessary in order to determine the weight of both effects. The wind direction
parameter has significance for the specimens placed vertically. However, it was similar for both
locations and favourable since low direct incidence was recorded.
Regarding air quality, NOx and SO2 levels in Montseny were significantly lower than the
levels obtained in Barcelona city, especially results obtained for NOx concentrations. In addition,
recorded CO levels were quite similar although O3 levels were higher in Montseny in terms of
monthly average. The above makes sense since the environment of Montseny is less
contaminated than the one of Barcelona city.
6.4. CONCLUSIONS
The current chapter is a first approach to the analysis of the natural colonisation of the
produced materials by pioneer organisms. A combination of the identification of the
predominant genus, their quantification in terms of UFCs, the analysis of the weather conditions
and the air quality of three different locations has been carried out although not all parameters
were obtained for the Ghent city location.
Genus diversity of bacterial growth was similar for all three locations. Quantitative
results of Barcelona city and Montseny reveal higher bacterial colonisation in urban areas than
in natural ones, which corresponds to previous hypothesis. Quantitative comparison with
specimens placed in Ghent was not carried out due to the different time of the tests between
locations.
Regarding fungi, similar genus diversity was obtained between Barcelona city and
Montseny in which low presence of yeasts was recorded. However, results obtained for the
Ghent location show a predominant presence of yeasts, mainly from the genus Saccharomyces
and in high amounts. Comparison between both Spanish locations reveal the highest
colonisation in urban areas due to a major presence of aerial microorganisms. Furthermore, it is
difficult to establish differences between different dosages and it would be necessary to carry
out a more extensive experimental program in this sense.
Weather data as well as parameters related to air quality also contributes to the fact
that urban areas may be more suitable for the colonisation of the selected materials by pioneer
124 Chapter 6
Bioreceptivity optimisation of concrete substratum to stimulate biological colonisation
microorganisms. The above might contribute to evolution of the colonisation allowing the
emergence of other groups of living organisms.
Conclusions and future perspectives 125
Sandra Manso Blanco
7. CONCLUSIONS AND FUTURE
PERSPECTIVES
7.1. INTRODUCTION
The work here presented provides information regarding the possibility of using a
cementitious material as biological substratum. In that sense, the investigation resulted in an
international patent concerning an application for construction of multi-layered panels
(PCT/ES2013/070438). The invention relates to a cement-based multilayer assembly that can be
used as a biological support for building facades or other structures. The structure of the panel
comprises a first layer, which consists of conventional concrete and it is responsible for the
structural function of the panel. Moreover, production of this layer would depend on project
requirements. Subsequently, there is a second layer with the main function of protecting the
first one. This layer would have a waterproofing capability and could also improve adhesion
between first and third layer. Then, the third layer is the one with an enlarged bioreceptivity and
the one related to the current study. Furthermore, thanks to this improvement of bioreceptivity,
rain water retention as well as stimulation of colonisation by living organisms will be achieved.
Finally, the last layer would be a discontinuous one in order to allow different designs of the
surface. Areas without this layer would allow organisms to colonise the surface and the retained
water will maintain local humidity. Exit of water is then redirected to these holes promoting
better local conditions for colonising organisms.
The structure of the current chapter corresponds to the conclusions obtained from the
current work as well as the suggestions and future research lines. Therefore, the main
conclusions obtained in this doctoral thesis are presented in the current chapter and they are
126 Chapter 7
Bioreceptivity optimisation of concrete substratum to stimulate biological colonisation
divided in general and specific conclusions. General conclusions (section 7.2) correspond to the
main objectives presented in Chapter 1. Then, section 7.3 refers to the specific conclusions,
linked with the specific objectives also presented in Chapter 1. Finally, in some suggestions for
future research are presented in section 7.4.
7.2. GENERAL CONCLUSIONS
The interest of integrating nature into the cities in construction envelopes is not recent,
and technology has experienced great advances in the last years. However, several aspects still
require further research. For that reason a rather generalist thesis was outlined to obtain a first
approach of a complete different perspective, which answers to the general objective: provide
a possibility of using a structure surface as biological substratum.
Results showed that the proposed approach of developing structures allowing biological
growth in their surface is possible. The above suggests this could be considered as a novel
solution for the industry to improve aspects such as costs, integration and maintenance.
Regarding the main objective, the work was focused on two main issues: modification of the
chemical as well as physical properties of the cementitious materials to be used as biological
growth substratum, and the evaluation of the suitability of the materials for colonisation by
living organisms under both laboratory and environmental conditions. This section presents the
general conclusions obtained for each one of them in response to the general objectives defined
in Chapter 1 as follows:
Regarding the first main issue, it was demonstrated that both chemical and physical
properties of a cementitious material can be modified in a controlled manner.
Considerations given in the literature regarding the more influencing parameters for
biological colonisation (porosity, roughness and pH) were taken into account and were
considered as priorities. Consequently, a wide variety of materials bioreceptivities were
characterised and six mix designs were selected.
Concerning the second main issue, positive results were obtained for the colonisation
evaluation. Significant differences were recorded for different mix designs under
laboratory conditions and interesting results were also obtained under environmental
conditions.
To sum up, the current thesis demonstrates the possibility of using stone materials as a
biological substratum by means of modification of their bioreceptivity, which was the main
objective of this work. However, further research is required due to the innovative nature of the
proposed solution as is presented below.
Conclusions and future perspectives 127
Sandra Manso Blanco
7.3. SPECIFIC CONCLUSIONS
In view of the specific objectives, for each one of the subjects studied in this thesis,
several results and improvements were detailed in previous chapters. The most relevant
conclusions are described below divided into the two main issues: the modification of the
cementitious material and the evaluation of the colonisation.
7.3.1. Cementitious material
A slight decrease of the pH of Ordinary Portland Cement mortars was obtained when
adding boric acid to the mixtures, which was far from the neutrality. Concentrations
lower than 2 % over cement weight slowed down the setting and also affected the
flexural and compressive strengths, which were significantly reduced. Moreover, higher
concentrations stopped the hydration process. Consequently, the use of boric acid
additions to decrease the pH of OPC mortars was discarded. No effect of the addition of
oxalic acid in the mixtures was recorded for acid concentrations from 0 to 13 % over
cement weight. In consequence, its use was also discarded.
Different Magnesium Phosphate Cement mixtures, in terms of cement composition,
provide an acceptable range of pH within 5.8 and 7. Characterisation of all different
formulations provided acceptable physic-chemical properties as well as flexural and
compressive strengths results for their use as mortar. Regarding the benefits of using
MPC, lower water consumption was recorded due to the remarkable lower water
demand when comparing that hydraulic binder and Ordinary Portland Cement.
Additionally, no presence of dangerous compounds for human health (during
production) or structural durability was observed. However, results suggest that the
current mixes should be preferably used for non-structural elements.
Lower NH4H2PO4:MgO ratios (P:M ratios) are more interesting due to better physico-
mechanical properties as well as from an economic point of view. After the
characterization, the P:M ratio of 1:2 with 6 % borax addition was discarded since results
between that formulation and P:M ratios of 1:1.75 with 6 % borax addition were quite
similar and a better workability was observed for P:M ratios of 1:1.75. Consequently, the
P:M ratio 1:1.75 with a 6 % borax addition was selected.
An objective-oriented design was used to obtain different roughness and porosity.
Variations of the type of cement, the granular skeleton, the water to cement ratio and
the amount of cement paste were combined in order to produce different materials’
bioreceptivities. The methodology used for the selection of the cement paste amounts
was based on the estimation of the minimum amount of cement paste required for
joining all the aggregates and obtaining the highest macroporosity. That methodology
worked perfectly for OPC mortars although it was not appropriate for MPC mortars
probably due to the fluidizer effect of the compound used as a retarder, borax.
128 Chapter 7
Bioreceptivity optimisation of concrete substratum to stimulate biological colonisation
Control of the aforementioned parameters was easier for OPC mortars, which may be
connected to the drawbacks of the dosage method for MPC mortars. Significant
differences were obtained regarding pore diameter distribution between OPC and MPC
mortars. OPC samples showed a more continuous pore size distribution while MPC
presented extremely low percentages of pores with diameter lower than 50 nm. The
above indicates different water absorption as well as water retention patterns for the
different dosages, which may also indicate different colonisation patterns between
them.
7.3.2. Biological growth
MPC specimens showed a higher bioreceptivity for pioneer colonisers such as Chlorella
vulgaris than OPC specimens under laboratory conditions. Carbonated OPC specimens
did not obtained complete biofouling up to 20 weeks of accelerated testing, while some
MPC specimens were totally covered after 4 weeks. However, no visible colonisation was
observed on specimens exposed to the ambient environment for any of the three
selected locations (Barcelona city, Natural Park of Montseny and Ghent city) although
specimens placed in Ghent were exposed for a shorter period. Genera diversity of
bacterial growth between the three locations did not show significant differences.
However, the most significant difference on fungal growth diversity was obtained for the
location of Ghent, were a predominant presence of yeasts was recorded.
The methodologies of evaluation of biofouling used in this work were adapted from
previous studies regarding the biodeterioration of stone materials. In consequence,
those methodologies are suitable for the initial stages of biofouling but no information
for later stages was obtained from literature. The fouling intensity parameter was useful
for the analyses until complete coverage of the specimens’ surface. It appeared to
become useless after that event, due to the drop in lightness (L*). The influence of the
aforementioned problem was also evident for the estimation of the covered area.
Moreover, the use of the PAM fluorometry for biomass quantification by measuring the
chlorophyll fluorescence was useful and can be used until a biomass of 20 mg/cm².
However, the use of the above-mentioned technique under environmental conditions
should be considered cautiously. The above is due to the fact that the factor F0 (minimum
fluorescence intensity under dark conditions) does not only increases when biomass
increase but also when the organisms are subjected to hydric stress.
Considering results obtained under laboratory conditions, Ma28-1C specimens appeared
to be the most bioreceptive MPC composition for the algae since they were completely
biofouled in the shortest time (4 weeks) and with the highest homogeneity. However,
MA15-0.5C may obtain better results for longer times under environmental conditions
since those high homogeneous configurations could lead to durability problems
regarding the biological growth. The above is due to the fact that biomass would increase
until a certain point in which the detachment of the organisms may occur as in nature.

Conclusions and future perspectives 129
Sandra Manso Blanco
Regarding the results from environmental specimens, no significant differences were
obtained when comparing specimens with different mix designs and a more
comprehensive experimental program should be carried out.
The influence of the inclination on the colonisation was verified, in which horizontal
surfaces are easily colonised than vertical ones. Furthermore, greater colonisation of
specimens placed in Barcelona city than for the Natural Park Montseny was obtained.
Weather and other parameters related to air quality contributed to the fact that urban
areas may be more suitable for the colonisation of the selected materials by pioneer
microorganisms. Consequently, the above may contribute to the emergence of other
groups of living organisms.
Results obtained for the specimens tested under environmental conditions show the
necessity of the application of extra treatments in order to accelerate the colonisation
process. Specimens from the Spanish locations did not show any visible growth up to 1
year of exposition, which suggests the necessity of an extra actuation for a further
acceleration. Results for the same period of time were not yet obtained for the Belgian
location and consequently, it is not possible to establish whether additional measures
are necessary.
7.4. FUTURE PERSPECTIVES
In spite of the advances described in the previous section, there still exists a lot of space
for further studies considering the low availability of previous works on this topic and the
innovative nature of the current one. Those studies may be on the subjects treated in this thesis
and on many other possible subjects related to the possibility of using stone-like construction
materials as a substratum for living organisms. Based on that, this section presents some
suggestions for future researches and experimental campaigns.
Studies regarding the use of different Magnesium Phosphate Cements or their
production from industrial by-products should be carried out in order to reduce costs.
Improvement of water absorption and retention properties of the mortars should be
achieved. In that sense, two different possibilities may be considered: addition of specific
products for the purpose such as watergels or expanded clay, or development of a
coating, which reduces the transpiration of the material avoiding the loss of the stored
water.
The mechanisms for accelerating the natural colonisation of those materials should be
studied. Application of surficial temporary coatings such as culture media or pre-
inoculation of autochthonous organisms as source of organic matter to improve the
establishment of pioneer colonisers are two possible procedures for the aforementioned
purpose. Additionally, the durability of the biological growth should be also studied.
130 Chapter 7
Bioreceptivity optimisation of concrete substratum to stimulate biological colonisation
It is important to extend the experimental program regarding natural colonisation under
environmental conditions in two ways: duration of the specimens’ exposition and
frequency of the tests. A more frequent analysis as well as the use of more advanced
techniques such as genomic biotechnologies may provide extra information for a better
understanding of the colonisation process.
Studies in terms of industrial application should be carried out. The application of those
materials for the purpose of allowing biological growth should not be considered for
structural elements, but they can be used as an extra layer of a structural element. The
above suggests the possibility of using those materials for multi-layered elements, which
may imply further research.
References 131
Sandra Manso Blanco
REFERENCES
Anderson, L.M., Mulligan, B.E., Goodman, L.S., Effects of vegetation on human response to
sound, Journal or Arboriculture, 1984, 10(2).
Ariño, X., Ortega-Calvo, J.J., Gomez-Bolea, A., Saiz-Jimenez, C., Lichen colonisation of the Roman
pavement of Baelo Claudia (Cádiz, Spain): biodeterioration vs bioprotection, Science of the Total
Environment, 1995, 167: 353-363.
ASTM C596-09, Standard Test Method for Drying Shrinkage of Mortar Containing Hydraulic
Cement, ASTM; 2009.
ASTM C642-13, Standard test method for density, absorption and voids in hardened concrete,
ASTM; 2013.
Attwell, K., Urban land resource and urban planting – case studies from Denmark, Landscape
and Urban Planning, 2000, 52: 145-163.
Azmi, O.R. and Seppelt, R.D., Fungi of the Windmill Islands, continental Antarctica. Effect of
temperature, pH and culture media on the growth of selected microfungi, Polar Biology, 1997,
18 (2): 128-134.
Babichenko S., Leeben A., Poryvkina L., Shalapyonok A., Seppällä J., Variability of Chlorella sp.
fluorescence in response to different nitrogen conditions, International Journal of Remote
Sensing, 2001, 22: 403–414.

132 References
Bioreceptivity optimisation of concrete substratum to stimulate biological colonisation
Baldocchi, D.D., Hicks, B.B., Camara, P., A canopy stomatal resistance model for gaseous
deposition to vegetated surfaces, Atmospheric Environment (1967), 1987, 21 (1): 91-101.
Barberousse, H., Lombardo, R.J., Tell, G., Couté, A., Factors involved in the colonisation of
building façades by algae and cyanobacteria in France, Biofouling, 2006, 22: 69-77.
Barberousse H., Ruot B., Yéprémian C., Boulon G., An assessment of façade coatings against
colonisation by aerial algae and cyanobacteria, Building and Environment, 2007, 42: 2555–2561.
Baumann, N., Ground-nesting birds on green roofs in Switzerland: Preliminary observations,
Urban Habitats, 2006, 4: 37-50.
Berrini, M, and Bono, L., Urban Ecosystem Europe Report 2007, Ambiente Italia Research
Institute, 2007.
Berthelin, J., Microbial weathering processes, In: Krumbein, W.E. (Eds.), Microbial Geochemistry.
Blackwell Scientific, Oxford, UK, 1983. pp. 223–262.
Bidwell, R.G.S. and Fraser, D.E., Carbon monoxide uptake and metabolism by leaves, Canadian
Journal of Botany, 1972, 50 (7): 1435-1439.
Bolund, P. and Hunhammar, S., Ecosystem services in urban areas, Ecological Economics, 1999,
29: 293-301.
Böger P., Das Strukturproteid aus Chloroplasten einzelliger Grünalgen und seiner Beziehung zum
Chlorophyll, Flora 1964, 154: 174–211.
Boncukcuoğlu R., Yılmaz M.T., Kocakerimb M.M., Tosunoğlua V., Utilization of borogypsum as
set retarder in Portland cement production, Cement and Concrete Research, 2002, 32 (3): 471-
475.
Bovallius, A., Bucht, B., Roffey, R., Änas, P., Three-year investigation of the natural airborne
bacterial flora at four localities in Sweden, Applied and Evironmental Microbiology, 1978, 35 (5):
847-852.
Cámara, B., de los Ríos, A., García-del-Cura, M.A., Galván, V., Ascaso, C., Dolostone bioreceptivity
to fungal colonisation, Materiales de Construcción, 2008, 58: 113-124.
Chiesura, A., The role of urban parks for the sustainable city, Landscape and Urban Planning,
2004, 68: 129-138.
Cocke D.L., Mollah M., Vempati R.K., Hess T.R., Multitechnique approach to understanding the
microstructure of cement-based systems, Materials Research Society Symposium Proceedings
1995, 370: 279-284.
Cofman, R.R. and Davis, G., Insect and avian fauna presence on the Ford assembly plant ecoroof,
3rd North American Green Roof Conference: Greening rooftops for sustainable communities,
Washington, DC. 4-6 May 2005. Pp. 457-468.
Coutinho, M.L., Miller, A.Z., Gutierrez-Patricio, S., Hernandez-Marine, M., Gomez-Bolea, A.,
Rogerio-Candelera, M.A., Philips, A.J.L., Jurado, V., Saiz-Jimenez, C., Macedo, M.F., Microbial
References 133
Sandra Manso Blanco
communities on deteriorated artistic tiles from Pena National Palace (Sintra, Portugal),
International Biodeterioration and Biodegradation, 2013, 84: 322-332.
Cowan, S.T., Manual for the identification of medical bacteria, Cambridge University Press, 1974.
ISBN: 0-521-20399-6.
Crispim, C.A., Gaylarde, P.M., Gaylarde, C.C., Neilan, B.A., Deteriogenic cyanobacteria on historic
buildings in Brazil detected by culture and molecular techniques, International Biodeterioration
and Biodegradation, 2006, 57: 239-243.
Currie, B.A. and Bass, B., Estimates of air pollution mitigation with green plants and green roofs
using the UFORE model, Urban Ecosystems, 2008, 11 (4): 409-422.
Cutler, N. and Viles, H., Eukaryotic microorganisms and stone biodeterioration, Geomicrobiology
journal, 2010, 27: 630-646.
Czech, B., Krausman, P.R., Devers, P.K., Economic associations among causes of species
endangerment in the Inuted States, BioScience, 2000, 50: 593-601.
De Belie, N., Monteny, J., Beeldens, A., Vincke, E., Van Gemert, D., Verstraete, W., Experimental
research and prediction of the effect of chemical and biogenic sulfuric acid on different types of
commercially produced concrete sewer pipes, Cement and Concrete Research, 2004, 34 (12):
2223-2236.
de los Ríos, A., Cámara, B., del Cura M.A. García, Rico, V.J., Galván, V, Ascaso, C., Deteriorating
effects of lichen and microbial colonisation of carbonate building rocks in the Romanesque
churches of Segovia (Spain), Science of the Total Environment, 2009, 407: 1123-1134.
De Muynck, W., Maury Ramirez, A., De Belie, N., Verstraete, W., Evaluation of strategies to
prevent algal fouling on White architectural and celular concrete, International Biodeterioration
and Biodegradation, 2009, 63: 679-689.
Demirbas, A. and Karslioglu S. The effect of boric acid sludges containing borogypsum on
properties of cement. Cement and Concrete Research, 1995, 25 (7): 1381–1384.
Deruelle, S., Rôle du support dans la croissance des microorganisms, Materials and Structures,
1991, 24: 163-168.
Dilani, A., Design and Health: the Therapeutic Benefits of Design. Svensk Byggtjanst, Stockholm,
2001. ISBN: 978-91-7357-507-2.
Dinsdale, S., Pearen, B., Wilson, C., Feasibility Study for Green Roof Application on Queen’s
University Campus. Queen’s Physical Plant Services, 2006.
Dubosc, A., Escadeillas, G., Blanc, P.J., Characterization of biological stains on external concrete
walls and influence of concrete as underlying material, Cement and Concrete Research, 2001, 31
(11): 1613-1617.
Dukes, W.H., Conservation of stone: causes of decay, Architects’ Journal, 1972, 156: 429-432.
Dunnet, N. and Kingsbury, N., Planting green roofs and living walls. Timber Press, Inc. Portland,
Oregon, 2004. ISBN: 0-88192-640-X.
134 References
Bioreceptivity optimisation of concrete substratum to stimulate biological colonisation
Earth Pledge Foundation, Green Roofs. Ecological Design and Construction. Schifer Books.
Atglen, 2005. ISBN: 0-7643-2189-7.
Economist Intelligence Unit, European Green City Index, Siemens AG, Munich, Germany, 2009.
Ref.: A19100-F-P152-X-7600.
Eggert A., Häubner N., Klausch S., Karsten U., Schumann R., Quantification of algal biofilms
colonising building materials: chlorophyll a measured by PAM-fluorometry as a biomass
parameter, Biofouling, 2006, 22 (1/2): 79–90.
Elbeyli I.Y., Derun E.M., Gülen J., Pişkin S., Thermal analysis of borogypsum and its effects on the
physical properties of Portland cement, Cement and Concrete Research, 2003, 33 (11): 1729-
1735.
Escadeillas, G., Bertron, A., Blanc, P., Dubosc, A., Accelerated testing of biological stain growth
on external concrete walls. Part 1: Development of the growth tests, Materials and Structures,
2007, 40 (10): 1061-1071.
Favero-Longo, S.E., Isocrono, D., Piervittori, R., Lichens and ultramafic rocks: a review,
Lichenologist, 2004, 36: 391-404.
Favero-Longo, S.E., Borghi, A., Tretiach, M., Piervittori, R., In vitro receptivity of carbonate rocks
to endolithic lichen-forming aposymbionts, Research in Microbiology, 2009, 113: 1216-1227.
Fernandes, P., Applied microbiology and biotechnology in the conservation of stone cultural
heritage materials, Applied Microbiology and Biotechnology, 2006, 73: 291-296.
Ferri L., Lottici P.P., Lorenzi A., Montenero A., Salvioli-Mariani E., Study of silica nanoparticles —
polysiloxane hydrophobic treatments for stone-based monument protection, Journal of Cultural
Heritage, 2011, 12 (4): 356–363.
Formosa, J., Chimenos, J.M., Lacasta, A.M., Haurie, L., Rosell, J.R., Novel fire-protecting mortars
formuled with magnesium by-products, Cement and Concrete Research, 2011, 41 (2): 191-196.
Fuller, R.A. and Gaston, K.J., The scaling of green space coverage in European cities, Biology
letters, 2009, 5: 352-355.
Gaylarde, C., Silva, M.R., Warscheid, Th., Microbial impact on building materials: an overview,
Materials and Structures, 2003, 36 (5): 342-352.
Getter, K.L. and Rowe, B.D., The role of extensive green roofs in sustainable development,
Hortscience, 2006, 41 (5): 1276-1285.
Giannantonio, D.J., Kurth, J.C., Kurtis, K.E., Sobecky, P.A., Molecular characterizations of
microbial communities fouling painted and unpainted concrete structures, International
Biodeterioration and Biodegradation, 2008, 63: 30-40.
Giannantonio, D.J., Kurth, J.C., Kurtis, K.E., Sobecky, P.A., Effects of concrete properties and
nutrients on fungal colonisation and fouling, International Biodeterioration and Biodegradation,
2009, 63: 252-259.
Gorbushina, A.A., Life on the rocks, Environmental Microbiology, 2007, 9: 1613-1631.
References 135
Sandra Manso Blanco
Gorbushina, A.A., Broughton, W.J., Microbiology of the atmosphere-rock interface: how
biological interactions and physical stresses modulate a sophisticated microbial ecosystem,
Annual Review of Microbiology, 2009, 63: 431-450.
Grant, G., Engleback, L., Nicholson, B., Gedge, D., Frith, M., Harvey, P., Green roofs: their existing
status and potential for conserving biodiversity in urban areas. English Nature Research
Reports,2003, 498: 9-59.
Grant, G., Green roofs and façades. HIS BRE Press, 2006. ISBN: 978-1-86081-940-7.
Grimm, N.B., Faeth, S.H., Golubiewski, N.E., Redman, C.L., Wu, J., Bai, X., Briggs, J.M., Global
Change and Ecology of Cities, Science, 2008, 319: 756-760.
Guillitte, O., Cinétique de la colonisation végétle de matériaux composites de construction (PhD
thesis) Faculte des Sciences Agronomiques de Gembloux, Belgium, 1993.
Guillitte, O., Bioreceptivity: a new concept for building ecology studies, Science of the Total
Environment, 1995, 167 (1-3): 215-220.
Guillitte, O. and Dreesen, R., Laboratory chamber studies and petrographical analysis as
bioreceptivity assessment tools of building materials, 1995, 167 (1-3): 365-374.
Guo Y.P., Zhou H.F., Zhang L.C., Photosynthetic characteristics and protective mechanisms
against photooxidation during high temperature stress in two citrus species, Scientia
Horticulturae, 2006, 108: 260-267.
Hall D.A., Stevens R., El Jazairi B., Effect of water content on the structure and mechanical
properties of magnesia-phosphate cement mortar, Journal of the American Ceramic Society
1998, 81: 1550-1556.
Hall D.A., Stevens R., El-Jazairi B., The effect of retarders on the microstructure and mechanical
properties of magnesia-phosphate cement mortar, Cement and Concrete Research 2001, 31:
455-465.
Hartig, T., Mang, M., Evans, G.W., Restorative effects of natural environment experience,
Environment and Behaviour, 1991, 23: 3-26
Hawkes, D., Towards the sustainable city, Renewable Energy, 1995, 6 (3): 345-352.
Heber U., Bukhov N.G., Shuvalov V.A., Kobayashi Y., Lange O.L., Protection of the photosynthetic
apparatus against damage by excessive illumination in homoiohydric leaves and poikilohydric
mosses and lichens, Journal of Experimental Bototany, 2001, 52: 1999–2006.
Heber U., Azarkovich M., Shuvalov V., Activation of mechanisms of photoprotection by
desiccation and by light: poikilohydric photoautotrophs, Journal of Experimental Botany, 2007,
58 (11): 2745-2759.
Heidt, V. and Neef, M., Benefits of urban green space for improving urban climate, Ecology,
planning, and management of urban forests, 2008, 84-96. ISBN: 978-0-387-71424-0.

136 References
Bioreceptivity optimisation of concrete substratum to stimulate biological colonisation
Henry J.L., Optimización del control de la resistencia del hormigón de la obra de la depuradora
del Besós mediante ultrasonidos. Dissertation Work, Universitat Politècnica de Catalunya.
Barcelona, Spain, 2003.
Hernández M.S., Goñi S., Puertas F., Guerrero A., Palacios M., Dolado J.S., Synergy of T1-C3S and
β-C2S Hydration Reactions, Journal of the American Ceramic Society 2011, 94 (4): 1265-1271.
Hess, D., Plant Physiology, Springer Study Edition. ISBN: 978-3-642-80813-5.
Hjelmroos, M., Relationship between airborne fungal spore presence and weather variables:
Cladosporium and Alternaria, GRANA, 1993, 32 (1): 40-47.
Hoppert, M., Flies, C., Pohl, W., Günzl, B., Schneider, J., Colonisation strategies of lithobiontic
microorganisms on carbonate rocks, Environmental Geology, 2004, 46 (3-4): 421-428.
Hosker, R.P., Lindberg, S.E., Review: Atmospheric deposition and plant assimilation of gasses and
particles, Atmospheric Environment, 1982, 16 (5): 889-910.
Hoyano, A., Climatological uses of plants for solar control and the effects on the thermal
environment of a building, Energy and Buildings, 1988, 11 (1-3): 181-199.
Hueck, H.J., The biodeterioration of the materials as part of hylobiology, Material und Organism,
1965, 1: 5-34.
Iyengar S.R. and Al-Tabbaa A., Development Study of a low-pH Magnesium Phosphate Cement
for Environmental Applications, Environmental Technology 2007, 28: 1387-1401.
Jo, H.K., Impacts of urban greenspace on offsetting carbon emissions for middle Korea. Journal
of Environmental Management, 2002, 64: 115-126.
Johansson, C., Rodhe, H., Sanhueza, E., Emission of NO in a tropical savannah and a cloud forest
during the dry season, Journal of Geophysical Research Atmospheres, 1988, 93 (D6): 7180-7192.
Johnston, J. and Newton, J., Building Green, a guide to using plants on roofs, walls and
pavements. Major of London, 2004. ISBN: 1-85261-637-7.
Jones, B.L. and Cookson, J.T., Natural atmospheric microbial conditions in a typical suburban
area, Applied and Environmental Microbiology, 1983, 45 (3): 919-934.
Kabisch, N. and Haase, D., Green spaces of European cities revisited for 1990-2006, Landscape
and Urban Planning, 2013, 110: 113-122.
Kaltenbach, F., Living walls, vertical gardens – from the flowerpot to the planted system façade,
Detail nr 12, 2008, 1454-1463.
Keddy, P.A., The competition, Springer, London, UK, 1989. ISBN: 978-0-41231-350-9.
Kenworthy, J.R., The eco-city: ten key transport and planning dimensions for sustainable city
development, Environment and Urbanization, 2006, 18 (1): 67-85.
Klein N., El rol físico del agua en mezclas de cemento Portland (PhD thesis) Universitat Politècnica
de CatalunyaBarcelona, Spain: Universitat Politècnica de Catalunya, 2012.
References 137
Sandra Manso Blanco
Köhler, M., Long-term vegetation research on two extensive green roofs in Berlin, Urban
Habitats, 2006, 4: 3-26.
Kolb, R. W. and Schwartz, D. (2009) Introduction, in Corporate Boards: Managers of Risk, Sources
of Risk (eds R. W. Kolb and D. Schwartz), Blackwell Publishing Ltd., Oxford, UK.
doi: 10.1002/9781444315882.ch.
LAINE, M.M., JORGENSEN K.S., KIVIRANTA H.S., VARTIAINEN T.S., JOKELA J.K., ADIBI A.K.,
SALKINOJA-SOLONEN M.K., Bioaerosols and particles release during composting of
contaminated sawmill soil, Bioremediation Journal, 1999, 3 (1): 47-58.
Lambertini, A., Ciampi, M., Leenhardt, J., Vertical Gardens, Verba Volant. U.S.A., 2007. ISBN: 978-
1-905216-07-9.
Langerberg W.J., Sutton, J.C., Gillespie, T.J., Relation of Weather Variables and Periodicities of
Airborne Spores of Alternaria dauci, Phytopathology, 1977, 67: 879-883.
Laurie, I.C., Nature in cities, the natural environment in the design and development of urban
green space, John Wiley & Sons Ltd. 1977. ISBN 0-471-99605-X.
Lee, A.C.K. and Maheswaran, R., The health benefits of urban green spaces: a review of the
evidence, Journal of Public Health, 2011, 33 (2): 212-222.
Li, Z., Ding, Z., Zhang, Y., Development of sustainable cementitious materials, In: Proceedings of
the international workshop on sustainable development and concrete technology. USA: Center
for Transportation Research and Education, Iowa State University, 2004. pqp. 55–76.
Lieber W. and Richartz W., Einfluβ von TriaÈthanolamin, Zucker und Börsäure auf das Erstarren
von Zementen, Zement-Kalk-Gips, 1972, 61 (9): 403-409.
Lighthart, B. and Shaffer, B.T., Bacterial flux from chaparral into the atmosphere in mid-summer
at a high desert location, Atmospheric Environment, 1994, 28 (7): 1267-1274.
Lighthart, B. and Shaffer, B.T., Airborne bacteria in the atmospheric surface layer: temporal
distribution above a grass seed field, Applied and Environmental Microbiology, 1995, 61 (4):
1492-1496.
Lighthart, B., Mini-review of the concentration variations found in the alfresco atmospheric
bacterial populations, Aerobiologia, 2000, 16: 7-16.
Lichtenthaler H.K., Chlorophylls and carotenoids: pigments of photosynthetic membranes,
Methods in Enzymology 1987, 148: 349–382.
Lichtenthaler H.K., In Vivo Chlorophyll Fluorescence as a Tool for Stress Detection in Plants,
Applications of Chlorophyll Fluorescene in Photosynthesis Research, Stress Physiology,
Hydrobiology and Remote Sensing, 1988. Pp. 129–142.
Little, P., Deposition of 2.75, 5.0 and 8.5 µm particles to plant and soil surface, Environmental
Pollution, 1977, 12: 293-305.
Lodish, H., Berk, A., Zipursky, S.L., Matsudaira, P.,Baltimore, D., Darnell, J., Molecular Cell
Biology, 4th edition, W. H. Freeman, New York, 2000. ISBN: 0-7167-3136-3.

138 References
Bioreceptivity optimisation of concrete substratum to stimulate biological colonisation
Loh, S., Living walls – a way to green the built environment, BEDP Environment Design Guide.
Tec 26. August 2008. Pp. 1-7.
Lourenço, P.B., Luso, E., Almeida, M.G., Defects and moisture problems in buildings from
historical city centres: a case study in Portugal, Building and Environment, 2006, 41 (2): 223-234.
Mancinelli, R.L. and McKay, C.P., Effects of nitric oxide and nitrogen dioxide on bacterial growth,
Applied Environmental Microbiology, 1983, 46 (1): 198-202.
McCartney, H.A. and Lacey, M.E., The relationship between the release of ascospores of
Sclerotinia sclerotiorum, infection and disease in sunflower plot in the United Kingdom, GRANA,
1991, 30: 486-492.
Mansch, R. and Bock, E., Biodeterioration of natural stone with special reference to nitrifying
bacteria, Biodegradation, 1998, 9 (1): 47-64.
Manso, S., Mestres, G., Ginebra, M.P., De Belie, N., Segura, I., Aguado, A., Development of a low
pH cementitious material to enlarge bioreceptivity, Construction and Building Materials, 2014a,
54: 485-495.
Manso, S., De Muynck, W., Segura, I., Aguado, A., Steppe, K., Boon, N., De Belie, N., Bioreceptivity
evaluation of cementitious materials designed to stimulate biological growth, Science of the
Total Environment, 2014b, 481: 232-241.
Martínez, C., Gertosio, C., Labbe, A., Pérez, R., Ganga, M.A., Production of Rhodotorula glutinis:
a yeast that secretes α-L-arabinofuranosidase, Electronic Journal of Biotechnology, 2006, 9 (4):
407-413.
Maxwell D.P., Falk S., Trick C.G., Huner N.P.A., Growth at Low Temperature Mimics High-Light
Acclimation in Chlorella vulgaris, Plant Physiology, 1994, 105: 535-543.
Maxwell K. and Johnson G.N., Chlorophyll fluorescence: a practical guide, Journal of
Experimental Botany, 2000, 51 (345): 659–668.
McDonnell, M.J., Pickett, S.T.A., Groffman, P., Bohlen, P., Pouyat, R.V., Zipperer, W.C., Parmelee,
R.W., Carreiro, M.M.,Medley, K. Ecosystem processes along an urban-to-rural gradient, Urban
Ecosystems, 1997, 1 (1):21-36.
McKinney, M.L., Urbanization, biodiversity, and conservation, BioScience, 2002, 52: 883-890.
Mentens, J., Raes, D., Hermy, M., Green roofs as a tool for solving the rainwater runoff problem
in the urbanized 21st century? Landscape and Urban Planning, 2006, 77: 217-226.
Mestres, G and Ginebra, M.P., Novel magnesium phosphate cements with high early strength
and antibacterial properties, Acta Biomateralia, 2011, 7 (4): 1853-1861.
Miller, A.Z., Dionísion, L., Macedo, M.F., Primary bioreceptivity: a comparative study of different
Portuguese lithotypes, International Biodeterioration and Biodegradation, 2006, 57: 136-142.
Miller, A.Z., Laiz, L., Gonzalez, J.M., Dionísion, L., Macedo, M.F., Saiz-Jimenez, C., Reproducing
stone monument photosynthetic-based colonisation under laboratory conditions, Science of the
Total Environment, 2008, 405: 278-285.
References 139
Sandra Manso Blanco
Miller, A.Z., Dionísion, A., Laiz, L., Macedo, M.F., The influence of inherent properties of building
limestones on their bioreceptivity to phototrophic microorganisms, Microbial Ecology, 2010, 60
(1): 55-68.
Miller, A.Z., Rogerio-Candelera, M.A., Laiz, L., Wierzchos, J., Ascaso, C., Sequeira Braga, M.A.,
Hernández-Mariné, M., Maurício, A., Dionísion, A., Macedo, M.F., Saiz-Jimenez, C., Laboratory-
induced endolithic growth in calcarenites: Biodeteriorating potential assessment, Annals of
Microbiology, 2009, 59: 1-9.
Mindess, S., Young, J.F., Darwin, D., Concrete (2nd edition), Prentice Hall PTR, 2003. ISBN: 978-
0130646323.
Misra A.N., Misra M., Singh R., Chlorophyll Fluorescence in Plant Biology, Biophysics, Oxford,
2009. Pp. 171–192.
Nielsen, T.S. and Hansen, K.B., Do green areas affect health? Results from a Danish survey on the
use of green areas and health indicators, Health & Place, 2007, 13 (4): 839-850.
Nuhoglu, Y., The harmful effects of air pollutans around the Yenikoy thermal power plant on
architecture of Calabarian pine (Pinus brutila Ten.) needles, Journal of Environmental Biology,
2005, 26: 315-322.
Nuhoglu, Y., Oguz, E., Uslu, H., Ozbek, A., Ipekoglu, B., Ocak, I., Hasenekoglu, I., The accelerating
effects of the microorganisms on biodeterioration of stone monuments under air pollution and
continental-cold climatic conditions in Erzurum, Turkey, Science of the Total Environmentl, 2006,
364 (1-3): 272-283.
Oberndorfer, E., Lundholm, J., Bass, B., Coffman, R.R., Doshi, H., Dunnet, N., Gaffin, S., Köhler,
M., Liu, K.K.Y., Rowe, B., Green roofs as urban ecosystems: Ecological structures, functions and
services, BioScience, 2007, 57 (10): 823-833.
Observatorio de la Sostenibilidad de España, Sostenibilidad local: Una aproximación urbana y
rural, Informe temático, 2009. NIPO: 770-08-129-3.
Onions, A.H.S. and Brady, B.L., Taxonomy of Penicillium and Acremonium, Chapter 1 from
Biotechnology Handbooks 1: Penicillium and Acremonium, Peberdy, J.F. (ed.). ISBN: 0-306-
42345-6.
Ortega-Calvo, J.J., Ariño, X., Hernandez-Marine, M., Saiz-Jimenez, C., Factors affecting the
weathering and colonisation of monuments by phototrophic microorganisms, Science of the
Total Environment, 1995, 167: 329-341.
Ottelé, M., van Bohemen, H.D., Fraaij, A.L.A., Quantifying the deposition of particulate matter
on climber vegetation on living walls, Ecological Engineering, 2010, 36 (2), 154-162.
Ottelé, M., The Green Building Envelope. Vertical Greening (PhD thesis) Technical University of
Delft, Delft, Holland, 2011.
Papida, S., Murphy, W., May, E., Enhancement of physical weathering of building stones by
microbial populations, International Biodeterioration and Biodegradation, 2000, 46: 305-317.

140 References
Bioreceptivity optimisation of concrete substratum to stimulate biological colonisation
Paul, M.J. and Meyer, J.L., Streams in the urban landscape, Annual Review of Ecology and
Systematics, 2001, 32: 333-365.
Pérez, G., Façanes vegetades. Estudi del seu potencial com a sistema passiu d’estalvi d’energia,
en clima mediterrani continental (PhD thesis) Polytechnical University of Catalonia, Barcelona,
Spain, 2010.
Pérez, G., Rincón, L., Vila, A., González, J.M., Cabeza, L.F., Green vertical systems for buildings as
passive systems for energy savings, Applied Energy, 2011, 88 (12): 4854-4859.
Perini, K., Ottelé, M., Fraaij, A.L.A., Haas, E.M., Raiteri, R., Vertical greening systems and the
effect on air flow and temperatura on the building envelope, Building and Environment, 2011,
46 (11): 2287-2294.
Piervittori, R., Salvadori, O., Laccisaglia, A., Literature on lichens and biodeterioration of
stoneworks I, Lichenologist, 1994, 26: 171-192.
Piervittori, R., Salvadori, O., Laccisaglia, A., Literature on lichens and biodeterioration of
stoneworks II, Lichenologist, 1996, 28: 471-483.
Piervittori, R., Salvadori, O., Laccisaglia, A., Literature on lichens and biodeterioration of
stoneworks III, Lichenologist, 1998, 30: 263-277.
Pitts, B., Hamilton, M.A., McFeters, G.A., Stewart, P.S., Willse, A., Zelver, N., Color measurement
as a means of quantifying surface biofouling, Journal of Microbiological Methods, 1998, 34 (2):
143-149.
Popovics S., Rajendran N., Penko M., Rapid Hardening Cements for Repair of Concrete, Materials
Journal 1987, 84 (1): 64-73.
Portillo, M.C., Gazulla, M.F., Sanchez, E., Gonzalez, J.M., A procedure to evaluate the resistance
to biological colonisation as a characteristic for product quality of ceramic roofing tiles, Journal
of the European Ceramic Society, 2000, 31 (3): 351-359.
Praphailong, W. and Fleet, G.H., The effect of pH, sodium chloride, sucrose, sorbate and benzoate
on the growth of food spoilage yeasts, Food Microbiology, 1997, 14 (5): 459-468.
Pretty, J., Griffin, M., Sellens, M., Pretty, C., Green exercise: complementary roles of nature,
exercise, diet in physical and emotional well-being and implications for public health policy. CES
Occasional Paper 2003-1. University of Essex (www2.essex.ac.uk/ces).
Priego, C., Naturaleza y Sociedad. El valor de los espacios verdes urbanos, Ministerio de Medio
Ambiente y Medio Rural y Marino, 2011. ISBN: 978-84-491-1078-8.
Prieto, B. and Silva, B., Estimation of the potential bioreceptivity of granitic rocks from their
intrinsic properties, International Biodeterioration and Biodegradation, 2005, 56: 206-215.
Pugh, T.A.M., MacKenzie, A. R., Whyatt, D., Hewitt, C.N., Effectiveness of Green Infrastructure
for Improvement of Air Quality in Urban Street Canyons, Environmental Science and Technology,
2012, 46 (14): 7692-7699.
References 141
Sandra Manso Blanco
Qiao, F., Lin, W., Chau, C.K., Li, Z., Property assessment of magnesium phosphate cement, Key
Engineering Materials, 2009a, 400-402: 115-120.
Qiao, F., Chau, C.K., Li, Z., Setting and compressive strength characteristics of magnesium
phosphate cement paste, Advances in Cement Research, 2009b, 21 (4): 175-180.
Ramachandran V.S., Hydration of cement – role of triethanolamine, Cement and Concrete
Research 1976, 6 (5): 623-631.
Rebolledo N., Aplicación de técnicas no destructivas al estudio del hormigón fresco, (Master
thesis), Universidad Politécnica de Madrid. Madrid, Spain, 2010.
Reponen, T., Wileke, K., Ulevicius, V., Grinshpun, S.A., Donnelly, J., Techniques for dispersion of
microorganisms into air, Aerosol Science and Technology, 1997, 27 (3): 405-421.
Rohácek K., Chlorophyll fluorescence parameters: the definitions, photosynthetic meaning, and
mutual relationships, Photosynthetica, 2002, 40 (1): 13–29.
Rotmans, J. and Van Asselt, M., Vellinga, P., An integrated planning tool for sustainable cities,
Environmental Impact Assessment Review, 2000, 20: 265-276.
Saiz-Jimenez, C., Ariño, X., Ortega-Calvo, J.J., Mechanism of Stone deterioration by
photosynthesis-based epilithic biofilms. In: De Cleene M, editor. Interactive physical weathering
and bioreceptivity study on building stones, monitored by Computerized X-Ray Tomography (CT)
as a potential non-destructive research tool. Protections and Conservation of the European
Cultural Heritage. Research Report nº 2. Ghent: Science Information Office, 1995. Pp. 25-62.
Saiz-Jimenez, C., Biodeterioration vs biodegradation: the role of microorganisms in the removal
of pollutans deposited on historic buildings, International Biodeterioration and Biodegradation,
1997, 70 (2-4): 225-232.
Salisbury, F. and Ross, C., Plant Physiology, Wadsworth Publishing Company, 1992. ISBN: 0-534-
15162-0.
Sarkar A.K., Phosphate cement-based fast-setting binders, American Ceramic Society Bulletin
1990, 69: 234-238.
Schol-Schwarz, M.B., The genus Epicoccum Link, Transactions of the British Mycological Society,
1959, 42 (2): 149-173.
Shaffer, B.T., Lighthart, B., Survey of culturable airborne bacteria at four diverse locations in
Oregon: urban, rural, forest and coastal, Microbial Ecology, 1997, 34: 167-177.
Shelton, B.G., Kirkland, K.H., Flanders, W.D., Morris, G.K., Profiles of airborne fungi in buildings
and outdoor environments in the United States, Applied and Environmental Microbiology, 2002,
68 (4): 1743-1753.
Shirakawa, M.A., Gaylarde, C.C., Gaylarde, P.M., John, V., Gambale, W., Fungal colonisation and
succession on newly painted buildings and the effect of biocide, Microbiology Ecology, 2002, 39
(2): 165-173.
142 References
Bioreceptivity optimisation of concrete substratum to stimulate biological colonisation
Singh N.K., Mishra P.C., Singh V.K., Narang K.K., Effects of hydroxyethyl cellulose and oxalic acid
on the properties of cement, Cement and Concrete Research, 2003, 33 (9): 1319-1329.
Smith, W.H. and Staskawicz, B.J., Removal of atmospheric particles by leaves and twigs of urban
trees: Some preliminary observations and assessment of research needs, Environmental
Management, 1977, 1 (4): 317-330.
Song, Y., Ecological city and urban sustainable development, Procedia Engineering, 2011, 21:
142-146.
Soudée, E. and Péra, J., Mechanism of setting reaction in magnesia-phosphate cements, Cement
and Concrete Research, 2000, 30: 315-321.
Souza R.P., Machado E.C., Silva J.A.B., Lagôa A.M.M.A., Silveira J.A.G., Photosynthetic gas
exchange, chlorophyll fluorescence and some associated metabolic changes in cowpea (Vigna
unguiculata) during water stress and recovery, Environmental and Experimental Botany, 2004,
51: 45-56.
Starks, T.L. and Shubert, L.E., Colonisation and succession of algae and soil-algal interactions
associated with disturbed areas, Journal of Phycology, 1982, 18 (1): 99-107.
Stephens, C., Bacterial sporulation: A question of commitment?, Current Biology, 1998, 8 (2):
R45-R48.
Stigsdotter, U.K., Ekholm, O., Schipperijn, J., Toftager, M., Kamper- Jorgensen, F., Randrup, T.B.,
Health promoting outdoor environments – Associations between green space, and health,
health-related quality of life and stress based on a Danish national representative survey,
Scandinavian Journal of Public Health, 2010, 38 (4): 411-417.
Taylor H.F.W., Cement Chemistry. Academic Press Inc. London; 1990.
Tiano, P., Biological deterioration of exposed works of art made of stone, In: L.H.G. Morton (Ed.),
The Biodeterioration of Constructional Materials, Biodeterioration Society, Occasional
Publication 3, Lancashire Polytechnic, UK, 1986. Pp. 37-44.
Tiano, P., Accolla, P., Tomaselli, L., Phototrophic biodeteriogens on lithoid surfaces: an ecological
study, Microbial Ecology, 1995, 29: 299-309.
Tiano, P., Biodeterioration of monumental rocks: decay mechanisms and control methods,
Science and Technology of Cultural Heritage, 7: 19-38.
Tomaselli, L., Lamenti, G., Bosco, M., Tiano, P., Biodiversity of photosynthetic microorganisms
dwelling on stone monuments, International Biodeterioration and Biodegradation, 2000, 46:
251-258.
Tong, Y. and Lighthart, B., Solar radiation is shown to select for pigmented bacteria in the
ambient outdoor atmosphere, Photochemistry and Photobiology, 1997, 65 (1): 103-106.
Tran, T.H., Govin, A., Guyonnet, R., Grosseau, P., Lors, C., Garcia-Diaz, E., Damidot, D., Devès, O.,
Rout, B., Influence of the intrinsic characteristics of mortars on biofouling by Klebsormidium
flaccidum, International Biodeterioration and Biodegradation, 2012, 70: 31-39.
References 143
Sandra Manso Blanco
Tran, T.H., Govin, A., Guyonnet, R., Grosseau, P., Lors, C., Garcia-Diaz, E., Damidot, D., Devès, O.,
Rout, B., Avrami’s law based kinetic modelling of colonisation of mortar surface by alga
Klebsormidium flaccidum, International Biodeterioration and Biodegradation, 2013, 79: 73-80.
Trigo, M.M., Jato, V., Fernández, D., Galán, C., Atlas Aeropalinológico de España, Universidad de
León, España, 2008. ISBN: 978-84-9773-403-5.
Ulrich, R.S., The Biophilia Hypothesis, Island Press, 1993. ISBN: 1-55963-147-3.
UNE-EN 196-1:2005, Methods of testing cement – Part 1: Determination of strength, AENOR;
2005.
UNE-EN 196-2:2006, Methods of testing cement – Part 2: Chemical analysis of cement, AENOR;
2006.
UNE-EN 196-3:2005, Methods of testing cement – Part 3: Determination of setting times and
soundness, AENOR; 2005.
UNE-EN 196-9:2011, Methods of testing cement – Part 9: Heat of hydration – semi-adiabatic
method, AENOR; 2011.
UNE-EN 1015-3:2000, Methods of test for mortar for masonry. Part 3: Determination of
consistence of fresh mortar (by flow table), AENOR; 2000.
UNE 7088:1955, Compactness determination in the arids for mortars and concrete, AENOR;
1955.
UNE 80105:1986, Test methods of cements. Physical analysis. Density determination by the liquid
displacement pycnometer, AENOR; 1986.
UNE 80230:2010, Methods of testing cement. Chemical analysis. Alternative methods, AENOR;
2010.
UNE 83227:2005, Admixtures for concrete, mortars and grouts. Determination of pH, AENOR;
2005.
United Nations, Department of Economic and Social Affairs, Population Division, World
Urbanization Prospects. The 2001 Revision. Data Tables and Highlights. 2002. Working paper No.
ESA/P/WP.173.
United Nations, Department of Economic and Social Affairs, Population Division, World
Population Prospects. The 2008 Revision. Highlights. 2009. Working paper No. ESA/P/WP.210.
Valls S., Estabilización física y química de los lodos de depuradora de aguas residuales y de
material de demolición para su utilización en ingeniería civil (PhD thesis), Universitat Politècnica
de Catalunya, Barcelona, Spain, 1999.
Valls S. and Vàzquez E., Stabilisation and solidification of sewage sludges with Portland cement,
Cement and Concrete Research 2000, 30: 1671-1678.
van Eijk R.J. and Brouwers H.J.H., Modelling the effects of waste components on cement
hydration. Waste Management (Oxford), 2001, 21 (3): 279–284.
144 References
Bioreceptivity optimisation of concrete substratum to stimulate biological colonisation
Van Renterghem, T. and Botteldooren, D., In-situ measurements of sound propagating over
extensive green roofs, Building and Environment, 2011, 46 (3): 729-738.
Wagh A.S., Chemically bonded phosphate ceramics, Twenty-First Century Materials with Diverse
Applications. Elsevier BV. Belgium: Amsterdam; 2004.
Widden, P., Competition and the fungal community, Chapter 9 from The mycota, Springer.
ISBN: 3-540-58005-0.
Wilson, E.O., Biophilia, Harvard University Press, 1984. ISBN: 0-674-07442-4.
Wong, N.H., Tan, A.Y.K., Chen, Y., Sekar, K., Tan, P.Y., Chan, D., Chiang, K., Wong, N.C., Thermal
evaluation of vertical greenery systems for building walls, Building and Environment, 2010, 45
(3): 663-672.
Yang Q. and Wu X., Factors influencing properties of phosphate cement-based binder for rapid
repair of concrete, Cement and Concrete Research 1999, 29 (3): 389-396.
Yang Q., Zhu B., Zhang S., Wu X., Properties and applications of magnesia-phosphate cement
mortar for rapid repair concrete, Cement and Concrete Research 2000, 30: 1807-1813.
Yousuf M., Mollah A., Vempati R.K., Lin T.C., Cocke D.L., The interfacial chemistry of
solidification/stabilization of metals in cement and pozzolanic material systems, Waste
Management 1995, 15 (2): 137-148.

Publications 145
Sandra Manso Blanco
PUBLICATIONS
Articles
Manso, S., Mestres, G., Ginebra, M.P., De Belie, N., Segura, I., Aguado, A., Development of a low
pH cementitious material to enlarge bioreceptivity, Construction and Building Materials, 2014a,
54: 485-495.
Manso, S., De Muynck, W., Segura, I., Aguado, A., Steppe, K., Boon, N., De Belie, N., Bioreceptivity
evaluation of cementitious materials designed to stimulate biological growth, Science of the
Total Environment, 2014b, 481: 232-241.
Conference proceedings
Manso, S., Segura, I., Aguado, A., Influencia de la preparación de la muestra en la determinación
de pH en pastas, morteros y hormigones, Anais do 54º Congreso Brasileiro do Concreto CBC2012,
Maceió (Brasil), October 2012.
De Belie, N., Wang, J., De Muynck, W., Manso, S., Segura, I., Microbial interactions with mineral
building materials, 8th International Symposium on Cement and Concrete ISCC-2013, Nanjing
(China), September 2013.
Patents
Manso S, Segura I, Aguado A, Conjunto multicapa en base cemento, aplicable como soporte
biológico para fachadas de edificios u otras construcciones, Patent PCT/ES2013/070438, 28 July
2013.

146 Publications
Bioreceptivity optimisation of concrete substratum to stimulate biological colonisation