Análisis exploratorio(1).pdf
57
ANÁLISIS EXPLORATORIO TEMA 3: LOCALIZACIÓN: MEDIA, MEDIANA, CUARTÍLES VARIABILIDAD: VARIANZA, DESVIACIÓN ESTÁNDAR (DE),, CV, RANGO, RANGO ENTE CUARTILES. NOTA: ERROR ESTÁNDAR (EE) ES TAMBIÉN UNA DESVIACIÓN ESTÁNDAR. FORMA: HISTOGRAMAS, DIAGRAMAS DE CAJA, TALLOS Y HOJAS. Docente : Adrián Santana Lic. En Matemáticas (Universidad de Cundinamarca) Esp. en Estadística Aplicada (Fundación Universitaria Los Libertadores) M. Cs. Estadísticas (Universidad Nacional de Colombia)
-
Upload
tanya-huerfano -
Category
Documents
-
view
44 -
download
3
Transcript of Análisis exploratorio(1).pdf
ANÁLISIS EXPLORATORIO
TEMA 3:
LOCALIZACIÓN: MEDIA, MEDIANA, CUARTÍLES
VARIABILIDAD: VARIANZA, DESVIACIÓN ESTÁNDAR (DE),, CV, RANGO, RANGO ENTE CUARTILES. NOTA: ERROR ESTÁNDAR (EE) ES TAMBIÉN UNA DESVIACIÓN ESTÁNDAR.
FORMA: HISTOGRAMAS, DIAGRAMAS DE CAJA, TALLOS Y HOJAS.
Docente : Adrián SantanaLic. En Matemáticas (Universidad de Cundinamarca)
Esp. en Estadística Aplicada (Fundación Universitaria Los Libertadores)M. Cs. Estadísticas (Universidad Nacional de Colombia)

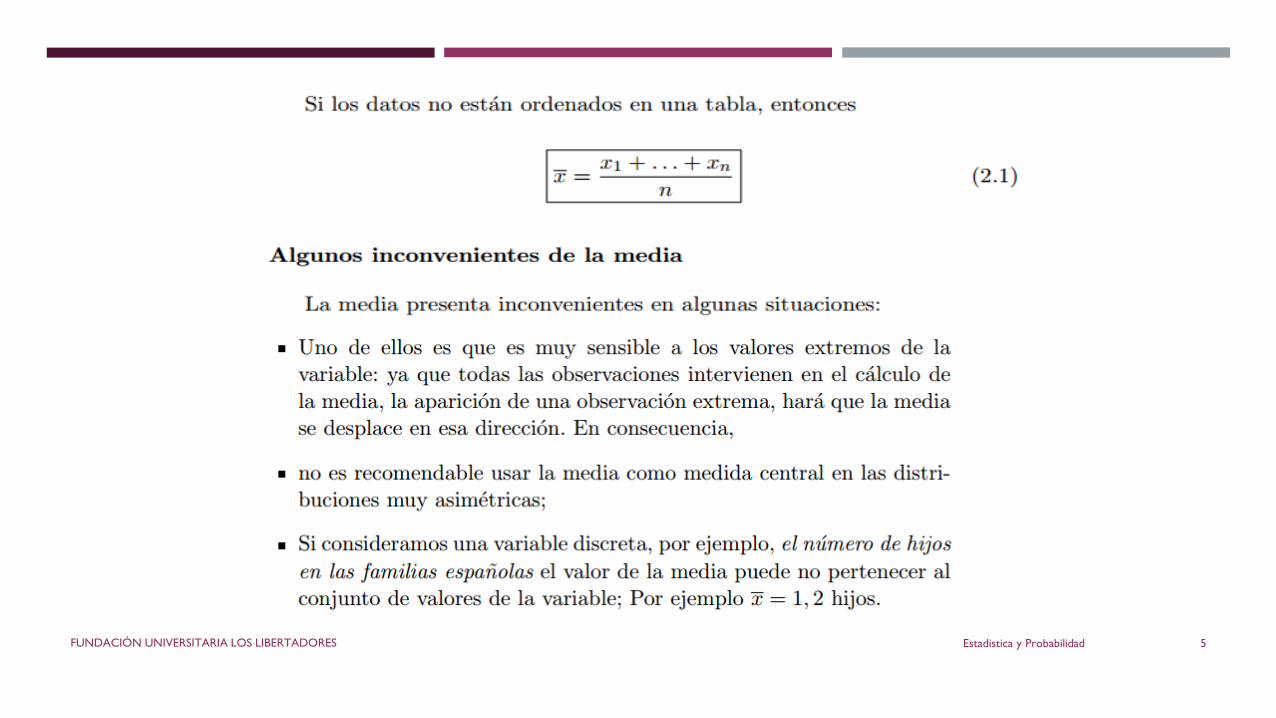
En el capitulo anterior hemos visto cómo se pueden resumir los datos
obtenidos del estudio de una muestra (o una población) en una tabla
estadística o un gráfico.
No obstante, tras la elaboración de la tabla y su representación grafica, en
la mayoría de las ocasiones resulta más eficaz “condensar” dicha
información en algunos números que la expresen de forma clara y
concisa.
Los fenómenos biológicos no suelen ser constantes, por lo que seria
necesario que junto a una medida que indique el valor alrededor del cual
se agrupan los datos, se asocie una medida que haga referencia a la
variabilidad que refleje dicha fluctuación. FUNDACIÓN UNIVERSITARIA LOS LIBERTADORES Estadistica y Probabilidad 2
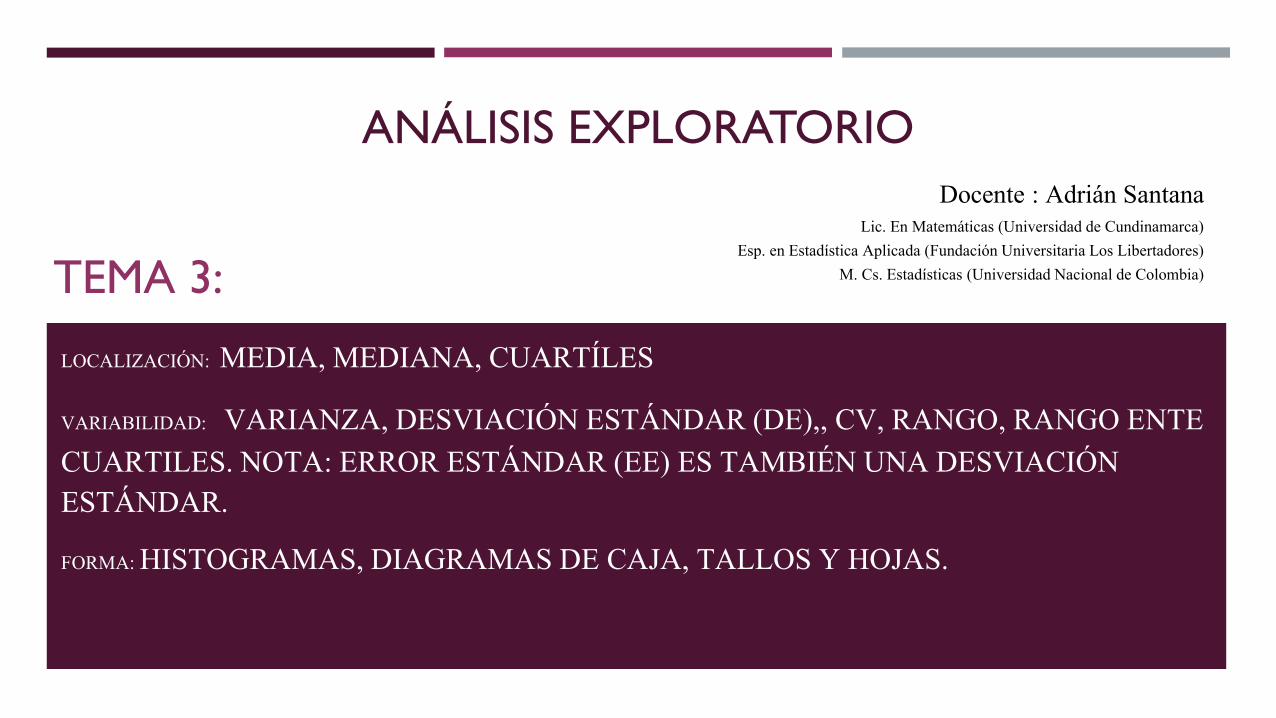
En este sentido pueden examinarse varias características, siendo las más comunes:
• Las medidas de tendencia central o de localización de los datos• La dispersión o variación con respecto a este centro; • Los datos que ocupan ciertas posiciones. • La simetría de los datos. • La forma en la que los datos se agrupan.
FUNDACIÓN UNIVERSITARIA LOS LIBERTADORES Estadistica y Probabilidad 3
Estadistica y ProbabilidadFUNDACIÓN UNIVERSITARIA LOS LIBERTADORES 4
Estadistica y ProbabilidadFUNDACIÓN UNIVERSITARIA LOS LIBERTADORES 5
Estadistica y ProbabilidadFUNDACIÓN UNIVERSITARIA LOS LIBERTADORES 6
Estadistica y ProbabilidadFUNDACIÓN UNIVERSITARIA LOS LIBERTADORES 7

Estadistica y ProbabilidadFUNDACIÓN UNIVERSITARIA LOS LIBERTADORES 8
Estadistica y ProbabilidadFUNDACIÓN UNIVERSITARIA LOS LIBERTADORES 9

Estadistica y ProbabilidadFUNDACIÓN UNIVERSITARIA LOS LIBERTADORES 10

MEDIDAS DE LOCALIZACIÓN
MEDIDA
POBLACION MUESTRA
MEDIA
xf x dx( )
n
x
x
n
i
i 1
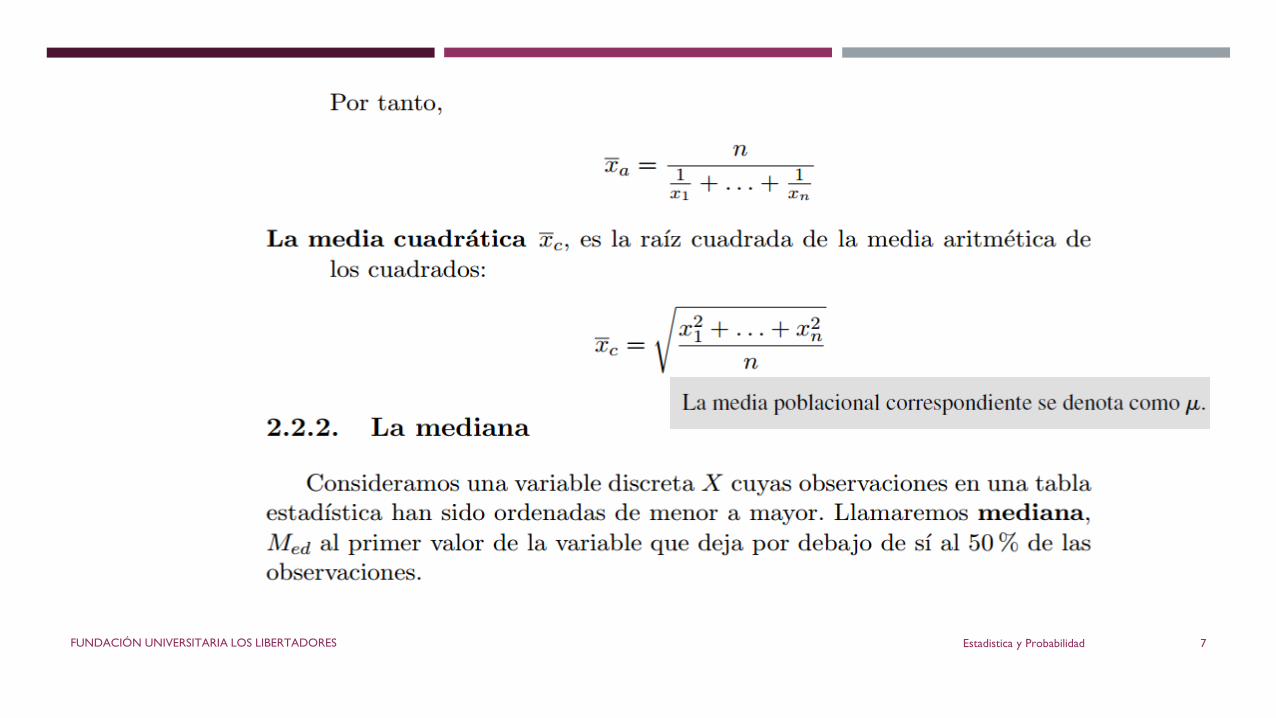
MEDIANA f x dx
x
( )
1
2
Estadísticas de orden:
x x x x n( ) ( ) ( ) ( )...0 1 2
Si n impar 2/)1(~
nxx
Si n par 2
~ )12/(2/
nn xxx
MODA
max f(xx
)
max f(xx
)
CUANTILAS
(Cuartíles, Deciles, etc)
f x dx p
x
( )
Similar a la mediana pero divido
sobre 4 en el caso de cuartiles o
sobre 10 en los deciles.
FUNDACIÓN UNIVERSITARIA LOS LIBERTADORES Estadistica y Probabilidad 11

Estadistica y ProbabilidadFUNDACIÓN UNIVERSITARIA LOS LIBERTADORES 12
Estadistica y ProbabilidadFUNDACIÓN UNIVERSITARIA LOS LIBERTADORES 13
Ejercicios Estadística matemática pág. 6
Ejercicios copias

Estadistica y ProbabilidadFUNDACIÓN UNIVERSITARIA LOS LIBERTADORES 14

Estadistica y ProbabilidadFUNDACIÓN UNIVERSITARIA LOS LIBERTADORES 15

Estadistica y ProbabilidadFUNDACIÓN UNIVERSITARIA LOS LIBERTADORES 16

Estadistica y ProbabilidadFUNDACIÓN UNIVERSITARIA LOS LIBERTADORES 17
Bioestadistica, pag. 50

Estadistica y ProbabilidadFUNDACIÓN UNIVERSITARIA LOS LIBERTADORES 18

Estadistica y ProbabilidadFUNDACIÓN UNIVERSITARIA LOS LIBERTADORES 19

Estadistica y ProbabilidadFUNDACIÓN UNIVERSITARIA LOS LIBERTADORES 20

Estadistica y ProbabilidadFUNDACIÓN UNIVERSITARIA LOS LIBERTADORES 21

Estadistica y ProbabilidadFUNDACIÓN UNIVERSITARIA LOS LIBERTADORES 22
Tomado De Walpole, Probabilidad Y Estadística 8ª Edicion.
Hallar media, varianza y desviación estándar.

Estadistica y ProbabilidadFUNDACIÓN UNIVERSITARIA LOS LIBERTADORES 23
Ejercicio del calculo de las medidas de dispersión:
Calcular el rango, la varianza y desviación típica de las siguientes cantidades medidas en metros.
3,3,4,4,5.

Estadistica y ProbabilidadFUNDACIÓN UNIVERSITARIA LOS LIBERTADORES 24

Estadistica y ProbabilidadFUNDACIÓN UNIVERSITARIA LOS LIBERTADORES 25

Estadistica y ProbabilidadFUNDACIÓN UNIVERSITARIA LOS LIBERTADORES 26
Estadistica y ProbabilidadFUNDACIÓN UNIVERSITARIA LOS LIBERTADORES 27

Estadistica y ProbabilidadFUNDACIÓN UNIVERSITARIA LOS LIBERTADORES 28
Estadistica y ProbabilidadFUNDACIÓN UNIVERSITARIA LOS LIBERTADORES 29

Estadistica y ProbabilidadFUNDACIÓN UNIVERSITARIA LOS LIBERTADORES 30
Estadistica y ProbabilidadFUNDACIÓN UNIVERSITARIA LOS LIBERTADORES 31

Estadistica y ProbabilidadFUNDACIÓN UNIVERSITARIA LOS LIBERTADORES 32
Diagrama de caja y bigotes (BOX-plot)

Estadistica y ProbabilidadFUNDACIÓN UNIVERSITARIA LOS LIBERTADORES 33
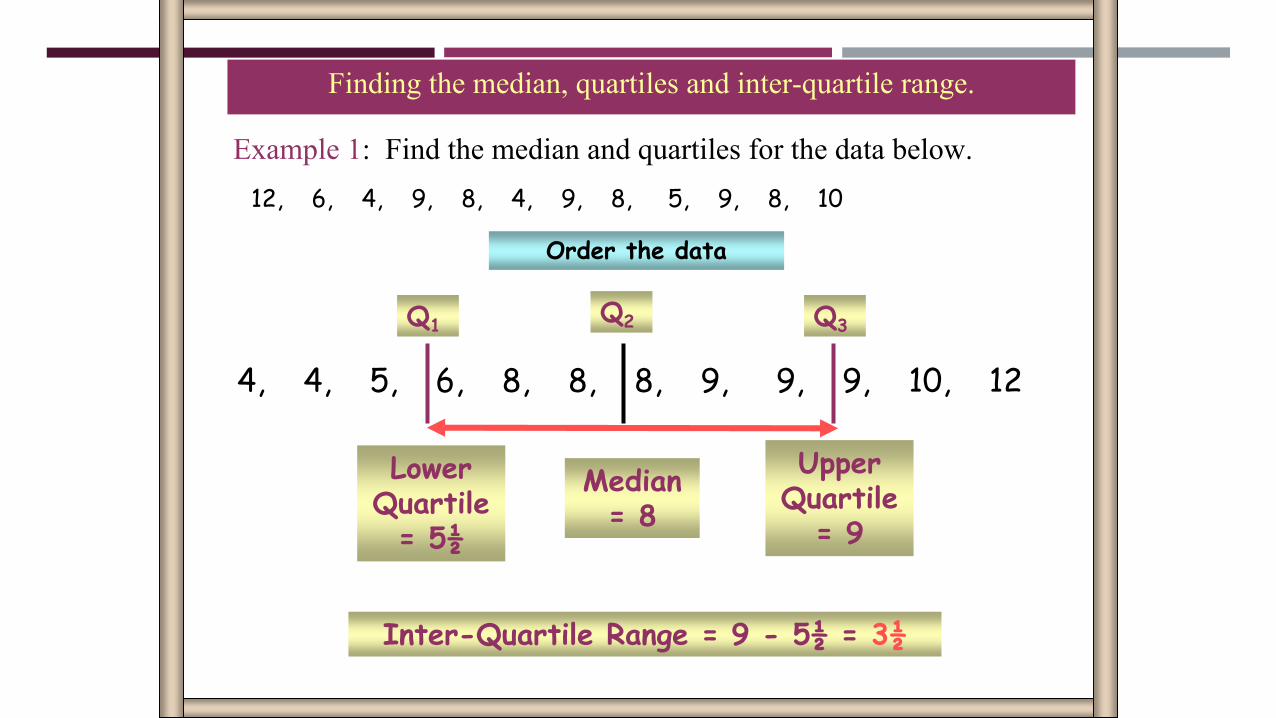
Finding the median, quartiles and inter-quartile range.
12, 6, 4, 9, 8, 4, 9, 8, 5, 9, 8, 10
4, 4, 5, 6, 8, 8, 8, 9, 9, 9, 10, 12
Order the data
Inter-Quartile Range = 9 - 5½ = 3½
Example 1: Find the median and quartiles for the data below.
Lower Quartile
= 5½
Q1
Upper Quartile
= 9
Q3
Median = 8
Q2

Upper Quartile
= 10
Q3
Lower Quartile
= 4
Q1
Median = 8
Q2
3, 4, 4, 6, 8, 8, 8, 9, 10, 10, 15,
Finding the median, quartiles and inter-quartile range.
6, 3, 9, 8, 4, 10, 8, 4, 15, 8, 10
Order the data
Inter-Quartile Range = 10 - 4 = 6
Example 2: Find the median and quartiles for the data below.

2, 5, 6, 6, 7, 8, 8, 8, 9, 9, 10, 15
Median = 8 hours and the inter-quartile range = 9 – 6 = 3 hours.
Battery Life: The life of 12 batteries recorded in hours is:
2, 5, 6, 6, 7, 8, 8, 8, 9, 9, 10, 15
Mean = 93/12 = 7.75 hours and the range = 15 – 2 = 13 hours.
Discuss the calculations below.
The averages are similar but the measures of spread are significantly different since the extreme values of 2 and 15 are not included in the inter-quartile range.

4 5 6 7 8 9 10 11 12
Median
Lower Quartile
Upper Quartile
Lowest Value
Highest Value
BoxWhiskerWhisker
130 140 150 160 170 180 190
Boys
Girlscm
Box and Whisker Diagrams.
Box plots are useful for comparing two or more sets of data like that shown below for heights of boys and girls in a class.
Anatomy of a Box and Whisker Diagram.
BOX
PLOTS

Lower Quartile
= 5½
Q1
Upper Quartile
= 9
Q3
Median = 8
Q2
4 5 6 7 8 9 10 11 12
4, 4, 5, 6, 8, 8, 8, 9, 9, 9, 10, 12
Example 1: Draw a Box plot for the data below
Drawing a Box Plot.
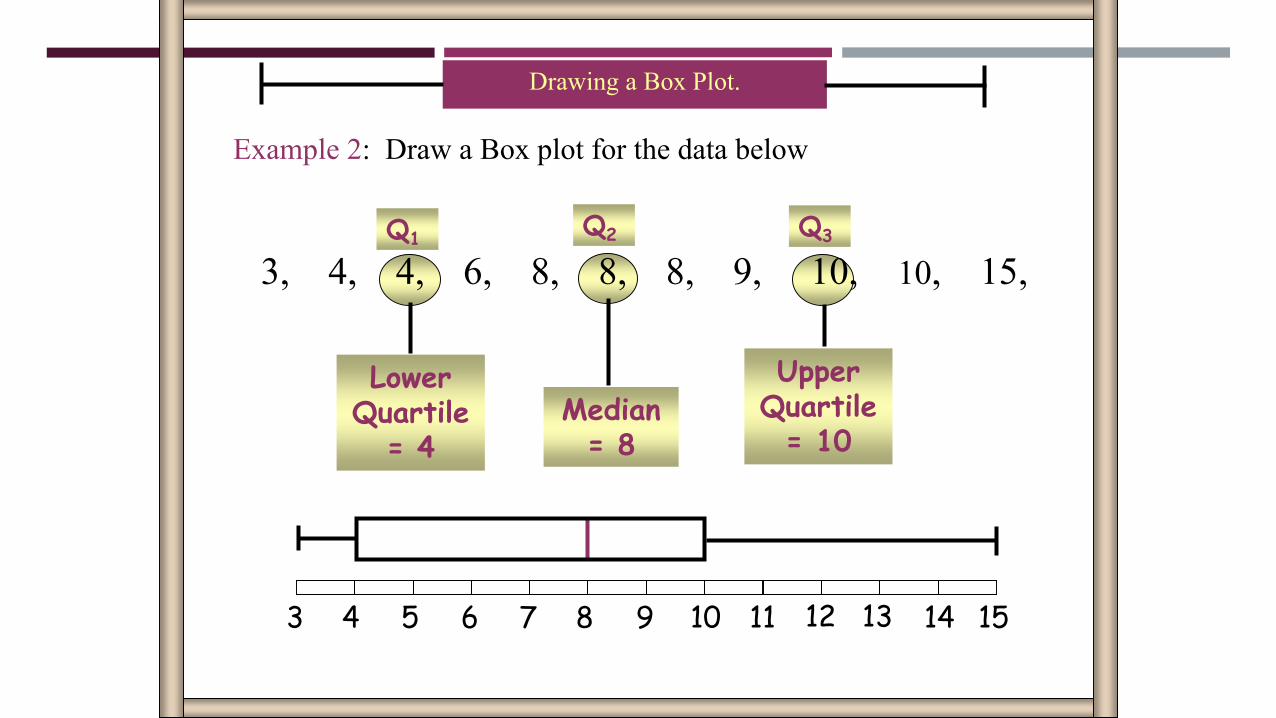
Upper Quartile
= 10
Q3
Lower Quartile
= 4
Q1
Median = 8
Q2
3, 4, 4, 6, 8, 8, 8, 9, 10, 10, 15,
Example 2: Draw a Box plot for the data below
Drawing a Box Plot.
3 4 5 6 7 8 9 10 11 12 13 14 15

Upper Quartile = 180
Qu
Lower Quartile = 158
QL
Median = 171
Q2
Question: Stuart recorded the heights in cm of boys in his class as shown below. Draw a box plot for this data.
Drawing a Box Plot.
137, 148, 155, 158, 165, 166, 166, 171, 171, 173, 175, 180, 184, 186, 186
130 140 150 160 170 180 190cm
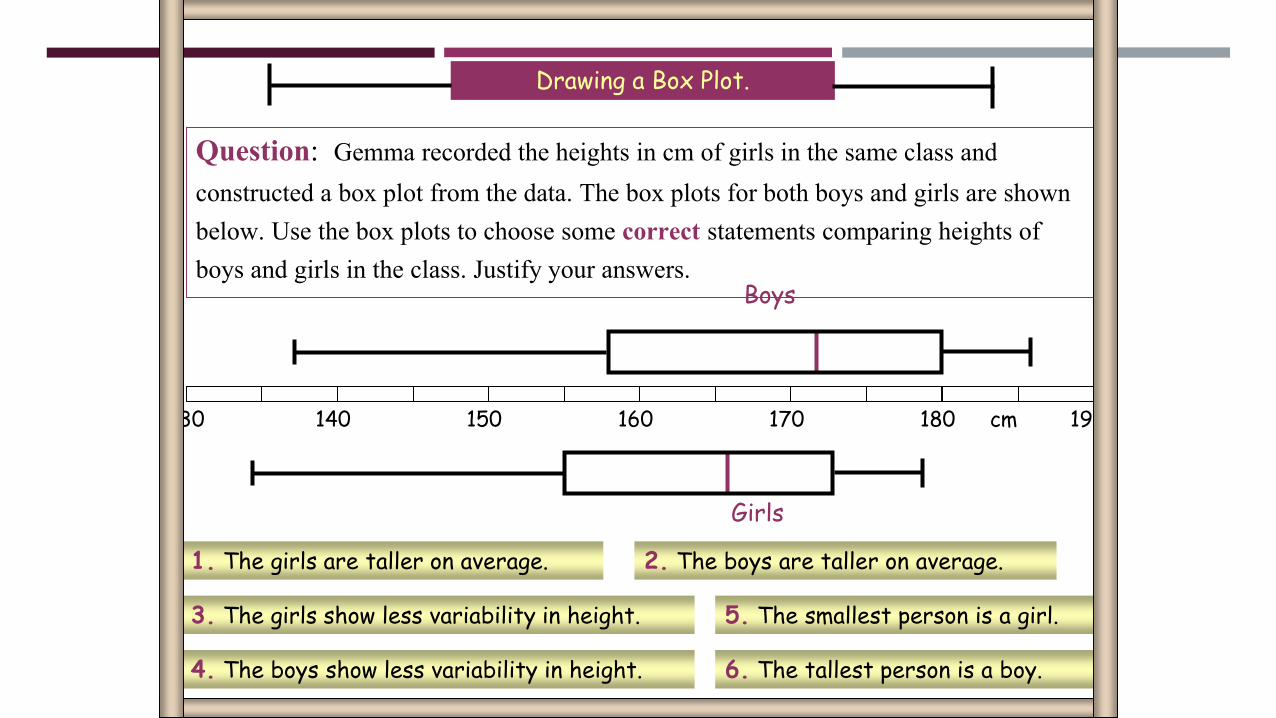
2. The boys are taller on average.
Question: Gemma recorded the heights in cm of girls in the same class and
constructed a box plot from the data. The box plots for both boys and girls are shown below. Use the box plots to choose some correct statements comparing heights of boys and girls in the class. Justify your answers.
Drawing a Box Plot.
130 140 150 160 170 180 190
Boys
Girls
cm
1. The girls are taller on average.
3. The girls show less variability in height.
4. The boys show less variability in height.
5. The smallest person is a girl.
6. The tallest person is a boy.
10
20
30
40
50
60
70
0
Cum
ulat
ive F
requ
enc
y
10 20 30 40 50 60 70
Minutes LateM
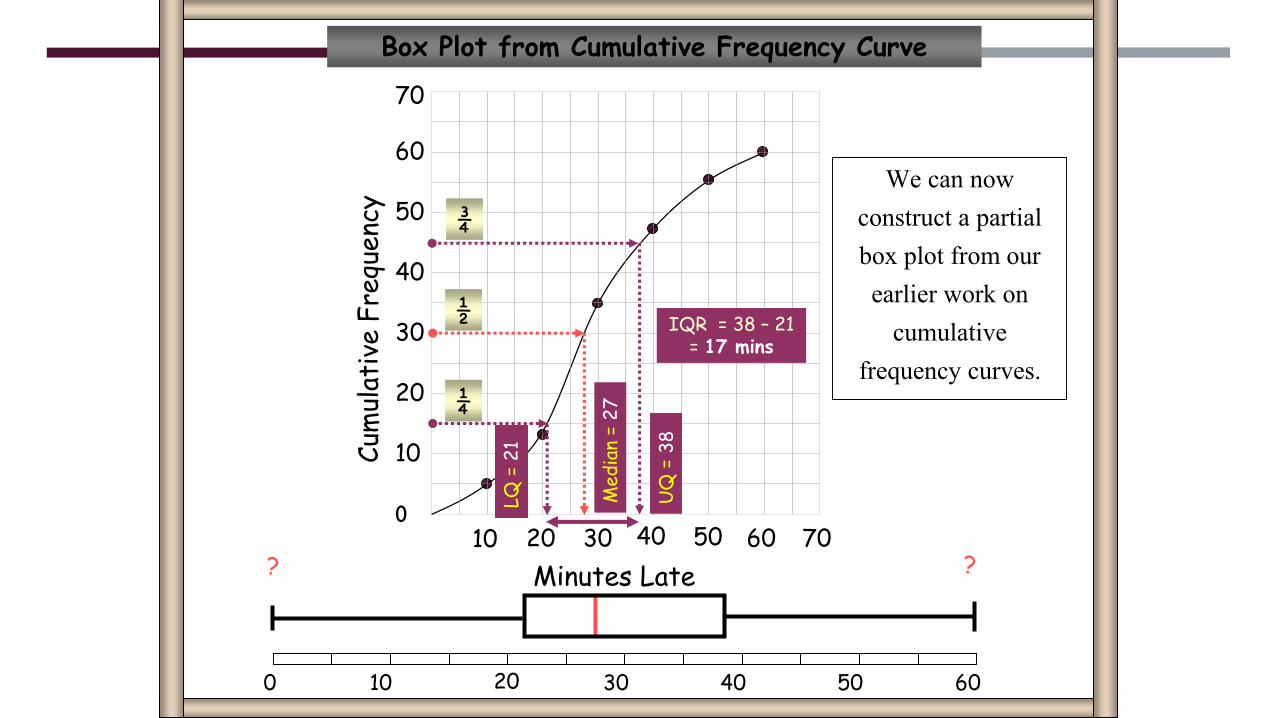
edia
n =
27
LQ
= 2
1
UQ
= 3
8
IQR = 38 – 21 = 17 mins
½
¼
¾
0 10 20 30 40 50 60
Box Plot from Cumulative Frequency Curve
CFC
? ?
We can now construct a partial box plot from our earlier work on
cumulative frequency curves.

MEDIDAS DE VARIABILIDAD
MEDIDA POBLACIÓN
MUESTRA
VARIANZA
2
2
x f x dx( )
1
1
2
2
n
xx
s
n
i
i
DESVIACIÓN ESTÁNDAR
2
2ss
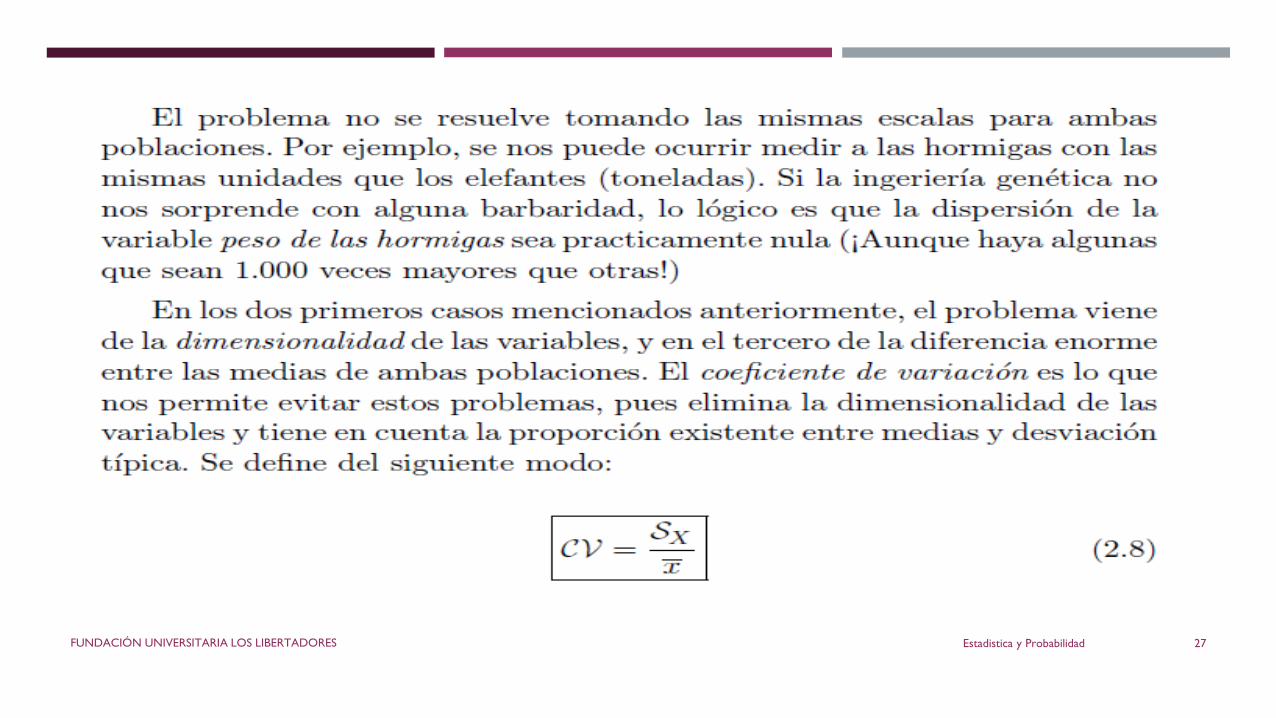
COEFICIENTE DE VARIACIÓN
100
x
s
RANGO Xmáx - Xmin xmáx - xmin
RANGO ENTRE CUARTILES
Q Q3 1
13 qq
FUNDACIÓN UNIVERSITARIA LOS LIBERTADORES Estadistica y Probabilidad 43
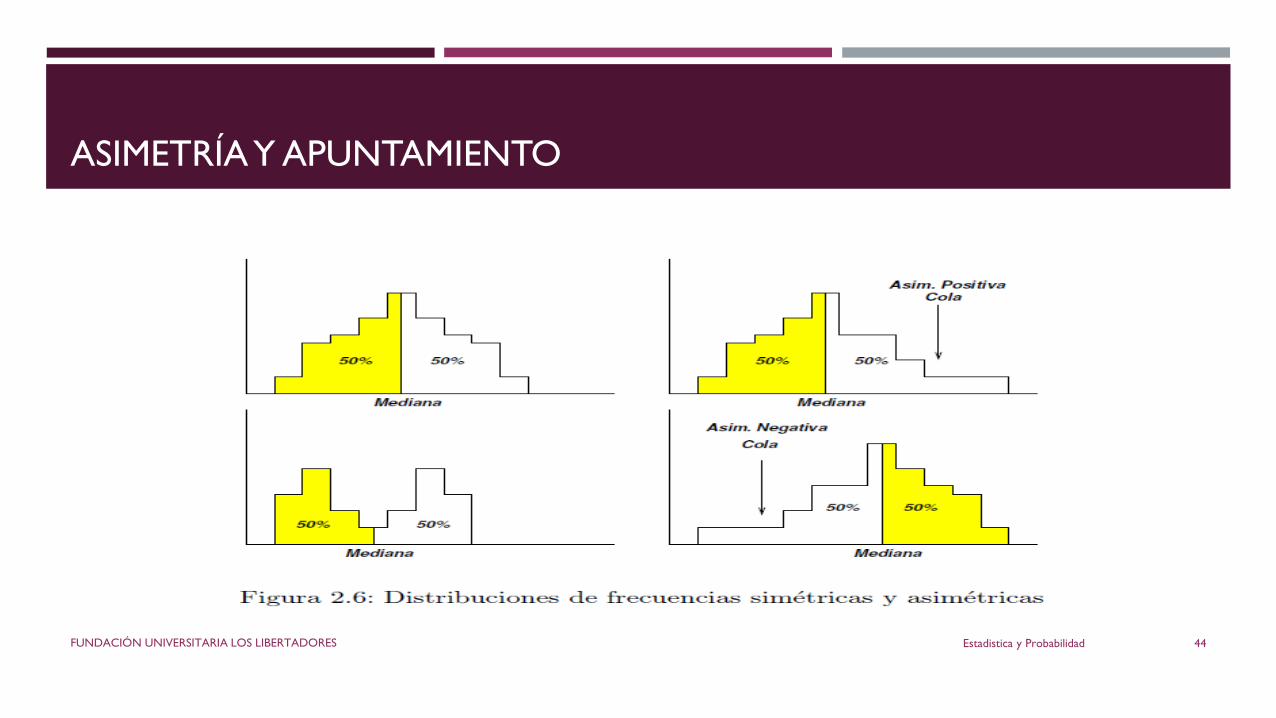
ASIMETRÍA Y APUNTAMIENTO
Estadistica y ProbabilidadFUNDACIÓN UNIVERSITARIA LOS LIBERTADORES 44

Estadistica y ProbabilidadFUNDACIÓN UNIVERSITARIA LOS LIBERTADORES 45
Estadistica y ProbabilidadFUNDACIÓN UNIVERSITARIA LOS LIBERTADORES 46
Momento Central De Tercer Orden
El primer momento, es la media
El segundo momento menos el primer momento es la varianza.
El tercer momento sobre el cubo de la desviación estándar, es la asimetría

Estadistica y ProbabilidadFUNDACIÓN UNIVERSITARIA LOS LIBERTADORES 47

Estadistica y ProbabilidadFUNDACIÓN UNIVERSITARIA LOS LIBERTADORES 48

Estadistica y ProbabilidadFUNDACIÓN UNIVERSITARIA LOS LIBERTADORES 49
Coeficiente de Pearson

Estadistica y ProbabilidadFUNDACIÓN UNIVERSITARIA LOS LIBERTADORES 50

Estadistica y ProbabilidadFUNDACIÓN UNIVERSITARIA LOS LIBERTADORES 51
Ejercicio:
Ejercicio bio, pag 65.

Estadistica y ProbabilidadFUNDACIÓN UNIVERSITARIA LOS LIBERTADORES 52
Gamma: 𝛾

Estadistica y ProbabilidadFUNDACIÓN UNIVERSITARIA LOS LIBERTADORES 53
Estadistica y ProbabilidadFUNDACIÓN UNIVERSITARIA LOS LIBERTADORES 54

Estadistica y ProbabilidadFUNDACIÓN UNIVERSITARIA LOS LIBERTADORES 55
Ejercicios Bioestadística pág.. 68
Ejercicios Wackerly pág.. 10

Dispersogramas
Independiente
Dependiente
FUNDACIÓN UNIVERSITARIA LOS LIBERTADORES Estadistica y Probabilidad 56

TALLER CLASE
1. De ejemplos de variables cualitativas (nominales y ordinales) y de variables cuantitativas (intervalo y razón)
2. Busque bases de datos y describa que tipos de variables tienen
3. Haga análisis descriptivos en R
FUNDACIÓN UNIVERSITARIA LOS LIBERTADORES Estadistica y Probabilidad 57