= Medir el volumen de fluidos (agua irreducible e ...08:01Z... · registros acústicos dipolares de...
37
= Medir el volumen de fluidos (agua irreducible e identificación de ag Ja y petróleo) presente en la formación, utilizando la tecnología de Resonancia Magnética Nuclear. m Realizar un Modelado Dinámico del Yacimiento para monitorear como incide el aumento del gradiente geotérmico, con el tiempo, para predecir o identificar el posible aumento del factor de recobro del hidrocarburo presente. m Realizar registros de GR - Presión - Temperatura, en diferentes po:!os del misnio Campo, para monitorear los cambios de estas lecturas al frente de liis formaciones atravesadas. Con la finalidad de alimentar los datos (le entrada del modelo sugerido anteriormente. = Registrar el comportamiento de la Temperatura en los próximos pozos (hoyo abierto) en forma continua y en tiempo real, para observar los cambios que afecten la columna del pozo.
Transcript of = Medir el volumen de fluidos (agua irreducible e ...08:01Z... · registros acústicos dipolares de...
= Medir el volumen de fluidos (agua irreducible e identificación de ag Ja y petróleo)
presente en la formación, utilizando la tecnología de Resonancia Magnética
Nuclear.
m Realizar un Modelado Dinámico del Yacimiento para monitorear como incide el
aumento del gradiente geotérmico, con el tiempo, para predecir o identificar el
posible aumento del factor de recobro del hidrocarburo presente.
m Realizar registros de GR - Presión - Temperatura, en diferentes po:!os del misnio
Campo, para monitorear los cambios de estas lecturas al frente de liis
formaciones atravesadas. Con la finalidad de alimentar los datos (le entrada del
modelo sugerido anteriormente.
= Registrar el comportamiento de la Temperatura en los próximos pozos (hoyo
abierto) en forma continua y en tiempo real, para observar los cambios que
afecten la columna del pozo.
- -- -- - -
REFERENCIAS BIBLIOGRAFICAS
1. Almarza, Ramón. (1997) Campos petrolíferos de Venezuela. Cócigo Geológico de Venezuela. O PDVSA-Intevep. [on line] Disponible eri: http://www.~dv.com/lexico/.
2. Bavaresco de Prieto, Aura Marina. (2005) Redacción de Infoi-mes. Tercera Edición. Editorial de La Universidad del Zulia. Maracaibo (Venezuela).
3. Escobar, Marcos. (2004) Guía de Ambientes Sedimentarios. Uiiiversidad del Zulia. Maracaibo, Venezuela.
4. Gearhart. (1986) Interpretation of the Spectral Gamma Ray. Houston, Texas.
5. García, Joana. (2004) Caracterización Geomecánica dinámica median.te registros acústicos dipolares de los yacimientos 'A" y "E", costa afuera en el oriente de Venezuela. Trabajo de Grado. División de Postgrado. Falcultad de Ingeniería. Universidad del Zulia. Maracaibo, Venezuela.
6. Halliburton. (1997) Open Hole Log Analysis and Formation Evaluation. Houston, Texas.
7. Halliburton. (2003) Open Hole Log Analysis Notes. Houston, Texa.;.
8. Halliburton. (2004) Image Processing and Interpretation. Houstori, Texas.
9. Halliburton. (2004) RockXpert manual. Houston, Texas.
10.LUZ. (2002) Guía de Geología General. Universidad del Zulis. Maracaibo, Venezuela.
ll.Sabino, Carlos A. (1980) El proceso de investigación. Editorial El Cid Editcr; C.A. Argentina.
12.Schlumberger. (1970) Fundamentos de la interpretación d - perfiles [le buzamiento. Caracas, Venezuela.
13.Shulmberger. (1997) WEC Evaluación de pozos. Caracas, Venezuela
14.Tamayo y Tamayo, Mario. (1995) El proceso de la Investigación Científica. lera Reimpresión de la 3ra Edición. Editorial Limusa, S. A., Grupo Noi-iega Editores. México.
lS.Vásquez, Andrés R. (2001) Introducción a la geomecánica peti-olera. Quinta Edición. V.V.A Consultores, C.A. Caracas, Venezuela.

APENDICE A
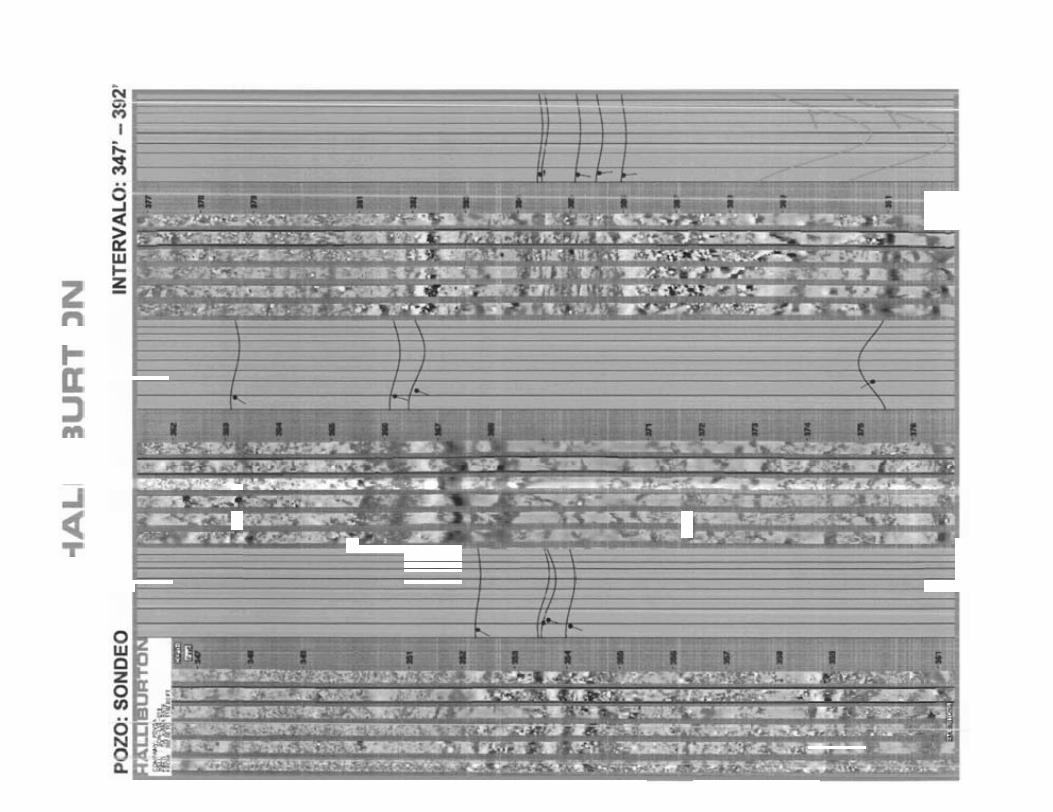
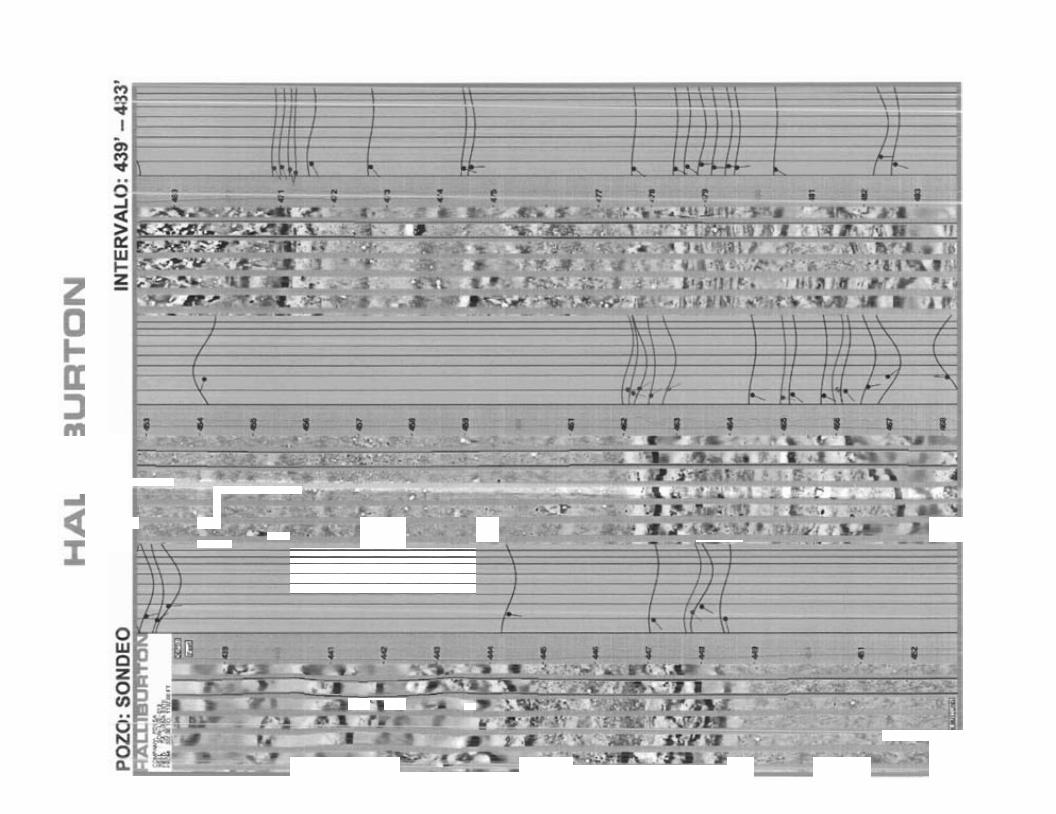
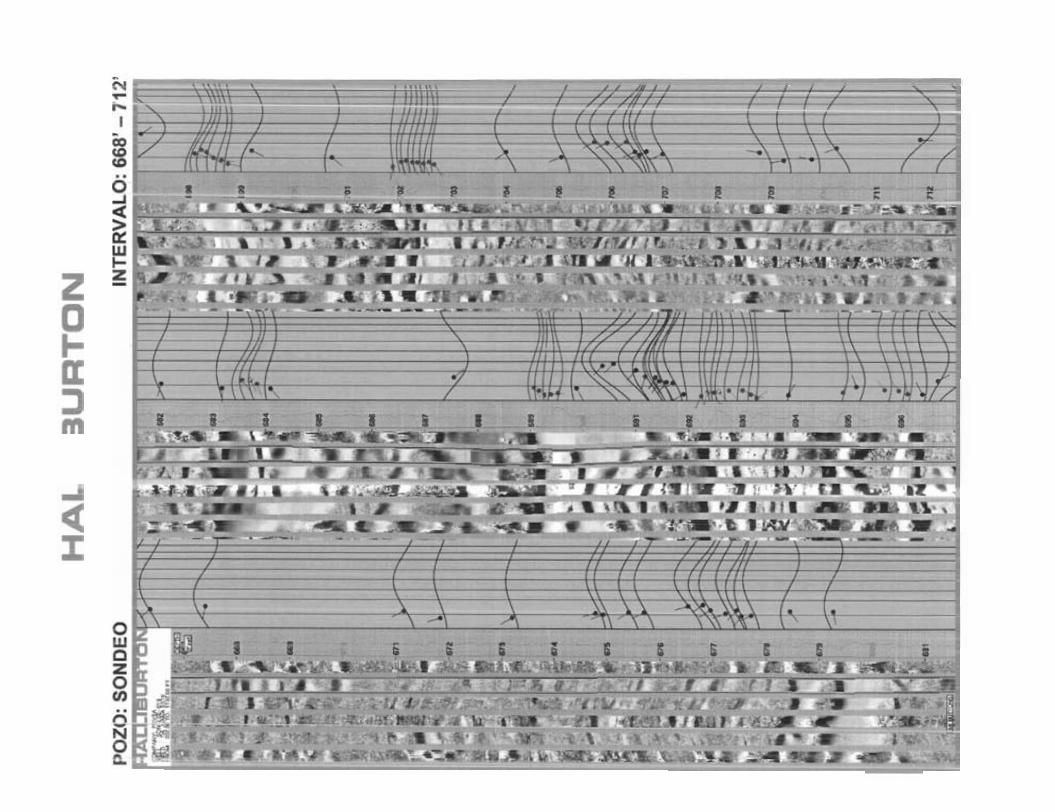
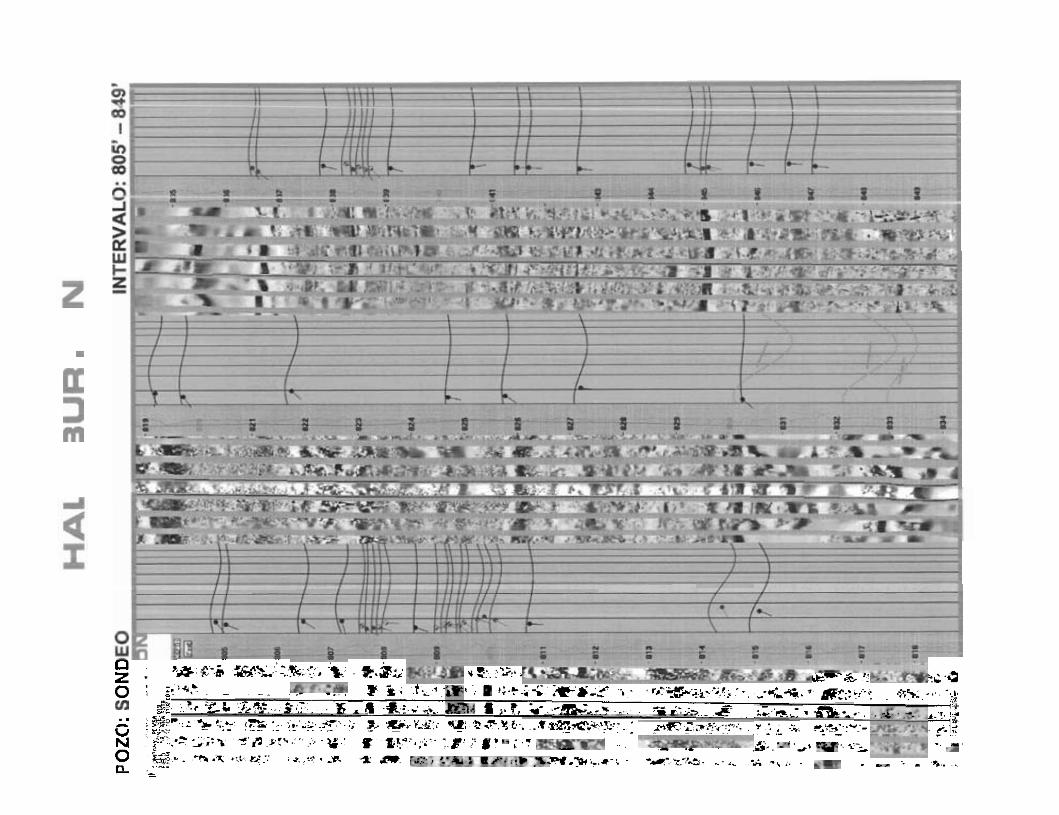
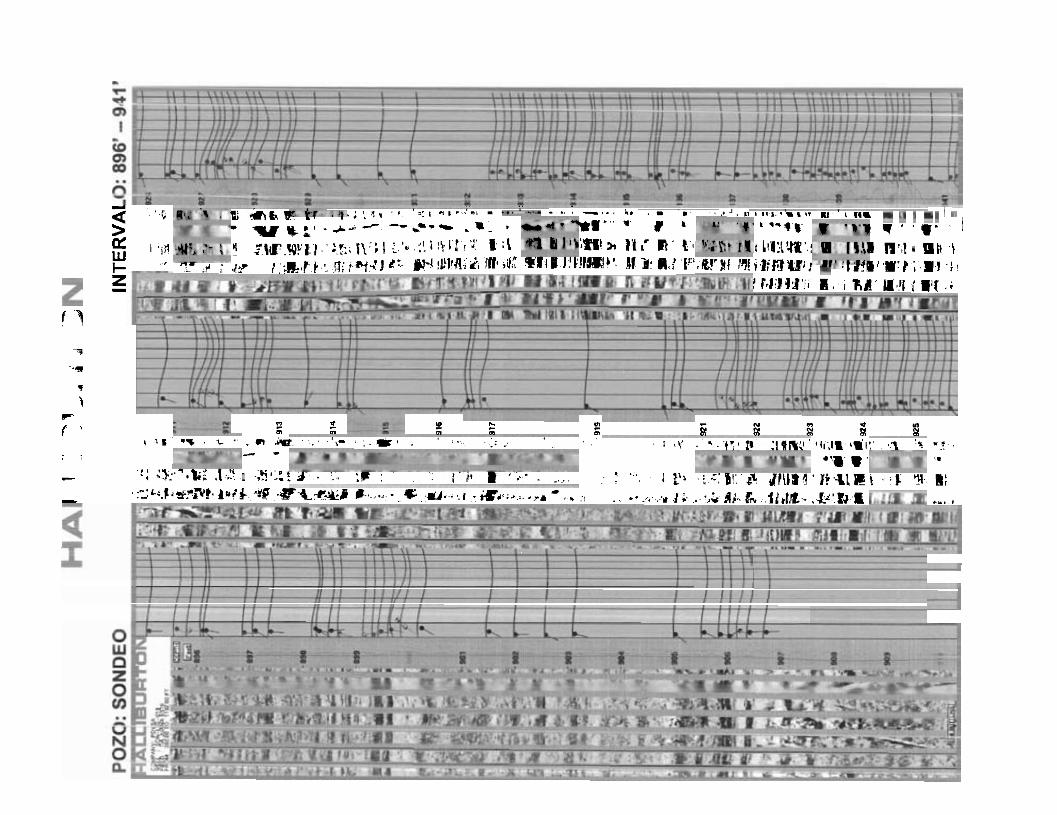
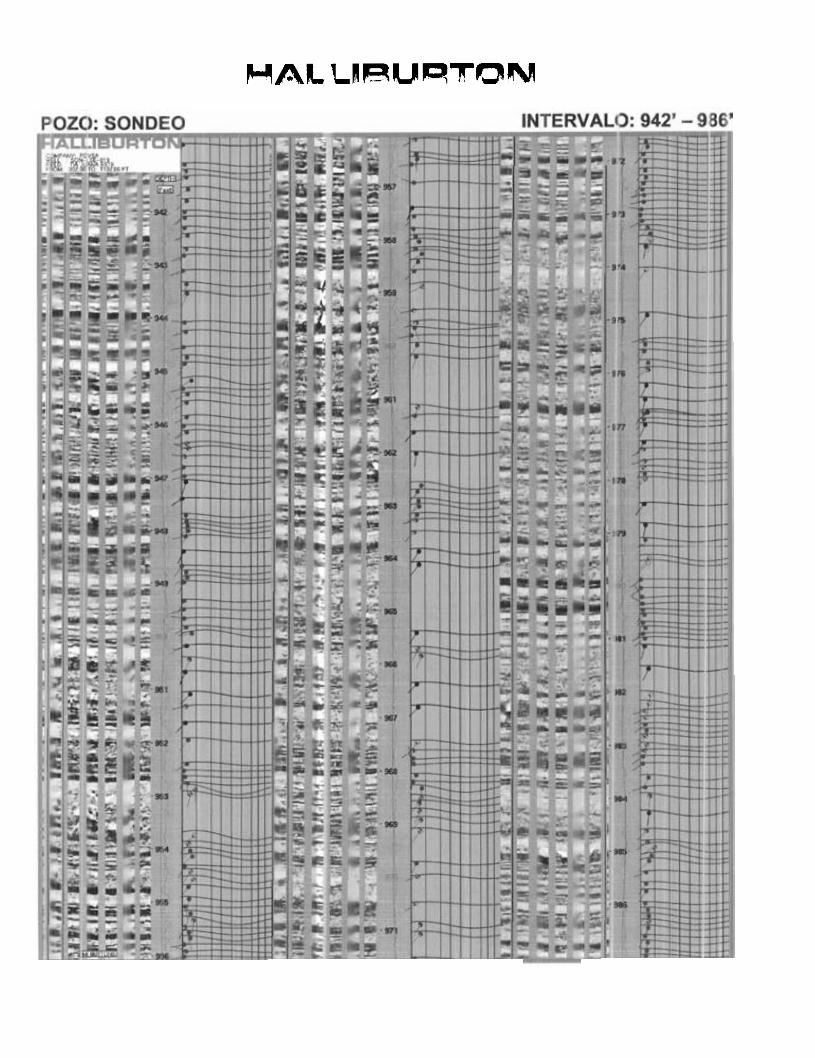
IMÁGENES DE ALTA RESOLUCIOIN ADQUIRIDAS EN EL POi!O DE ESTUDIO, CON LA HERRAMIENTA ELECTRICAL MICRO IMAGER (I!MI) DE HALLIBURTON.
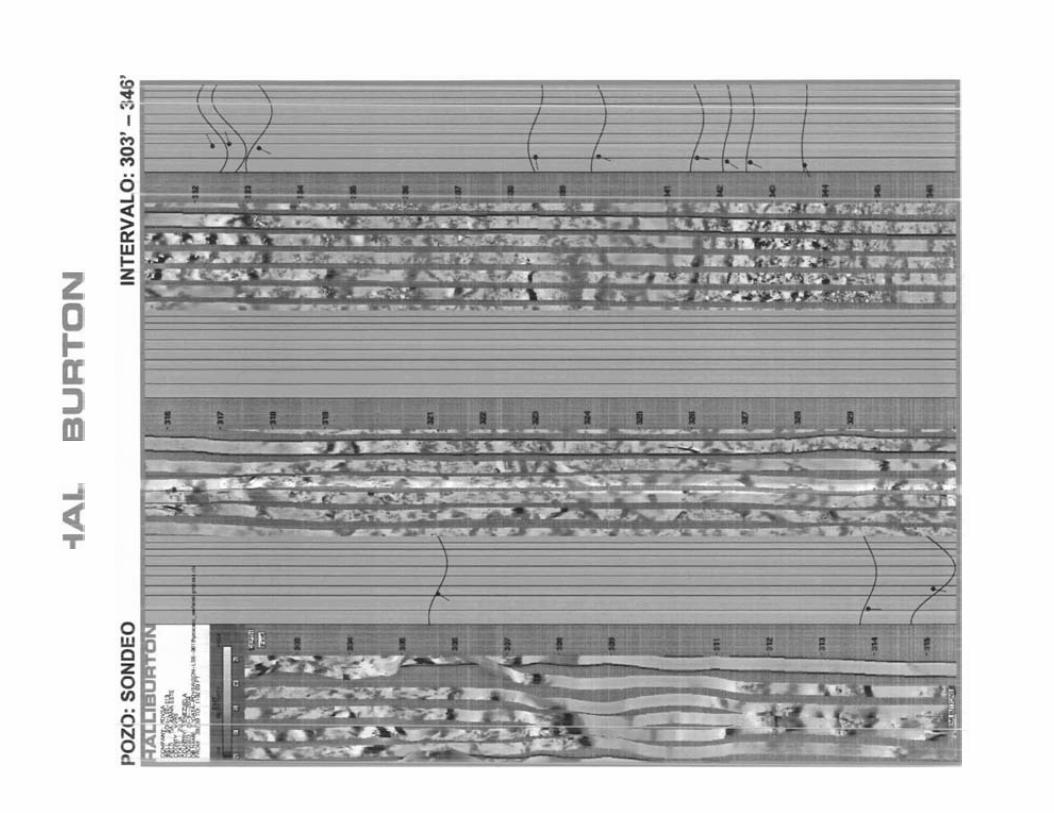


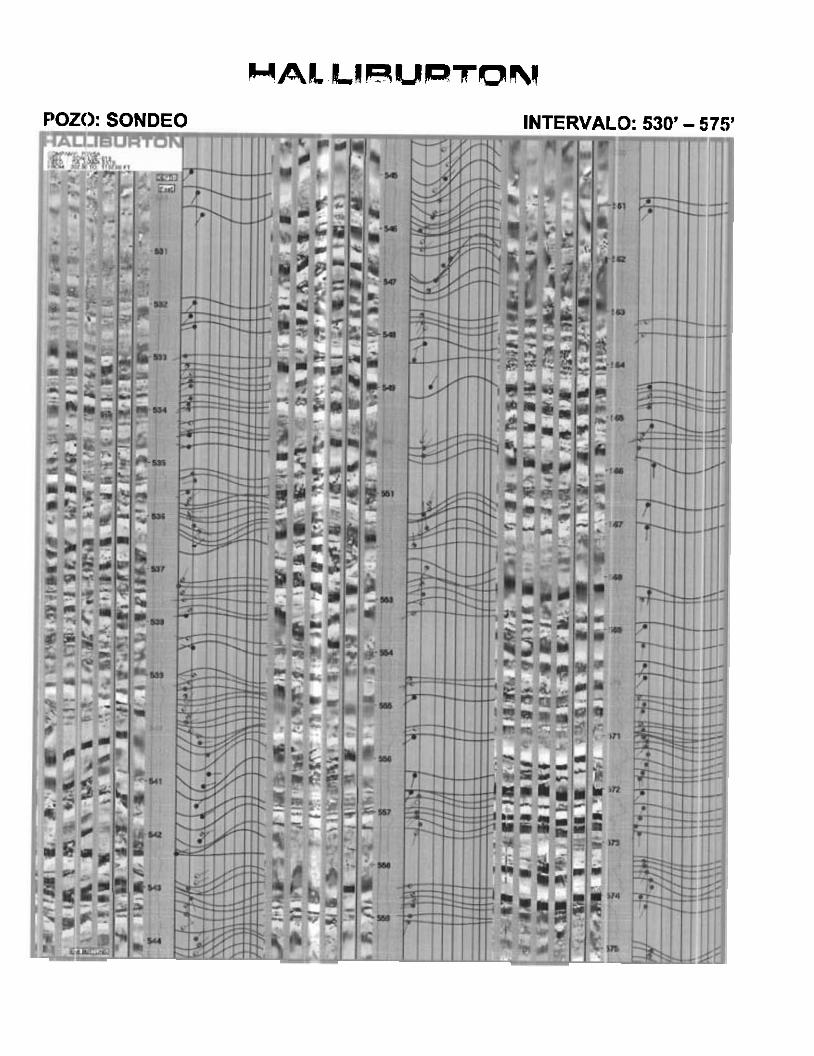
MAL Lamup!.Isouv POZO: SONDEO INTERVALO: 530' - 575'


'A - - .-L m M e,: .

i i F d o.: 8 .
r ..p:*,- ...>. : - - . . . . . 2 , - .. . . . . . * **,>"*.>.p:.~-&.<,. > _,.. -._. .-M .g& - ,..... t i ; - . - - . i 4 , 2 . ' : '"5. ;%
2 . t;' o f . *.;,ar, .r i; ' (2 :n : - ,pv;... ,-,irz:i ., .;#..%; ,.+.; . . . ..;.%s.. f , , ~ : t .B Q R..\ \
- \ \
r. m c3 E h
LO h - h 7
h 7 -

O 'liC F'-á( ax:: 5.' z . *.pu y L.. ..-:,. .._ 1 . *--:a r~' 0 ; t.'+>
ii .S S P: . '; a:.. . : .%=,: , , - , - . t . . .
. : . . , . b - 6 .a:,; ,;.. ar , r , 4- ..-, lJU ,.F..., , ?%G:>> e :t.'+..., - . a-. -4% . . :%E-:: >.:y i= .. ;...i>...Y:.J y, .=,.y2&-:: *z; .2.F,y.<,., s.^^,***,::>.-., , C - X>%? . - -. . - . . . . . .. . - - Y '. ; <h. -.'.:.,..;.~'- - .. - - N f . ; 5 p . : , , . Q ty.;;.. - #i ,: B . ; ,:
7: c .* ,. . z,. , ' & S .. .<-A .. ,
0 e.. . .a::*--= . , * - . - , , . . ' .*-. . Q ,:-.. -

M A L LRR~JRT~~\!
2 , i , 8 a b t .. , , S S : , q i . . m , m - . . t - , . . h. . - m . . a J , u t i , , .. .a,, u ,,,. > . q# * k ' .&'Y --.--C .B. . *N'" (, 1 t..*,. 1 T . ' . ' ' ,
e I , id ~ \ ~ ~ ~ y l ; . / : ; , ~ , t ~ : ; l : . ' . . : ! l ! \ l i~~~. ' k : \ ;m! 2 11 : R . i Lil!i!NHP'.! I R'tI WC \ W .. l- q-- .? ; ,(y i , ; . , r f.,^ Jj;, v<J 6:- w! !$!l!fl7'& /fbd: %fllr k!k!tmk', 11 a! fl-: 'p',wyf /?! ).fimui J , ~ ~ ~ & ) ' u r # ;.al .;N
z - ! J E . 1 F,A' Mmfi { #'f .;
r 7 3
)d
1
1 F
f ' z m
Z m
'O m E E Bi E -a: I
4 : K .n k a ,, r{i;~a L.:( " F . ~ ~ , 8
- - ".W . '
, . '!; :y:. ~ , & ; ,,~-. .:3<;:: . .., - . . . . . I P ~ , i : :~!: CI j r \~af .~+.%~e! . ; K Y. E;
: : -JL; .~ .&vP. lu f&. . '~F ..Ha-&# I,. . .21-..C,-il, . . .r - s d c ; . : . , - . - .. ,: .. . . . . i . .rr; ...A di..a..ii,tz.. .~+!.b'g - &*. .
MAL LIRIJRTON

H A L LARUP=!TON

. . ' i 9 . . r . i r . n r i . - , k , , i ! ' . r 8 , ' : . i r . .. d !m m.m. ',I W, I !u i~ .+.,;i) L.? ;IPT.<: ai Y I : . ~ \ , \ L . ~ ;, ,i ::%? :.,m,: l ! i y :.q,;'l;.:?ii }¡ \f., IW,, ' b ; '!; .q;B\ # -- 't. M i W m: ,a!! 1 flm ':ID iVlJsL'Z FJ $11 ffi1tl'S:;d ~-
,a; t . :~: ' m::' 1 I - ?j , ,+i e:;K'l;: l . : I T ~ . j, ., ?$a~ . . . " ' , " ,. m LQ. 4. R., u, 11'1; n ! - ... -.- :,n8 1.i .fDiF H1 MI :illil <:t t
' " " E" ' . ' ' .ri. - - 7 , g, ,: 3. . .. ,.
APENDICE B
ARTICULOS CIEN'TIFICOS PUBLICADOS, RELACIONADOS CON L.A INVESTIGACION.

SPWLATWENTY.FIRCT A N N U A L LOGGING SYMPOSIUM. JULJ' 8-11. l
THEORY. INTERPRETATION AND PRACTICAL APPLICATICNS OF NATURAL GAMMA RAY SPECTROSCOPY
O. S e r r a Schlumberger Technical Services. Paria, France
J. Baldwin e n d J. Quirein Schlumberger Well Services, Houston, Texas
ABSTRACT
The Natural Gamma Ray Spectromelry Tool (NGS)' detccts naturally occumng gamma rays of various energies emitted from a formation. Amounts and types of elements present iire determined tiy how the formation was deposited and what has happened lo it since. deposition. Thorium, uranium. ar,d potasnium (Th. U. K) are primarily responsible for the energy spectrum observed by the tml. Ttie individual contributions of the three elements in relatim lo the total formation weighl are dculat td fmm the energy spectra. Elemental concentrations thus calculated have showmi correlalion :o depositional environment. neomorphic and diagenetic processes. clay lype, and clay vclume.
A sophisticated data-processing approach, b d upon the prindples of na:ural gamma niy spectrometry and stalistical estlmation theory, has been implemented lo improve th i precision of tlie measured variables. A further reduction of the Th. U, and K statistical error is obtai ied al the wellsile by ulilizaiion of a real-time filtering algorithm implemented with the CSU* system. ihus, mosl of tlie statisticni error issociated with (he natural radioactivity measuremenls is removed p3or lo performiiig the interpretation.
An initial inlerpretation can be made al the wellsite aner logging and filiering. The NGS log is analyzed lo define the nature and quantity of the most probable radioactive materials present in tlie formation. In particular, this is shown lo yield an improved shale indicator. and a b:tter estirnation of :he clay percentage at the wellsite.
In complex lithologies, the exact nalurc of the mixturc of radioactive minorals may no1 be immediaiely dixernible. Hypolheses mnoerning the t y p s and volumes of the radioa,:tive minerals may be advanced and investigated al the Computing Center by combining the NOS los .vith other logs lor quanlitaiive interpretation and better liihologic descnption.
Additional applications of the NGS measurements include analysis of log data for wrrelations, facies identification, reconstruction of the environment of deposition. resernoir delineation. and as supponive information for the identification of igneous rocks as well as the determination o.' permcsbility and pmducibility.
In summary, the potential of extracting more informalion about the nature oí the formation and resewoir. through the principies of natural gamma ray spectrometry, has been realized Mth the implemenlalion of the NOS log.
SiWL,\TWENTY-FIRST ANNUAL LOGGINGSYMPOSIUM, lULY 8-11.1980
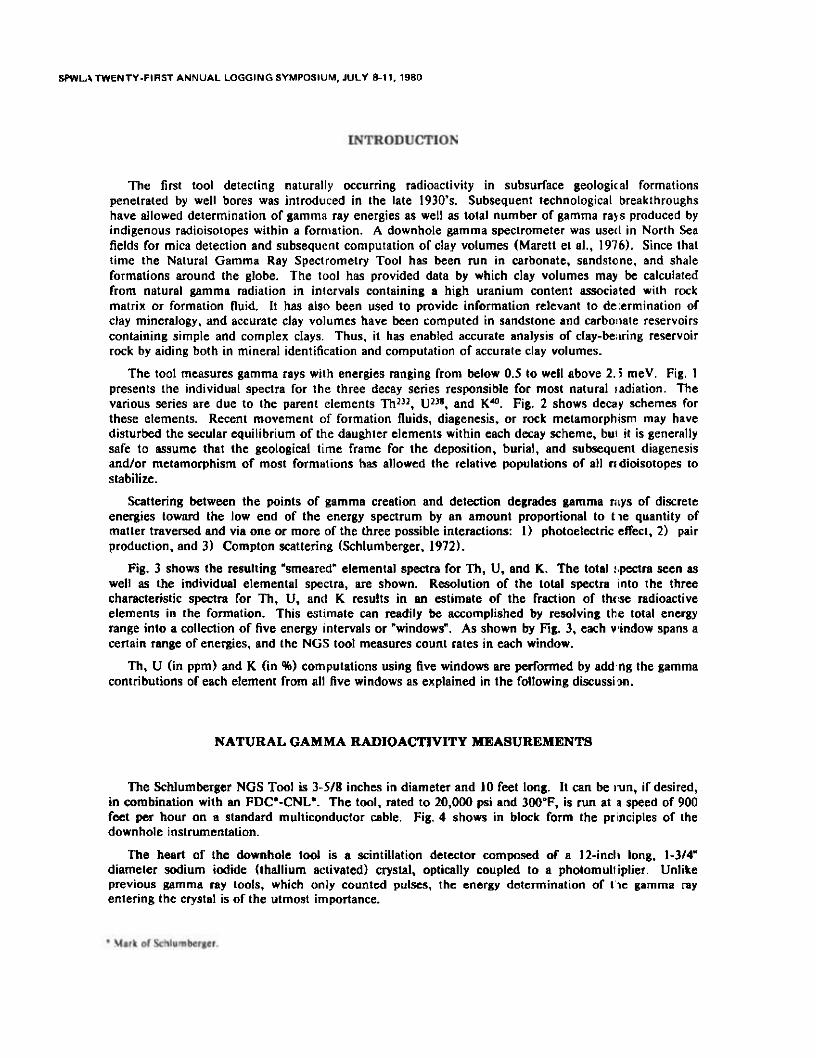
The fint tool detecting naturally wcurring radioactivity in subsuríace gwlogical formations penetrated by well bores was introduced in the late 1930's. Subsequeni technological breakthroughs have allowed determination o l gamma ray energies as well as total number of gamma rays produced by indigenous radioisotopes within a formation. A downhole gamma speclrometer was use11 in North Sea fields for mica detection and subsequent computation of clay volumes (Marett e l al., 1976). Since that time the Natural Gamma Ray Spectrometry Tool has been run in carbonate. sandstone, and shale formations around the globe. The tool has provided data by which clay volumes may be calculated from natural gamma radiation i n intervals containing a high uranium content associated with rock matrix or formation iiuid. I t has also been used l o provide inforrnation relevan1 to de:ermination of clay mineralogy. and accurate clay volumes have been computed in sandstone and carboiiate reservoirs containing simple and complex clays. Thus. it has enabled accurate analysis of clay-be:uing reservoir rock by aiding both in mineral identification and computation of accurate clay volumes.
The tool measures gamma rays with energies ranging from below 0.5 to well above 2.5 meV. Fig. 1 presenis the individual spectra for the three decay series responsible for most natural radiation. The various series are due to the paren1 elements Th"', U>". and KM. Fig. 2 shows decay schemes for these elements. Recent movement of formation íluids. diagenesis, or r w k metamorphism may have disturbed the secular equilibrium o f the daughter elements within each decay rheme, bu! it is generally safe to assumc that the geological time frame for the deposition. burial, and subsequent diagenesis andlor metamorphism o f most formations has allowed (he relative populations of al1 ndioisotopes l o stabilize.
Scattenng between the points of gamme creation and detecüon degrades gamma rriys of discrete energies townrd the low end of the energy spectrum by an amount proporlional l o t i e quantity of matter traversed and via one or more of the lhree possible interactions: 1) photoelectnc efíeci, 2) pair production. and 3) Compton scattering (Schlumberger. 1972).
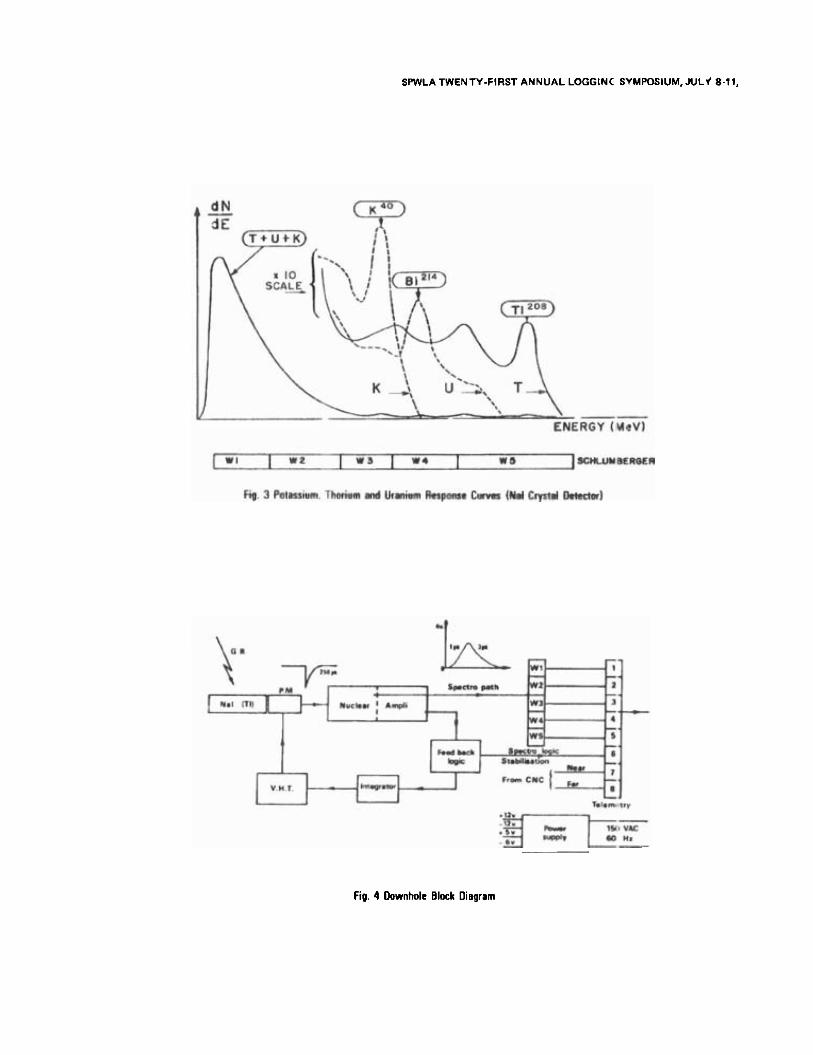
Fig. 3 shows the resulting "smeared' elemental speetra for Th, U, and K. The total :.pecIra seen as well as the individual elemental spectra, are shown. Resolution o f the total spectra into the three characteristic spectra for Th, U, and K resulls in an estimate o f the frsction of thrsc radioactive elements in the formation. This estimate can readily be accomplished by resolving the total energy range into a collection o f five energy intervals or "windows". As shown by Fig. 3, cach vindow spans a ceriain range of energies. and the NGS tool measures count rates in each window.
Th, U (in ppm) and K (in %) computations using five windows are períormed by add-ng the gamma contributions of each element from al1 Rve windows as explained in the following discussim.
NATURAL GAMMA RADIOACTIVITY MEASUREMENTS
The Schlumberger NGS T w l is 3-518 inches in diameter and 10 feei long. I t can be lun, if desired, in wmbination with an FDC0-CNL*. The twl, rated to 20,000 psi and 300°F. is run at a speed of 900 feet pcr hour on a standard multiconduclor cable. Fig. 4 shows in block form the principies of the downhole instrumentation.
The heart of the domhole t d is a scintillation detector composed of a 12-incli long. 1-314" diameter sodium iodide (thallium activated) crystal. optically coupled l o a photomuliiplier. Unlike previous gamma ray tools, which only counted pulses. the energy determination of t ' i e gamrna rsy entering the crystal is of the ulmost importante.

SPWLATWENTV.FIRST ANNUAL LOGGINCi SVMPOSIUM, JULV Ell.
A l the surface. the transmitled information is decoded and made available "ar further digi'al processing i n the CSU mode. The data are depth averaged and a further reductioi in the statisti~:al noise is achieved using the filtering technique described in the next sedion. The standard gamma rzy, GR. along with the filtered Th, U, K and a "uranium free' gamma ray rneasurement, SRS. are availat~le for playback a l the wellsite with the CSU system.
The calibration coefficients represent a single borehole eonfiguration: 8-inch diameter, water-fillcd borehole. Departure curves will soon be available for mrrecting NGS log data for borehole conditions other than calibration conditions. Corrected data may then be used in quantitative lo3 analysis methods such as SARABAND: The quality of ihe log can be verified statistically by com[#aring the window wuni rates obtained by the tool with "rewnstructed" window count rates obtained through substituting the corrected Th, U. and K measurements in Eq. 1.
THORIUM. URANIUM AND POTASSIUM DETERMINATION
Fstimating ihe quantities of thorium, uranium and potassium is accomplishe.i by applying the weighted least squares method. The following linear relatíonship holds:
whuc ri 9 a fsior rcpraenting the ststistieai error saociated wiih the eount rates a m i Wi is the m i n t rate from window i. The coefficients Ai. Bi and Ci are !he calibration coefficierts (for window i ) obtained using a special test calibration pit. The unknown amounts of Th, U, and K are then estirnai:ed by using the matrix relationship.
when 0 is the v m r of Th. U and K, M is the matrix of the estimalion eocfficients rind W is the vector o f five-window munt rates.
The solution is presently obtained for the five-window tool configuration depicied by Fig. 4. I h i s represents a subslantial improvement over an approach which uses just the winilows al the higher energy levels (w,:w,,w5), shown by Fig. 5. The standard deviation of the statisticil noise for Th. U, and K i s reduced by about 1.5 to 2 when utilizing al1 five windows for the soluti~)n in preferenw. to three higher energy windows.
Upon determination of Th, U. and K by application o í the weighted leasi squarci solution. the total gamma ray response can then be found by linear combination:
where A, B. and C are the sums of the dibration coefficients A;, 8. and Ci, .espectively, GF: is expressed in API units or cps, Th and U are expressed in ppm, K is expressed in %. Note thai, if desired. a "uranium free" gamma ray measurernent, GRS, can be obtained i n munts per second as
Mnik d l r h l u n i b c ~ r .
SPWLATWENTV-FIRST ANNUAL LOGGING SVMPOSIUM, JULV 8-11.1980
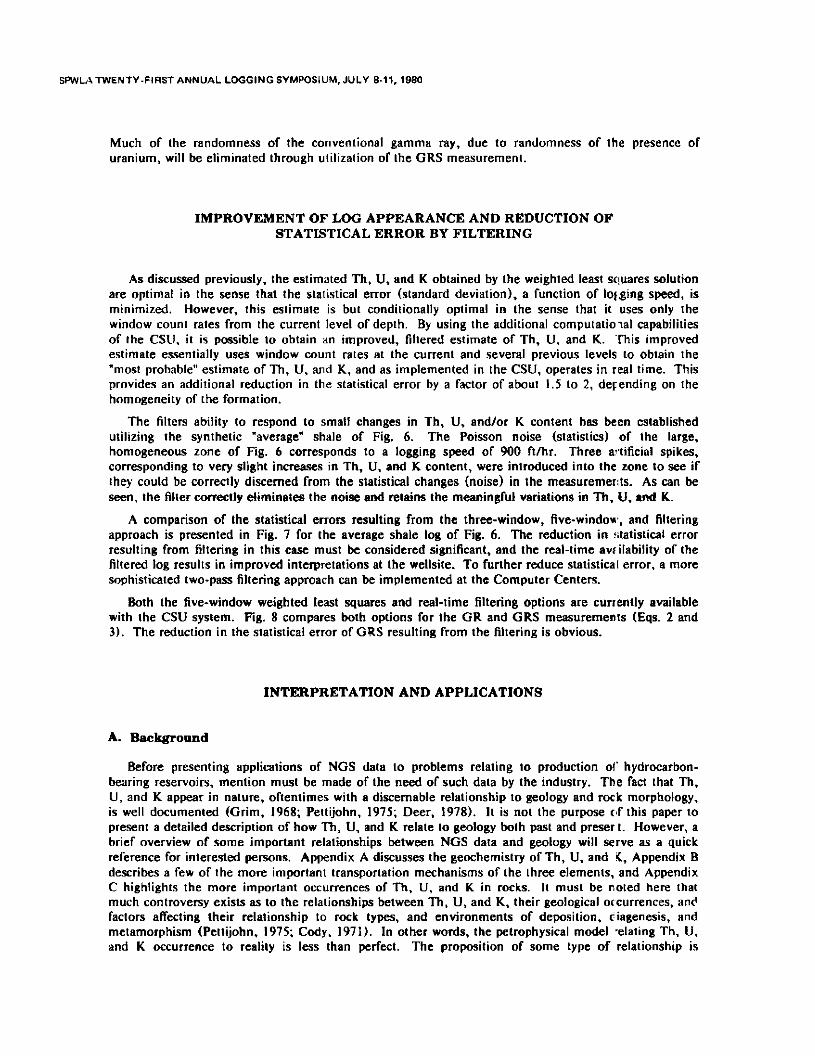
Much of the randomness of the conventional gamma ray, due l o randomness o í the presence of uranium, will be eliminated through utilization of the GRS measurement.
IMPROVEMENT OF LOG APPEARANCE AND REDUCTION OF STATISTICAL ERROR BY FILTERING
As discussed previously, the estimated Th, U, and K obtained by the weighted least sc!uares solution are optimal in the sense that the statistical error (standard deviation), a function of lof,ging speed, is minimized. However, this estimate is but wnditionally optimal i n the sense that ir uses only the window count rates from the current level of depth. By using the additional compulatioial capabilities of the CSLI, i t is posible l o obtain an improved, filtered estimate of Th, U, and K. 'rhis improved estimate essentially uses window count rates at the current and several previous levels to obtain the "most probable" estimate of Th, U, and K, and as implemented in the CSU. operates in real time. This prnvides an additional reduction in the statistical error by a factor of about 1.5 to 2, depending on the homogeneiiy of the formation.
The filters ability l o respond l o small changes in Th, U, andlor K content hes been eslablished utilizing the synthetic 'average" shale of Fig. 6. The Poisson noise (statistics) of the large, homogeneous zone of Fig. 6 corresponds lo a logging speed of 900 ftlhr. Three aq.tificinl spikes, corresponding to very slight increases in Th, U. and K content, were introduced into the zone to see if they could be correctly discerned from the siatistical changes (noise) i n Ihe measuremerits. As can be seen. the filler conestly eliminates the noise and retains the meaningful variations in Th, U, ind K.
A comparison of the statistical erron resulting from the three-window. five-windou,. and filtering approach i s presented in Fig. 7 for the average shale log of Fig. 6. The reduction i n !;latistical error resulting from filtering i n this case must be considered significant. and the real-time avsilability of the filtered log results in irnprovtd interpretations al the wellsite. To further reduce statistical error, a more sophisticated two-pass filtering approach can be implemented at the Computer Centen.
60th the five-window weighted least squares and real-time filtering options are currently available with the CSU system. Fig. 8 compares both options for the GR and GRS measurements (Eqs. 2 and 3) . The reduction in the statistical error of GRS resulting from the filtering is obvious.
INTERPRETATION AND APPLICATIONS
A. Background
Before presenting applications of NOS data l o problems relating to production 01' hydrocarbon- baring reservoirs, mention must be made of the need of such data by the industry. The fact that Th, U, and K appear in nalure, oftentimes with a discemable relationship to geology and rock morphology, is well documental (Grim. 1968; Pettijohn. 1975; Deer. 1978). I t is not the purpose crf this paper to present a detailed dexription of how Th, U, and K relate lo gwlogy both past and preser l. However. a brief overnew o f some important relationships between NGS data and gwlogy will serve as a quick reference for interested persons. Appendix A discusses the geochemistry of Th, U, and C, Appendix B describes a few of the more important transportation mechanisms of the three elements. and Appendix C highlights the more important occurrences of Th. U, and K in rocks. 11 must be noted here ihar much controversy exists as to the relationships between Th, U, and K, their geological orcurrences. and factors affecting their relationship lo rock types, and environments of deposition, ciasenesis. and metamorphism (Pettijohn, 1975; Cody. 1971). I n other words. the petrophysical model zlating Th. U. nnd K occurrence to realiiy is less than perfect. The proposition of some lype o f relationship is

SPWLA TWENN-FIRST A N N U A L LOGGlNri SYMPOSIUM. JULY 8-91,
necessary. but may give rise to erroneous interpretations un l e s viewed with p rop r care. A similar statement was made by Keys (Keys. 1976) wnceming the fundamental measuremeiit principles of Ibis lagging devices.
The following lhree seclions will deal wilh applications, interpretations, ind examples of interpretation based upon experience and Ihe data in Appendices A, B. and C.
B. Applications
Applicatims d NGS data stretch fmm exploration to production, and from fast wellsite answers lo more wmplex interpretations made at mmputing centers. The NGS rnay also fir:d use in definilg correcti6ns lo such basic 1001 response as resistivity and macroscopic fonnation calkture cross-secti'ln (sigma) for the wide range of clays encountered in logging.
One obvious wellsite application obtained from Th, U, and K data is the subtnction of uraniuin, which usually k a n very little relaiion lo the clay volume, from the gamma ray CUN.:. This provide!; a better shale indicator in dolomites than a standard gamma ray curve and can be used for the Schlumberger CYBERLOOK wellsite wmpulation. Uranium salts contained in ronnate water can precipitate onto formation matrix when fluid moves through permeable porosity. Therefore. the uranium curve is sometimes a useful "moved íluid' indicator for in-field wells drilled into previou:ily produced formations. Permeable streaks within produciive intervals may have higher uranium sal1 wntent than surrounding less permeable intewals. Well-to-well comlations can easily be made whtire io-field Th and K markers exist, or over vas1 areas where, in the geological past, vi~lcanic activily t~as laid beds of bcntonitic material with characteristic Th and K mntents. Wellsit: idenlification of lithology. bed boundary, and sometimes even identification of source rock is greatly cnhanced. Finally. quick-lwt intnprrtaiion tahmques can tum rm NOS dnta into uscful geophy i i l quantities m indicators at the well.
Large-seale eomputer interpreíations ushg wmbinations of NGS logs and othsr 108s. m, snd production dala can provide mntinuous information over logged inlewals hitherto available only al great expense over very short intewais from X-ray diffraction and scanning elwtron miaoswpy investigation. NGS dala can also be used in advanced interpretation such as SARABANI)., CORIBAND*, Cosed R e s e ~ o i r Anaiysis, and (CRA'). lo provide aceurale clay and shale voluine analysis. The ability of petroleum geologists and petrophysicists to~roper ly identify facies in earbonite and sandstone reservoirs has thus been greatly enhanced.
Table 1 shows average surface area.per unit volume of matter for various formalion substancw. in many wells Th and K data from thc NGS log can be rclated lo clay type and therefor available surfire area within lormation porosity, which can affecl such logging device responses as rcsistivity and sigaa from the TDT' and rnay also affect the ability of the formation <o produce fluids. TI us, the log may be able lo provide insight into rcservoir producibility as well as suggest zoning change! for resistivily snd sigma dev im. The Duai Water Model (Clavier et al., 1977) fin& use for clay type and volume anaijsis from the NGS log and other data in the determination of bulk bound water. Some vfork has becn dcsnc in anempting to relate Th and K lo CEC and Q, (Frost et al.. 1979). bu1 results are ;E yet inconclusive. The relationship between Th, K, and CEC cannot be assumed lo be simplistic. and additional log drta, such as analysis of the arnounts o i various elements within a formation from Schlrmberger's Gamma Ray Spcctrometry Tool (GST),. may provide information necessary lo unlockir g the rclations~ip between radioactive ions and clay crystals in downhole configurations (Cody. 1971).
Fig. 9 is a section d a NGS 1% run in a Pennian Basin carbonate reservir. Since the Th measurement corresponds lo clay volume (Hassan et al., 1976) much better than cither U or K, il is evident from the log that the highest gamma ray readings are due to high concentrations of u r an im (see Appendix A, section 3) and no1 to shale streaks. Thus, the NGS provides 2 1 more meaninfful

W L , \ TWENTY-FIRST ANNUAL LOGGING SYMPOSIUM, JULY 8-11.1980
measure of shale volume in uranium rich carbonates (see equation 3) then a standard Gainma Ray 1001.
Fig. 10 shows micmresistivity, uranium, and SP curves obtained in a well in a sandsione reservoir. The high uranium wntent in the permeable stringer from 97 lo 107 feet indicates that only this portion oí the reservoir in this part of the field has experienced an appreciable volume of water m ~vement.
An interesting example of source rock identification is presented in Fig. 11. The high uranium level from 40 lo 75 feet wrresponds to uranium conlained in organic material (see Appendix B). Fig. 12 also shows an indication of source rack from 26 lo 58 and 92 lo 138 feet with a changr: either in the type or amount of organic material. as indifated by the increase in K from 28 lo 34 feet. Thorium provides an accurate representation of the volume of shale present in this shaly inlerval.
Fig. 13 shows a 300 foot intewal in which the NGS log correctly identified three depmitional environments. FDC/CNL data are presenled in track 1; Th, U, and K in tracks II and 111. The first interval, from 50 to 130 feet. is nch in illite clay, indicative of calm, deep marine deposit on (Pettijahn, 1975). Kaolinite is the predominan1 clay f r m 140 lo 216 feet, which suggests depmit on in a much higher energy environment. Once again, an illitic clay is the major mnstituenl of the int,:rval from 216 lo 300 feet. suggesting that on-lapping of the shoreline has taken place in this 300 f w t stction. Fig. 16 shows a wmputation of clay volumes through this interval and will be discussed later.
1. "Quick Look' Interpretations
This type of interpretation CM be made d i m l y al the welisile using the data-processing capabililies provided by the CSU system. By using each d the measurements. individually or in linear eombinarion, m shale indicatora, it is paPPible to deduce previously unavailsble informalion reiating lo the type and volume of shale or clay. 01 wurse. where available, other logs or ancillary information may be used in the seleclion of the 'shale" point. For uich of Th, U. K and GR valles obtained, a shale percentage can be estimated by using the following equations:
U-U- GR- GR,i,, (Vsdu - (V*)GR -
U* - Umin Gb-GRmim (4)
The unknown parameten nih. Ulh. &,. GR.h can be estimated from the availa~le 106s. The parameten Th,i., Km¡., U.i., and GR,m u e generally n e u zero or can be defined frcm the zone d least radiosctivity.
Uranium, since it is associated with ndloactive minersls other than those found in shale (¡.e., organic materials), is generally not a reliable shale indicator. By climinating the uranium wntribution from the total eamma ray response and defining the measurement GRS (Eq. 3). a fifth shale indicator can be defined as follows:
GRS - GRS,,, . ( V * ) ~ ~ s - GRS,,, - GRS,. (5)
with GRSh and GRSd. being defined from logs.
It is dear then that (V*),,. (V,),, or (V.,,),, wili scwe botter shale indicators thin (V.h)Gl and (Vlh)U sin= the wneral random smciatki ty of uranium with ahale haa bcen eliminated. In addition. for example. in the pnscnce of mica or feldspars. the indicator (Va), is prefi:rred as a shalc indicator since the amount of mica or feldspars generally need no1 wnelate with the vol1 me of shale.
SPWLA TWENTV.FIRST ANNUAL LOGGINCi SVMPOSIUM. JULV 8-11, '
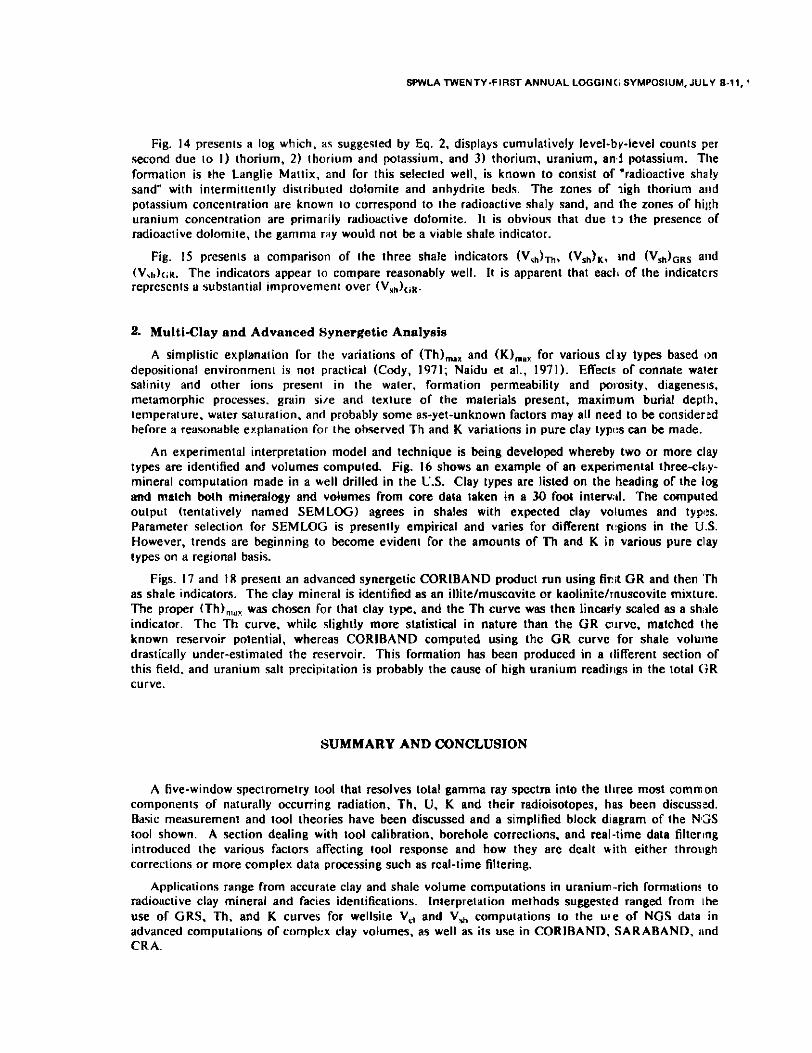
Fig. 14 presents a log which. as suggested by Eq. 2. displays cumulatively level-by-level counts per second due to 1) thorium. 2) thorium and potassium, and 3) thorium, uranium, an.i potassium. Tlie formation is +he Langlie Mattix. and for this selected well. is known to consist of 'radioactive shaly sand" with intermittently distributed dolomite and anhydrite beds. The zones of ligh thorium aiid potassium concentration are known io correspand to ihe radioactive shaly sand. and the zona of hil:h uranium conceniration are primarily radioactive dolomite. I t is obvious thai due t > the presence o l radioactive dolomile. the ganinia ray would not be a viable shale indicator.
F . 15 presents a comparison of ihe three shale indicators (V,,),, (V,,),, ind (VSh)oRs aiid (V,~)C;K. The indicaton appear to compare reasonably well. I t i s apparent that eacli of the indicatcn reprcscnts a substantial improvement over (V,,),,,.
2. Mult i-Clay and Advanced Synergetic Analysis
A simplistic explanation for the variations of (Th),., and (K),,, for various cliy types based on depositional environmeni i s no1 practica1 (Cody, 1971; Naidu et al., 1971). Eífects of connate water salinity and other ions present in the water. formation permeability and pomsity, diagenesis, metamorphic procases. grain sile and texture of the materials present, maximum burial depth, temperature. water saturation. and probably some as-yel-unknown factors may al1 need to be considerid berore a reasonablc explanation for the observed Th and K variations in pure clay typta can be made.
An experimental interpretation model and technique is being developed whereby two or more clay types are identified and volumes computed. Fig. 16 shows an example o f an experimental three-clí,y- mineral computation made in a well drilled in the C.S. Clay types are listed on the heading of the los and match boih mineralogy aand volumes from core data taken in a 30 foot intew:il. The computed output (tentatively named SEMLOG) agrees in shales with expected clay volumes and typ~s. Parameter selection for SEMLOG is presently empirical and varies for diíferent r~!gions in the U.S. However, trends are beginning to become evident for the amounts of Th and K in various pure clay types on a regional basis.
Figs. 17 and I R present an advanced synergetic CORIBAND product run using ficil GR and then 'Th as shale indicators. The clay mineral is identified as an illitelmuscovite or kaolinitelrnuscovite mixture. The proper (Th).,.. was chosen for that clay type. and the Th curve was then lincarly scaled as a shiile indicator. The Th curve. while slightly more statistical i n nature than the UR nirvc, matched the known reservnir polential. whereas CORIBAND computed using the GR curve for shale voluine drastically under-estimated the reservoir. This formation has been produccd in a ilifferent section of this field. and uranium salt precipitation i s probably the cause of high uranium readirigs in the total (;R curve.
SUMMARY A N D CONCLUSION
A five-window spectrometry tool that resolves total gamma ray spectrs into the tliree most common components of naturally occurring radiation, Th, U, K and their radioisotopcs, has been discussxl. bs i c measurement and tool theories have been discussed and a simplified block diagram of the NfBS tool shown. A section dealing with tod calibration. borehde corrections, and real-time data filtering introduccd the various factors afecting lool response and how they arc dealt with either Ihroiigh corrections or more complex data processing such as rcal-time filtering.
Applications range irom accurate clay and shale volume computations in uranium-rich formations to radioactive clay mineral and facies identifications. lnterprelation methods suggested ranged from ihe use of GRS. m, and K curves for wellsiie V,, and V, computations to the u!e of NGS data in advanced computations of complex clay volumes. as well as i ts use in CORIRAND, SARARAND, iind CRA.

SPWLI! TWENTY.FIRST ANNUAL LOGGING SVMPOSIUM. JULY 8-11.1880
Referente has been made l o the need for proper clay mineral idenlification and volume determinalion in today's petroleurn industry. The use of NGS data will in ihe future, prcbably provide support for more accurate determinations of permeability, producibility. nnd water saturation in wells that are increasingly marginal eeonomically than has been previously possible.
The authors wish to thank al1 of the oil companies who released the log examples shi)wn here, and Schlumberger, who authorized publication of this material. Recognition is given lo G. Ruckebusch, who conceived and implemented the solulion l o the real-time filtering problem, and to 1.. Karbart, for his developnenl of an approach for the staistical grouping of log data.
APPENDIX A
GEOCHEMISTRY OF THE ELEMENT
The constituents (radioactive or not) of a sedimentary fonnation are derived primarily from the alteration of ignwus rocks. The radioactive elements are liberated and dispened and inay be loeally concentrated during sedimentary cycles and diagenesis.
The study of the geochemistry of those elements i s fundamental for the comprehcnsion of their occrirrence in sedimentary or igneous rocks.
1. Osochemidry of Potisaium
There are three natural isotopes of potassium: 39K. @K and "K. Their respective proporiions on the Earth are 93.10%. 0.01990h and 6.88%. aK is the only radioactive isotope. Potassium emits gamma rays at a single energy of 1.46 MeV. Tbe ratio *K/Total K is very stable aiid constant on the Earth. The same valuc has been observed for meteoriles, meaning that they are probably of the same origin as the elements the Farth is made of. Since the ratio '@K/Total K is constanl. determination o f wK content provides a direct indication o f the total arnount of ~wtassium in a formation.
The concentration of potassium in th Earth's cmst (10 miles thick) is 2.59% The original sources. or parent rocks, of potassium are chiefly the silicic igneous rocks (granitc. granodiorite. syenite. rhyolite: Table 2). in which i t is present through potassium feldspals (orthoclase. microcline). micas (muscovite. biotite). and a nurnber of other minerals of second.¡ry importante (Tabie 3) .
The average K f l concentration oí igneous rocks is equal l o 3.13. compared lo 2.87 for sediments.
During the alteration process, feldspars and micas are largely destroyed, depending upon the degree of weathering. to give clay minerals: illite. intentratified illite montmorillonite. montmorillonite. chlorite, kaolinite. A small part of the total potassium concentration enters into the formntion of some of those rninerals. but the major par1 is disolved by water. In arid repions this large par1 tends to remain with the products oí alteration (rcsiduurn). I n 0th:~ regions it is transported by rivers to Ihe sea.

SPWLATWENTY-FIRST ANNUAL LOGGING SYMPOSIUM, WL"I 8.11.1
As the depth o f burial of shales increases, iemperaturc. prcssure and ion coiicentration o f ttie formation water also increase. Montmorillonite disappcars progressively b.1 illitizalion arid chloritizaiion, and kaolinite i s progressively destroyed. During those transform~tions lhe amouiit of potassiuni i n ihe clay increases (it is iaken from the potassium ions present i n the water) .as montmorillonite is transformed into ill ite lhrough the intcrsiratificd illite- montm<irillonite stage.
2 Geochemist ry of T h o r i u m
There is only one long-lived ihorium isotope: 2JTh. Other Th isotopes (ZJ'Th and 2 lTh) are found in nature as daughters o f "'U, bu1 they are relatively short-lived and therefore very raie. The average concentration of thorium in the Earth's crust is aboui 12 ppm.
The original sources or parent rocks of thorium are ihc silicic igneous rocks (Table 4), in whii:h ihorium exists as a number o i minerals (Table S). I ts average concentration in igneous rocks is 3.5 to 4 times thai o f uranium, and the Th /U ratio is quite consiant.
Thorium exists only at valence 4+. I t has a very stable degree of oxidation. 411 iis compoun~b are insoluble: its solubility product. expressed as Th(OH),, is close l o During alterarion or weaihering, thorium is easily hydrolyzed and therefore has l imiied mobility and a iendency l o concentraie i n residual minerals, such as bauxite and clay minerals. Significan1 :oncentraiions are also found in heavy minerals, such as monaziie.
ThJ'. owing to its large ionic radius, is likely to be fixed by absorption on clay rniner;ils (between piatelets). The amount probably depends on the p H and on the at~undance of other cations.
Most days scem to coniain thorium. However, some monimorillonites have a low thorium content. The amouni oí' ihorium fixed on clay minerals remains constan1 i r spite o f thenrial diagenesis. I n shale series. this amount usually ranges from 8 to 20 ppm, depcnding on the clay content.
3. Ceochemls t ry of U r a n i u m
There are ihree natural isoiopes o f uranium and al1 are radioactive: 2MU, 21SU. 2J8U. Th:ir respective proportions on the Earth are 0.0057%, 0.72% and 99.27%. I n sea water the nlat ive concentration o f 234U ir higher because "BU ions are selectively fixed on Caco,. The halr-lives o f uranium isotopes are: 2.5 x 10' years for "'U, 7.1 x 10' years for '"U and 4.4 x !O9 years lor n81J.
The average concentralion of uranium i n rhe Earlh's crust is about 3 ppm. The original soun:es or parent rocks are also thc silicic igneous rocks (Table 4) in which uranium exists as a number of accessory minerals (Table 7).
The main geochemical characteristic o f uranium is Ihal i t is easily oxidized into the uranyl ion U02'* by bacteria1 action. This ion is very soluble and uranium is therefore ver, mobile.
Uranium exists under iwo siates o f valence: 4' and 6+:
a. U r a n i i i m Sal ts of Valence 4
Ion U'- is generally insoluble and exists only i n sulfurous hydro- lhem~sl waters (Eh < 0, p l l < 4). If Eh < O and p H < 4, U'+ gives the insoluble uranium oxide 1J02 or uraninite by dissociation. By oxidation. however, U'+ passes easily l o valence 6 as U 0 4 ;- or UZO1 2-.
b. U r a n i a m Salta of V i l e n c e 6
11" does noi exisi in solution but immediately gives a complex uranyl iftn U02 1' . whicli i s relaiively stable under low values o f pH(Eh > O and p H t 2 ) and is very soluble. At low p H (< 2.5) and an excess of sulfates, i t gives sulfate complexa as IUO2(SOJ31 '-.
An i nc res .~ o f ihe pH can induce hydrolysis of ihe uranyl ion and the fo'mation o l

SPWLATWENTY-FIRST ANNUAL LOGGING SYMPOSIUM. JULY 8.11.1980
UIOsN for 2 < PH < 5 , UJ0,2', or more ionic complexes as IU02(OH ilU031 n
A hydrolysis with precipitation o í schoepite for pH = 5 . (4 UOJ. pHz0).
Under neutral conditions the uranyl ion forms various ionic complexes with carbonates:
which are stable for 7.5 < pH < 8.5.
U02'+ co-precipitales with phosphates.
Under reducing conditions (Eh < O). the ion ~ 0 2 " forrns numerous complexes with organic compounds (e.8. with humic acids), which facilitate its fixation by orgar ic and mineral matter. Loealization of uranium in organic shales by the &ion-track tcchniiiue shows this association clearly.
The oxide UOJ is amphoteric:
- with acids i t gives uranyl salts whieh are very soluble.
- with basic oxides il givcs insoluble uraninite.
APPENDIX B
TRANSPORTATION OF ELEMENTS
Owing lo its insolubility, thorium is almast wholly transported in suspension. Thus, i t concentrates in ihe silty fraction of shale as thorium minerals (Table 5) or as tliorium-bearing accessory minerals (Table 6) .
There i s a narrow association between thorium and titanium, and between thorium and aluminum (correlation coefficients respectively 0.93 and 0.91 aner Hassan, et al.).
2. Ranspor ta t ion o f Uran ium
Uranium is transported chiefly in soluiion, owing to the solubility of ihe uraryl ion uoZ2+ (obtained by oxidation of U'+ and U'>+). Some uranium is also transported in suspension as heavy uraniurn-bearing minerals, oras phosphates, or 8s schoepite or uraninire, depending on Eh and pH conditions.
1t is also transported with and fixed by absorption upon clays or transported with organic matter in stable complexes.
a. Precipitat ion ind Conaervation o f Uranium
Uranium can precipitate as:

SPWLATWENTY-FIRST ANNUAL LOGGIN(I SYMWSIUM, JULY 8-11,
Uraninite if Eh < O and p H > 4 Schoepite if Eh > O and 5 < p H < 7.5 Carbonate complexes if Eh > O and 7.5 < p H < 8.5 with excess o f CO> Sulfate complexes if Eh > O and p H < 2.5 Organic complexes if pH < 7 Phosphate complexes
Uranium can also be absorbed by amorphous silica, alum, aluminum silico-aluminates. coal. and lignite. Uranium is fundamentally confined to reducing media and is generr.lly associated with organic material. For that reason i t shows a strong correalion with organic carbon (correlation coeficient o f 0.86 after Hassan, et al.).
b. Diagenesis a n d M i g r a t i o n
Post depositional transfers o f uranium are possible and commcn, depending on physicochemical and biochemical processes. 11 migrates easily during leaching and dissolut on o f carbonates. When sparite (relatively coarse grained calcite cement) fornis, uranium. which cannot enter the calcite crystal laltice, is removed. Uranium can concentrate in stylolites (seams o f irregular shape between calcite blocks. i n which insoluble constitiients like clay, ii'on oxides, etc., concentrale).
Thermal diagenesis o í organic malter. which produces hydrocarbons, (loes no1 affect [he uranium concentration. The uranium remains with the residual organic n~atter and does no1 follow the hydrocarbons produced by thermal cracking of the kerogen.
I n solution the poiassium ion has a very weak ionic polential and can stay i n real solution under a wide range o f pH. Bu1 generally during transportation most potassium is ab!orbed by clays iind extracted from the water by planls.
Thus, only a small part o l the original potassium arrives a l the sui, whch has an average potassium concentralion o f 380 ppm. One fraction o f the potassium is dissolví:d in sea water ;ind extrdcted by organisms like algae. Anoiher par1 reacts with clay minerals (e.%. with kaolinite l o give illite). A t least several potassium minerals can crystallize directly Crom sea-water brine!. l o give potassium evaporites. which represent the maximurn concentrations o f potasiium i n rocks (Table 8).
R A D I O A í X I V E E L E M E N T S IN ROCKS
TuKs and tuKaceous sandstones: Tuf f is a slratified rock composed o f sand-size paríi.:le!; erupted from volanoes and deposited as ash fall, on the land surface or in water. 11 is compased of igneous rock fragments. volcanic glass. cryslals or fragments o f quartz, plagioclase. biotite, and hornblende. There is a complete gradation from t u ñ to detrital sandstone. Intermediate varieties are called ir!flatuoia urr t~ ls io~i~s . Because acidic magmas are l e s fluid than hs;ltic or intermediate magmas, they are more subject to explosive activity, and therefore produce more tuffs. Geneially speaking. tufls are acidic (rhyolitic l o dacite) and consequently have nearly th~: same composiion as granite.
SPWL4TWENTY.FIRST ANNUAL LOGGtNG SYMPOSIUM, JVLY 8-11.1880
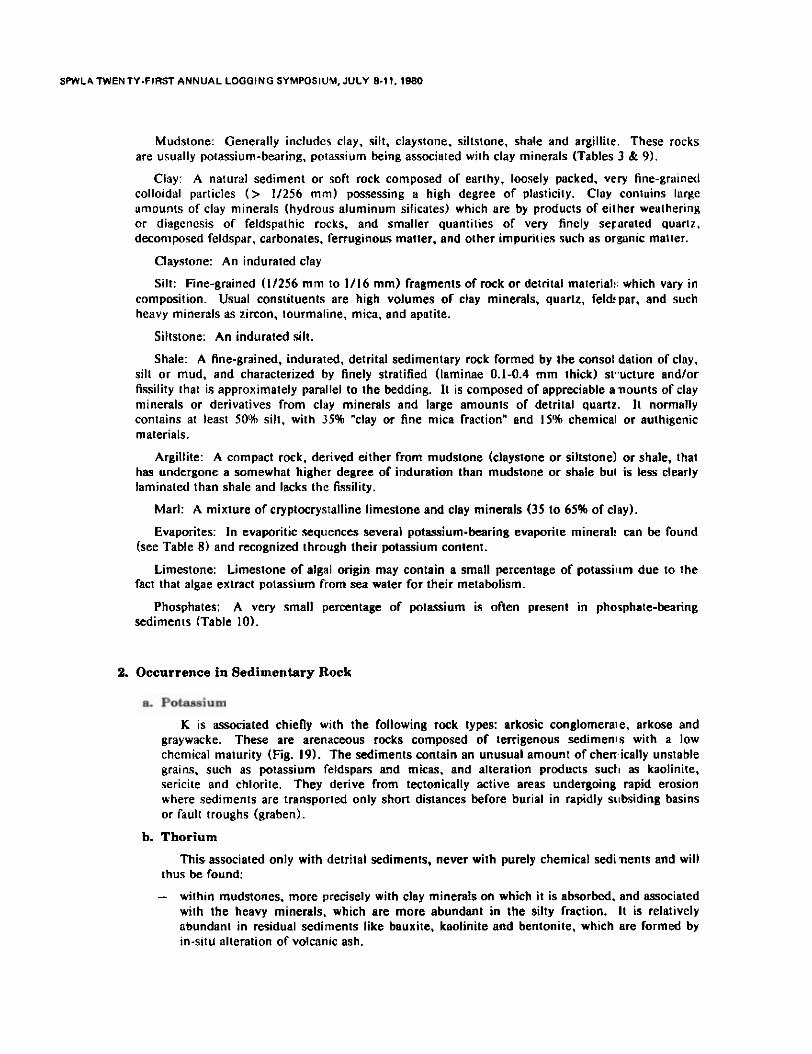
Mudstone: Cenerally includes clay, silt, claystone, siltstone. shale and argilliie. These rocks are usually potassium-bearing, potassium being associated with clay minerals (Tables 3 & 9 ) .
Clay: A natural sediment or sol1 rock composed o f earthy. loosely packed, very fine-grainel colloidal particles (> 11256 mm) possessing a high degree of plasticiiy. Clay contuins lurge amounis o f clay minerals (hydrous aluminum silicates) which are by products o f either weatherin~ or diagenesis o f feldspathic rocks. and smaller quantities o f very finely seraruted quarlz. decomposed feldspar, carbonates, ferruginous matter. and other impurities such as orgunic matter.
Claystone: An indurated clay
Silt: Fine-grained (11256 m m to 1/16 mm) fragments o f rock o r detrital material:. which vary in composition. Usual constituents are high volumes o f clay minerals. quartz, fel&par. and such heavy minerals as zircon, lourmaline. mica, and apatite.
Siltstone: An indurated silt.
Shale: A fine-grained, indurated, detrital sedimentary rock formed by the consol dation o f clay. sil1 or mud. and characterized by finely stratified (laminae 0.14.4 m m thick) st'~ucture andfor fissility that is approximately parallel to the bedding. I t is composed o f appreciable anounts ofclay minerals or derivatives from clay minerals and large amounts o f detrital quariz. I t nonnally contains at least 50% silt, with 35% "clay or fine mica fraction" and 15% chemical or authigenic materials.
Argillite: A compact rock. derived either from mudstone (claystone o r siltstone) or shale, that has undergone a somewhat higher degree o f induration than mudstone or shale bu1 is l e s clearly laminated than shale and lacks the fissility.
Marl: A mixture ofcryptocrystalline limestone and clay minerals (35 l o 65% of clay).
Evaporites: I n evaporitic sequences several potassium-bearing evaporite mineral! can be found (see Table 8) and rccngnized ihrough thcir potassium content.
Limestone: Limestone of algal origin may contain a small percentage o f potassiitm due to the fact thai algae extract potassium rrom sea water for their metabolism.
Phosphates: A very small pemntage o f potassium is often present i n phosphate-bearing sediments (Table 10).
2. Occur rence in Sed imenta ry R o c k
K is associated chiefly with the following rock types: arkosic conglomeraie, arkose and graywacke. These are arenaceous rocks composed o f terrigenous sedimenis with a low cheniical maturity (Fig. 19). The sediments contain an unusual amount o f chen ically unstable grains. such as potassium feldspars and micas, and alteration products suct~ as kaolinite, sericiie and chlorite. They derive from tectonically active areas undergoing rapid erosion where sediments are transported only shon distantes before burial in rapidly siibsiding basins or fauli troughs (graben).
b. Tborium
This associated only with detrital sediments. never with purely chemical sedimenis and wil l thus be found:
- wiihin mudstones. more precisely with clay minerals on which i t is absorbed. and associated with the heavy minerals. which are more abundant i n the silty fraction. I t is relstively abundant in residual sediments l ike bauxite. kaolinite and bentonite. whieh are formed by in-sitii alteration of volcanic ash.

SWLA TWENTY-FIRST ANNUAL LOGGINC SYMPOSIUM. JULY 8.tt.t
- within arkosic conglomerates, arkose and graywacke sandsiones, associ:tted with igneoiis rock fragments.
- wilhin tuffs and tuffaceous sandsiones.
c Uranium
U is associaled with both detrital and chemical sediments, and will thus bi! found:
- within shales. uranium being absorbed (like thorium) by clay minerals. being associat~:d wiih organic matier ífrom sapropelic, algal or humic origin: e.g. bituniinous shales). ,Ir with uranium-bearing heavy minerals.
- within arkosic conglomerata, arkose and graywacke sandstones, asslxiated with ra:k fragmenis.
- wiihin phosphaies.
- wiihin carbonates of confined media, deposited under reducing conditions. especially if th8:y are rich in organic marter (bituminous limestones), or in stydiles.
- within iuiis and luffaceous sandslones.

SPWLATWENTY-FIRCT ANNUAL LOGGtNG SYMPOCIUM. JULY 8-11.1880
GAMüA-RAY EN-- MEV
Fig. 1 Bimma Ray h i n i o n Spsrtra
d Radioactive Malirialr
SPWLATWENTY-FIRST ANNUAL LOGGINC SYMPOSIUM. JULV' 8-11.
Fig. 4 Oownhdr Block Diagrim